Timber-concrete composite beams
Mario van der Linden
Delft University of Technology / TNO Building & Construction Research
In this paper an easy-to-use design model for timber-concrete composite beams is discussed.
The model is applicable for computer simulations as well as for hand calculations. A research
programme was started in 1992 in co-operation with the University of Karlsruhe, to study the load
bearing capacities of timber-concrete composite beams that are subject to bending. This research
programme also included shear tests, creep tests, Monte Carlo simulations on floor systems and short
term tests on a platelike timber-concrete structure, that are not included in this publication.
The load-slip characteristics of three different connector types were determined and thirty bending
tests, ten for each connector type, were carried out on beams constructed with these connectors.
The bending test-specimens failed due to combined bending and tensile failure of the timber, that is
near knots or at a fingerjoint. Depending on the configuration of the beam and behaviour of the
connectors, other phenomena could occur first. These phenomena however never initiated total
collapse of the beam. Although timber beams normally exhibit brittle failure in the tensile zone, the
composite beams showed a plastic behaviour before total collapse occurred. This behaviour was
caused by plasticity of the connectors.
Hardly any plasticity was observed at the 5-percentile characteristic strength values for single T-beams
and systems, when timber representing the Dutch strength class K17 was modelled. An elastic
calculation model thus proves to be correct for most timber-concrete composite beam configurations,
provided that timber beams of ordinary strength classes have been installed.
This observation is no longer valid if gIulam or timber from the highest strength classes is used.
It shifts the characteristic strength values upwards and plasticity of the concrete compression zone or
plasticity of the connectors occurs before the timber beam with characteristic strength collapses.
Keywords: Timber-concrete composites, connector, bending, FEM, plasticity, Monte Carlo, failure,
strength, slip, stiffness
1 Introduction
In the last decade an increasing amount of timber-concrete composite structures has been applied
for the refurbishment of existing timber floors, the introduction of new floor types and as a deck
system for timber bridges throughout Europe. This kind of composite structure offers benefits that
depend on the kind of application. An existing timber floor can remain intact in case of refurbish
ment and is strengthened by adding a concrete slab. The composite system also has a positive
influence on sound insulation and fire safety, apart from structural advantages. Whenever they are
used for a bridge deck, they protect the timber that is positioned underneath the concrete slab from
HERON. Vol. 44. No.3 (1999) ISSN0046-7316
215

216
direct sun and rain, automatically lead to diaphragm action and distribute point loads among the
timber beams.
The effectiveness of a timber-concrete composite structure depends heavily on the characteristics of
the shear-connector type used. No adequate design code however is available, since these
characteristics and the behaviour of the composite beams constructed with them, have not been
thoroughly investigated. Most research carried out so far focuses on a single project, the
characteristics of a single type of connector or on theoretical design proposals that are seldom
verified through full-scale tests.
The first development of a timber-concrete composite system was caused by a shortage of steel for
the reinforcement of concrete after both world wars. Gerber et al (1993) mention a patent of Muller
(1922) in which a system of nails and steel braces form the connection between a concrete slab and
the timber.
Postulka (1983, 1997) makes mention of more than 10,000 m' of timber floors that have been
refurbished with the timber-concrete system in the CSSR since 1960. Nails 6.3 * 180 mm that are
centred 100 mm near the supports and 250 mm at mid span, form the connection between the
timber and the concrete.
Timber-concrete composite bridges that were built in New Zealand since 1970 are described by
Nauta (1984). A 150 mm thick reinforced concrete slab is used where traffic is reasonably heavy.
By using this type of slab in composite construction with glulam beams, the size of the beams can be
reduced by 20 percent.
The first publication that combined the theory and practice of refurbishment of existing timber
floors by adding a concrete slab, was by Godycki et al (1984). Thousand square metres of existing
timber floor were refurbished with this method in Lodz, Poland, in 1981. Most timber beams could
be reused within the composite system. The cost of the timber-concrete composite system was only
half the cost of the alternative refurbishment methods.
The aim of this research was to determine an easy-to-use design model for timber-concrete com
posite beams, that was applicable for computer simulations as well as for hand calculations. At the
start of this research programme most design proposals mentioned in literature were based on the
elastic theory for composite systems, some did not even consider the slip of the joints. Additionally,
the slip moduli that were sometimes derived were based on a few tests and were valid only in a
small range of applications.

2 Bending tests
2.1 Test setup and materials
Three categories
Three timber-concrete composite beam categories were to be tested, each with a different type of
connector. The concrete slab and timber beam were cOlmected by means of:
- screws installed at ± 45°, with an interlayer of 28 mm of particleboard,
- nailplates, bent at an angle of 90°,
- reinforcement bar with a concrete notch
The three series that were tested are illustrated in figure 1.
The bending specimens were to be tested in a four-point bending test as indicated in figure 2. Each
of the three categories consisted of ten bending specimens, so a total of 30 beams was tested up to
failure. The estimated failure mode was rupture of the tensile zone of the timber beam, although
other phenomena would then probably have occurred. These phenomena would nevertheless not
immediately initiate total collapse of the beam.
An extra layer of 28 mm particleboard was placed between the timber and the concrete for the
beams that were assembled with screws. This particleboard simulated flooring, which normally is
present if this system is used for refurbishment purposes. The timber beam depth was set to
172 mm to maintain the same overall depth of the composite beam.
Concrete
The quality of the concrete was C25, but was not an important issue according to some initial
calculations. A rise in quality of CIS up to C35 would hardly influence the behaviour of these
beams. A reinforcement grid of 131 mm2 / m! was used to take care of the cracks that might occur
due to shrinkage of the concrete in the hardening phase. This grid was positioned 30 mm above the
bottom of the concrete slab.
Foil
A polyethylene (PE) foil between the timber and the concrete was used in all specimens to prevent a
bond between those two materials. It also would protect the timber from the moisture that may leak
from the concrete. The foil was removed at the indentations for the category bars and concrete
notches. The nailplates and screws were simply driven through the foil.
Connectors
Shear tests were carried out prior to the bending tests discussed here, to obtain the load-slip charac
teristics of the three connector types (Blass, H.J. et al, 1995). The mean slip modulus K, and the mean
strength are presented in table 1. The results of some additional tests on screws with varying inter
layer thickness are also mentioned.
217

2 __ ",45'
./"
[X<n:&fi1':~urC:P¥9'TItl =:_mm l150 l 200 l 200 l 200 l 200 l 200 J 2110 1
Fig.l. Dimensions of the beams and connector spacing for all bending categories.
Fig. 2. Span and position of the jacks for the three categories with timber beams
218

Table 1. Slip modulus and strength of the connector types.
Connector type Mean slip modulus K, Mean strength F mox Amount of specimens
determined according tested
to DIN EN 26891
(kN/mm) (kN)
Screws (per pair),
sheeting 0 mm 29.2 22.0 20
19mm 12.9 15.3 10
28mm 15.6 15.0 16
Nailplate 48.8 47.9 46
Reinforcement bar and
concrete notch 79.5 51.1 46
The reinforcement bar and concrete notch is the strongest of the three connector types and its slip
modulus is 1.6 times as large as that of the nailplates, 2.7 times as large as that of the screws without
an interlayer. Nevertheless, the screws are much smaller than the other two connector types. If the
strength and slip modulus of the screws is divided through its minimum spacing, thus obtaining
the characteristics of a glue, the 'smeared' screws are as strong and stiff as the 'smeared' reinforce
ment bar and concrete notch.
The load-slip diagrams of the three connector types are shown in figure 3.
z -'" .S lJ... Q)
~ 0
lJ...
Fig. 3.
60
50
40
30
20
10
0
0
.- .. '~ -' ~ "
...... .., ...... .., ..... ., ............ .. // :/~
..... r-
5
"'-\
i
10
Displacement u in mm
---
--
---Screws
---Nailplates
- - - Bars+notches
I 15 20
Load-slip diagram of the connectors with mean load-bearing capacity for the categories screws
(without sheeting), nailplates and bars and notches.
219
220
Timber
Glulam beams were used instead of sawn timber beams because they were stronger and different
failure criteria were to be investigated. These criteria would sometimes arise at higher load levels
which implicated higher tensile stresses in the timber beam. The moisture content appeared to be
between 10 percent and 12 percent. The modulus of elasticity of the timber was set to 0.95 times the
dynamic modulus of elasticity value that was obtained from measurements using natural frequency
caused by longitudinal vibrations (Gorlacher, 1990).
The bending strength of the timber beams could not be determined through the bending tests of the
composite beam, since the exact contribution to the load-bearing capacity of the concrete slab and
connectors was not specified. The only possibility to get more information on the bending strength
was to make use of the modulus of elasticity and density that was measured, because they both
have a relationship to the bending strength. At that time, that relationship was best described for
glulam by the computer model Karemo, developed at the University of Karlsruhe by (Colling, 1990).
The modulus of elastiCity and the simulated bending strength of every timber beam are reported by
(Blass, H.J. et at, 1995).
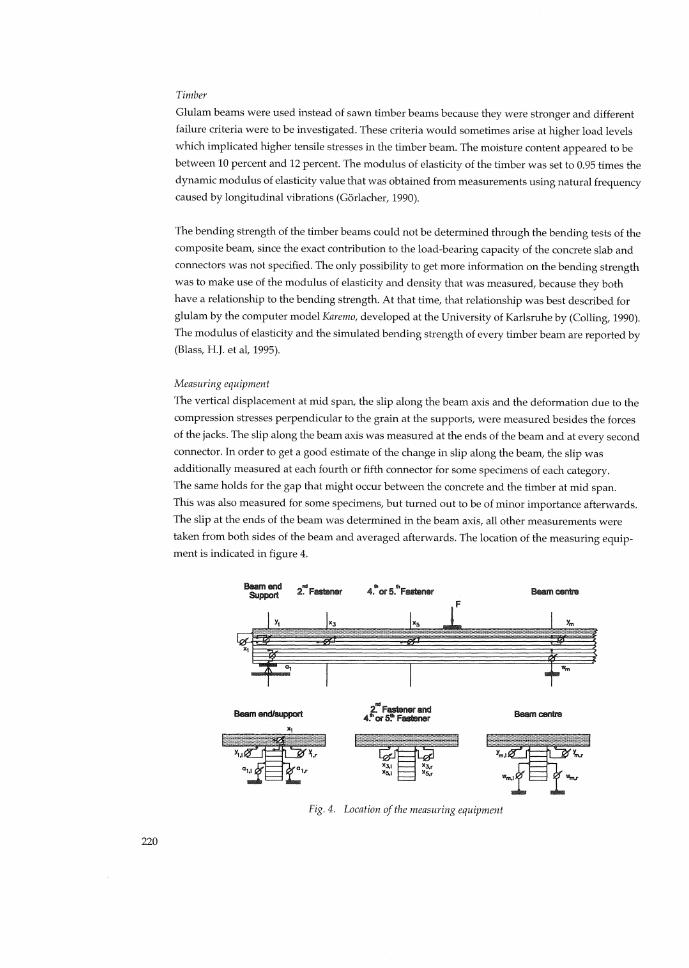
Measuring equipment
The vertical displacement at mid span, the slip along the beam axis and the deformation due to the
compression stresses perpendicular to the grain at the supports, were measured besides the forces
of the jacks. The slip along the beam axis was measured at the ends of the beam and at every second
connector. In order to get a good estimate of the change in slip along the beam, the slip was
additionally measured at each fourth or fifth connector for some specimens of each category.
The same holds for the gap that might occur between the concrete and the timber at mid span.
This was also measured for some specimens, but turned out to be of minor importance afterwards.
The slip at the ends of the beam was determined in the beam axis, all other measurements were
taken from both sides of the beam and averaged afterwards. The location of the measuring equip
ment is indicated in figure 4.
Beam end/support 2':' Fas!l!Iner and 4." or 5~ Famaner
Fig. 4. Location of the measuring equipment

Test procedure
A highest load Fe~t was estimated for every category by calculation, and the specimens were initially
loaded to 0.4 times F"t. After 30 s at this level the load was reduced to 0.1 Feet. Again it was held for
30 s and then increased until the test specimen failed. The displacement ratio was constantly
5.0 mm/min or 6.0 mm/min depending on the category tested, and led to a bending test that lasted
between 20 and 30 minutes. The force and displacements were automatically recorded every
10 seconds. The climate of the laboratory was according to (DIN 50014 - 20/65): a temperature of
20°C and a relative humidity of 65 percent.
2.2 Results
The failure modes of the test categories and the subsequent events observed during the bending
tests are discussed. The load-deflection diagrams of the test specimen with about mean load
bearing capacity per category are shown in figure 5.
Fig. 5.
35
30
z 25 -'" .£: -'"
" 20 .~
CD
,.,..- f.--" V .,..,
,/ ......
1--------~~
~ 15 / .......-::
/£ ~ V Q)
e 0 LL
---Screws 10
5
0
r--
~ ~ ) i --Nailplates
- - - Bars+notches
~ V I
o 10 20 30 40 50 60 70 80 90 100 110 120
Displacement midspan w in mm
Load-deflection diagram of the test specimen with mean load-bearing capacity for the categories
screws, nailplates and bars and notches.
The subsequent development of local failures could roughly be observed at an increasing load:
a. Cracks occur in the tensile zone of the concrete, just underneath the jacks.
These cracks widen and new cracks occur in the tensile zone of the concrete with increasing load.
b. A gap occurs between the timber beam and the concrete slab near one support for the category
screws and bars and concrete notches, see figure 6. This gap moves towards the jacks and widens
near the support with increasing loads.
d. The timber beam splits near the last connector of category bars and concrete notches. The length
of the crack is about 40 mm and increases stable with increasing load. In some cases shear block
failure of the concrete notch is detected, a failure mode that is similar to that of ring and shear
plate COlmectors in timber to timber connections.
221

e. A gap between the timber beam and the concrete slab sometimes occurs at the other support for
the categories screws and bars and concrete notches .
. . " .....
Fig. 6. Gap between the timber beam and the concrete slab at the beam ends.
f. Finally, tensile failure of the timber beam introduces total collapse of the timber-concrete
composite beam.
2.3 Conclusions
222
All test-specimens finally failed due to failure of the timber, that is near knots or at a fingerjoint.
Depending on the configuration of the beam and behaviour of the connectors, other phenomena
could occur first, like plasticity of the connectors, cracks in the concrete tensile zone and so on.
These phenomena in contrast never initiated total collapse of the beam. The timber beams failed in
bending. One of the strongest timber beams failed due to the shear stresses at mid depth, that
reached the shear strength.
Although timber beams normally exhibit brittle failure in the tensile zone, the composite beams
showed a plastic behaviour before total collapse occurred. This behaviour was caused by the
connectors that had an elasto-plastic load-slip relationship. Once the outer connectors reached
their maximum shear strength, redistribution took place to the adjacent connectors until they also
became plastic. In this way the interlayer between the concrete and the timber lost its initial stiffness
and sometimes became fully plastic.
The three categories cannot be compared to each other directly, since they differed in the number of
connectors utilised and in the depth of the timber beam. The only statement that can be made is that
all categories satisfied the requirements for serviceability and ultimate limit state. Table 2 gives an
overview of the maximum loads that were measured, the standard deviation is also mentioned.
This last parameter is merely an indication with only ten specimens per category. The maximum
load is the load per jack, the total load on the beam should therefore be multiplied by two.

Table 2. Maximum load per jack for each category.
Category Mean Standard deviation Amount of specimens
(kN) (kN)
Screws 19.1 2.2 10
Nailplates 23.3 4.5 9
Bars and notches 32.3 3.5 10
For the category nail plates the first beam failed due to a badly glued fingeljoint in the outer lamella.
This beam is not taken into account in this category.
The connectors were placed such that the end distance equalled 150 mm for the category with
reinforcement bars and concrete notches, see figure 1. The end distance for ring COlmectors is twice
the diameter according to (Eurocode 5,1994) and 2.3 times the diameter according to (NEN 6760,
1990) that results in 140 and 160 mm respectively. Obviously this value is critical due to the cracks
and shear block failure that was observed near the beam ends. Although this kind of failure is not
critical for the total beam failure, the end distance should be taken larger to prevent splitting of the
timber.
3 Calculation models
3.1 General
The bending tests described in paragraph 2 clearly show that a linear model is not able to determine
the load-carrying capacity accurately for the configurations tested, as non-linearities almost
certainly influence the behaviour at higher load levels.
Simple linear models that take into account the slip between the elements of a composite beam, are
described by many authors. For instance, by Werner (1992) and are based on prior work of Mohler
(1956) and Newmark et al (1951). Stiissi (1947) was the first to come up with a linear model that is
widely used nowadays. Amana et al (1967) and Goodman et al (1968) derived a model for three
layers. Schelling (1968) extended the former theories to beams with more than three layers and
interlayer slip. So far, all of the models assume linear material behaviour, a negligible shear
deformation and a simply supported beam. Heimeshoff (1991) described an approximation for a
beam with three supports and different load conditions, Aicher et al (1987) also took into account
the shear deformations for sandwich structures subjected to bending moments.
Although an elastic model is not supposed to give good approximations of the failure load after
plasticity has occurred, a model comparable with Mohler's model (1956) was derived to determine
the amount of deviation between model and bending tests. This model is described in paragraph
3.2. Additionally, an extension was made to the model, which led to the 'frozen shear force' model
described in paragraph 3.3.
223

A model based on the Finite Element Method (FEM) was also developed to simulate the bending
tests and to account for the nonlinear material behaviour. This model, that is discussed in paragraph
3.4, is the most extensive one.
3.2 Elastic analytical model
224
The model discussed in this paragraph is closely related to Mohler's model (1956). The basic
assumptions of this model are:
1. A linear elastic material behaviour is assumed for the concrete and the timber, cracking and
plasticity are thus not taken into account.
2. The connectors are equally spaced.
3. All connectors have the same load-slip relationship that is schematized as linear elastic up to the
load-bearing capacity of the connector and from that point on ideal plastic, see figure 7b. In this
model only the elastic part is used and a maximum strength is not given, see figure 7a. Each
connector type is only described by its slip modulus K.
E
~f .5 - It
.S ....
-uinmm -ull'lmm
a. b.
Fig. 7. Behaviour of the connectors: a. elastic, b. elasto-plastic.
4. The discrete connectors are assumed to act as a continuous connection, called "smeared"
connectors, with slip modulus k.
5. The friction between the timber and the concrete is not considered. The shear force in the inter
layer is totally taken by the connectors.
Equilibrium between the internal and external forces of figure 8 yields
'" F (x) = 0 =} dQ,(x) + dQt(x) = -q(x) L. Z dx dx
(1)
(2)
o =} dM,(x) + dMt(x) _!hdN,(x) dx dx 2 dx
(3)
Q,(x) + Qt(x)

~I I:I IIIIIJcjr-- q(x)
UW
<Ix
Fig. 8. Part of the composite beam loaded by q(x).
These three equilibrium equations were combined with the constitutive equations for normal force
and bending of the two elements, resulting in
d4w(x) 1 d3 u (x) (El, + EI t )--4- + 2-EAc' h __ c_ q(X)
dx dx3
The contribution of the normal forces in each component is given by
2
-EA d UC(X) = 1( () k( () ()) lkhdw(X) c dx 2 i' U X = Ut X - Uc x + 2 ---ax
2 -EA d Ut(X)
t dx2
1 dw(x) k U(X) = k(ut(x) - Uc(X)) + 2kh---ax
which results in three equations with three parameters to be solved:
· w(x), the deflection in z-direction
· uc(x), the displacement at the centre of gravity of the concrete in x-direction, and
· ut(x), the displacement at the centre of gravity of the timber in x-direction.
A simple closed form solution is obtained for a load
q(x) = qosin(T . x)
(4)
(5)
(6)
(7)
225
226
By stating
w(x) = C1 sin(T x)
the constant C1 is calculated as
with
The second moment of plane area I,o' is written as
and
1 Y=
1+p
where
n = Ec,d E"d
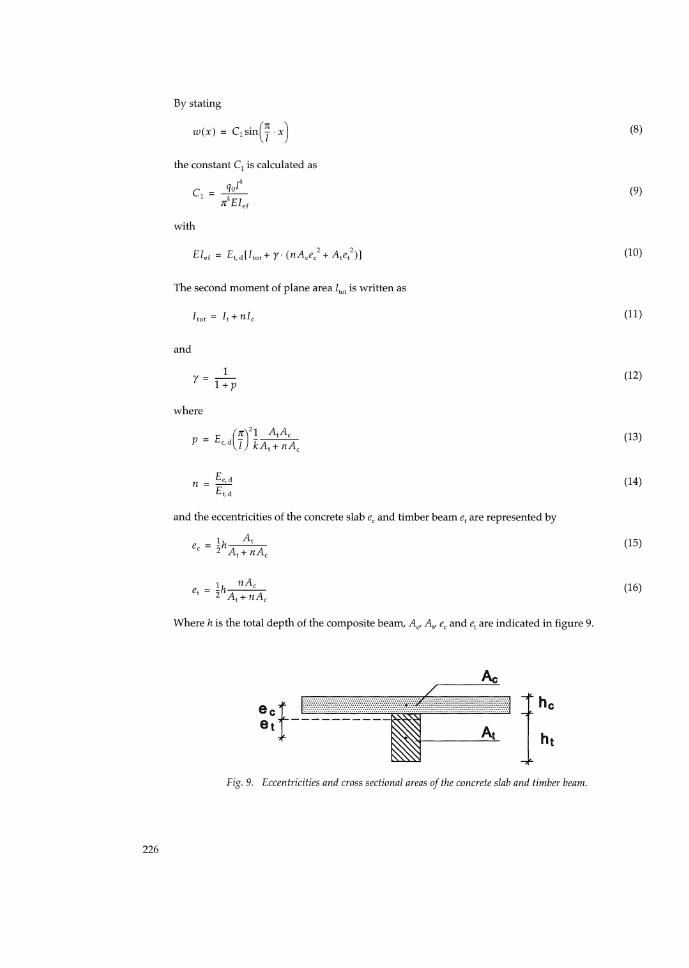
and the eccentricities of the concrete slab e, and timber beam e, are represented by
1 A, ec = '2 hA-A
t + n c
Where h is the total depth of the composite beam, A c' A" e, and e, are indicated in figure 9.
Fig. 9. Eccentricities and cross sectional areas of the concrete slab and timber beam.
(8)
(9)
(10)
(11)
(12)
(13)
(14)
(15)
(16)

The smeared slip modulus Ie equals:
Ie = !S (17) S
in which the mean spacing of the connectors s is given by:
S = 0.75 8 min + 0.25 smax (18)
if s varies uniformly in the longitudinal direction according to the shear force, and smax is lessthan
four times 8min, according to Eurocode 5 (1994). The connectors should be regarded to be positioned
in one row, with a fictitious spacing s, if more than one row of connectors is present.
The bending strength .ft,m in the outermost fibre of the timber tensile zone, is reached at a sine load
level
J[2
Ii -(l-E-lm-in)-- , ft,m
E1ef Eth, --:;-!-h-A-- + 2-E-I-ef
2 t
(19)
3.3 Frozen shear force model
A new calculation method was introduced to calculate the failure load of a timber-concrete com
posite beam, once the first connectors have reached plasticity. This method considers the plasticity
of the connectors by the assumption of an elasto-plastic load-slip diagram, as presented in figure 7b,
The approach leads to lower bound solutions assuming that a linear material behaviour of the
concrete and timber is still a valid starting-point. If tests show that the non-linear material
behaviour of these materials strongly influences the load levels discussed here, the derived equa
tions no longer represent lower bound solutions. The real material behaviour would then induce
lower load-bearing strengths.
The basic idea behind this approach is to freeze the shear forces in all connectors when the first one
at the support starts to yield, The interlayer is now assumed to be fully plastic, although this plastic
ity is set to a different load level for each individual connector. The level of plasticity coincides with
the shear force that is present in each connector at the time the first connector reaches its real level of
plasticity. A sine-function of the load introduces a cosine distribution of these shear forces as
indicated in figure 10, The model is discussed in more detail in (Van der Linden, 1999)
227

1 J I =---=--=-------q. sin(¥'x)
----:::::::::i
I 1 I
fi
~ I I I I I I I I I !""X I I I I I I
III! ~ ~ ~ ~ ~ ~ ~ Fig. 10. Distribution of the shear forces in the interlayer with increasing load according to a linear
behaviour of the connectors (above) and at 'frozen' levels (below).
3.4 FEM model
228
Three parts of the simulation model
The simulation model developed during this research, consists of three parts. In the first part, the
input phase, all relevant material data, the configuration of the beam and the desired accompanying
output can be speCified. The model is able to take care of the statistical distributions of the timber,
considering the correlation between the material parameters. This is done by means of a multi
variate random distribution programme (RANLIB). The model then automatically generates the mesh
and appropriate input for the DIANA program, a finite element method (DIANA, 1992). However, a
deterministic simulation of a single test also can be carried out, by overruling the random routines
for the Monte Carlo calculation by the input of a single beam.

In the second part of the model a bending test can be simulated and the load-displacement diagram
up to failure is obtained by successive non-linear load steps. This simulation can be performed for a
single beam, but also for a total floor system.
The third part of the model is a post-processor of the DIANA program that stores the relevant output
of the single calculation. The next simulation is started if a distribution of the load-carrying capacity
of the floor system is desired.
Configuration and elements used
The Finite Element part of the model (DIANA, 1992) consists of three kinds of elements that are used
to describe the timber-concrete composite T-beam. Shell elements were used to model the concrete
slab, spring elements for the connectors between the concrete and the timber, and beam elements
were used for the timber, see figure 11.
TImber
Fig. 11. Finite Element model of a timber-concrete composite beam.
Reinforcement was not modelled in the FEM model. The reinforcement is often placed at the centre of
the concrete and hardly raises the load-bearing capacity of the concrete. The main reason for using
reinforcement is often to prevent cracks due to shrinkage of the concrete. The net steel section is
thus minimum, resulting in minor forces contributing to the strength of the timber-concrete
composite beam.
229

Crack criterion for the timber
A brittle crack criterion was used in the tensile zone of the timber. When a crack occurred in one of
the integration points of an element, the remaining integration points of that element were given a
tensile strength of five percent of the original value. A crack thus would propagate upwards,
resulting in the 'loss' of that element and consequently of the total beam if only a single beam was
considered. This extension was modelled to simulate unstable crack growth that was often observed
in bending tests on timber beams.
4 Simulations
4.1 General
A Monte Carlo simulation was carried out with the FEM model, simulating a hundred bending tests
on each category, to obtain the distribution of the failure loads (Van der Linden, 1996). The simula
tion nearest to the mean value of each distribution is the simulation that is focused upon.
The figures that are demonstrated in the following paragraphs, display the load-deflection diagram
of the test-specimen nearest to the mean load-bearing capacity obtained in the tests, and that of each
calculation model, representing about the mean load-bearing capacity of its category. The bending
stiffness of the test-specimen consequently deviates from the mean value since a single test
specimen camlOt embody every mean material characteristic. A direct comparison between the
'mean' test specimen and each 'mean' calculation is therefore not entirely possible.
Simplicity was the main goal for all calculation models that were derived. Even for the FEM model
the input was kept to a minimum for instance, by just characterising the load-slip diagram of the
connectors by two or three straight lines. A better approximation would without doubt have been
obtained with a more complex FEM model, but this was not the intention of this research. One should
keep these assumptions in mind when the models are compared to the test results.
4.2 Simulation of the bending tests
Beams with screws
230
The linear part of the load-deflection diagram of the models is in close agreement with that of the
test-specimen, see figure 12. The analytical 'frozen shear force' model starts to deviate from the
elastic stiffness at the same load as found in the bending tests. The FEM model slightly overestimates
this bending point. The analytical model then starts to overestimate the real behaviour, mainly
because the model assumes 'frozen' plasticity of the connectors where a decreasing load-slip
diagram is present in reality. Apart from that, the concrete tensile zone remains linear elastic and is
not able to crack in this model. The interlayer of 28 mm of particleboard is modelled via an extra
depth of 28 mm that was added to the timber beam, because the model could only represent two
layers of material. These factors also contribute to the overestimation of the load-bearing capacity
and bending stiffness.
40
35
I
L ft,m i I·-~ t-----
/ I I
z 30 "'" ." 25 "'" " '" ~ 20 c. IJ.
15 Q)
e 0 IJ. 10
5
0
r-----V ~ft,m 1
------t--------- --_.
L J-...--~ i
~ ~ ~. ------- I
I t---t--.. --- r- l--mean test A £'
-- r- -- 1--------1 ...... mean FEM simulation
--of --e-- elastic analytical model
~ I ----&- 'frozen shear force' model
o 10 20 30 40 50 60 70 80 90 100 110 120
Displacement midspan w in mm
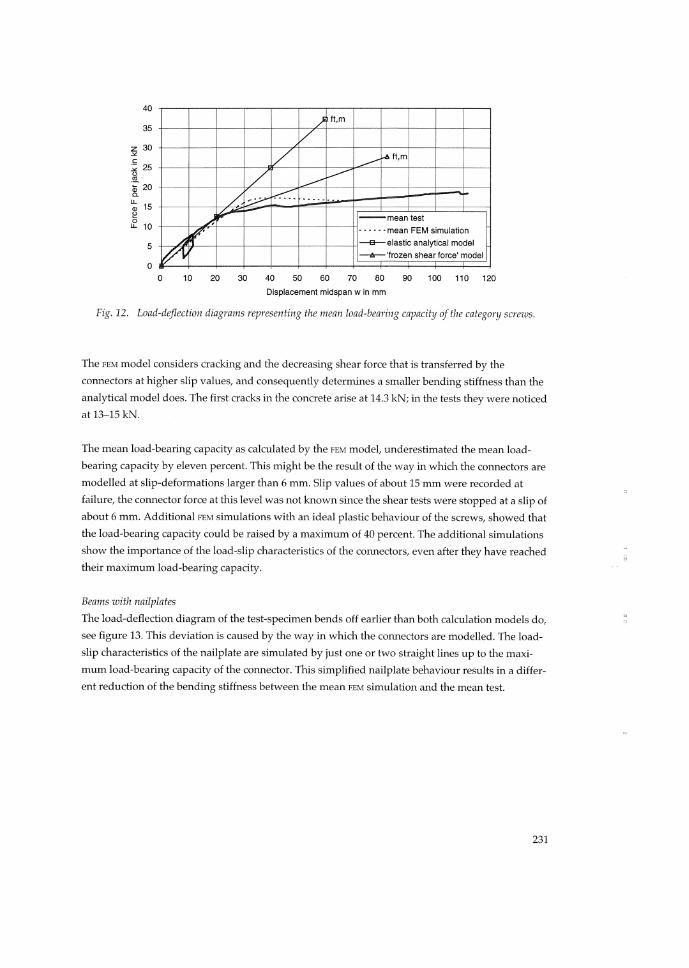
Fig. 12. Load-deflection diagrams representing the mean load-bearing capacity of the category screws.
The FEM model considers cracking and the decreasing shear force that is transferred by the
connectors at higher slip values, and consequently determines a smaller bending stiffness than the
analytical model does. The first cracks in the concrete arise at 14.3 kN; in the tests they were noticed
at 13-15 kN.
The mean load-bearing capacity as calculated by the FEM model, underestimated the mean load
bearing capacity by eleven percent. This might be the result of the way in which the COlU"lectors are
modelled at slip-deformations larger than 6 mm. Slip values of about 15 mm were recorded at
failure, the COlU"lector force at this level was not known since the shear tests were stopped at a slip of
about 6 mm. Additional FEM simulations with an ideal plastic behaviour of the screws, showed that
the load-bearing capacity could be raised by a maximum of 40 percent. The additional simulations
show the importance of the load-slip characteristics of the connectors, even after they have reached
their maximum load-bearing capacity.
Beams with nailplates
The load-deflection diagram of the test-specimen bends off earlier than both calculation models do,
see figure 13. This deviation is caused by the way in which the connectors are modelled. The load
slip characteristics of the nailplate are simulated by just one or two straight lines up to the maxi
mum load-bearing capacity of the connector. This simplified nailplate behaviour results in a differ
ent reduction of the bending stiffness between the mean FEM simulation and the mean test.
231

232
40
I 35 --+.
z 30 ex .S;
25 ex
" til
~ 20 0-u.. <1> 15 e 0 u.. 10
5
~ t,m
L ./ ~
!t,m .
~ V ~.;
.. '
--~ r-/ ~ --...- .... ~ .-
. :.:.-:.# ~ i --mean test
~ f? ...•. - mean FEM simulation
-a-- elastic analytical model
~, V I ___ 'frozen shear force' model
o o 10 20 30 40 50 60 70 80 90 100
Displacement midspan w in mm
Fig. 13. Load-deflection diagrams representing the mean load-bearing capacity of the category nailplates.
The behaviour is captured almost correct once the bending stiffness remains constant: the load
deflection paths are parallel up to failure of the timber beam. The first concrete crack occurs in the
FEM model at 12.7 kN, whereas it was observed at 8-15 kN in the tests. The displacement reached at
failure is predicted very well by both models, but the load-bearing capaci,ty is overestimated by fif
teen percent, also due to the deviation in behaviour that is calculated in the first part of the diagram.
Beams with reinforcement bars and concrete notches
The load-deflection diagrams presented in figure 14 almost lead to the same observations that were
made for the nailplates. The load-deflection diagram of the test-specimen bears off earlier than both
calculation models do. Again, substituting the real load-slip behaviour of the connectors by just one
or two straight lines results in the deviation that is found. The first concrete crack occurs in the FEM
model at 23.4 kN, whereas it was 12-22 kN in the test-specimens.
40
35
z 30 .>< .S;
25 .><
" til .~ 20 0-u..
<1> 15 e 0 u.. 10
5
0
~ ~---t- L ~ ,.......·ftm b----:::+-;""
I I -"'V~ ~, i .~ V
//I? --mean test
A ~ -- - - - - - . mean FEM simulation l-
.-r-- ~--a-- elastic analytical model
I-c/"II ___ 'frozen shear force' model
o 10 20 30 40 50 60 70 80 90 100
Displacement midspan w in mm
Fig. 14. Load-deflection diagrams representing the mean load-bearing capacity of the category
reinforcement bars and concrete notches.

The behaviour is captured satisfactorily once the bending stiffness remains almost constant: the
load-deflection paths are parallel up to failure of the timber beam. The displacement reached at
failure is underestimated by both models, the load-bearing capacity is overestimated by twelve
percent.
4.3 Conclusions and discussion
The first deviation from linear elastic behaviour that occurs in the bending tests and in the FEM
model, is cracking of the concrete near the loading points. The model then predicts plasticity in the
compression zone of the concrete which is hard to observe at the test beams. This could however be
correct because the calculated concrete strain is about 2 - 2.5%0 at failure load, which probably is too
small to observe plasticity at the beams. Between or after that, depending on the characteristics of
the connector, the connectors start to yield. In both test and FEM simulation the ultimate load
bearing capacity is reached when the bending strength of the timber is reached. Plasticity in the
compression zone of the timber is not observed in the bending tests. According to the calculation
models plasticity might occur for the T-beams at higher load levels, but should normally not be
expected.
The calculation models seem to show a stiffer behaviour of the timber-concrete composite beams
than determined at the test-specimens at higher load levels. This difference might occur due to
creep deformations that arose in the tests and that are not incorporated in the calculation models.
Since the bending tests lasted between 20 and 30 minutes, creep deformations might have occurred.
Additional simulations carried out with a ten percent lower bending strength, could explain
another phenomenon that occurred in the Monte Carlo simulations as well. In most categories it
was observed that the distribution of the ultimate loads per category could differ from a normal
distribution, although the input parameters had been assigned normal distributions. This skewness
is likely to be caused by the plasticity of the connectors in the timber-concrete composite beams.
Plasticity of the connectors is not reached for timber beams having a low bending strength, and the
stresses in the materials are still linear elastic at failure of the timber beam. The connectors become
plastic if the timber beam is much stronger and thus the load on the timber-concrete composite
beam can be increased. It then depends on the configuration how much the ultimate load can be
increased. The ultimate load nearly remained constant for the screws category and was raised for
the other categories. It is this behaviour for beams having higher bending strengths, that results in
the skewness of the distributions at higher load levels.
The mean test results are best described by the FEM model, although the" frozen shear force" model
also gives a good estimate of the mean failure loads. The load-deflection diagrams simulated by the
FEM model give the best approximation of the real behaviour, but this model also is the most
laborious one for the user. The deviations from the real failure loads are mainly caused by the
quality of the input parameters for the timber beam, that were obtained through indirect methods.
The mean failure loads as determined through the calculation models, are expressed as a ratio to the
mean failure load obtained from the tests and presented in table 3.
233

The "frozen shear force" model shows the largest discrepancy for the category screws. The model
assumes full plasticity of the connectors. If a declining load-slip behaviour is present, as is true for
the category screws, the model overestimates the load-bearing capacity. In those circumstances the
plasticity level of the connector has to be chosen such that it represents the mean shear force
transferred in that range of slips. This modification was not carried out for the calculations
described in this paragraph, but it would have led to a ratio closer to one in table 3.
Table 3. Ratio of the mean calculated failure load to the mean failure load obtained through the
bending tests.
Category: Screws Nailplates Reinforcement bars
Calculation model: and concrete notches
FEMmodel 0.89 1.15 1.12
elastic analytical model 1.96 1.36 1.19
"frozen shear force" model 1.45 1.18 1.08
5 Structural behaviour at a lower timber quality
234
A design model for timber-concrete composite beams should be able to describe the plastic
structural behaviour that was observed in the bending tests. This can be concluded from the former
paragraph, in which the FEM model and the 'frozen shear force' model more accurately described the
failure loads than the elastic analytical model.
However, the bending tests were performed on composite beams that were assembled with glulam
beams. Glulam is stronger and its modulus of elasticity is higher than that of ordinary sawn timber.
It is thus somewhat premature to recommend a plastic design model based on tests that incorpo
rated timber of higher qualities. Sawn timber is what is usually present in projects that need to be
refurbished.
Additional simulations were carried out on timber-concrete composite beams that were assembled
with sawn timber of an ordinary Dutch strength class, K17. A Monte Carlo simulation was carried
out for a hundred beams per configuration, storing the behaviour up to failure of each beam. The
distribution of the failure loads was thus obtained and the 5-percentile characteristic strength values
were determined.
One of these simulated configurations, series 3 that is comparable to the composite beams with nail
plates described in 2.1, is discussed in more detail.
The intention of these simulations was to model configurations at the limit of what could possibly
be achieved with sawn timber. So the results obtained from the nailplate configuration should not
directly be compared to the results of series 3. The load-deflection diagram of three characteristic
strength levels is presented in figure 15.

20
18
16
'" 14
~ 12 .¥
.!: 0- 10 "0
'" 0 8 -'
6
4
2
0
I I ! -6 --- ~ i .....--~
~ ~ ~~
x~ ~
~---~- -~------.-, ~
~ -&- 95-percentil~ ~ /'
~~ - .. 1-0-50-percentile
/ I-+-5-percentile
o 20 40 60 80 100 120
Displacement midspan w in mm
Fig. 15. Load~displacement diagrams for series 3.
The 50~ and 95~percentile simulations still show a plastic behaviour, comparable to the results of the
bending tests. The bending strengths of the timber beams were 29 and 43 N ! mm2 respectively.
These values are of the same magnitude as the strengths of the glulam beams used in the bending
tests; consequently the same kind of plastic behaviour arises for these percentiles.
The 5~percentile simulation, at a timber bending strength of only 21 N! mm2, showed a linear
behaviour. Apparently the timber beam failed before the connectors were able to become plastic.
This behaviour at the 5-percentile characteristic strength level was observed for all configurations
simulated, provided that a certain amount of composite behaviour was present. Composite beams
without or with only minor interaction, could show a plastic behaviour of the connectors, even at
this load level. However, these beams were merely simulated to study the influence of the
connectors and did not represent a system to be used in common practice.
6 Conclusions
The bending test-specimens failed due to rupture of the tensile zone of the timber beam, that is near
knots or at a fingerjoint. Depending on the configuration of the beam and behaviour of the
connectors, other phenomena could occur first, like plasticity of the connectors, cracks in the con
crete tensile zone and so on. These phenomena in contrast never initiated total collapse of the beam.
Although timber beams normally exhibit brittle failure in the tensile zone, the composite beams
showed a plastic behaviour before total collapse occurred. This behaviour was caused by the
connectors that had an elasto-plastic load-slip relationship. Once the outer connectors reached their
maximum shear strength, redistribution took place to the adjacent connectors until they also
became plastic.
235

236
The Monte Carlo calculations that simulated the manufacturing and testing of composite beams and
floor systems, revealed a skewness in the distribution of the failure loads of each category. The
highest failure loads sometimes hardly differed from the mean failure loads, due to plasticity of the
connectors that occurred at higher load levels. Consequently, the assumption of a normal distribu
tion for the strength of a timber-concrete composite configuration often turns out to be wrong.
The test results are best described by the FEM model, although the 'frozen shear force' model also
gives a good estimate of the failure loads. The load-deflection diagrams simulated by the FEM model
give the best approximation of the real behaviour, but this model also is the most laborious one for
the user. The deviations from the real failure loads are mainly caused by the quality of the input
parameters for the timber beam, that were obtained through indirect methods.
A linear calculation model is recommended for the design of timber-concrete composite beams, if
the timber beam belongs to a regular strength class for sawn timber (Blass, H.J. et al, 1996). The sim
ulations show that no or hardly any plasticity occurs at the 5-percentile characteristic load-bearing
capacity. At this load level the timber beam fails before any plasticity is able to occur.
If the connectors turn out to have become plastic and the concrete and timber still behave linear
elastic, then the 'frozen shear force' model described in paragraph 3.3 can be used. The connectors
become plastic before the timber beam fails, for instance, in composite beams with minor inter
action.
More advanced design tools, like the FEM model discussed in paragraph 3.4, should only be used if
the nonlinear behaviour of the timber beam or concrete slab influences the load-bearing capacity.
This is the case when glulam beams or sawn timber of the highest strength classes are used.
Notations
Symbol
Latin
A
EA,
EAt
Elef
EI,
Elt
Elmin
F
Fest
K
Description
Cross sectional area
Resistance to elongation of the concrete slab
Resistance to elongation of the timber beam
Effective bending stiffness of the composite beam
Bending stiffness of the concrete slab
Bending stiffness of the timber beam
Minimum bending stiffness of the composite beam
Load
Estimated highest load
Second moment of plane area
Slip modulus
Dimension
N
N
N/mm2
Nmm2
Nmm2
Nmm2
kN
kN
N/mm

e
f
J"m h
n
q
Smax
Smin
U
Uel,max
U t
w
Greek
y
Subscripts
c
d
ef
el
m
max
min
mod
x
z
slip modulus according to DIN EN 26891
Bending moment
Normal force
Shear force
eccentricity
smeared connector forces between the timber
and the concrete
timber bending strength
depth of the timber-concrete beam
depth of the concrete slab
depth of the timber beam
smeared slip modulus, defined as Kis
span
ratio modulus of elasticity of concrete to modulus of elasticity of
timber
distributed load
spacing of the connectors
maximum spacing of the connectors
minimum spacing of the connectors
displacement in x-direction
displacement at the centre of gravity of the concrete
maximum elastical slip of a connector
maximum slip of a connector at failure
displacement at the centre of gravity of the timber
displacement in z-direction
combination factor that shows the effectiveness of
the connections in a composite beam (0 < y<1)
concrete, compression
design value
effective
elastic
bending
maximum
minimum
modification
timber
parallel to the x axis
parallel to the z axis
N/mm
kNm
kN
kN
mm
N/mm
N/mm2
mm
mm
mm
N/mm/mm
mm
kN/m, kN/m2
mm
mm
mm
mm
mm
mm
mm
mm
mm
237

238
References
AICHER, S. and VON Rom, W., Ein modifiziertes yVerfahren fUr das Mechanische Analogon: dreis
chichtiger Sandwichverbund - zweiteiliger verschieblicher Verbund. Bautechnik 1. 1987
AMANA, E.J. and BOOTH, L.G., Theoretical and experimental studies on nailed and glued plywood
stressed-skin components: Part 1, Theoretical Study, Journal of the Institute of Wood Science
Vol. 4, No.1, 1967
AMANA, E.J. and Boom, L.G., Theoretical and Experimental studies on nailed and lued plywood
stressed-skin components: Part 2, Experimental Study, Journal of the Institute of Wood Science
Vol. 4, No.2, 1967
BLASS, H.J.; EHLBECK, J.; VAN DER LINDEN, M.L.R.; SCHLAGER, M. Trag- und Verformungsverhalten von
Holz-Beton-Verbundkonstruktionen, Universitat Fridericiana Karlsruhe, Versuchsanstalt fur
Stahl, Holz und Steine, 1995
BLASS, H.J.; SCHLAGER, M; VAN DER LINDEN, M.L.R.; Trag- und Verformungsverhalten von Holz-Beton
Verbundkonstruktionen, Bauen mit Holz, Teill, 5/96 und Teil2, 6/96
COLLING, F., Tragfahigkeit von Biegetragern aus Brettschichtholz in Abhangigkeit von den festigkeit
srelevanten EinfluBgriiBen, Dissertation, Universitat Karlsruhe, 1990.
DIN 500l4. Klimate und ihre technische Anwendung; Normalklimate. Juli 1985.
DIN EN 26891 Holzbauwerke; Verbindungen mit mechanischen Verbindungsmitteln, Allgemeine
Grundsatze fUr die Ermittlung der Tragfahigkeit und des Verformungsverhaltens. Juli 1991
Eurocode 5. Design of timber structures. Part 1-1: General rules and rules for buildings. NVN-ENV
1995-1-1, first print, June 1994
GERBER, c., QUAST, u., STEFFENS, R., Balkenschuhe als Verbundmittel fUr Holzbalkendecken mit
mittragender Stahlbetondecke. Beton- und Stahlbetonbau 88, Heft 9, 1993
GODYCKI, T.; PAWLICA, J.; KLESZCZEWSKI, J. Verbunddecke aus Holzrippen und Betonplatte.
Bauingenieur 59,1984
GOODMAN, J.R. and Popov, E.P., Layered beam systems with interlayer slip. Journal of the
Structural Division, ASCE Vol. 94, No. STll, Proc. Paper 6214, pp 2535-2547,1968
GORLACHER, R., Klassifizierung von Brettschichtholzlamellen durch Messung von Longitudinal
schwingungen. Dissertation, Universitat Karlsruhe, 1990.
HEIMESHOFF, B., Naherungsverfahren zur Berechnung von Einfeldtragern mit Kragarm und von
Zweifeldtragern, die aus nachgiebig miteinander verbundenen Querschnittsteilen bestehen, im
Ingenieurholzbau, Holz als Roh- und Werkstoff 49, pp 277-285,1991
MOHLER, K., Uber das Tragverhalten von Biegetragern und Druckstaben mit zusammengesetztem
Querschnitt und nachgiebigen Verbindungsmitteln. Habilitation TH Karlsruhe, 1956
MULLER, P., Decke aus hochkantig stehenden Holzbohlen oder Holzbrettern und Betondeckschicht.
Patentschau aus dem Betonbau und den damit verwandten Gebieten. Auszuge aus den Patent
schriften. Beton und Eisen, H. XVII, S. 244, 1922
NATTERER, J. and HOEFT, M., Zum Tragverhalten von Holz-Beton Verbundkonstruktionen. Forsc
hungsbericht CERS Nr. 1345. EPFL/IBOIS March 1987
NAUTA, F., New Zealand Forest Service Timber Bridges. Proceedings of 1984 Pacific Timber Engi
neering Conference, Auckland, New Zealand, 1984

NEN 6702;1991 Belastingen en vervormingen, TGB 1990
TGB 1990 Loadings and deformations
NEN 6760;1991 Houtconstructies, TGB 1990
TGB 1990 Timber structures
NEWMARK, N.M., SIESS, c.P., and VIEST, LM., Tests and analysis of composite beams with incomplete
interaction. Proceedings, Society for Experimental Stress Analysis, VI. 9, No.1, pp 75-92,1951
POSTULKA, J. Strengthening of Wooden Ceiling Constructions. IABSE Symposium Strengthening of
Building Structures - Diagnosis and Therapy, Venezia, 1983
POSTULKA, J. Holz-Beton-Verbunddecken, 36 Jahre Erfahrung. Bautechnik 74, 1997
SCHELLING, W., Die Berechnung nachgiebig verbundener, zusammengesetzter Biegetrager im Inge
nieurholzbau. Dissertation TH Karlsruhe, 1968
STOSSI, F., Zusammengesetzte vollwandtrager. International Association for Bridge and Structural
Engineering, IABSE, Vol. 8, pp 249-269,1947
VAN DER LINDEN, M.L.R., Monte Carlo simulations of timber-concrete composite beam tests. Report
no. 25.4.96.3 /HC-12, Delft University of Technology, March 1996
VAN DER LINDEN, M.L.R., Timber-concrete composite floor systems. Delft University of Technology,
PhD.Thesis, 1999
WERNER, H., Holz-Beton-Verbunddecke mit einer neuartigen Fugenausbildung. Bauen mit Holz
Nr. 4,1992
Computer programs used:
DIANA, User's Manual- Release 5.1, Revision A - April 29, 1992
Volume 0 - Introduction & Utilities
Volume 1 - Linear Static Analysis
Volume 4 - Nonlinear Analysis
The Multi-Variate Programme used is public domain software and retrieved from:
RANUB
Library of Fortran Routines for Random Number Generation
compiled and written by: Barry W.Brown / James Lovato
Department of Biomathematics, The University of Texas, M.D. Anderson Cancer
Center. This work was supported by grant CA-16672 from the National Cancer Institute.
Reference for some subroutines involved:
Subroutines Spofa and Sdot used by setgmn:
Dongarra, J-J., Moler, C.B., Bunch, J.R. and Stewart, G.W.,
Linpack User's Guide. STAM Press, Philadelphia, 1979
Bottom level routines:
L'Ecuyer, P. and Cote, S., Implementing a Random Number Package with Splitting Facilities,
ACM Transactions on Mathematical Software, 17:98-111, 1991
239
Recommended