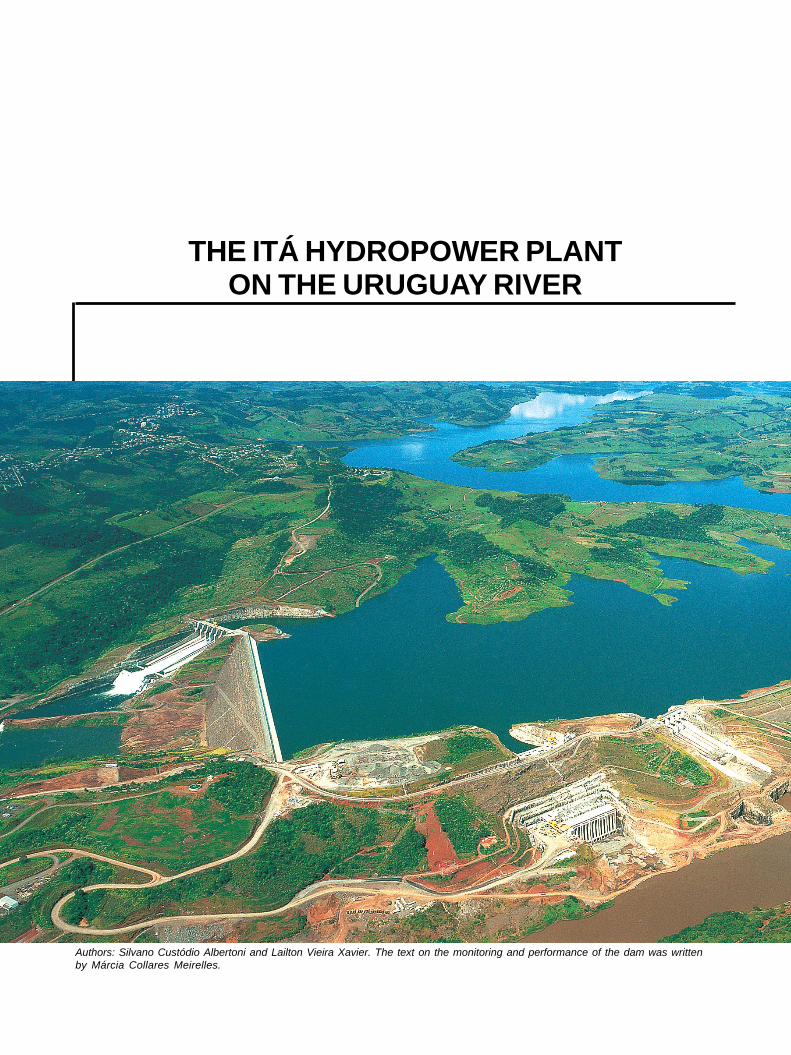
THE ITÁ HYDROPOWER PLANTON THE URUGUAY RIVER
Authors: Silvano Custódio Albertoni and Lailton Vieira Xavier. The text on the monitoring and performance of the dam was writtenby Márcia Collares Meirelles.
Main Brazilian Dams III
206
THE ITÁ HYDROPOWER PLANTON THE URUGUAY RIVER
1. INTRODUCTION
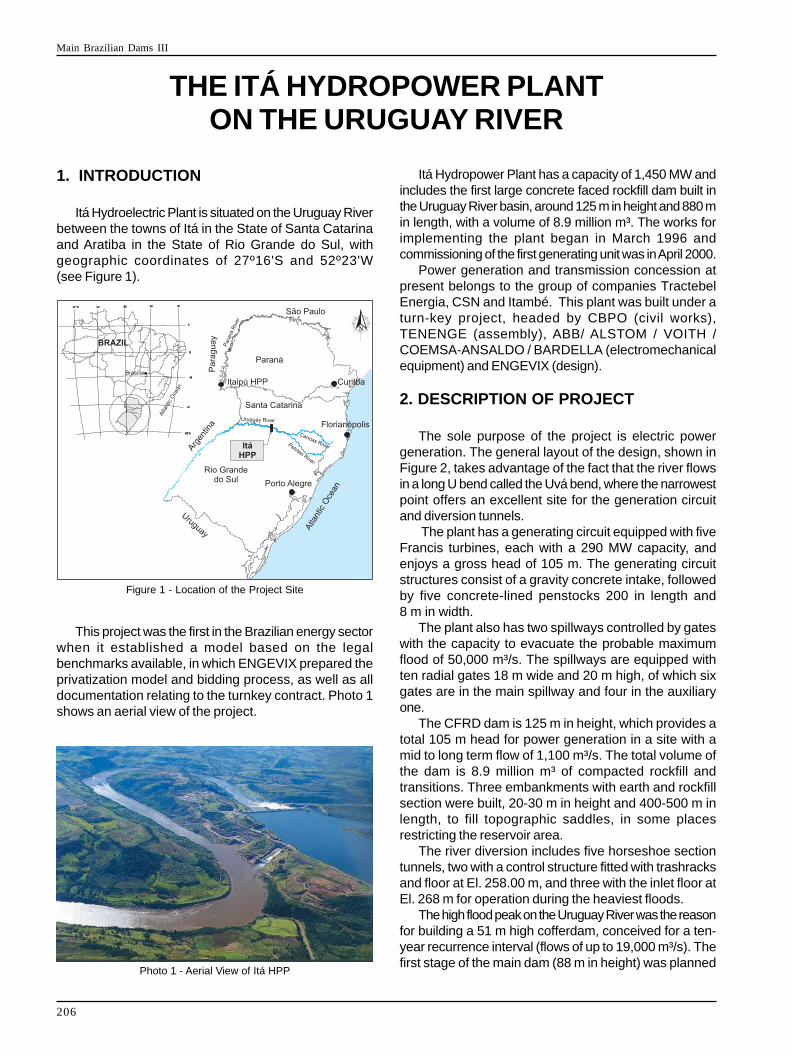
Itá Hydroelectric Plant is situated on the Uruguay Riverbetween the towns of Itá in the State of Santa Catarinaand Aratiba in the State of Rio Grande do Sul, withgeographic coordinates of 27º16'S and 52º23'W(see Figure 1).
This project was the first in the Brazilian energy sectorwhen it established a model based on the legalbenchmarks available, in which ENGEVIX prepared theprivatization model and bidding process, as well as alldocumentation relating to the turnkey contract. Photo 1shows an aerial view of the project.
Itá Hydropower Plant has a capacity of 1,450 MW andincludes the first large concrete faced rockfill dam built inthe Uruguay River basin, around 125 m in height and 880 min length, with a volume of 8.9 million m³. The works forimplementing the plant began in March 1996 andcommissioning of the first generating unit was in April 2000.
Power generation and transmission concession atpresent belongs to the group of companies TractebelEnergia, CSN and Itambé. This plant was built under aturn-key project, headed by CBPO (civil works),TENENGE (assembly), ABB/ ALSTOM / VOITH /COEMSA-ANSALDO / BARDELLA (electromechanicalequipment) and ENGEVIX (design).
2. DESCRIPTION OF PROJECT
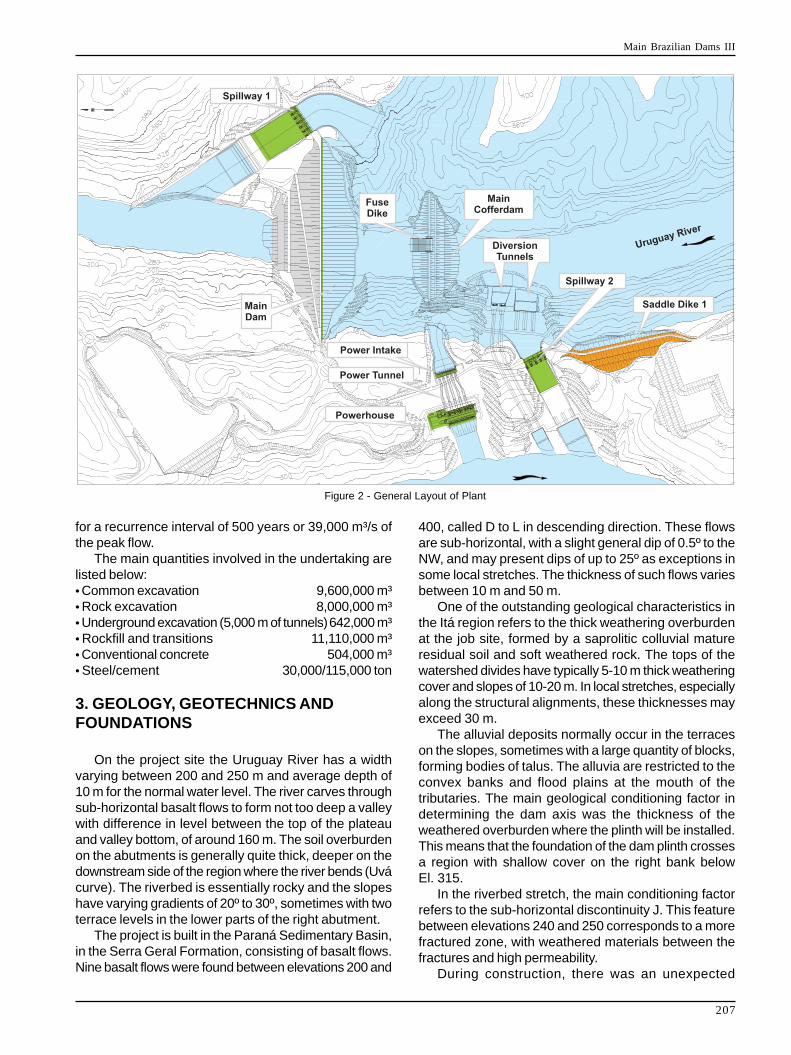
The sole purpose of the project is electric powergeneration. The general layout of the design, shown inFigure 2, takes advantage of the fact that the river flowsin a long U bend called the Uvá bend, where the narrowestpoint offers an excellent site for the generation circuitand diversion tunnels.
The plant has a generating circuit equipped with fiveFrancis turbines, each with a 290 MW capacity, andenjoys a gross head of 105 m. The generating circuitstructures consist of a gravity concrete intake, followedby five concrete-lined penstocks 200 in length and8 m in width.
The plant also has two spillways controlled by gateswith the capacity to evacuate the probable maximumflood of 50,000 m³/s. The spillways are equipped withten radial gates 18 m wide and 20 m high, of which sixgates are in the main spillway and four in the auxiliaryone.
The CFRD dam is 125 m in height, which provides atotal 105 m head for power generation in a site with amid to long term flow of 1,100 m³/s. The total volume ofthe dam is 8.9 million m³ of compacted rockfill andtransitions. Three embankments with earth and rockfillsection were built, 20-30 m in height and 400-500 m inlength, to fill topographic saddles, in some placesrestricting the reservoir area.
The river diversion includes five horseshoe sectiontunnels, two with a control structure fitted with trashracksand floor at El. 258.00 m, and three with the inlet floor atEl. 268 m for operation during the heaviest floods.
The high flood peak on the Uruguay River was the reasonfor building a 51 m high cofferdam, conceived for a ten-year recurrence interval (flows of up to 19,000 m³/s). Thefirst stage of the main dam (88 m in height) was planned
Photo 1 - Aerial View of Itá HPP
Figure 1 - Location of the Project Site
Main Brazilian Dams III
207
Figure 2 - General Layout of Plant
for a recurrence interval of 500 years or 39,000 m³/s ofthe peak flow.
The main quantities involved in the undertaking arelisted below:• Common excavation 9,600,000 m³• Rock excavation 8,000,000 m³• Underground excavation (5,000 m of tunnels)642,000 m³• Rockfill and transitions 11,110,000 m³• Conventional concrete 504,000 m³• Steel/cement 30,000/115,000 ton
3. GEOLOGY, GEOTECHNICS ANDFOUNDATIONS
On the project site the Uruguay River has a widthvarying between 200 and 250 m and average depth of10 m for the normal water level. The river carves throughsub-horizontal basalt flows to form not too deep a valleywith difference in level between the top of the plateauand valley bottom, of around 160 m. The soil overburdenon the abutments is generally quite thick, deeper on thedownstream side of the region where the river bends (Uvácurve). The riverbed is essentially rocky and the slopeshave varying gradients of 20º to 30º, sometimes with twoterrace levels in the lower parts of the right abutment.
The project is built in the Paraná Sedimentary Basin,in the Serra Geral Formation, consisting of basalt flows.Nine basalt flows were found between elevations 200 and
400, called D to L in descending direction. These flowsare sub-horizontal, with a slight general dip of 0.5º to theNW, and may present dips of up to 25º as exceptions insome local stretches. The thickness of such flows variesbetween 10 m and 50 m.
One of the outstanding geological characteristics inthe Itá region refers to the thick weathering overburdenat the job site, formed by a saprolitic colluvial matureresidual soil and soft weathered rock. The tops of thewatershed divides have typically 5-10 m thick weatheringcover and slopes of 10-20 m. In local stretches, especiallyalong the structural alignments, these thicknesses mayexceed 30 m.
The alluvial deposits normally occur in the terraceson the slopes, sometimes with a large quantity of blocks,forming bodies of talus. The alluvia are restricted to theconvex banks and flood plains at the mouth of thetributaries. The main geological conditioning factor indetermining the dam axis was the thickness of theweathered overburden where the plinth will be installed.This means that the foundation of the dam plinth crossesa region with shallow cover on the right bank belowEl. 315.
In the riverbed stretch, the main conditioning factorrefers to the sub-horizontal discontinuity J. This featurebetween elevations 240 and 250 corresponds to a morefractured zone, with weathered materials between thefractures and high permeability.
During construction, there was an unexpected

Main Brazilian Dams III
208
geological finding when high residual stresses in the rockmass were discovered, at that time unprecedented inhydropower plants built on basalt rock in the ParanáBasin. Spalling phenomena of the rock were observed inthe Itá underground excavations, in the "I" and "J" basaltflows.
Shortly after the start up of the plant, two erosionsoccurred in the unlined chute of the auxiliary spillwaydespite the good quality of rock mass and extra caretaken with the excavations. This process may have beencaused in the zones peripheral to the discontinuities inthe area, beyond the strip immediately above the contactbetween flows at El 294, which acted as relief levels ofunderlying blocks, aggravated by the pre-existing spallingderiving from relief of stresses in the rock mass.Accordingly, the result of this domino effect was thatnew blocks were eroded as the blocks began to loosenin series. The phenomenon worsened as a result of theflat sub-horizontal layout of these litho-structural features,in addition to greater susceptibility to water erosion ofthe thin sub-horizontal plates, which after removal causedanother redistribution of stresses in the rock mass, back-feeding the erosion process.
4. HYDROLOGY, HYDRAULICS &ENERGY STUDIES
The Uruguay River basin at the site of the Itá HPPcovers a drainage area of 44,500 km².
The average flow for the period under observation(1958-1991) is 1,080 m3/s. The daily minimum flow of114 m³/s occurred in March 1968, and the daily maximumflow of 29,620 m³/s occurred in August 1984.
The Uruguay River at the project site varies in widthbetween 200 and 250 m and average depth of 10 m inrelation to the normal water level.
The energy studies permitted the definition of theoperating conditions, number of units and installedcapacity, which resulted in adopting five Francis unitswith 294.4 MW under a head of 102 m, with total installedcapacity of 1,450 MW.
5. MAIN STRUCTURES
The plant layout consists basically of the following:• River diversion by means of five tunnels in a horseshoesection, two of them (section 14 m x 14 m) in a concretecontrol structure fitted with trashracks, and another three(15 m x 17 m) at higher elevations during the major flowoperation, closed by the cofferdams and plugs to protectfrom flows of no more than 1,500 m³/s;• Concrete face rockfill dam with crest at El. 375.50, witha height of 125 m, length 880 m and total volume estimatedat 8.9 million cubic metres;• Two spillways controlled by gates with capacity toevacuate the probable maximum flood corresponding to
a flow of 50,000 m³/s, with ten gates, 18 m wide by 20 mhigh;• The generating circuit consists of a gravity concreteintake, followed by five concrete-lined penstocks 200 min length and 8 m in width. The powerhouse, with accessyard at El. 294.00 is covered, consisting of five blocksfor the Francis generator units and the assembly area,with total length of 52 m and maximum height of 31m.The gas-insulated shielded substation is on the left bank,on a plateau at El. 309 m.• Single-bus drive substation and two transmission linesas far as the substation of the system, with around1.8 km in double circuit, with rated voltage of 535 kV.
5.1. River Diversion and ControlThe river diversion has always been considered a
crucial question in Itá, since the combination of basaltsoils with low permeability and steep gradients of thedeforested slopes, predominant in the drainage basin,caused flood peaks that responded rapidly in the wetseasons.
A number of preventive measures were taken toguarantee the security of the dam construction duringthe design stage [Antunes et al., 1991¹], such as:• Placing on the abutments around 3x10⁶ m³ of rockfillbefore diverting the river, strangling the riverbed for around70 m.• The river diversion, at the end of the wet season and theincrease of the dam in the next six months to protectagainst the 500-year flood recurrence interval before thestart of the next rainy season (El. 348 m). Around2.2 x 106 m³ of material had to be placed during thisperiod.• A cofferdam designed for 10-year recurrence intervalcould protect the works during the first few months afterthe diversion.• A fuse-plug spillway and flood channel were planned toprotect the cofferdam should the water rise during thefirst rains after the diversion, when the dam would bewell above this level, but the work would be done in theplinth area.• A layer of fine rockfill was laid to partly protect the damconstruction against failures in case of seepage.
In addition to these preventive measures, a typicalhydrological conditions caused by the El Niñophenomenon, which occurred during the works, causedcorrective measures to be adopted urgently.
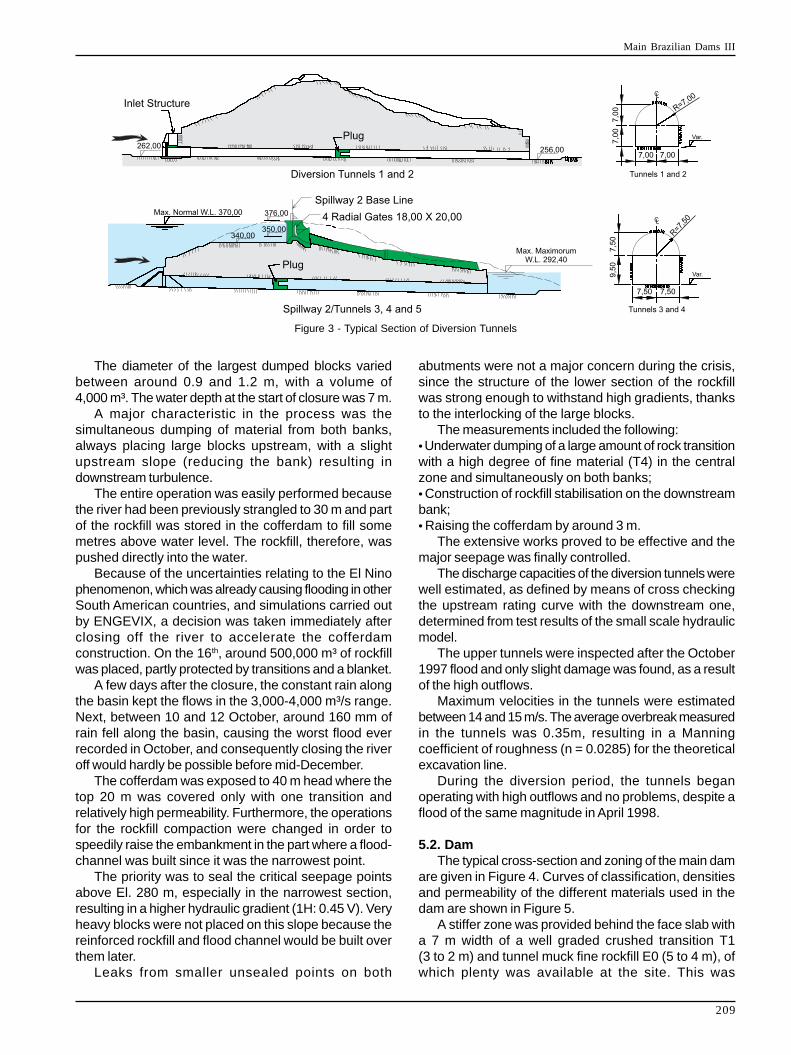
The river diversion through the tunnels was completedon 24 September 1997 (see Figure 3). The rockfillplacement for closure was carried out in a slow process,since the river flow at that moment was relatively low(700 m³/s). The operation took 15 hours, during whichtime around 10,000 m³ of rockfill was laid. The criticalphase was when a 15 m wide breach in the riverbed wasreached, with a flow of 350 m³/s passing through thebreach to a differential of around 2.7m. The maximumopening at the end of the closure was 3.4 m.
Main Brazilian Dams III
209
The diameter of the largest dumped blocks variedbetween around 0.9 and 1.2 m, with a volume of4,000 m³. The water depth at the start of closure was 7 m.
A major characteristic in the process was thesimultaneous dumping of material from both banks,always placing large blocks upstream, with a slightupstream slope (reducing the bank) resulting indownstream turbulence.
The entire operation was easily performed becausethe river had been previously strangled to 30 m and partof the rockfill was stored in the cofferdam to fill somemetres above water level. The rockfill, therefore, waspushed directly into the water.
Because of the uncertainties relating to the El Ninophenomenon, which was already causing flooding in otherSouth American countries, and simulations carried outby ENGEVIX, a decision was taken immediately afterclosing off the river to accelerate the cofferdamconstruction. On the 16th, around 500,000 m³ of rockfillwas placed, partly protected by transitions and a blanket.
A few days after the closure, the constant rain alongthe basin kept the flows in the 3,000-4,000 m³/s range.Next, between 10 and 12 October, around 160 mm ofrain fell along the basin, causing the worst flood everrecorded in October, and consequently closing the riveroff would hardly be possible before mid-December.
The cofferdam was exposed to 40 m head where thetop 20 m was covered only with one transition andrelatively high permeability. Furthermore, the operationsfor the rockfill compaction were changed in order tospeedily raise the embankment in the part where a flood-channel was built since it was the narrowest point.
The priority was to seal the critical seepage pointsabove El. 280 m, especially in the narrowest section,resulting in a higher hydraulic gradient (1H: 0.45 V). Veryheavy blocks were not placed on this slope because thereinforced rockfill and flood channel would be built overthem later.
Leaks from smaller unsealed points on both
Figure 3 - Typical Section of Diversion Tunnels
abutments were not a major concern during the crisis,since the structure of the lower section of the rockfillwas strong enough to withstand high gradients, thanksto the interlocking of the large blocks.
The measurements included the following:• Underwater dumping of a large amount of rock transitionwith a high degree of fine material (T4) in the centralzone and simultaneously on both banks;• Construction of rockfill stabilisation on the downstreambank;• Raising the cofferdam by around 3 m.
The extensive works proved to be effective and themajor seepage was finally controlled.
The discharge capacities of the diversion tunnels werewell estimated, as defined by means of cross checkingthe upstream rating curve with the downstream one,determined from test results of the small scale hydraulicmodel.
The upper tunnels were inspected after the October1997 flood and only slight damage was found, as a resultof the high outflows.
Maximum velocities in the tunnels were estimatedbetween 14 and 15 m/s. The average overbreak measuredin the tunnels was 0.35m, resulting in a Manningcoefficient of roughness (n = 0.0285) for the theoreticalexcavation line.
During the diversion period, the tunnels beganoperating with high outflows and no problems, despite aflood of the same magnitude in April 1998.
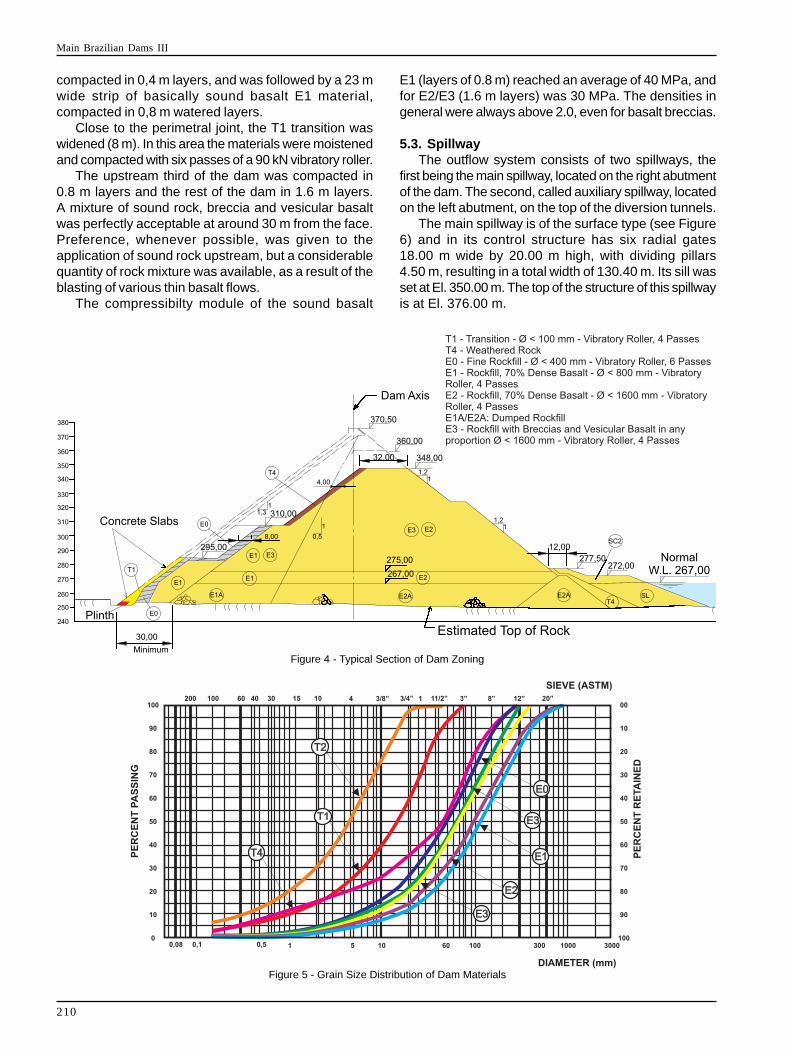
5.2. DamThe typical cross-section and zoning of the main dam
are given in Figure 4. Curves of classification, densitiesand permeability of the different materials used in thedam are shown in Figure 5.
A stiffer zone was provided behind the face slab witha 7 m width of a well graded crushed transition T1(3 to 2 m) and tunnel muck fine rockfill E0 (5 to 4 m), ofwhich plenty was available at the site. This was
Main Brazilian Dams III
210
compacted in 0,4 m layers, and was followed by a 23 mwide strip of basically sound basalt E1 material,compacted in 0,8 m watered layers.
Close to the perimetral joint, the T1 transition waswidened (8 m). In this area the materials were moistenedand compacted with six passes of a 90 kN vibratory roller.
The upstream third of the dam was compacted in0.8 m layers and the rest of the dam in 1.6 m layers.A mixture of sound rock, breccia and vesicular basaltwas perfectly acceptable at around 30 m from the face.Preference, whenever possible, was given to theapplication of sound rock upstream, but a considerablequantity of rock mixture was available, as a result of theblasting of various thin basalt flows.
The compressibilty module of the sound basalt
Figure 4 - Typical Section of Dam Zoning
Figure 5 - Grain Size Distribution of Dam Materials
E1 (layers of 0.8 m) reached an average of 40 MPa, andfor E2/E3 (1.6 m layers) was 30 MPa. The densities ingeneral were always above 2.0, even for basalt breccias.
5.3. SpillwayThe outflow system consists of two spillways, the
first being the main spillway, located on the right abutmentof the dam. The second, called auxiliary spillway, locatedon the left abutment, on the top of the diversion tunnels.
The main spillway is of the surface type (see Figure6) and in its control structure has six radial gates18.00 m wide by 20.00 m high, with dividing pillars4.50 m, resulting in a total width of 130.40 m. Its sill wasset at El. 350.00 m. The top of the structure of this spillwayis at El. 376.00 m.

Main Brazilian Dams III
211
The spillway chute downstream from this controlstructure was concrete lined over 195.05 m in extension.Its initial point is at El. 337.64 m and its slope is 19.65%.At the end of this chute is the deflector for launching thejet of water into the plunge pool. This plunge pool is around104 m downstream from the deflector, with its bed atEl. 245.00 m, outlet sill at El. 265.00 m, 70 m in lengthand totally excavated in the rock. A platform of 37 m inlength between the deflector and plunge pool is atEl. 300,00 m.
The purpose of this plunge pool was to reduce thewater flow velocities and oscillation in the water levelsnext to the downstream slope of the dam and the riverbanks downstream from the dam.
The auxiliary spillway is also of the surface type andin its control structure has four radial gates 18.00 m wideby 20.00 m high, with 4.50 m dividing pillars, resulting inthe total width of 85.50 m. Its sill was set at El. 350 m.The top of the structure of this spillway is atEl. 376,00 m. The typical section is shown in Figure 7.
The spillway chute downstream from this controlstructure with its starting point at El. 337.64 m and slopeof 19.6% was concrete lined over an extension of 120 m.In the rest of the downstream stretch over 167.90 m withslope of 12.50%, the bottom of the chute was merely
excavated in rock. The end of the this spillway's chute atEl. 294.00 m coincides with the outlet section of the toptunnels and the final launching of the jet of water goesdirectly into the outlet channel of these tunnels atEl. 254.00 m.
5.4. Headrace Channel and IntakeThe intake consists of a hollow gravity structure, with
maximum height of 35.50 m and downstream face slopeof 1V:0.18 H. The intakes are independent for the fivegenerator units and each of the blocks has two openingsbecause of the central pillar to support the trashracks.Each opening is fitted with two lines of slots for the gates,the downstream one corresponding to the emergencygate and the upstream to the stoplog.
The fixed wheel gate is designed to protect itsgenerator unit with an emergency closing of the intake,under any flow conditions of the turbine.
5.5. PenstocksThe penstocks were excavated in rock and concrete
lined. In their final stretch the penstocks are steel lined,designed to withstand the stresses from the transitoryregimes of the units.
The excavation of the stretch that starts at the intake,
Figure 7 - Longitudinal Section of Auxiliary Spillway
Figure 6 - Longitudinal Section of the Main Spillway
Main Brazilian Dams III
212
152.35 m in length, has a circular section with radius of8.00 m and length of around 155 m. The armoured stretchhas a horse-shoe section with diameter of 7.50 m andlength of 44.65 m and the following stretch as far as thespiral box with 18.35 m in length has a circular sectionwith diameter of 6.80 m.
5.6. PowerhouseThe indoor powerhouse, with five blocks for the
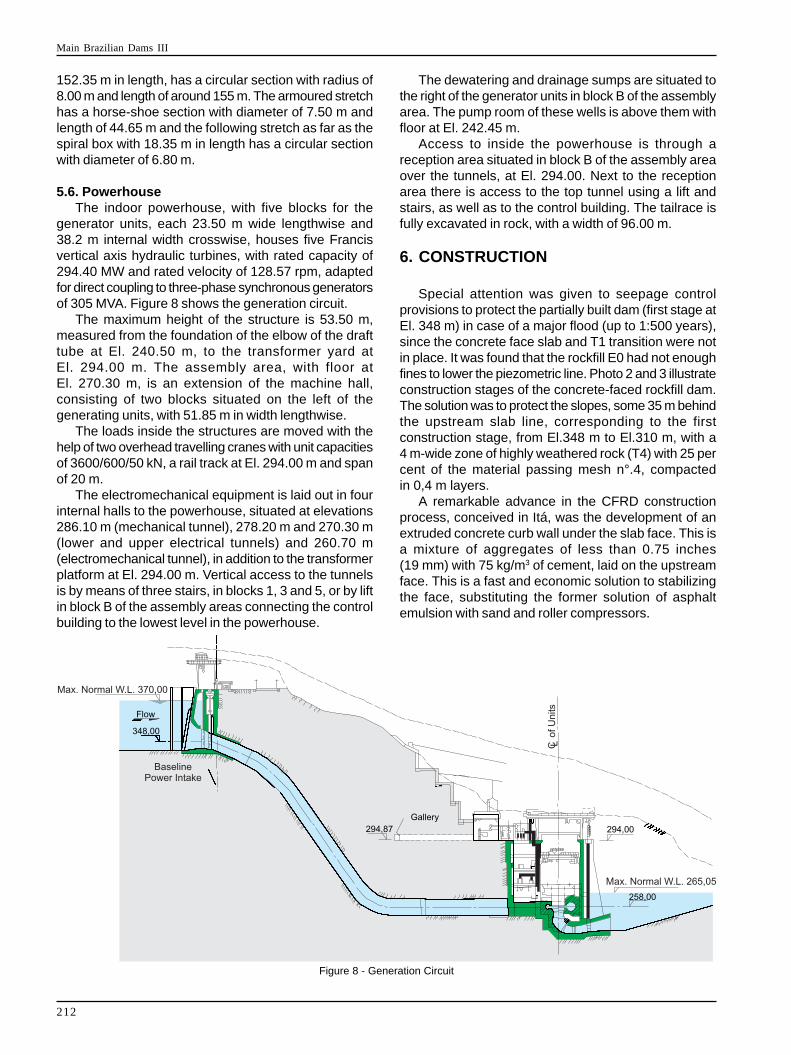
generator units, each 23.50 m wide lengthwise and38.2 m internal width crosswise, houses five Francisvertical axis hydraulic turbines, with rated capacity of294.40 MW and rated velocity of 128.57 rpm, adaptedfor direct coupling to three-phase synchronous generatorsof 305 MVA. Figure 8 shows the generation circuit.
The maximum height of the structure is 53.50 m,measured from the foundation of the elbow of the drafttube at El. 240.50 m, to the transformer yard atEl. 294.00 m. The assembly area, with floor atEl. 270.30 m, is an extension of the machine hall,consisting of two blocks situated on the left of thegenerating units, with 51.85 m in width lengthwise.
The loads inside the structures are moved with thehelp of two overhead travelling cranes with unit capacitiesof 3600/600/50 kN, a rail track at El. 294.00 m and spanof 20 m.
The electromechanical equipment is laid out in fourinternal halls to the powerhouse, situated at elevations286.10 m (mechanical tunnel), 278.20 m and 270.30 m(lower and upper electrical tunnels) and 260.70 m(electromechanical tunnel), in addition to the transformerplatform at El. 294.00 m. Vertical access to the tunnelsis by means of three stairs, in blocks 1, 3 and 5, or by liftin block B of the assembly areas connecting the controlbuilding to the lowest level in the powerhouse.
The dewatering and drainage sumps are situated tothe right of the generator units in block B of the assemblyarea. The pump room of these wells is above them withfloor at El. 242.45 m.
Access to inside the powerhouse is through areception area situated in block B of the assembly areaover the tunnels, at El. 294.00. Next to the receptionarea there is access to the top tunnel using a lift andstairs, as well as to the control building. The tailrace isfully excavated in rock, with a width of 96.00 m.
6. CONSTRUCTION
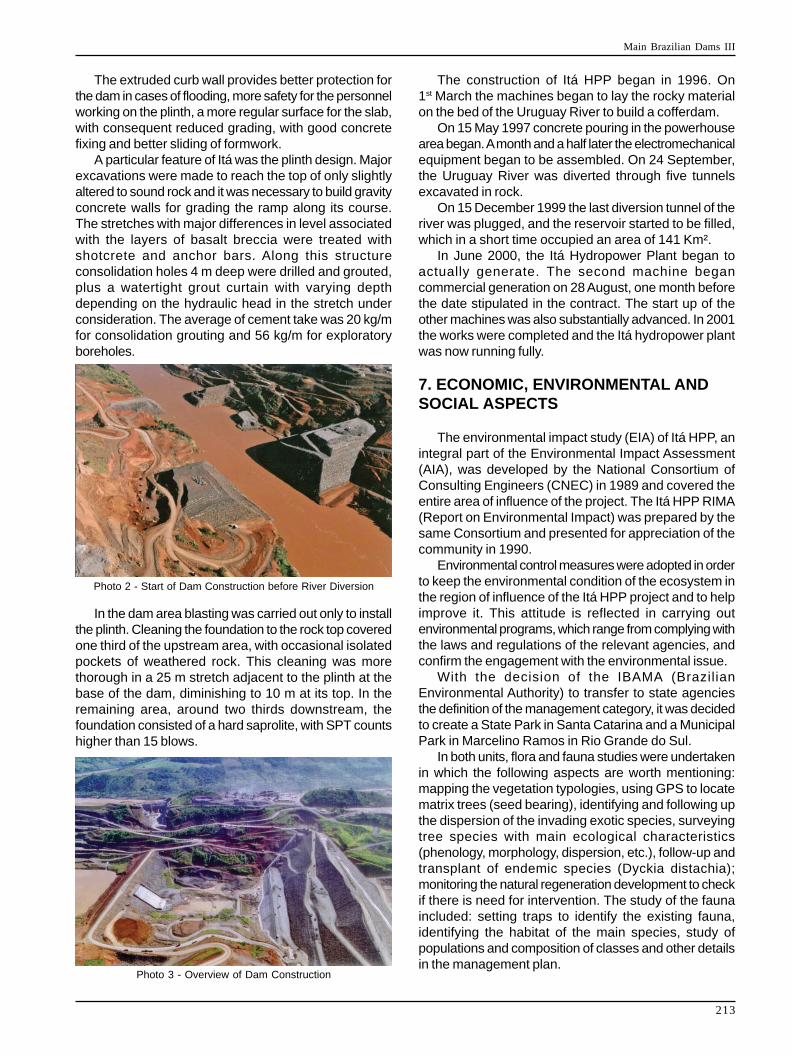
Special attention was given to seepage controlprovisions to protect the partially built dam (first stage atEl. 348 m) in case of a major flood (up to 1:500 years),since the concrete face slab and T1 transition were notin place. It was found that the rockfill E0 had not enoughfines to lower the piezometric line. Photo 2 and 3 illustrateconstruction stages of the concrete-faced rockfill dam.The solution was to protect the slopes, some 35 m behindthe upstream slab line, corresponding to the firstconstruction stage, from El.348 m to El.310 m, with a4 m-wide zone of highly weathered rock (T4) with 25 percent of the material passing mesh n°.4, compactedin 0,4 m layers.
A remarkable advance in the CFRD constructionprocess, conceived in Itá, was the development of anextruded concrete curb wall under the slab face. This isa mixture of aggregates of less than 0.75 inches(19 mm) with 75 kg/m3 of cement, laid on the upstreamface. This is a fast and economic solution to stabilizingthe face, substituting the former solution of asphaltemulsion with sand and roller compressors.
Figure 8 - Generation Circuit
Main Brazilian Dams III
213
The extruded curb wall provides better protection forthe dam in cases of flooding, more safety for the personnelworking on the plinth, a more regular surface for the slab,with consequent reduced grading, with good concretefixing and better sliding of formwork.
A particular feature of Itá was the plinth design. Majorexcavations were made to reach the top of only slightlyaltered to sound rock and it was necessary to build gravityconcrete walls for grading the ramp along its course.The stretches with major differences in level associatedwith the layers of basalt breccia were treated withshotcrete and anchor bars. Along this structureconsolidation holes 4 m deep were drilled and grouted,plus a watertight grout curtain with varying depthdepending on the hydraulic head in the stretch underconsideration. The average of cement take was 20 kg/mfor consolidation grouting and 56 kg/m for exploratoryboreholes.
Photo 2 - Start of Dam Construction before River Diversion
Photo 3 - Overview of Dam Construction
In the dam area blasting was carried out only to installthe plinth. Cleaning the foundation to the rock top coveredone third of the upstream area, with occasional isolatedpockets of weathered rock. This cleaning was morethorough in a 25 m stretch adjacent to the plinth at thebase of the dam, diminishing to 10 m at its top. In theremaining area, around two thirds downstream, thefoundation consisted of a hard saprolite, with SPT countshigher than 15 blows.
The construction of Itá HPP began in 1996. On1st March the machines began to lay the rocky materialon the bed of the Uruguay River to build a cofferdam.
On 15 May 1997 concrete pouring in the powerhousearea began. A month and a half later the electromechanicalequipment began to be assembled. On 24 September,the Uruguay River was diverted through five tunnelsexcavated in rock.
On 15 December 1999 the last diversion tunnel of theriver was plugged, and the reservoir started to be filled,which in a short time occupied an area of 141 Km².
In June 2000, the Itá Hydropower Plant began toactually generate. The second machine begancommercial generation on 28 August, one month beforethe date stipulated in the contract. The start up of theother machines was also substantially advanced. In 2001the works were completed and the Itá hydropower plantwas now running fully.
7. ECONOMIC, ENVIRONMENTAL ANDSOCIAL ASPECTS
The environmental impact study (EIA) of Itá HPP, anintegral part of the Environmental Impact Assessment(AIA), was developed by the National Consortium ofConsulting Engineers (CNEC) in 1989 and covered theentire area of influence of the project. The Itá HPP RIMA(Report on Environmental Impact) was prepared by thesame Consortium and presented for appreciation of thecommunity in 1990.
Environmental control measures were adopted in orderto keep the environmental condition of the ecosystem inthe region of influence of the Itá HPP project and to helpimprove it. This attitude is reflected in carrying outenvironmental programs, which range from complying withthe laws and regulations of the relevant agencies, andconfirm the engagement with the environmental issue.
With the decision of the IBAMA (BrazilianEnvironmental Authority) to transfer to state agenciesthe definition of the management category, it was decidedto create a State Park in Santa Catarina and a MunicipalPark in Marcelino Ramos in Rio Grande do Sul.
In both units, flora and fauna studies were undertakenin which the following aspects are worth mentioning:mapping the vegetation typologies, using GPS to locatematrix trees (seed bearing), identifying and following upthe dispersion of the invading exotic species, surveyingtree species with main ecological characteristics(phenology, morphology, dispersion, etc.), follow-up andtransplant of endemic species (Dyckia distachia);monitoring the natural regeneration development to checkif there is need for intervention. The study of the faunaincluded: setting traps to identify the existing fauna,identifying the habitat of the main species, study ofpopulations and composition of classes and other detailsin the management plan.
Main Brazilian Dams III
214
A private entity of públic interest was created in order totake care of the management of the Fritz PlaumannPark.This organization provided the incentive to extend themonitoring and refurbishing structures of the research centre.Supported by the Consortium Itá's incentive, improvementsare being implemented in the park's structure and actionsfor its smooth functioning. Highlights include the preparationof ecological trails, observation points, installing signs,improving visiting places and so on.
Local universities and researchers are takingsustainability actions in the park. Some worth mentioningare the monitoring of the fauna and also of the proliferationof exotic species, especially Hovenia dulcis (Japaneseraisintree) that, due to its high disseminating powerjeopardizes the development and regeneration of thenative species.
Under Decree no. 1994, dated 28 September 2005,the Severiano de Almeida town government created theMunicipal Environmental Preservation Park (PMPA) ofpublic domain, mainly in order to protect the naturalresources, flora and fauna, and to reconstitute the galleryforest. The land on which the PMPA was implementedcovers an area of 153,872 m² and was donated to theSeveriano de Almeida county by the Itá Consortium.
The socioeconomic aspect was another parameterconsidered when establishing the forest protection strip ofItá HPP, bearing in mind claims and aspirations of theMovement of those Affected by Dams (MAB, formerlyCRAB), in order to minimise the impact on the populationsthat occupy the areas to be vacated. The line wasestablished as expropriation elevation corresponding to astrip of at least 30 m measured from the normal maximumlevel of the reservoir (El. 370 m), all along the perimeter ofthe reservoir and to the elevation corresponding to the floodof a hundred-year recurrence interval, the most externalline being adopted. Accordingly, a strip of forest protectionwas created around the water line.
8. PERFORMANCE OF THE PROJECT
The Itá Hydropower Plant has a complete surveillancesystem. The monitoring instruments are distributed inthe concrete structures: powerhouse, intake andspillways; in the embankments: dikes and rockfill dam.Its measurements generally cover measures ofdeformations, stress, neutral pressure, temperature andseepage flow.
The concrete structures and powerhouse have thefollowing instrumentation installed: rod extensometers,mechanical tri-orthogonal gauges, electrical joint gauges,direct pendulum, no-stress boxes, thermometers,Casagrande piezometers, flow meters, observation wellsand surface benchmarks. Rod extensometers, flowmeters, Casagrande piezometers and observation wellsare installed in the spillways. Only Casagrandepiezometers are installed in the intake structure.
The instruments installed in the embankments are:Casagrande piezometers, flow meters, observation wellsand surface benchmarks.
Itá dam has three main sections with instrumentation.These sections are monitored using various instruments,as follows: magnetic settlement gauges and settlementcells (Swedish box) to measure the settlement; andmultiple rod extensometer KM type to measure horizontaldisplacements. In addition to these instruments thereare surface benchmarks spread throughout the dam thathelp follow up both vertical and horizontal displacements,and a triangular weir flow meter for controlling the seepageflows. The concrete facing is monitored by electro-levels,electric jointmeters and triorthogonal jointmeters.Figure 9 show the general location of these instruments.
These instruments provide satisfactory results andhave been in operation for approximately eight years.Today their behaviour shows a tendency to stabilisation,only slight settlements and horizontal deformationsremaining from the slow deformation process. The verticaldeformation values presented an increase of only 5% inrelation to the deformation measured on completing thefilling.
The largest settlements noted occurred in the sectionon the river bed (32+8.20 m), close to half the dam height,due to a favourable combination between the underlyinglayer and the pressure due to the overlying fill. At the endof the construction period the largest settlement observedwas 3,225 m in CR-10 installed at this benchmark, inthe central region of the embankment.
The deformability module values referring to the timeof Itá's construction were close to 50 MPa for theupstream zone (compacted materials with no more than80 cm) and 25 MPa for the downstream zone (compactedmaterials of 100 cm to 160 cm).
The multiple rod extensometers, located in theupstream area of the rockfill embankment, which duringthe construction stage indicated an upstreamdisplacement, during the reservoir impounding, began aninversion process in the displacement direction towardsdownstream. There is only a slight variation indisplacement between the reservoir filling and today,which shows that the dam is attaining a steady state.
The surface benchmarks installed in the crest of thedam behave quite similarly to that of the instrumentsinstalled inside the dam embankment in which the mostsignificant displacements occurred at the end of theconstruction and start of the filling, and now theseinstruments show a tendency to stabilise.
Deformations from settling and significant settlementsoccurred on the concrete slab of the upstream face duringthe construction period. The horizontal displacementsare characterized by their presenting a deformation ofthe shells to the centre of the structure in the top half ofthe dam, causing a narrowing, while the bottom half movesin the opposite direction, causing an opening in the base.During the filling period, however, the hydraulic head on

Main Brazilian Dams III
215
Figure 9 - Main Dam - Plan with Instrumentation
the upstream slope influenced the displacement of thedam, mainly on the upstream slope where the directionof displacement in the bottom part of this slope wasmodified. The largest displacement noted occurred in theelectro-level EN-9, which is installed at El. 309.00.
At the end of the construction (December 1999) thedisplacement observed in EN-9 was 12 cm in theupstream direction, but by the end of the filling thisdisplacement inverted direction and showed 45 cmdisplacement towards downstream. Figure 10 belowshows the displacements, in centimetres, perpendicularto the face of the concrete slab upstream, during thefilling of the dam.
Figure 10 - Displacements Perpendicular to the Slab (cm)
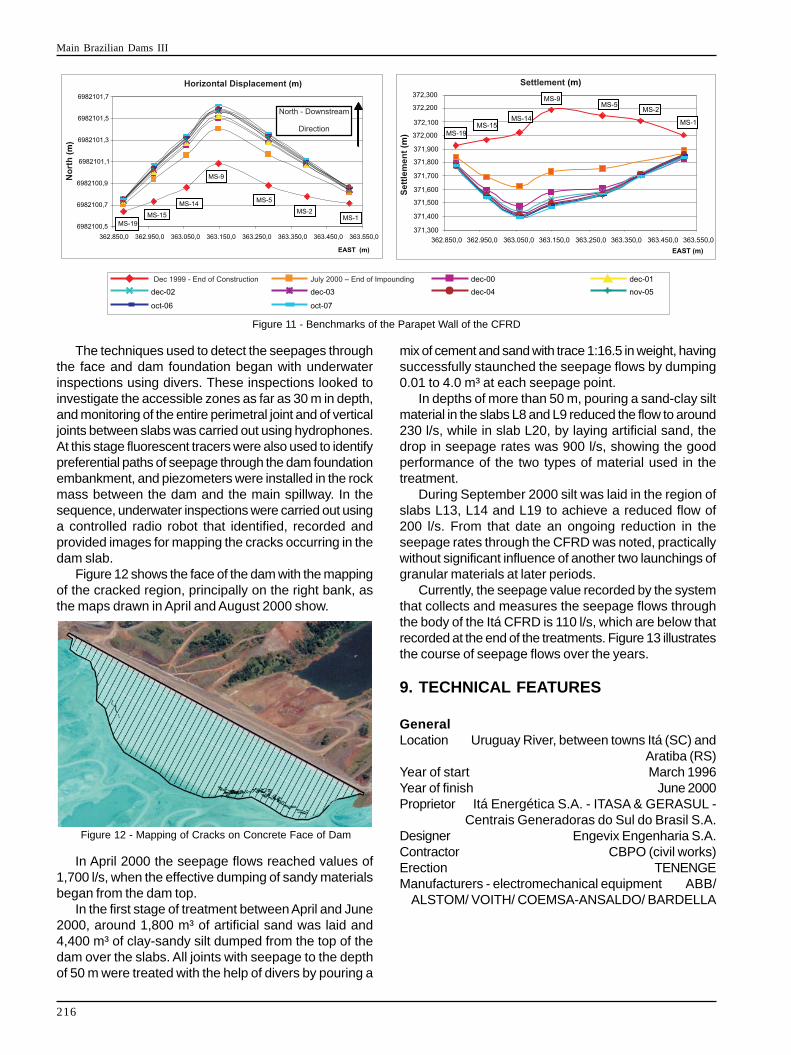
Figure 11 illustrates the horizontal displacements andsettlements of the parapet wall of the main dam measuredby the surface benchmarks.
The seepage rates through the Itá dam were firstrecorded when the reservoir level reached around 90 mfrom its maximum height. When the seepage ratesmonitored by the flow meter exceeded the 200 l/s mark,investigations were started in order to diagnose thepossible causes of this occurrence. The actions takento find the most suitable methodologies to solve theproblem began when the flows exceeded the level allowedas established by the designer in the OperatingHandbook of Instrumentation of the Itá HPP Structures(Qallowed = 500 l/s).
Main Brazilian Dams III
216
Figure 11 - Benchmarks of the Parapet Wall of the CFRD
The techniques used to detect the seepages throughthe face and dam foundation began with underwaterinspections using divers. These inspections looked toinvestigate the accessible zones as far as 30 m in depth,and monitoring of the entire perimetral joint and of verticaljoints between slabs was carried out using hydrophones.At this stage fluorescent tracers were also used to identifypreferential paths of seepage through the dam foundationembankment, and piezometers were installed in the rockmass between the dam and the main spillway. In thesequence, underwater inspections were carried out usinga controlled radio robot that identified, recorded andprovided images for mapping the cracks occurring in thedam slab.
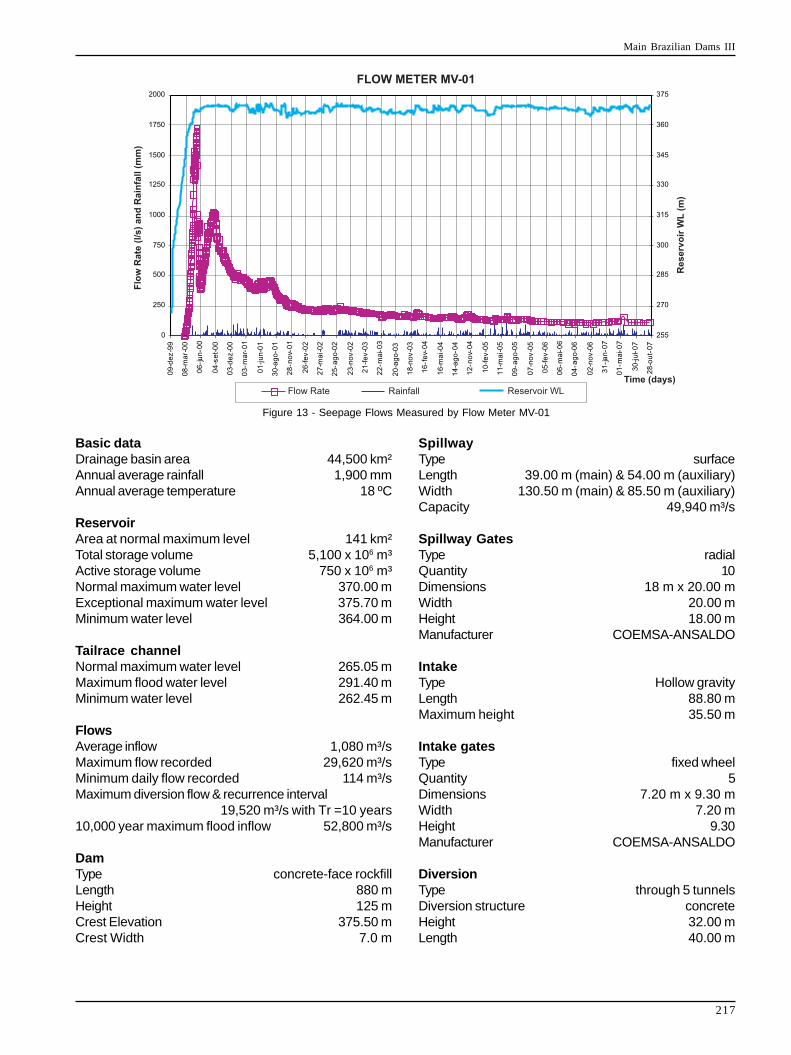
Figure 12 shows the face of the dam with the mappingof the cracked region, principally on the right bank, asthe maps drawn in April and August 2000 show.
Figure 12 - Mapping of Cracks on Concrete Face of Dam
In April 2000 the seepage flows reached values of1,700 l/s, when the effective dumping of sandy materialsbegan from the dam top.
In the first stage of treatment between April and June2000, around 1,800 m³ of artificial sand was laid and4,400 m³ of clay-sandy silt dumped from the top of thedam over the slabs. All joints with seepage to the depthof 50 m were treated with the help of divers by pouring a
mix of cement and sand with trace 1:16.5 in weight, havingsuccessfully staunched the seepage flows by dumping0.01 to 4.0 m³ at each seepage point.
In depths of more than 50 m, pouring a sand-clay siltmaterial in the slabs L8 and L9 reduced the flow to around230 l/s, while in slab L20, by laying artificial sand, thedrop in seepage rates was 900 l/s, showing the goodperformance of the two types of material used in thetreatment.
During September 2000 silt was laid in the region ofslabs L13, L14 and L19 to achieve a reduced flow of200 l/s. From that date an ongoing reduction in theseepage rates through the CFRD was noted, practicallywithout significant influence of another two launchings ofgranular materials at later periods.
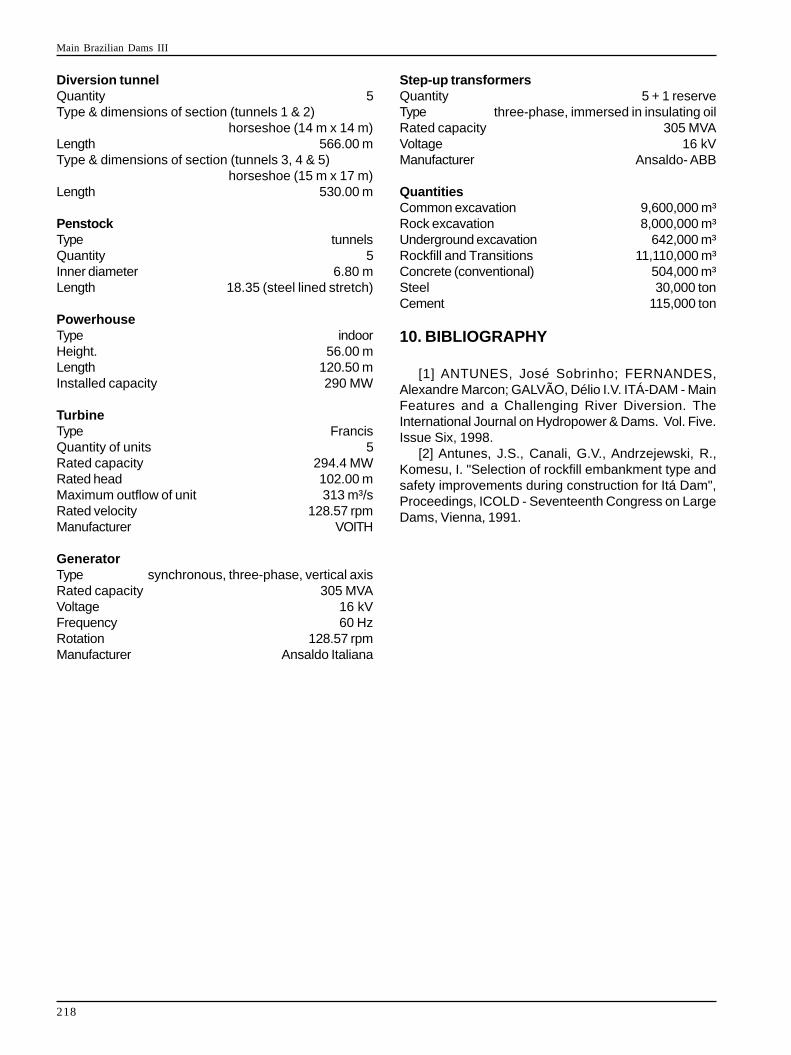
Currently, the seepage value recorded by the systemthat collects and measures the seepage flows throughthe body of the Itá CFRD is 110 l/s, which are below thatrecorded at the end of the treatments. Figure 13 illustratesthe course of seepage flows over the years.
9. TECHNICAL FEATURES
GeneralLocation Uruguay River, between towns Itá (SC) and
Aratiba (RS)Year of start March 1996Year of finish June 2000Proprietor Itá Energética S.A. - ITASA & GERASUL -
Centrais Generadoras do Sul do Brasil S.A.Designer Engevix Engenharia S.A.Contractor CBPO (civil works)Erection TENENGEManufacturers - electromechanical equipment ABB/
ALSTOM/ VOITH/ COEMSA-ANSALDO/ BARDELLA
Main Brazilian Dams III
217
Figure 13 - Seepage Flows Measured by Flow Meter MV-01
Basic dataDrainage basin area 44,500 km²Annual average rainfall 1,900 mmAnnual average temperature 18 ºC
ReservoirArea at normal maximum level 141 km²Total storage volume 5,100 x 106 m³Active storage volume 750 x 106 m³Normal maximum water level 370.00 mExceptional maximum water level 375.70 mMinimum water level 364.00 m
Tailrace channelNormal maximum water level 265.05 mMaximum flood water level 291.40 mMinimum water level 262.45 m
FlowsAverage inflow 1,080 m³/sMaximum flow recorded 29,620 m³/sMinimum daily flow recorded 114 m³/sMaximum diversion flow & recurrence interval
19,520 m³/s with Tr =10 years10,000 year maximum flood inflow 52,800 m³/s
DamType concrete-face rockfillLength 880 mHeight 125 mCrest Elevation 375.50 mCrest Width 7.0 m
SpillwayType surfaceLength 39.00 m (main) & 54.00 m (auxiliary)Width 130.50 m (main) & 85.50 m (auxiliary)Capacity 49,940 m³/s
Spillway GatesType radialQuantity 10Dimensions 18 m x 20.00 mWidth 20.00 mHeight 18.00 mManufacturer COEMSA-ANSALDO
IntakeType Hollow gravityLength 88.80 mMaximum height 35.50 m
Intake gatesType fixed wheelQuantity 5Dimensions 7.20 m x 9.30 mWidth 7.20 mHeight 9.30Manufacturer COEMSA-ANSALDO
DiversionType through 5 tunnelsDiversion structure concreteHeight 32.00 mLength 40.00 m
Main Brazilian Dams III
218
Diversion tunnelQuantity 5Type & dimensions of section (tunnels 1 & 2)
horseshoe (14 m x 14 m)Length 566.00 mType & dimensions of section (tunnels 3, 4 & 5)
horseshoe (15 m x 17 m)Length 530.00 m
PenstockType tunnelsQuantity 5Inner diameter 6.80 mLength 18.35 (steel lined stretch)
PowerhouseType indoorHeight. 56.00 mLength 120.50 mInstalled capacity 290 MW
TurbineType FrancisQuantity of units 5Rated capacity 294.4 MWRated head 102.00 mMaximum outflow of unit 313 m³/sRated velocity 128.57 rpmManufacturer VOITH
GeneratorType synchronous, three-phase, vertical axisRated capacity 305 MVAVoltage 16 kVFrequency 60 HzRotation 128.57 rpmManufacturer Ansaldo Italiana
Step-up transformersQuantity 5 + 1 reserveType three-phase, immersed in insulating oilRated capacity 305 MVAVoltage 16 kVManufacturer Ansaldo- ABB
QuantitiesCommon excavation 9,600,000 m³Rock excavation 8,000,000 m³Underground excavation 642,000 m³Rockfill and Transitions 11,110,000 m³Concrete (conventional) 504,000 m³Steel 30,000 tonCement 115,000 ton
10. BIBLIOGRAPHY
[1] ANTUNES, José Sobrinho; FERNANDES,Alexandre Marcon; GALVÃO, Délio I.V. ITÁ-DAM - MainFeatures and a Challenging River Diversion. TheInternational Journal on Hydropower & Dams. Vol. Five.Issue Six, 1998.
[2] Antunes, J.S., Canali, G.V., Andrzejewski, R.,Komesu, I. "Selection of rockfill embankment type andsafety improvements during construction for Itá Dam",Proceedings, ICOLD - Seventeenth Congress on LargeDams, Vienna, 1991.


Recommended