ITUC
R
epoR
TIT
UC, I
nter
natio
nal T
rade
Uni
on C
onfe
dera
tion
Janu
ary
2008
ITUC
R
epoR
TIT
UC, I
nter
natio
nal T
rade
Uni
on C
onfe
dera
tion
Febr
uary
200
8
The Global Gender pay Gap

The International Trade Union Confederation (ITUC) represents 168 million work-ers, 40 percent of whom are women, in 155 countries and territories and has 311 national affiliates.
The ITUC is a confederation of national trade union centres, each of which links together the trade unions of that particular country. Membership is open to all democratic, independent and representative national trade union centres.
The ITUC’s primary mission is the promotion and defence of workers’ rights and in-terests, through international cooperation between trade unions, global campaigning and advocacy within the major global institutions. Its main areas of activity include trade union and human rights, the economy, society and the workplace, equality and non-discrimination as well as international solidarity. The ITUC adheres to the princi-ples of trade union democracy and independence, as set out in its Constitution.
_ ITUC 5 Boulevard du Roi Albert II, Bte 1 1210 Brussels Belgium Phone: +32 (0)2 224 0211 Fax: +32 (0)2 201 5815 E-mail: mailto:[email protected] www.ituc-csi.org
The Global Gender Pay Gap


The Global Gender Pay Gap
Table of contents
Introduction 9
Summary of findings 10 Global data 12
World map 21 European map 22
The influence of free trade and internationa 23 agreements on the gap
WageIndicator findings 27
Comparing the publicly available official sources 46 with WageIndicator data
Literature review 47 Methodology 51
The challenges ahead 53

This report was researched and written by Incomes Data Services (IDS), UK research partner of the WageIndicator Foundation, on behalf of the International Trade Union Confederation.
The report was researched and written by:
Catherine ChubbSimone MelisLouisa PotterRaymond Storry
Incomes Data Services23 College HillLondon EC4R 2RP
Telephone: 020 7429 6800Facsimile: 020 7393 8081E-mail: [email protected]: www.incomesdata.co.uk
Copyright © Incomes Data Services 2008
The appendices to this report are available in English at the following internet address:http://www.ituc-csi.org/IMG/pdf/GPG_Report_Final_21_Feb_tra_version.pdf
The ITUC gratefully acknowledges the support of the FNV Netherlands in the production of this report.

7
Foreword by ITUC President Sharan Burrow16% LESS IN THE PAY PACKET –WHY?
This report reveals in detail the extent of discrimination women face in being paid equal to men for performing the same work around the globe. The report also sets a real challenge for governments and employers to respond to union calls for a renewed effort to tackle the gender pay gap.
Despite decades of anti-discrimination legislation and changes in company rhetoric, women, whether they are in New York or Shanghai, find their pay cheque contains on average sixteen per cent less than male co-workers.
That is the official figure, derived from applying a standard method across sixty-three countries. However trade unions in a number of countries report the real gap to be even higher.
Hundreds of millions of women working in informal and unprotected work do not appear in any records, and many developing countries do not have the means, or in some cases the will, to keep national records on the world of work. This is a huge deficit in the global knowledge base, and one for which the international community as a whole must take responsibility.
Many believe education is the key to closing the gap, but on the contrary, one of the most sobering findings of this report is that more educated women often find themselves on the wrong side of an even bigger pay gap.
While globalization can sometimes appear to be narrowing the gender gap – in fact women’s pay is not rising at all, instead the increasingly competitive global labour market is responsible for driving down the wages of men.
The positive news for workers around the world is that trade unions are succeeding in bridging the pay divide.
Through collective bargaining, women and men both get a better, more equal deal.
And through our campaigns about equality, unions play a vital role in educating and informing workers about gender pay issues, in the face of strong resistance from some governments and employers.
Unions are resolved to continue and strengthen this work. We must ensure women in all corners of the world, employed across different industries and performing hundreds of different jobs each day, can achieve equal pay.

8
Launched on 8 March 2008, the ITUC’s new Decent Work – Decent Life for Women campaign takes this work to the global level, and equality for working women will be a major feature of the World Day for Decent Work, on 7 October this year.

9
March 8 is International Women’s Day (IWD). IWD originated from Socialist women’s movements in the US and Europe at the beginning of the last century, although some historians claim that it has its roots in the US some 50 years before that. The event gained momentum from a Socialist International meeting in Copenhagen in 1910, where an International Womens’ Day was proposed to ‘honour the womens’ rights movement and to assist in achieving universal suffrage for women’1. During the first decades of the 20th century, the IWD movement campaigned for womens’ rights to work, vote, be trained, hold public office and to end discrimination. Over the years, IWD has evolved into an internationally recognised day to pay attention to womens’ rights and equal participation in all spheres of political, economic and social life.
The International Trade Union Confederation (ITUC) has decided to draw attention to the existing inequalities between male and female earnings around the world on IWD 2008. For this purpose, Incomes Data Services (IDS) was asked to research and write a report which investigates the gender pay gap, based on publicly available sources (such as Eurostat and the International Labour Organisation (ILO) statistics) and WageIndicator; a database that holds pay data collected through an international, self-reporting internet-based survey.
IDS has calculated the gender pay gap for 63 countries from the publicly available data, which includes 30 European countries and 33 countries in the rest of the world. Data from 2006 are used where possible, although sometimes the most recent figures available are from 2004, 2005 or further back, with 2001 as the cut-off point. The time series graphs illustrate the dynamics of the pay gap from 1996 until 2006 for a selected number of countries, although some did not have data available for every year. This explains the line breaks in the graphs. The WageIndicator data concentrates on 12 countries, using data collected during 2006 and the second and third quarters of 2007.
The first part of this report looks at the publicly available sources on the gender pay gap. It shows the most recent figures and time series for a number of countries and provides a short analysis of the results. The WageIndicator data complements these figures by focusing on twelve countries. For these countries, the pay gap is broken down by more specific variables, such as education, occupational sector, working hours, and trade union membership. The literature review in the next chapter provides an analytical and theoretical framework which will set out in more detail the possibilities and limitations connected with research on the gender pay gap. The limitations of the methodologies used to calculate the gap in an internationally comparable way are explored, along with the implications this has for successful policy-making. The last chapter sets out key recommendations on how to tackle the gender pay gap.
1 http://www.internationalwomensday.com/
Introduction
10
Summary of finding
There is a wealth of literature and data available on this topic. This report does not have the aim to present a complete systematic review of all the existing information. Rather, it seeks to give an overview of the latest trends and figures in the area of gender pay gap research.
The world average gender pay gap is 15.6 per cent according to the •IDS analysis of publicly available data sources, with Europe, Oceania and Latin America generally showing more positive results than Asia and Africa, for which the data availability is limited. If we exclude Bahrain, where a positive gap of 40% is shown (due possibly to very low female participation in paid employment), the global figure is 16.5%
The gender pay gap is unable to capture female participation in the •informal economy, which particularly distorts the pay gap figures in countries where such economies are large, such as in Africa, the Middle East, South Asia and Latin America
Research has shown that the implementation of the Equal Pay Convention •100 of the International Labour Organisation has a positive impact on a country’s gender pay gap, and that economic competition may also have a positive effect, but the precise impact of this is not clear because it is often part of a wider set of policy initiatives to combat inequalities in society
WageIndicator (http://www.wageindicator.org), an on-line salary survey •of 12 countries covering almost 400,000 respondents, shows that the average pay gap in the participating countries ranges between 13 and 23 per cent
The WageIndicator survey also shows that trade union membership has •a positive influence on the gender pay gap, with the gap in the majority of countries being lower for unionised employees than for employees who are not a member of a trade union
WageIndicator data finds that women are often educated equally high as •men, or to a higher level. Higher education of women does not necessarily lead to a smaller pay gap, however, and in some cases the gap actually increases with the level of education obtained.
According to research by the European Commission, the pay gap in •European Union member states increases with age, years of service and education.
11
The pay gap tends mainly to be higher in female-dominated work •environments (such as health, education and social work) than in male-dominated environments, which is probably due to the fact that managerial positions in these sectors are often held by men, and women in these sectors frequently work in the often lower-paid part-time roles
Other sectors which consistently show a high pay gap in a number of •countries are the mining industry, the utilities sector, and the financial services sector. Public administration and other community, social and personal services generally show a lower pay gap.
The figures referred to in this report are derived from different sources, such as Eurostat, ILO, WageIndicator and a selection of articles published on this topic. WageIndicator is based on individuals reporting their own salaries through an internet-based survey and as a result does not include people without access to a computer and the Internet, and those who are not computer literate. This may influence its findings. Furthermore, Eurostat and ILO base their figures on national sources that use different methodologies to calculate individual earnings. Because of this lack in consistency concerning data collection and methodology, and the data deficiencies in a number of countries, caution has to be applied when interpreting and comparing pay gap information from different sources across countries. As is argued in the conclusion of this report, international agreement on the gender pay gap definition and on the methodology used for its calculation is necessary to deal with these issues. In order to come to such an agreement, the elimination of the gender pay gap has to become a priority on the agendas of governments, trade unions and employers.
12
This section presents an analysis of the official figures available on the gender pay gap around the world. The findings featured below are based on the worldwide data detailing male and female earnings, from which IDS has calculated the gender pay gap. There are some issues with the quality of the data, and in some circumstances the figures quoted below may not be directly comparable since they are based on different measurements of income and have not been weighted to factor the influence of part-time employment on the gender pay gap. There have also been some difficulties in the worldwide availability of statistics on economic activity. These issues will be discussed in more detail in the methodology chapter in this report.
Data for the 30 European countries featured in this report is sourced from the European Commission (Eurostat). ILO data has been sourced for the rest of the world; see Appendix 3 [http://www.ituc-csi.org/IMG/pdf/GPG_Report_Final_21_Feb.pdf] for the relevant reference. The International Labour Organisation collects official statistics on the labour force and its characteristics from national authorities. The individual country data series vary in the way in which they have been collected and in the detail that they contain. This inevitably has an impact on the quality of the data for global analysis purposes. Additionally the data used in this report does not capture non-formal types of economic activity and earnings. This results in the gender pay gap being either under or over-reported in official statistics, including where certain forms of predominantly-female work is either unpaid or informal.
Global overview
There are 245 recognised entities in the world. IDS has been able to calculate the gender pay gap for 63 countries in total - 30 in Europe and 33 across the rest of the world (see gender pay gap maps). Based on this the world average gender pay gap using the IDS methodology was 15.6 per cent, meaning women earn on average 84.8 per cent of men’s earnings. If we exclude Bahrain, where a positive gap of 40% is shown (due possibly to very low female participation in paid employment), the global figure is 16.5%. The general trend shows that Europe, Oceania and Latin America fare better when compared with Asia and Africa, where female economic participation is generally low and there are large informal economies which the official data is unable to capture.
Regional analysis
Africa
There are large informal economies across Africa and much of women’s work,
Global data

13
either informal or unpaid family work, is not sufficiently recorded. For these reasons there is little official pay data by gender obtainable for African nations. Botswana data shows a widening gender pay gap between 1998 and 2005 with the current gap at 23.2 per cent. The time series graph for Africa shows the gender pay gap in Egypt widening after 1996 and peaking at 26 per cent in 2000. After this peak, the gap between men’s and women’s earnings has fallen to 12.4 per cent in 2005.
Asia
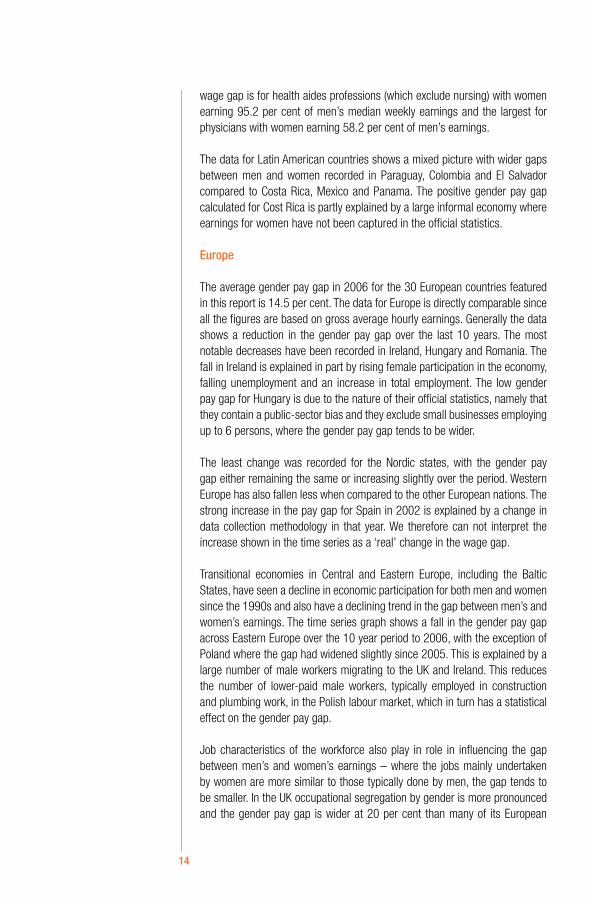
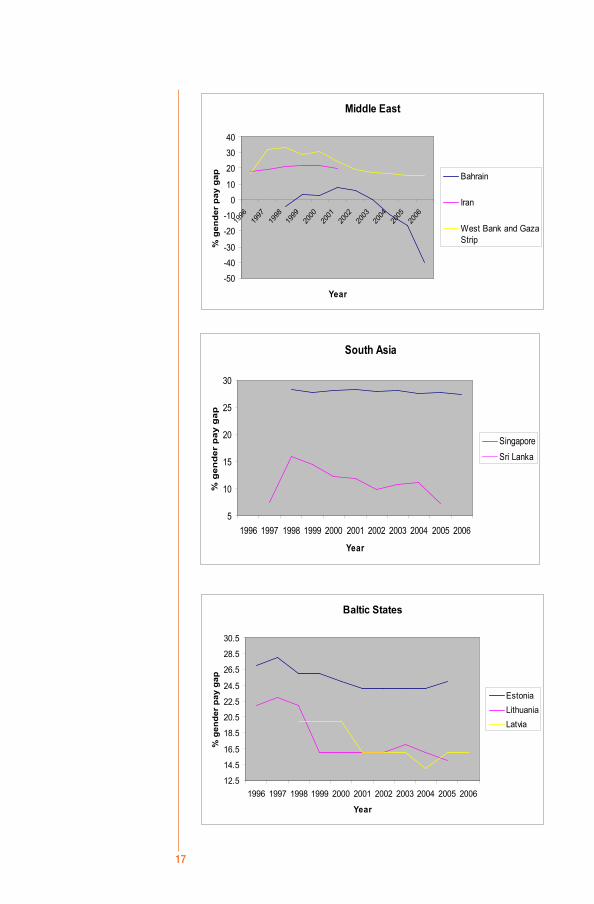
The data shows a significantly wider gap between men’s and women’s earnings in Asia than the world average. This is more pronounced where there are transitional economies, for example in Armenia, Georgia and Kazakhstan. There is also a much wider gender pay gap for Japan and the Republic of Korea where traditionally women have been under represented in the formal labour market. The average gender pay gap in 2005 for the Asian countries featured in our analysis is 17.6 per cent (median 16.1 per cent). When we exclude the figure for Bahrain (which has an inverse pay gap of 40 per cent), the average is 21.2 per cent (median 16.4 per cent). The most variance in the gender pay gap was recorded in Asia due to the nature of the individual country labour markets. More progress has been made in the Middle East and Central Asia than in South and East Asia. The data for Mongolia, Hong Kong and Sri Lanka shows a relatively smaller gap compared with the rest of Asia. The data shows a positive gender pay gap in Bahrain. This is explained in part by the low participation of women in the workforce, but those women that do work are more likely to be highly educated, highly skilled and in higher paid jobs. Overall, the gender pay gap in South and East Asia is slowly narrowing. The data for the West Bank and Gaza Strip shows a fall in the gender pay gap driven by a growing number of women participating in the labour market, although overall the gap remains wide since women remain disproportionately represented.
Americas
The data is split between the USA and Canada and Latin America. Collection of data on the gender pay gap in the USA does not seem to have been a priority for the US Government and we were therefore unable to source time series data. The same is also true for Canada. According to the Canadian Labour Congress, women earn 72.5 cents per each dollar earned by a man, representing a gender pay gap of 27.5 per cent. For the USA, 2007 data from the US Census Bureau points out that women are paid 77.6 per cent of men’s hourly earnings which indicates an average gender pay gap of 23 per cent. Figures by state vary but there is typically a gap of between 20 and 25 per cent in men’s and women’s earnings. According to figures produced by the American Federation of Labor – Congress of Industrial Organisations (AFL-CIO), which are based on median weekly earnings of full-time employees as measured by the US Bureau of Statistics2, the gender pay gap by occupation varies significantly. The lowest 2 Highlights of Women’s Earnings in 2002, September 2003, Report 972.
14
wage gap is for health aides professions (which exclude nursing) with women earning 95.2 per cent of men’s median weekly earnings and the largest for physicians with women earning 58.2 per cent of men’s earnings.
The data for Latin American countries shows a mixed picture with wider gaps between men and women recorded in Paraguay, Colombia and El Salvador compared to Costa Rica, Mexico and Panama. The positive gender pay gap calculated for Cost Rica is partly explained by a large informal economy where earnings for women have not been captured in the official statistics.
Europe
The average gender pay gap in 2006 for the 30 European countries featured in this report is 14.5 per cent. The data for Europe is directly comparable since all the figures are based on gross average hourly earnings. Generally the data shows a reduction in the gender pay gap over the last 10 years. The most notable decreases have been recorded in Ireland, Hungary and Romania. The fall in Ireland is explained in part by rising female participation in the economy, falling unemployment and an increase in total employment. The low gender pay gap for Hungary is due to the nature of their official statistics, namely that they contain a public-sector bias and they exclude small businesses employing up to 6 persons, where the gender pay gap tends to be wider.
The least change was recorded for the Nordic states, with the gender pay gap either remaining the same or increasing slightly over the period. Western Europe has also fallen less when compared to the other European nations. The strong increase in the pay gap for Spain in 2002 is explained by a change in data collection methodology in that year. We therefore can not interpret the increase shown in the time series as a ‘real’ change in the wage gap.
Transitional economies in Central and Eastern Europe, including the Baltic States, have seen a decline in economic participation for both men and women since the 1990s and also have a declining trend in the gap between men’s and women’s earnings. The time series graph shows a fall in the gender pay gap across Eastern Europe over the 10 year period to 2006, with the exception of Poland where the gap had widened slightly since 2005. This is explained by a large number of male workers migrating to the UK and Ireland. This reduces the number of lower-paid male workers, typically employed in construction and plumbing work, in the Polish labour market, which in turn has a statistical effect on the gender pay gap.
Job characteristics of the workforce also play in role in influencing the gap between men’s and women’s earnings – where the jobs mainly undertaken by women are more similar to those typically done by men, the gap tends to be smaller. In the UK occupational segregation by gender is more pronounced and the gender pay gap is wider at 20 per cent than many of its European

15
comparators. The European Commission3 of the states that ‘a high pay gap is usually characteristic of a labour market which is highly segregated (eg Cyprus, Estonia, Slovakia, Finland) or in which a significant proportion of women work part-time (eg Germany, UK, the Netherlands, Austria, Sweden). Institutional mechanisms and systems on wage setting can also influence the pay gap’.
OceaniaThe gender pay gap in New Zealand has been steadily declining, falling from 18 per cent in 1996 to 12.8 per cent in 2005. There is also a fairly good proportion of females employed in the economy. The data collected by the ILO for Australia is collected on a bi-annual basis, however the trend suggests that the gender pay gap has widened. This is explained by a change in policy. The data featured in the time series graph charts the gender pay gap in Australia until 2004. More recent data from the Employee Earnings and Hours Survey (Australian Bureau of Statistics) shows that between 2004 and 2006 the gap has widened, rising from women earning 87 cents for each AUD$1 earned by men to 84 cents in 2006. This represents a widening of the gender pay gap from 13 to 16 per cent. A possible explanation of this is the introduction of ‘WorkChoices’, the previous Government’s workplace relations system, which restricted trade union rights and reduced the number of employees covered under collective agreements. This had more of an impact on disadvantaged workers, which include lower-paid and part-time workers, who are more likely to be women.
3 Communication from the European Commission (2007), Tackling the Pay Gap between Women and Men, p.4.

16
Africa
0
5
10
15
20
25
30
1996 1997 1998 1999 2000 2001 2002 2003 2004 2005
Year
% g
ende
r pa
y ga
p
BotswanaEgyptSaint Helena
Central Asia
0
10
20
30
40
50
60
70
1996 1997 1998 1999 2000 2001 2002 2003 2004 2005 2006
Year
% g
end
er p
ay g
ap
ArmeniaGeorgiaKazakstanMongolia
Eastern Asia
323334353637383940
1996
1997
1998
1999
2000
2001
2002
2003
2004
2005
2006
Year
% g
end
er p
ay g
ap
JapanRepublic of Korea
17
Baltic States
12.5
14.5
16.5
18.5
20.5
22.5
24.5
26.5
28.5
30.5
1996 1997 1998 1999 2000 2001 2002 2003 2004 2005 2006
Year
% g
ende
r pa
y ga
p
EstoniaLithuaniaLatvia
Middle East
-50
-40
-30
-20
-10
0
10
20
30
40
1996
1997
1998
1999
2000
2001
2002
2003
2004
2005
2006
Year
% g
ende
r pa
y ga
p Bahrain
Iran
West Bank and GazaStrip
South Asia
5
10
15
20
25
30
1996 1997 1998 1999 2000 2001 2002 2003 2004 2005 2006
Year
% g
end
er p
ay g
ap
SingaporeSri Lanka

18
Central Europe
10
12
14
16
1820
22
24
26
28
1996 1998 2000 2002 2004 2006
Year
% g
ende
r pa
y ga
p
AustriaSwitzerlandCzech RepublicHungarySlovakia
British Isles
7.5
10
12.5
15
17.5
20
22.5
25
1996
1997
1998
1999
2000
2001
2002
2003
2004
2005
2006
Year
% g
ende
r pay
gap
IrelandUnited Kingdom
Eastern Europe
579
1113151719212325
1996 1997 1998 1999 2000 2001 2002 2003 2004 2005 2006
Year
% g
ende
r pa
y ga
p
BulgariaCroatiaPolandRomaniaSlovenia

19
Iberian Penninsula
2.54.56.58.5
10.512.514.516.518.520.522.5
1996 1997 1998 1999 2000 2001 2002 2003 2004 2005 2006
Year
% g
ende
r pay
gap
PortugalSpain
Nordic Region
10
12
14
16
18
20
22
1996 1997 1998 1999 2000 2001 2002 2003 2004 2005 2006
Year
% g
ende
r pa
y ga
p
DenmarkFinlandNorwaySweden
Southern Europe
0
5
10
15
20
25
30
1996 1997 1998 1999 2000 2001 2002 2003 2004 2005 2006
Year
% g
ende
r pay
gap
CyprusGreeceItalyMalta

20
Oceania
8.0
10.0
12.0
14.0
16.0
18.0
20.0
1996 1998 2000 2002 2004
Year
% g
ende
r pay
gap
AustraliaNew Zealand
Western Europe
579
1113151719212325
1996
1997
1998
1999
2000
2001
2002
2003
2004
2005
2006
Year
% g
ende
r pa
y ga
p
Belgium
Germany (including ex-GDR from 1991)France
Luxembourg (Grand-Duché)Netherlands
Latin America
-15.0
-10.0
-5.0
0.0
5.0
10.0
15.0
20.0
25.0
30.0
1996
1997
1998
1999
2000
2001
2002
2003
2004
2005
2006
Year
% g
ende
r pa
y ga
p BrazilColombiaCosta RicaEl SalvadorMexicoPanama

21
Glo
bal G
ende
r Pay
Gap
200
6
Key
: ***
= 2
007,
† =
200
5, ‡
= 2
004,
* =
200
3, †
† =
2002
, **
= 20
01
Sou
rces
: Int
erna
tiona
l Lab
our O
rgan
isat
ion;
exc
ept A
ustra
lia -
Aus
tralia
n B
urea
u of
Sta
tistic
s, C
anad
a - C
anad
ian
Labo
ur C
ongr
ess,
US
A –
AFL
-CIO
Colo
mbi
a

22
European Gender Pay Gap 2006
Key: p= provisional, †= 2005. Source: Eurostat

23
The academic research on the effects and influences of trade liberalization and increased international economic competition on the gender pay gap produces conflicting evidence. On the one hand, economic theory argues for a decrease in the gap due to international trade. The increased competition as a result of opening up the market to free trade would eliminate a firm’s excess profits, which would otherwise be used as a source that allows firms to discriminate. The underlying thought is that discriminatory practices impose additional costs on the firm. In other words, increased international competition as a result of free trade puts pressure on a firm’s profit margins and simultaneously requires increased productivity, thereby taking away the resources for a firm to fund gender wage discrimination1. Empirical evidence, however, paints a more complex picture and in some cases also contradicts this theory.
Based on their research, Weichselbaumer and Winter-Ebmer state that ‘countries with a higher economic freedom have a lower gender wage residual than others’, although they also maintain that ‘market orientation can have both a limiting as well as furthering influence on gender wage differentials’2. A study on the effects of trade liberalization on the gender wage gap in Mexico, for example, found that this country’s trade liberalization process produced an increased gender wage gap that can be attributed to general movements in the economy during the period of trade liberalization, and an increased premium to skills. At the same time, it also found evidence, albeit suggestive, that the gap decreased particularly in those industries that were forced most strongly to become more competitive, requiring those industries to abandon their unequal practices against women3. The authors therefore conclude that trade can potentially be beneficial to women by decreasing discrimination, but any improvement in women’s relative wages will depend on other factors as well, such as programmes to improve women’s education and skills to be able to better compete in a competitive market. In another research project, about the effects of increased openness to trade in the manufacturing industry in India, the enforcement of equal pay and equal opportunities legislation, improved labor standards and the eradication of employer practices that favor male workers are mentioned as instruments to tackle the gender pay gap4. This study has produced evidence for a widening in the wage gap among India’s manufacturing workers, which the authors relate to the weaker bargaining power of female employees and their lower status in the workplace compared to 1 Becker, G. (1971), The Economics of Discrimination. 2 Weichselbaumer, D. and R. Winter-Ebmer (2007), The Effects of Competition and Equal Treatment Laws on Gender Wage Differentials, pp. 272-273. See also page 49 of this report.
3 Artecona, R. and W. Cunningham (2002), Effects of Trade Liberalization on the Gender Wage Gap in Mexico. 4 Menon, N. and Y. Van der Meulen-Rodgers (2006), The Impact of Trade Liberalization on Gender Wage Differentials in India’s Manufacturing Sector.
International influences on the gap
24
their male colleagues. This makes it more difficult for them to negotiate higher wages, and leaves them vulnerable to exploitation in a sector characterised by high pressures to cut costs. These findings result in the conclusion that the impact of trade liberalization on poverty and inequality is mixed, with women ‘bearing a disproportionally large share of the costs of trade liberalization’5.
As a final point, some literature puts forward evidence for the argument that a decrease in the gender pay gap has been caused by falling wages for male workers, rather than an increase in the wages of female employees. Research on Brazilian trade liberalization, for example, has shown that opening up the markets to free trade and competition depressed overall wages, with men’s wages suffering the most6.
Moreover, the ratification of international conventions that support equal treatment of men and women, and that seek to abolish discriminatory laws which obstruct equal treatment of both sexes, have a positive impact on the gender pay gap. However, the authors also emphasize that the impact on the gender pay gap of signing an international convention, or removing barriers that hamper free trade, can not be attributed to such actions alone. Usually these measures are part of a wider set of policy initiatives by governments to try to eradicate the existing inequalities in society, such as the facilitation of the re-entrance of females in the labour market through the improvement of childcare or the implementation of additional national equal treatment legislation.
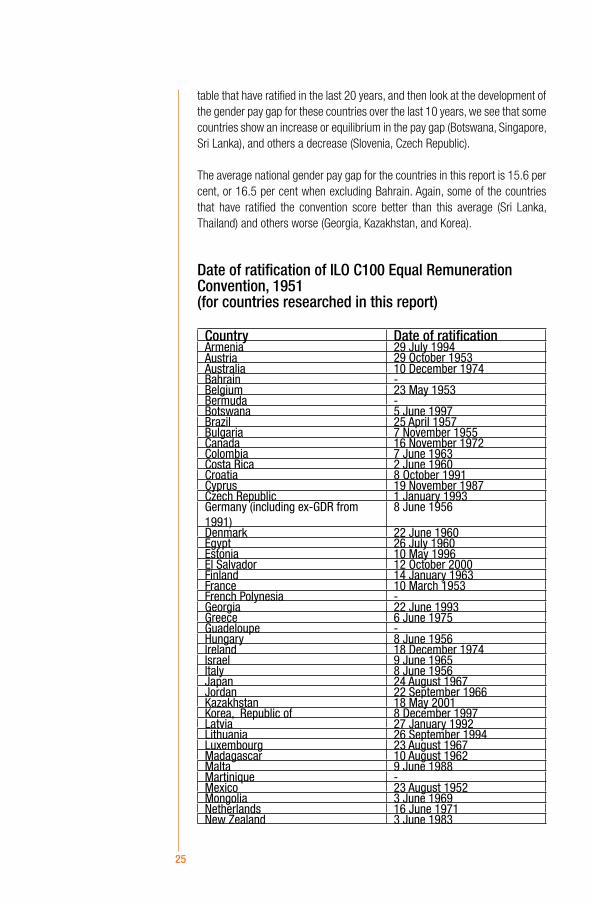
For the purpose of our research, we have taken a closer look at the potential effect of ratification of the ILO C100 Equal Remuneration Convention of 19517 on the pay gap for the countries included in this report. As the table shows, the majority of countries discussed in this report have ratified the ILO convention on equal remuneration, although there is a lot of variation in the year of ratification. Among the states or entities that have not ratified the convention, the United States stands out as the largest country.
The time series data included in this report (see chapter on global data) cover the period 1996-2006, while the ratification process for most countries has taken place before 1996. When we look at the countries in the ratification
5 Id., at p. 216 Santos M.H, and J.S. Arbache (2005), Trade Openness and Gender Discrimination. 7 This convention, adopted inJune 1951 in order to call on the ILO Members to promote and ensure the application to all workers of the principle of equal remuneration for men and women workers for work of equal value. http://www.ilo.org/public/english/employment/skills/hrdr/instr/c_100.htm.
25
table that have ratified in the last 20 years, and then look at the development of the gender pay gap for these countries over the last 10 years, we see that some countries show an increase or equilibrium in the pay gap (Botswana, Singapore, Sri Lanka), and others a decrease (Slovenia, Czech Republic).
The average national gender pay gap for the countries in this report is 15.6 per cent, or 16.5 per cent when excluding Bahrain. Again, some of the countries that have ratified the convention score better than this average (Sri Lanka, Thailand) and others worse (Georgia, Kazakhstan, and Korea).
Date of ratification of ILO C100 Equal Remuneration Convention, 1951(for countries researched in this report)
Country Date of ratificationArmenia 29 July 1994Austria 29 October 1953Australia 10 December 1974Bahrain -Belgium 23 May 1953Bermuda -Botswana 5 June 1997Brazil 25 April 1957Bulgaria 7 November 1955Canada 16 November 1972Colombia 7 June 1963Costa Rica 2 June 1960Croatia 8 October 1991Cyprus 19 November 1987Czech Republic 1 January 1993Germany (including ex-GDR from 1991)
8 June 1956
Denmark 22 June 1960Egypt 26 July 1960Estonia 10 May 1996El Salvador 12 October 2000Finland 14 January 1963France 10 March 1953French Polynesia -Georgia 22 June 1993Greece 6 June 1975Guadeloupe -Hungary 8 June 1956Ireland 18 December 1974Israel 9 June 1965Italy 8 June 1956Japan 24 August 1967Jordan 22 September 1966Kazakhstan 18 May 2001Korea, Republic of 8 December 1997Latvia 27 January 1992Lithuania 26 September 1994Luxembourg 23 August 1967Madagascar 10 August 1962Malta 9 June 1988Martinique -Mexico 23 August 1952Mongolia 3 June 1969Netherlands 16 June 1971New Zealand 3 June 1983

26
Norway 24 September 1959Panama 3 June 1958Paraguay 24 June 1964Philippines 29 December 1953Poland 25 October 1954Portugal 20 February 1967Qatar -Romania 28 May 1957Singapore 30 May 2002Slovakia 1 January 1993Slovenia 29 May 1992Spain 6 November 1967Sri Lanka 1 April 1993Sweden 20 June 1962Switzerland 25 October 1972Thailand 8 February 1999United Kingdom 15 June 1971United States -West Bank and Gaza Strip -
27
Wage Indicator is an internet-based, self-reporting salary survey through which people can compare their pay to people with similar jobs. For this report, we have drawn on data collected during 2006 plus the second and third quarters of 2007 in 12 participating countries. As the data below shows, not all countries have integrated every question into their online survey, and for some countries the response rate for some questions was too low (i.e. 0, 1 or 2 responses) to include. These results have been omitted from the tables in this report. Other low response rates (i.e. less than 50) are featured to show the results rather than to draw any firm conclusions. The overall sample sizes for India and Russia are small, because their surveys have been launched more recently than the more established surveys in for example Germany, the UK and the Netherlands.
In the table below, we have set out the mean (average), median and interquartile ranges for the overall pay gap. We then look at the gender pay gap broken down by more specific variables. These tables show the mean and median figures. The median is included because it represents the middle of the distribution, i.e. half of the scores are above and half are below this figure. It is therefore less sensitive to outliers (extreme values) than the mean. Generally, if the mean and median are in a close range of each other, and we have a normal distribution, we can be reasonably sure that we have a good estimate of the true value of the pay gap. If the mean and median are far apart, this may reflect the influence of a few outliers, such as a small number of highly paid men or women. The ‘valid N’ column shows the valid number of survey respondents that has been included for every calculation.
Sample profile
GenderThe respondents are roughly equally divided between male and female workers, with some countries showing a 60-40 breakdown. The exception is India, where 80 per cent of respondents are male and 20 per cent are female.
EducationMost respondents fall into one of the following educational groups8: lower secondary/second stage of basic education, post-secondary/non-tertiary education, and the first stage of tertiary education. Some countries have an extra level called ‘upper secondary education’. Belgium, the Netherlands, Poland, Spain and the UK all have a high proportion of highly educated men and women, as is illustrated by the column ‘first stage of tertiary education’. Poland especially stands out, with two-thirds of men and three-quarters of women having reached the first stage of tertiary education. Overall, women are often educated up to a level that is equal to men, if not higher. 8 Classification is based on ISCED (International Standard Classification of Education) education levels. See appendix 6 and http://www.eurydice.org/for more information.
WageIndicator findings

28
Trade union membershipLooking at trade union membership, none of the respondents from the Russian federation are affiliated to a trade union. At the other end of the spectrum we find Hungary and Finland, with 93 per cent and 70 per cent of respondents respectively stating that they are a member of a trade union. Low trade union membership rates are found in Argentina (13.1 per cent), Germany (17.1 per cent) and Poland (12.7 per cent). There is a relatively even gender spread in trade union membership.
Full-time and part-time hoursMen are generally more likely to work full-time hours than women. Overall, 80 to 90 per cent of survey respondents work full-time. At the upper end of the scale we find Russia (94.5 per cent work full-time) and India (97.8 per cent). The Netherlands provides the highest proportion of part-time workers overall (23.9 per cent), with women especially working part-time (43.9 per cent). In Germany over one-fifth of the female respondents work part-time, compared to 3 per cent of men. In the UK these figures stand at 14.4 per cent for women and 3 per cent for men respectively.
Public, private and not-for-profit sectorsOverall, between 70 and 80 per cent of workers in this survey are employed in the private sector, with another 10 to 20 per cent being employed in the public sector. The not-for-profit sector accounts for 1 to 10 per cent of all jobs of the respondents. Some countries stand out because of the particularly large proportion of public sector employees, such as Finland (30.8 per cent), Poland (31.5 per cent), the UK (30 per cent) and Hungary (28.5 per cent). India on the contrary has very few survey respondents working in the public sector (6.8 per cent) and instead shows a large number of private sector workers (85.9 per cent).
NACE industry classification9
Manufacturing, wholesale and retail trade (which includes the repair of motor vehicles) and general business activities are the sectors of economic activity in which most of the workers in this survey are employed. The transport sector shows a consistent picture, providing work to between 5 and 10 per cent of workers across all countries. The survey furthermore shows that India has an exceptionally high proportion of workers employed in business activities. On the other hand, few people are employed in agriculture, fishing, mining, utilities, hotels and restaurants, household activities, and extra-territorial organisations. The breakdown also demonstrates the presence of occupational segregation along gender lines: education and health and social work are particularly female-dominated areas, while manufacturing and construction are typically male-dominated work environments.
9 NACE stands for Nomenclature des Activités Economiques and is the statistical classification of economic activities used by the European communities. http://eurlex.europa.eu/LexUriServ/LexUriServ.do?uri=OJ:L:2002:006:0003:0034:EN:PDF

29
ISCO occupational classification10
The breakdown by ISCO categories shows that most survey participants classify themselves as (associate) professionals and technicians. In the majority of countries, legislators, senior officials and managers account for between 5 and 10 per cent of workers who participated in the survey. Germany, India, Poland, the UK and particularly the Russian Federation are exceptions with higher proportions of workers in this occupational group. The Netherlands, on the other hand, has a very low ratio of legislators, senior officials and managers, especially among women (2.8 per cent). There is again a clear occupational separation along gender lines, with clerks and service, shop and market sales workers being mostly female, and craft workers as well as plant and machine operators and assemblers being mostly male.
More detailed information on the profile of the survey respondents can be found in Appendix 4 [http://www.ituc-csi.org/IMG/pdf/GPG_Report_Final_21_Feb.pdf].
Overall gender pay gapThe average pay gap ranges between 12.9 per cent in Brazil to 23 per cent in Poland. India has a pay gap of 2.2 per cent, but this figure is unlikely to be representative of the whole population, as the sample size is very small (242 responses) compared to the size of the population (just over 1.1 billion). The same caution has to be applied to the Russian figures, which also are based on a small sample. For the majority of countries, we see that the mean and median are quite closely related, which means the survey average is probably a good estimate of the true average pay gap for the population. Brazil, Hungary and the United Kingdom show more differentiation between the mean and median figures. The average for the UK, for example, seems to be quite low, also when compared to the official figure of 20 per cent.
CountryPercentile
25 Mean MedianPercentile
75 Valid N
Argentina 13.9 18.9 20.9 24.2 13135
Belgium 12.8 13.3 14.3 18.1 13532
Brazil 9.4 12.9 17.1 15.4 14782
Finland 13.2 20.0 19.4 24.1 27718
Germany18.5 21.9 21.2 23.0 79905
Hungary 10.0 17.0 10.3 19.5 4199
10 International Standard Classification of Occupations; a classification system which falls under ILO responsibility. http://www.ilo.org/public/english/bureau/stat/isco/index.htm

30
India -11.0 2.2 -23.0 46.7 242
14.9 20.8 17.0 22.6 95600
Poland 20.5 23.0 23.7 26.1 6573
R u s s i a n 4.2 2.4 3.1 -3.4 594
Spain 16.9 21.8 22.3 26.8 12967
U n i t e d Kingdom 15.2 15.7 25.1 23.5 32976
Source: WageIndicator 2006-2007
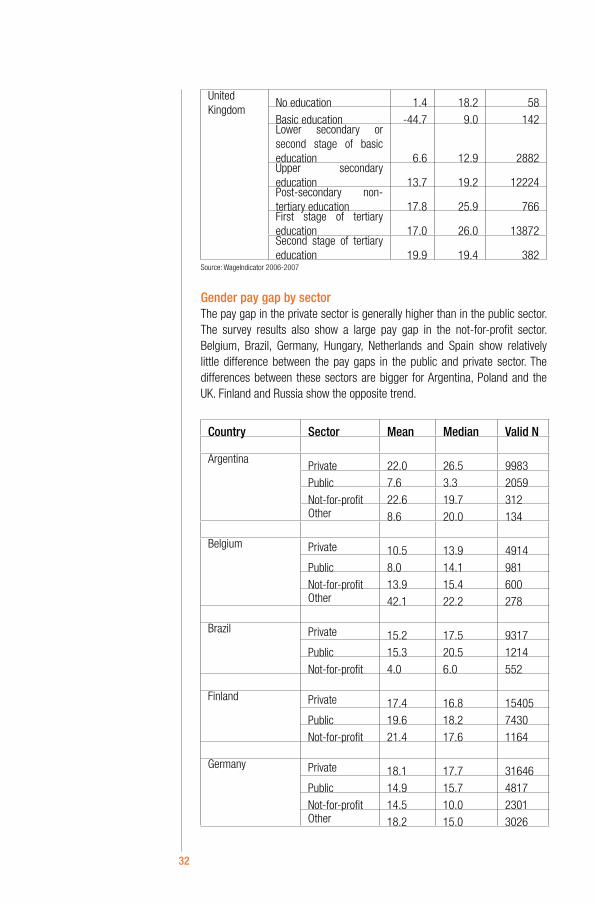
Gender pay gap by educational backgroundWhen we look at the relationship between education and the gender pay gap, the data illustrates that higher education for women does not automatically lead to a smaller pay gap11. On the contrary, in some countries, such as the United Kingdom and the Netherlands, the gap rises with the level of education, particularly at the level of tertiary education (first stage).
Country Education level Mean Median Valid N
Belgium No education -18.1 11.3 26Basic education 31.5 15.8 195Lower secondary or second stage of basic education 11.7 15.5 1536Post-secondary non-tertiary education 19.9 15.4 3963First stage of tertiary education 12.6 15.3 6875Second stage of tertiary education 21.8 11.4 120
Finland No education 8.9 7.2 156Basic education 17.9 14.2 1435Lower secondary or second stage of basic education 19.9 17.0 5802Post-secondary non-tertiary education 21.7 22.2 13470First stage of tertiary education 20.7 18.0 4941Second stage of tertiary education -3.1 -2.6 180
11 See appendix 6 for further information on the definition of ISCED education levels.

31
GermanyNo education 40.1 24.1 296
Basic education 17.9 17.8 7186Lower secondary or second stage of basic education 16.2 14.4 19826Upper secondary education 23.3 23.0 9376Post-secondary non-tertiary education 18.4 15.2 10378First stage of tertiary education 20.6 20.8 11366Second stage of tertiary education 18.3 11.2 1974
The Netherlands
No education 5.3 20.9 133
Basic education 20.3 13.9 1221Lower secondary or second stage of basic education 18.4 15.2 13454Upper secondary education 16.3 17.5 4172Post-secondary non-tertiary education 20.9 16.7 25913First stage of tertiary education 23.2 22.5 31164Second stage of tertiary education 10.3 17.8 529
PolandBasic education 97.6 75.8 16Lower secondary or second stage of basic education 43.4 30.0 105Post-secondary non-tertiary education 29.2 30.7 1167First stage of tertiary education 25.1 27.4 3411Second stage of tertiary education 37.4 14.7 74
SpainNo education -8.8 22.4 49
Basic education 20.5 20.4 1610Lower secondary or second stage of basic education 31.1 23.6 559Upper secondary education 22.5 20.9 3025First stage of tertiary education 24.4 25.3 5102Second stage of tertiary education 26.1 32.3 815
32
United Kingdom
No education 1.4 18.2 58
Basic education -44.7 9.0 142Lower secondary or second stage of basic education 6.6 12.9 2882Upper secondary education 13.7 19.2 12224Post-secondary non-tertiary education 17.8 25.9 766First stage of tertiary education 17.0 26.0 13872Second stage of tertiary education 19.9 19.4 382
Source: WageIndicator 2006-2007
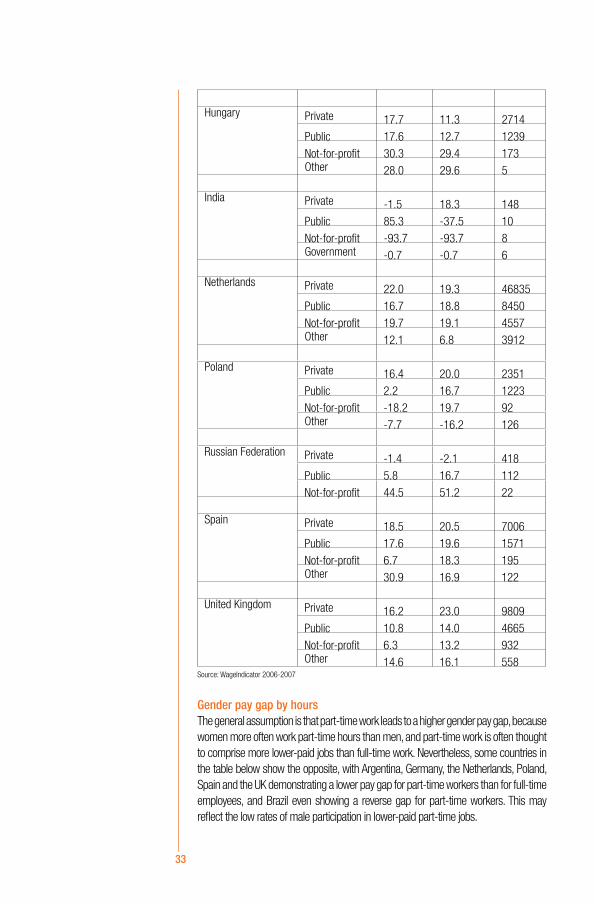
Gender pay gap by sectorThe pay gap in the private sector is generally higher than in the public sector. The survey results also show a large pay gap in the not-for-profit sector. Belgium, Brazil, Germany, Hungary, Netherlands and Spain show relatively little difference between the pay gaps in the public and private sector. The differences between these sectors are bigger for Argentina, Poland and the UK. Finland and Russia show the opposite trend.
Country Sector Mean Median Valid N
ArgentinaPrivate 22.0 26.5 9983
Public 7.6 3.3 2059
Not-for-profit 22.6 19.7 312Other 8.6 20.0 134
Belgium Private 10.5 13.9 4914
Public 8.0 14.1 981
Not-for-profit 13.9 15.4 600Other 42.1 22.2 278
Brazil Private 15.2 17.5 9317
Public 15.3 20.5 1214
Not-for-profit 4.0 6.0 552
Finland Private 17.4 16.8 15405
Public 19.6 18.2 7430
Not-for-profit 21.4 17.6 1164
Germany Private 18.1 17.7 31646
Public 14.9 15.7 4817
Not-for-profit 14.5 10.0 2301Other 18.2 15.0 3026
33
Hungary Private 17.7 11.3 2714
Public 17.6 12.7 1239
Not-for-profit 30.3 29.4 173Other 28.0 29.6 5
India Private -1.5 18.3 148
Public 85.3 -37.5 10
Not-for-profit -93.7 -93.7 8Government -0.7 -0.7 6
Netherlands Private 22.0 19.3 46835
Public 16.7 18.8 8450
Not-for-profit 19.7 19.1 4557Other 12.1 6.8 3912
Poland Private 16.4 20.0 2351
Public 2.2 16.7 1223
Not-for-profit -18.2 19.7 92Other -7.7 -16.2 126
Russian Federation Private -1.4 -2.1 418
Public 5.8 16.7 112
Not-for-profit 44.5 51.2 22
Spain Private 18.5 20.5 7006
Public 17.6 19.6 1571
Not-for-profit 6.7 18.3 195Other 30.9 16.9 122
United Kingdom Private 16.2 23.0 9809
Public 10.8 14.0 4665
Not-for-profit 6.3 13.2 932Other 14.6 16.1 558
Source: WageIndicator 2006-2007
Gender pay gap by hoursThe general assumption is that part-time work leads to a higher gender pay gap, because women more often work part-time hours than men, and part-time work is often thought to comprise more lower-paid jobs than full-time work. Nevertheless, some countries in the table below show the opposite, with Argentina, Germany, the Netherlands, Poland, Spain and the UK demonstrating a lower pay gap for part-time workers than for full-time employees, and Brazil even showing a reverse gap for part-time workers. This may reflect the low rates of male participation in lower-paid part-time jobs.

34
Country FT/PT Mean Median Valid N
Argentina Part-time 10.5 10.4 2055Full-time 20.2 22.3 11080
Belgium Part-time 15.9 14.8 2109Full-time 12.9 14.3 11281
Brazil Part-time -7.3 4.0 1295Full-time 15.3 18.4 13471
Finland Part-time 25.6 17.5 1623Full-time 19.0 19.4 25391
Germany Part-time 5.8 6.9 7854Full-time 20.9 19.7 71341
Hungary Part-time 25.1 -0.4 245Full-time 17.0 10.8 3954
Netherlands Part-time 17.5 13.8 21186Full-time 20.6 17.7 72531
Poland Part-time 14.5 20.0 421Full-time 25.9 23.1 5980
Russian Federation Part-time 40.9 47.1 18Full-time 0.8 2.5 576
Spain Part-time 11.9 6.1 840Full-time 21.1 21.1 12057
United Kingdom Part-time 8.0 5.0 2582Full-time 14.8 22.5 30170
Source: WageIndicator 2006-2007
Gender pay gap by trade union membershipArgentina, Finland, Poland, Spain and especially Germany, the Netherlands and the UK all provide evidence for the positive influence of trade union membership on the gender pay gap, with the gap being lower in these countries for unionised employees than for employees who are not a member of a trade union. The sample size for India is too small to draw any conclusions, and in Russia 100 per cent of survey participants responded that they are not a member of a trade union, which eliminates the possibility to make a

35
comparison. Poland shows a reverse pay gap of almost 21 per cent for trade union members.
Country TU member y/n Mean Median Valid N
Argentina Not a member of a trade union 19.3 21.9 10625Member of a trade union
13.2 15.0 1796
Belgium Not a member of a trade union 13.7 16.4 4498Member of a trade union
15.4 14.8 6410
Brazil Not a member of a trade union 12.5 17.4 845Member of a trade union
15.9 18.3 595
Finland Not a member of a trade union 21.9 20.7 7642Member of a trade union
18.4 18.6 18652
Germany Not a member of a trade union 23.0 22.3 60553Member of a trade union
14.3 12.8 12906
Hungary Not a member of a trade union 11.5 12.5 89Member of a trade union
16.7 9.2 4099
India Not a member of a trade union 12.8 11.7 14Member of a trade union
1.8 -27.1 114
Netherlands Not a member of a trade union 22.2 18.6 69512Member of a trade union
14.0 9.8 19216
Poland Not a member of a trade union 27.5 28.2 4558Member of a trade union
-20.8 17.4 671
Russia Not a member of a trade union 2.4 3.1 594
Spain Not a member of a trade union 21.5 21.7 7437Member of a trade union
21.1 16.8 3026
36
United Kingdom
Not a member of a trade union 17.1 28.3 25687Member of a trade union
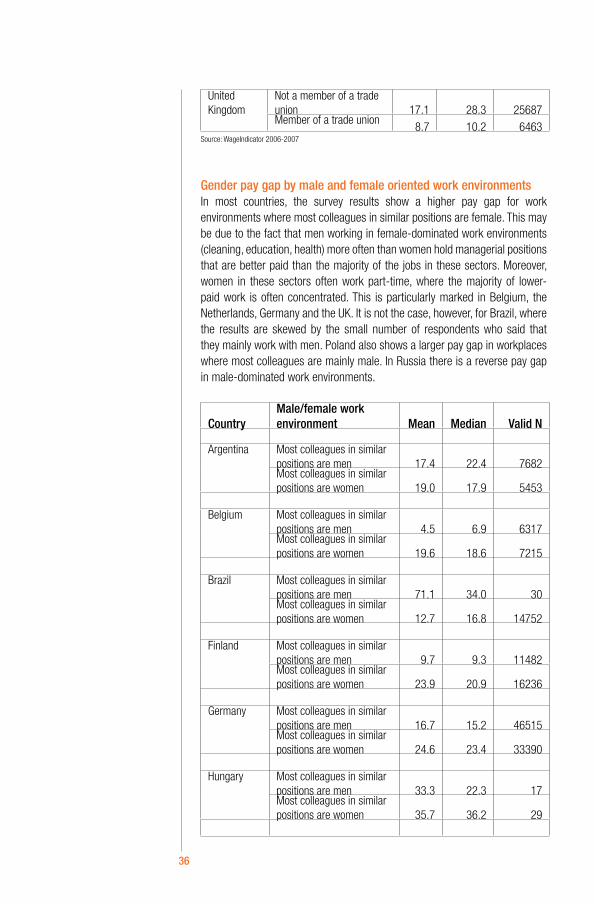
8.7 10.2 6463Source: WageIndicator 2006-2007
Gender pay gap by male and female oriented work environmentsIn most countries, the survey results show a higher pay gap for work environments where most colleagues in similar positions are female. This may be due to the fact that men working in female-dominated work environments (cleaning, education, health) more often than women hold managerial positions that are better paid than the majority of the jobs in these sectors. Moreover, women in these sectors often work part-time, where the majority of lower-paid work is often concentrated. This is particularly marked in Belgium, the Netherlands, Germany and the UK. It is not the case, however, for Brazil, where the results are skewed by the small number of respondents who said that they mainly work with men. Poland also shows a larger pay gap in workplaces where most colleagues are mainly male. In Russia there is a reverse pay gap in male-dominated work environments.
CountryMale/female work environment Mean Median Valid N
Argentina Most colleagues in similar positions are men 17.4 22.4 7682Most colleagues in similar positions are women 19.0 17.9 5453
Belgium Most colleagues in similar positions are men 4.5 6.9 6317Most colleagues in similar positions are women 19.6 18.6 7215
Brazil Most colleagues in similar positions are men 71.1 34.0 30Most colleagues in similar positions are women 12.7 16.8 14752
Finland Most colleagues in similar positions are men 9.7 9.3 11482Most colleagues in similar positions are women 23.9 20.9 16236
Germany Most colleagues in similar positions are men 16.7 15.2 46515Most colleagues in similar positions are women 24.6 23.4 33390
Hungary Most colleagues in similar positions are men 33.3 22.3 17Most colleagues in similar positions are women 35.7 36.2 29

37
Netherlands Most colleagues in similar positions are men 12.1 10.2 52810Most colleagues in similar positions are women 27.5 21.6 42790
Poland Most colleagues in similar positions are men 27.0 16.7 2125Most colleagues in similar positions are women 16.1 25.7 4448
Russian Federation
Most colleagues in similar positions are men -3.7 -14.3 264Most colleagues in similar positions are women 7.1 6.5 330
Spain Most colleagues in similar positions are men 16.6 18.3 6656Most colleagues in similar positions are women 26.6 25.7 6311
United Kingdom
Most colleagues in similar positions are men 9.2 11.7 13839Most colleagues in similar positions are women 17.1 25.5 19137
Source: WageIndicator 2006-2007
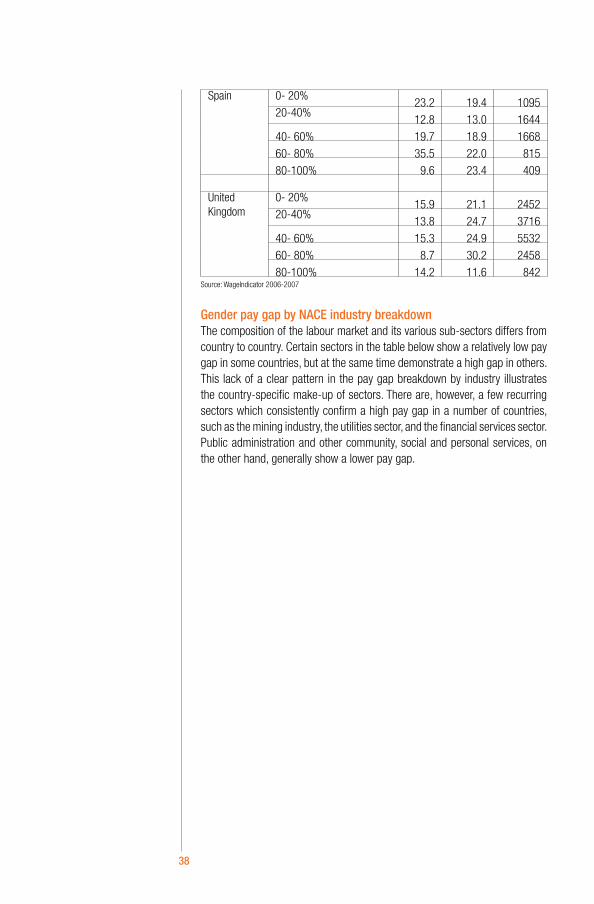
Gender pay gap by percentage of women in the workplaceThere is no real pattern or trend when looking at the relationship between the percentage of women in the workplace and the gender pay gap. There are some extreme figures, such as the pay gap of 35.5 per cent for workplaces in Spain where women make up between 60 and 80 per cent of the workforce, while the pay gap is very low at 8.7 per cent for this category in the UK.
CountryPercentage of women in workplace Mean Median Valid N
Germany 0- 20%15.1 14.8 8097
20- 40%18.5 18.7 12694
40- 60% 20.3 21.3 11682
60- 80% 16.6 19.6 4308
80- 100% 21.1 20.0 1438
Netherlands 0- 20%17.7 13.0 10271
20-40%21.0 17.0 9690
40- 60% 19.4 16.9 9375
60- 80% 18.7 16.1 5011
80-100% 22.3 17.8 2861
38
Spain 0- 20%23.2 19.4 1095
20-40%12.8 13.0 1644
40- 60% 19.7 18.9 1668
60- 80% 35.5 22.0 815
80-100% 9.6 23.4 409
United Kingdom
0- 20%15.9 21.1 2452
20-40%13.8 24.7 3716
40- 60% 15.3 24.9 5532
60- 80% 8.7 30.2 2458
80-100% 14.2 11.6 842Source: WageIndicator 2006-2007
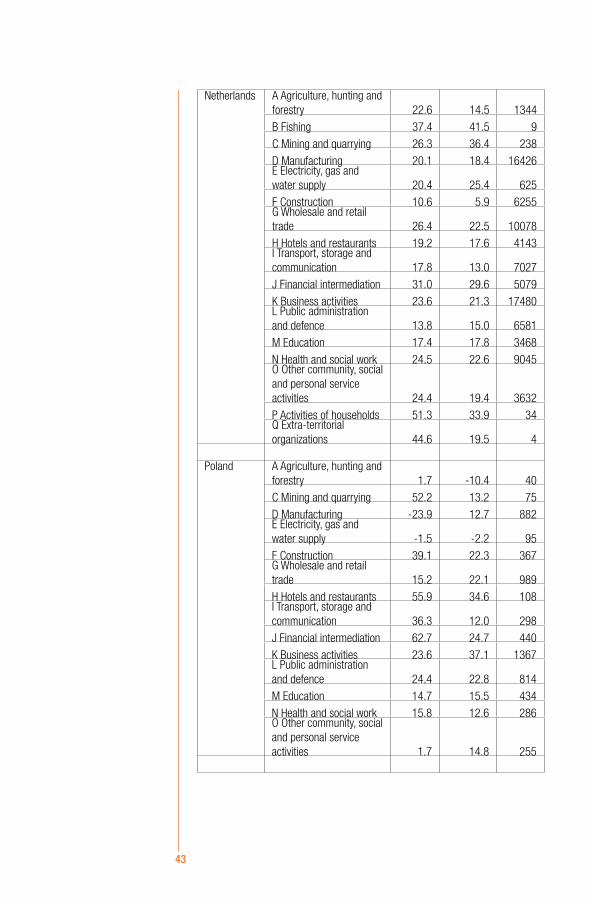
Gender pay gap by NACE industry breakdownThe composition of the labour market and its various sub-sectors differs from country to country. Certain sectors in the table below show a relatively low pay gap in some countries, but at the same time demonstrate a high gap in others. This lack of a clear pattern in the pay gap breakdown by industry illustrates the country-specific make-up of sectors. There are, however, a few recurring sectors which consistently confirm a high pay gap in a number of countries, such as the mining industry, the utilities sector, and the financial services sector. Public administration and other community, social and personal services, on the other hand, generally show a lower pay gap.

39
Country NACE industry Mean MedianValid
N
Argentina A Agriculture, hunting and forestry 10.1 -2.1 301
B Fishing 7.0 -10.8 25C Mining and quarrying
35.3 44.3 208
D Manufacturing 23.1 28.2 1911E Electricity, gas and water supply 15.1 31.1 308
F Construction 23.1 15.8 435G Wholesale and retail trade 19.7 24.2 1396
H Hotels and restaurants 13.7 17.9 238I Transport, storage and communication 15.2 21.0 925
J Financial intermediation 16.0 18.5 706
K Business activities 19.8 24.0 3587L Public administration and defence 2.8 3.6 809
M Education 9.6 3.4 748
N Health and social work 14.7 12.1 723O Other community, social and personal service activities 21.1 20.5 504
P Activities of households -5.5 -18.1 46Q Extra-territorial organizations 19.4 14.7 267

40
Belgium A Agriculture, hunting and forestry -9.3 -15.9 95
C Mining and quarrying 34.7 31.0 34
D Manufacturing 11.7 9.1 3204E Electricity, gas and water supply 27.7 38.3 126
F Construction 15.0 7.5 850G Wholesale and retail trade 13.2 15.6 1533
H Hotels and restaurants 39.0 9.3 256I Transport, storage and communication 15.6 10.4 931
J Financial intermediation 16.3 14.1 781
K Business activities 17.6 20.8 2121L Public administration and defence 10.8 16.3 758
M Education 4.7 12.7 482
N Health and social work 11.9 18.0 1610O Other community, social and personal service activities 23.0 15.8 574
P Activities of households -39.4 -5.0 45Q Extra-territorial organizations 66.8 70.6 8
Brazil A Agriculture, hunting and forestry 14.3 19.8 210
B Fishing 49.6 49.6 3
C Mining and quarrying 23.0 34.2 537
D Manufacturing 22.6 29.7 2356E Electricity, gas and water supply 3.7 15.4 172
F Construction -13.9 13.0 502G Wholesale and retail trade 21.8 19.3 1048
H Hotels and restaurants 14.4 23.9 86I Transport, storage and communication 3.9 21.5 849
J Financial intermediation 19.2 23.1 680
K Business activities 15.2 13.3 2727L Public administration and defence -6.5 9.6 573
M Education 17.2 15.9 761
N Health and social work 16.1 14.4 614O Other community, social and personal service activities -31.1 4.0 432Q Extra-territorial organizations 23.6 36.1 160

41
Finland A Agriculture, hunting and forestry 10.8 13.1 297
B Fishing 15.6 7.3 12
C Mining and quarrying 17.5 20.5 60
D Manufacturing 13.6 12.6 6530E Electricity, gas and water supply 22.7 29.6 66
F Construction 20.2 15.9 1189G Wholesale and retail trade 17.9 14.8 2264
H Hotels and restaurants 10.9 16.7 735I Transport, storage and communication 18.5 9.3 1669
J Financial intermediation 33.8 30.5 973
K Business activities 20.1 21.0 5338L Public administration and defence 17.6 16.5 2350
M Education 17.3 21.2 1461
N Health and social work 19.5 8.7 3297O Other community, social and personal service activities 21.7 15.7 1430Q Extra-territorial organizations -29.5 16.6 35
Germany A Agriculture, hunting and forestry 15.8 17.8 442
C Mining and quarrying 16.2 14.4 250
D Manufacturing 20.9 20.5 21321E Electricity, gas and water supply 17.9 16.0 2201
F Construction 14.8 12.8 4931G Wholesale and retail trade 17.4 14.6 7309
H Hotels and restaurants 18.6 13.9 1743I Transport, storage and communication 11.8 8.1 3388
J Financial intermediation 24.5 21.5 4122
K Business activities 25.9 25.7 11291L Public administration and defence 19.9 19.9 3659
M Education 20.1 21.3 2263
N Health and social work 24.5 23.8 6164O Other community, social and personal service activities 19.8 17.0 1678
P Activities of households 26.5 23.4 363

42
Hungary A Agriculture, hunting and forestry -28.2 -44.2 109
C Mining and quarrying -7.2 -45.8 33
D Manufacturing 21.2 14.7 1394E Electricity, gas and water supply 23.2 14.5 120
F Construction 18.4 8.3 134G Wholesale and retail trade 8.4 12.7 415
H Hotels and restaurants 18.6 30.6 109I Transport, storage and communication 20.3 13.3 393
J Financial intermediation 12.7 12.1 78
K Business activities 23.0 27.1 266L Public administration and defence 14.9 16.7 261
M Education 15.4 11.8 369
N Health and social work 4.4 -5.7 346O Other community, social and personal service activities 29.8 27.6 207Q Extra-territorial organizations 11.2 22.4 6
IndiaD Manufacturing -61.1 -674.9 36F Construction
-57.9 -57.9 8
K Business activities -2.2 43.0 86
N Health and social work -343.4 -343.4 4O Other community, social and personal service activities 68.2 68.2 6
43
Netherlands A Agriculture, hunting and forestry 22.6 14.5 1344
B Fishing 37.4 41.5 9
C Mining and quarrying 26.3 36.4 238
D Manufacturing 20.1 18.4 16426E Electricity, gas and water supply 20.4 25.4 625
F Construction 10.6 5.9 6255G Wholesale and retail trade 26.4 22.5 10078
H Hotels and restaurants 19.2 17.6 4143I Transport, storage and communication 17.8 13.0 7027
J Financial intermediation 31.0 29.6 5079
K Business activities 23.6 21.3 17480L Public administration and defence 13.8 15.0 6581
M Education 17.4 17.8 3468
N Health and social work 24.5 22.6 9045O Other community, social and personal service activities 24.4 19.4 3632
P Activities of households 51.3 33.9 34Q Extra-territorial organizations 44.6 19.5 4
Poland A Agriculture, hunting and forestry 1.7 -10.4 40
C Mining and quarrying 52.2 13.2 75
D Manufacturing -23.9 12.7 882E Electricity, gas and water supply -1.5 -2.2 95
F Construction 39.1 22.3 367G Wholesale and retail trade 15.2 22.1 989
H Hotels and restaurants 55.9 34.6 108I Transport, storage and communication 36.3 12.0 298
J Financial intermediation 62.7 24.7 440
K Business activities 23.6 37.1 1367L Public administration and defence 24.4 22.8 814
M Education 14.7 15.5 434
N Health and social work 15.8 12.6 286O Other community, social and personal service activities 1.7 14.8 255

44
Russian Federation
A Agriculture, hunting and forestry 11.1 11.1 6
C Mining and quarrying -14.4 -35.3 14
D Manufacturing 5.5 0.0 98E Electricity, gas and water supply -4.5 -4.5 8
F Construction 3.0 6.9 26G Wholesale and retail trade -3.3 0.2 108I Transport, storage and communication -8.3 -22.4 34
J Financial intermediation -33.9 -37.1 36
K Business activities 9.8 11.2 196
M Education 13.8 7.1 10
N Health and social work 10.3 14.3 14O Other community, social and personal service activities -0.5 -4.9 12Q Extra-territorial organizations -73.9 -104.2 18
Spain A Agriculture, hunting and forestry 19.9 18.5 166
B Fishing 10.7 4.4 24
C Mining and quarrying 4.4 4.1 49
D Manufacturing 22.2 25.0 1807E Electricity, gas and water supply 6.7 20.8 230
F Construction 12.5 14.4 1097G Wholesale and retail trade 27.9 26.2 1185
H Hotels and restaurants 11.4 12.1 567I Transport, storage and communication 13.4 25.1 824
J Financial intermediation 23.0 28.4 775
K Business activities 18.2 20.6 3392L Public administration and defence 23.7 10.3 891
M Education 21.1 23.5 646
N Health and social work 33.9 26.1 690O Other community, social and personal service activities 22.7 16.4 505
P Activities of households 30.0 32.7 65Q Extra-territorial organizations 34.4 37.9 8

45
United Kingdom
A Agriculture, hunting and forestry 20.8 -7.0 234
B Fishing 39.3 22.2 18
C Mining and quarrying 22.0 43.5 257
D Manufacturing 18.0 26.7 4635E Electricity, gas and water supply 8.6 36.6 296F Construction
23.2 32.7 2189G Wholesale and retail trade 16.5 17.4 3591
H Hotels and restaurants 9.6 14.3 1405I Transport, storage and communication 3.9 3.5 2228
J Financial intermediation 13.7 29.2 2043
K Business activities 17.4 28.8 7036L Public administration and defence 12.5 18.8 1742
M Education 22.0 31.4 2130
N Health and social work 21.5 32.0 3193O Other community, social and personal service activities 22.7 19.6 1364
P Activities of households 63.6 83.5 36Q Extra-territorial organizations -152.4 -91.5 26
Source: WageIndicator 2006-2007

46
The comparison of the gender pay gap found in the public data and in WageIndicator shows a mixed picture. For Finland, Germany and the Netherlands, both sources give a similar result. The Eurostat figures for Belgium, Hungary, Poland and Spain all show lower pay gaps than the WageIndicator, while the opposite is the case for Brazil and the United Kingdom. These two countries show a higher gap based on the public data than WageIndicator.
When interpreting these figures, it has to be kept in mind that the public sources are sometimes from an earlier year than the WageIndicator data, which have been collected between 2006 and 2007. This is the case for Brazil (2004), the Netherlands (2005) and the United Kingdom (2005).
Country ILO/Eurostat data
sources Wage Indicator database
Belgium 7.0p 13.3
Brazil 17.71 12.9
Finland 20.0 20.0Germany
22.0 21.9
Hungary 11.0 17.0
Netherlands 18.02 20.8
Poland 12.0 23.0
Spain 13.0p 21.8
United Kingdom 20.0p3 15.7
p=provisional
Comparing the publicly available official sources with WageIndicator data

47
Defining the gender pay gapThe gender pay gap is defined by Eurostat as ‘the difference between average gross hourly earnings of male-paid employees and of female-paid employees as a percentage of average gross hourly earnings of male-paid employees’12. The European Commission states that across the EU economy, the gender pay gap was 15 per cent on average in the European Union in 2005.
The existence of the gender pay gap shows how women’s work is valued. It often reveals gender discrimination and occupational segregation in the workplace. Moreover, the figures frequently reflect the concentration of women in part-time work, the uneven distribution of domestic responsibilities in which women take up the majority of household tasks, and the greater likelihood for women to take career breaks due to child and family care. The gender pay gap, as it shows, is a very complex and multi-faceted phenomenon13. Some of its characteristics are discussed in greater detail below.
Causes for the gapThe gender pay gap exists, according to the European Commission, as a result of a combination of factors, including:
Personal characteristics – age, education, job tenure, children, •labour market experienceJob characteristics – occupation, working time, contract type, job •status, career prospects and working conditionsFirm characteristics – sector, firm size, recruitment behaviour, work •organisationGender segregation by occupation or sector•Institutional characteristics- education and training systems, wage •bargaining, industrial relations, parental leave arrangements and provision of childcare Social norms and traditions – education, job choice, career patterns •and evaluation of male and female dominated job roles14.
The European Commission furthermore states that the pay gap increases with age, years of service and education. For example, differences in pay in the European Union are over 30 per cent in the 40-59 age group and 7 per cent for the under 30s. For employees with over 30 years’ service in a company the gender pay gap is 32 per cent, while it is lower at 22 per cent for those with between one and five years’ service. It is 30 per cent for those with third-level education and 13 per cent among those with lower level secondary education. Women achieve higher overall pass rates at school than men in all the EU
12 Commission of the European Communities (2007), Communication from the Commission: Tackling the Pay Gap between Women and Men, p.15. This is the pay gap in unadjusted form. 13 Id., at p.16.14 Ibid.
Literature review

48
member states and account for the majority of graduates, yet once they enter the labour market they are faced with inequalities15.
Part-time workThe greater burden of caring and domestic responsibilities that often falls upon women means more women than men work part time (almost a third or women in the EU work part-time as opposed to 8 per cent of men). Women are overrepresented in part-time positions, which are mostly low-paid. The European Foundation for the Improvement of Living and Working Conditions reports that in most European countries between 70 and 80 per cent of part-time workers are in the lower pay bracket16. This is confirmed by the fact that the gender gap is higher in countries where a large proportion of women work part-time, i.e. Denmark, UK, Netherlands, than in countries where women mostly work full-time. It also helps to explain why more men than women occupy the highest pay bracket, even in sectors with a large female workforce.
Within the part-time group, low pay is distributed evenly between men and women and high pay is also fairly evenly distributed among a small proportion of men and women working part-time (about 10 per cent). Ireland and the UK are the exception to this, as among male part-time workers, 21 per cent are in the higher pay bracket, compared to 5 per cent of females.
Occupational segregationBy law, equal pay for work of equal value must be applied, however the female-dominated roles such as cleaning, catering and clerical work are generally paid less compared to roles of equal value in which men dominate. This is also illustrated by the fact that the gender pay gap is largest in countries where the labour market is highly segregated, i.e. in Cyprus, Estonia, Slovakia, and in male-dominated sectors such as industry, business services and the financial sector17.
The results of the European Working Conditions Survey 2005 shows European labour markets are highly segregated, with only 26 per cent of Europeans working in mixed occupations, where the workforce is at least 40 per cent female. About half the female workforce has jobs in two sectors: 34 per cent of women work in education and health, 17 per cent work in wholesale and retail trade. For men, half of their jobs are in three sectors: manufacturing (22 per cent), wholesale and retail trade (14 per cent) and construction (13 per cent). The European Commission furthermore reports that administrative assistants, shop assistants and low skilled or unskilled work account for almost half of the female workforce. At the same time, only a third of managers are women in companies in the EU18.
15 Id., at p. 20, 24.16 European foundation for the Improvement of Living and Working Conditions (2006), The Gender Pay Gap: Background Paper, p. 6. 17 Commission of the European Communities (2007), Communication from the Commission: Tackling the Pay Gap between Women and Men, p. 4. 18 European foundation for the Improvement of Living and Working Conditions (2006), The Gender Pay Gap: Background Paper, p. 4.
49
The Women and Work Commission in the UK believes it is the value placed on caring roles, which is key to the position of women in the labour market. Women’s greater representation in occupations considered as low skill and men’s greater representation in more skilled jobs is considered a part explanation for the gender pay gap ‘that is related to the labour market structure, and not to pay discrimination’. However, the definition of low-skilled jobs is often based on stereotypical views about the requirements of female dominated roles and a job perceived as low skill may actually not be19. This stresses the importance of equality-proofed job evaluation systems, which can evaluate fairly male and female roles.
Workplace discrimination Prejudices and stereotypes are a contributory factor in pay discrimination, according to Chicha20. There can be pay discrimination in two forms: firstly different pay is awarded to the same job, for example, to a female and male teacher with the same qualification, experience and responsibilities. This contravenes equal pay legislation but has been witnessed frequently. This type of discrimination is often associated with women entering traditionally male occupations. Secondly, discrimination occurs when jobs that are different, but job-evaluated to be of equal value, are paid differently. In this case, the requirements of many female-dominated roles such as interpersonal skills are valued less highly than those of traditionally male occupations. Chicha argues that the ‘influence of prejudices and stereotypes on job evaluation methods serves to reinforce and maintain gender pay disparities’, with ‘traditional job evaluation methods overlooking or undervaluing important aspects of female jobs’21.
The global gender gapThe World Economic Forum uses the ‘Global Gender Gap Index’ framework to benchmark global gender-based inequalities on economic, political, education and health-based criteria. The Index measures the size of the gender gap in 128 countries, covering 90 per cent of the world’s population. The economic component of the Index covers the participation gap, which is the difference in labour force participation rates, the remuneration gap and the gap between the advancement of women and men, based on the ratio of women to men among legislators, senior officials and managers and the ratio of women to men among technical and professional workers. The Gender Gap Index 2007 shows that the gap between men and women in economic participation is still wide, with only 58 per cent of the economic outcomes gap having closed. The Index scores show that economic participation and opportunity is more equal in Oceania, followed by North America and there is greater inequality in the Middle East (where only about one third of women participate in the workforce) and North Africa and Asia. Mozambique ranks highest on economic participation and opportunity out of the 128 countries covered by the Report, followed by
19 Chicha, M.T. (2006). A Comparative Analysis of Promoting Pay Equity: Models and Impacts, pp. 3-7.20 Id., at p.5.21 Id., at p.6.

50
the Philippines, Ghana, Tanzania and Moldova. Sweden ranks sixth. All Nordic countries have increased their score on economic participation from 2006, driven ‘mainly by a decreasing gap between women and men’s labour force participation rates and salaries’22.
Cuba ranks 39 in economic participation and for the region has a relatively high proportion of women in parliament and women in ministerial level positions and a higher percentage of women than men among professional and technical workers. Argentina has improved on economic participation, reaching 75th in 2007, compared to 82nd in 2006. Its ranking was boosted by ‘an improved ratio between women and men’s labour force participation and a reduction in the gap between women and men’s estimated earned incomes’. However, the WEF Executive Opinion Survey reveals that Argentina continues to have one of the widest wage gaps on similar work (ranking 104 on this variable). Chile is held back in the rankings by ‘poor performance’ on the economic participation and opportunity index (105 out of 128 countries). Women’s labour force participation in Chile is 41 per cent as compared to 76 per cent for men, and women’s estimated income is less than half that of men. Less than a quarter of legislator, senior official and manager occupations are in this country occupied by women. The lowest ranking country overall on economic participation and opportunity is Yemen.
Closing the global gender pay gapIn industrialised countries, some success has been made in closing or even reversing the gender pay gap over the last forty years or so. A country- and occupational-specific example of this latter trend is lawyers’ pay in the Netherlands, where women earn an average hourly wage of €15.16 whereas men earn €14.63. The explanation of this trend has been sought in the fact that Dutch female students on average graduate at a younger age than their male counterparts, which results in an earlier entry into the labour market for women. These extra years of work experience, combined with the higher grades that female students obtain compared to male students, gives them an advantage in their sector which is expressed in their pay. After the age of 30, however, the pay gap between men and women widens again, with men earning on average €27.74 per hour compared to €19.90 for women. A comparable pattern has been observed in the USA, where young female graduates in big cities also tend to find well-paid jobs in large international firms more often than their male colleagues23.
Weichselbaumer and Winter-Ebmer provide further evidence for this trend through an international analysis of the wage differential that they conducted in 2005, which shows that the differential had fallen from about 65 per cent in the late 1960s to 30 per cent in the 1990s. Weichselbaumer and Winter-Ebmer attribute this success to women gaining more work experience with fewer labour market interruptions, increasingly gaining more labour-market orientated
22 Hausmann, Tyson, Zahidi (2007), World Economic Forum. The Global Gender Gap Report 2007, p. 16.23 Het Financieel Dagblad, 22 August 2007. Based on findings from www.loonwijzer.nl.

51
education and technological change which has led to a ‘relative devaluation of physical strength and an increased demand for white-collar workers’. They suggest that ‘developments such as increased global competition and the introduction of anti-discrimination laws may also be responsible for decreasing gender wage gaps’24. The analysis also shows, however, that ‘men earn 25 per cent more than women with the same measurable characteristics’25 and that this gap has remained more or less constant over the last forty years that the study is based on.
An international comparison of the gender pay gap is complex and therefore a number of factors have to be taken into account. These will be briefly outlined below.
Calculating earningsIt is important for international comparison that the gender pay gap is estimated in a consistent way across all countries; however this is not possible due to countries using different measures to calculate the gap. There is a lack of internationally comparable earnings data, as Weichselbaumer and Winter-Ebmer point out: ‘(W)hile data on workers and their characteristics exist for most countries and allow national investigations…international data is sparse’26. The female to male average earnings ratio in a labour market thus varies by data availability and collection method, country, the period studied, the characteristics of the groups concerned27 and by the definition of the earnings variable that is used28. For example, most non-European Union countries calculate the gender gap based on monthly earnings (Japan, Kazakhstan, El Salvador), whereas others use hourly earnings (Panama, Sri Lanka, Australia). In the USA, median weekly earnings are used to calculate the gender pay gap. Calculations based on monthly and weekly earnings may distort the gender pay gap as a month’s or week’s pay may include overtime earnings. The ability to work overtime is biased towards men due to the uneven distribution of domestic caring responsibilities, which means that women are often not able to work as many overtime hours as men.
The use of annual earnings data to calculate the gender pay gap may also distort the estimate, as annual earnings may include overtime earnings, shift pay and bonus or incentive earnings in addition to basic pay, all of which
24 Weichselbaumer D. and Rudolf Winter-Ebmer (2007), The Effects of Competition and Equal Treatment Laws on Gender Wage Differentials, p. 238. 25 Ibid.26 Weichselbaumer D. and Rudolf Winter-Ebmer (2007), The Effects of Competition and Equal Treatment Laws on Gender Wage Differentials, p. 239.27 E.g. Beblo, Beninger, Heinze and Laisney state that the European Community Household Panel for France, Germany, Italy, Spain and the UK shows that at most 50 per cent of the difference in earnings between the sexes can be attributed to differences in characteristics. Beblo, Beninger, Heinze and Laisney (2003), Methodological Issues Related to the Analysis of Gender Gaps in Employment, Earnings and Career Progression, p.6.28 Chicha, M.T. (2006), A Comparative Analysis of Promoting Pay Equity: Models & Impacts. p. 3.
Methodology

52
disguise core elements for the existence of the gender pay gap, including direct sex discrimination.
Availability of earnings dataThe availability of earnings data varies vastly between countries. There is a large European bias in the data available and an estimate of the gender pay gap is therefore presented for most European countries. Comparably, the accessibility of data in other regions is poor. In Africa there is no comprehensive collection of information on earnings and where there is data, a gender breakdown of earnings is not made available. Similar with parts of Asia, there is little information on earnings by gender for central Asian countries.
The gender pay gap in some countries is distorted, even in favour of women in some countries (Bahrain, Costa Rica) due to the small proportion of women in the working population’s formal economy. For example, in the Middle East (where only about one third of women participate in the workforce), the gender pay gap is minus 40 per cent in Bahrain due to the greater representation of women in elite roles in the labour market compared with the small number of women represented in the total workforce, while the average earnings figure for men is pulled down by the greater representation of men in the overall labour market, and as a consequence also in the lower-paid roles. These inconsistencies in data collection and analysis mean that drawing global comparisons in the gender pay gap is fraught with difficulties.
Sample sizeAnother factor that has to be considered when making comparisons of the gender pay gap is that different samples are used globally. For example, the sample size may differ across countries, with larger sample sizes generally considered to be more reliable. Decisions made about the sample group also vary. For example, the ages of the sample group may vary and the definitions of full and part-time work may differ by each estimate. This is illustrated by the report of the European Commission, which includes those aged 15 to 64 working 15 hours or more, whereas the Beblo, Beninger, Heinze and Laisney report contains 25 to 55 year olds who are employed at least 8 hours a week29.
Type of employeeThe type of employee included in the sample used to estimate the gender pay gap also shows a lack of consistency between countries. Some use a comparison of full-time men against full-time women to calculate the gender pay gap, whereas other countries will include all employees in the calculation. Using a combination of both full and part-time employees will generally raise the gender pay gap if calculated on the mean, as women are over-represented in part-time work which is more often low-paid than full-time work. As a
29 Beblo, Beninger, Heinze and Laisney (2003), Methodological Issues Related to the Analysis of Gender Gaps in Employ-ment, Earnings and Career Progression.
53
consequence, this may contribute to a higher gender gap in countries where a large proportion of women work part-time.
Data collectionThe methods used for data collection on earnings can also cause questions to arise surrounding its reliability. Some household surveys, such as the Multi-Purpose Household Survey (Encu esta de Hogares the Propósitos Múltiples) in Costa Rica, allow other members of the household to answer research questions on behalf of individuals sharing the household and this can lead to inaccurate reporting. Data collection based on payslip information (for example the methodology based on the analysis of tax records as used in Saint Helena, or the Annual Survey of Hours and Earnings in the UK) is generally regarded as the most reliable method for collecting data on earnings.
The challenges ahead
As this report has shown, the gender pay gap is a complex problem, calling for a multi-level solution. Employers, trade unions and governments will all have to cooperate to eliminate the pay gap and make the catchphrase ‘equal pay for work of equal value’ a reality.
A first challenge to combat the gender pay gap on a global scale will be to come to an agreed definition of the gender pay gap. A single, internationally recognised definition of the gender pay gap needs to be agreed upon by (local, national and international) governments, and these governments have to make it a priority on their policy agenda to collect and share reliable national earnings data from which the respective national gender pay gaps can be calculated and compared.
In order to do this, there needs to be a common consensus around the various factors that compose the gap. As the European Commission has pointed out, a key challenge will be to ‘distinguish pay differences resulting from different labour market characteristics, on the one hand, and differences due to indirect or direct discrimination, on the other, including the societal differences in the evaluation of work and female dominated sectors or occupations’30.
Job evaluation that is free of any gender bias is therefore an important instrument in ensuring equal pay for work of equal value. Another equal pay measure that can be put into place is the implementation of regular equal pay audits in the workplace. However, Chicha points out that it is not sufficient to attempt to correct the gender pay gap only through pay31. She argues that equity policies and other types of policies are therefore required, including:
30 Commission of the European Communities (2007), Communication from the Commission: Tackling the pay gap between women and men, p.16.31 Chicha, M.T. (2006). A Comparative Analysis of Promoting Pay Equity: Models and Impacts, p.4.
54
Measures to ensure schools encourage female students to choose •male-dominated disciplinesPolices allowing both parents to achieve better work-life balance, •to ensure women’s work experience and seniority is not penalised. Measures also need to be taken whereby seniority continues to accumulate during maternity leaveRecruitment, selection and promotion practices to enhance women’s •access to better paid, maledominated occupations•Measures to encourage unionization and collective bargaining, •especially in jobs that are female-dominated, for example part-time, fixed-term and home-based work.
A Dutch research report written for the Netherlands Trade Union Confederation (Federatie Nederlandse Vakbeweging - FNV) furthermore emphasises the importance of a focused, tailor-made approach that takes into account the strengths and weaknesses of each occupational sector, with clear monitoring processes put into place to keep track of the successes or failures of the policy initiatives for the individual sectors32.
(Footnotes)
1 2004
2 2005
32 STZ Advies & Onderzoek and the University of Amsterdam (2007), Dicht de Loonkloof! Verslag van het CLOSE (Cor-rectie Loonkloof in Sectoren) – Onderzoek voor de FNV, ABVAKABO FNV en FNV Bondgenoten, p.41.
Recommended