THE EFFECT OF ISOLATED DAMPING LAYER SYSTEM ON EARTH DAM
UNDER EARTHQUAKE LOADING
BEHROUZ GORDAN
A thesis submitted in partial fulfilment of the
requirements for the award of degree of
Doctor Philosophy (Civil Engineering)
Faculty of Civil Engineering
Universiti Teknologi Malaysia
AUGUST 2014
iii
DEDICATION
To my respectful parents and beloved wife Tayebeh Alipour as well as my son Arian Gordan

iv
ACKNOWLEDGMENTS
In the name of God, the Most Merciful, the Most Gracious. I praise to God, to
create me able to undertake this research. Preparing this thesis, I was in contact with
many people, researchers, Academicians and practitioners. They have contributed
towards my understanding and thoughts. In particular, I wish to express my sincere
appreciation to my supervisor, Professor Dr. Azlan Bin Adnan for encouragement,
guidance, critics and friendship so without their continued support and interest, this
thesis would not have been the same as presented here.
In fact, my sincere appreciation also extends to all my colleagues and others
who have provided assistance at various occasions. Their views and tips are useful
indeed. Unfortunately, it is not possible to list all of them in this limited space. I am
grateful to all my family members. Special thanks to my wife for her loves, sacrifices,
patience and continues the struggle towards the accomplishment of this study.
v
ABSTRACT
The structural behavior during an earthquake is one of the major concerns for earth
dam of a medium size about 30 meter height and 90 meter width. The body crack is created by relative vertical displacement at both edges of the crest.The failure is recorded with the crack development in dam body by interaction between dam and reservoir. To reinforce dams, some methods were used with respect to literature such as perpendicular drain, prefabricated vertical drain, geotextile layers, pile group, micro pile injection and cutoff wall system. This research included three objectives; (i) Identifying damage location in earth dam with respect to case study (Bakun dam), (ii) Studying the effect of Isolated Damping Layer (IDL) system in blanket layer using physical modeling on top of the vibrator table, and (iii) Evaluating slope stability based on seismic motion. In terms of methodology, Finite-Element method using ANSYS13program and equilibrium method using Geostudio 2007 (Slope/W) were used. Series of soil mechanic test to design IDL and small-scale model (1/100) using IDL were carried out. Displacements, shear stresses and shear strains of dam were evaluated using nonlinear analysis under strong earthquake intensity of 0.6g. The major effect on the displacement of dam was due to different foundation properties (soft, medium and stiff soil) in comparison to different core configuration in terms of geometry. The best elastic modulus ratio between unsaturated part of dam and foundation, β was 0.66 for saturated part and foundation, λ was 0.13 in order to reduce response of the earth dam. Time-history and response spectra analysis of Bakun dam showed the minimum relative vertical displacement between both edges of crest by peak ground acceleration less than 0.24g. For all site classes, the displacement ratio (∆=2)
for return earthquake period from 2500 to 500 years was recorded. Based on modal analysis, the rigid behavior of foundation was achieved by modulus ratio more than three. Effect of modulus ratio on dominant frequency was greater than depth ratio. The minimum relative vertical displacement was attained when modulus elasticity ratio between shell and core clay was less than five. The optimal behavior was obtained by using clay in blanket layer when a modulus elasticity ratio was equal to 2.50, between this layer and weak foundation.The blanket layer was designed based on mixed product of laterite soil with shredded tire and micro silica. The main role of silica was to control seepage. The qualified combination by comparison of thirteen samples was distinguished. Subsequently, nine physical models were vibrated using dominant frequency. Most of damage occurred at upstream of one third near to the crest.The best absorption of energy without any destruction was observed when the layer thickness of reinforced blanket was one fourth of dam height.The safety factor was increased using blanket reinforced layer. Finally, IDL system showed the best performance in order to reinforce dam under resonance seismic motion.
vi
ABSTRAK
Pelakuan struktur semasa gempa bumi adalah salah satu daripada kebimbangan
utama bagi empangan bumi saiz sederhana untuk ketinggian kira-kira 30 meter dan 90 meter lebar. Keretakan pada empangan tanah disebabkan oleh anjakan tegak relatif pada penjuru struktur tersebut. Kegagalan struktur direkodkan bersama dengan retak dalam badan empangan oleh interaksi antara empangan dan takungan. Untuk mengukuhkan empangan, beberapa kaedah telah digunakan oleh penyelidik yang lepas seperti longkang serenjang, pasang siap longkang menegak, lapisan geotekstil , kumpulan cerucuk, suntikan cerucuk mikro dan sistem dinding potong. Terdapat tiga objektif kajian; (i) mengenalpasti lokasi kerosakan dalam empangan bumi seperti dalam kajian kes (Empangan Bakun), (ii) mengkaji kesan Isolated Damping Layer IDL sistem dalam lapisan selimut menggunakan model fizikal di atas meja penggegar dan (iii) menilai kestabilan cerun berdasarkan gerakan seismik. Untuk menjalankan kajian ini, kaedah Unsur-Terhingga oleh program ANSYS13 dan kaedah keseimbangan dalam Geostudio 2007 (Slope/W) telah digunakan. Beberapa siri ujian mekanik tanah dibuat untuk mereka bentuk (IDL) dan skala kecil model (1/100) menggunakan IDL juga dibuat. Anjakan, tegasan ricih dan tekanan ricih empangan telah dinilai daripada analisis tidak linear di bawah keamatan gempa bumi 0.6g. Kesan yang besar ke atas anjakan empangan adalah kerana sifat-sifat asas yang berbeza (tanah lembut, sederhana dan keras) berbanding dengan konfigurasi teras yang berbeza dari segi geometri. Nisbah modulus elastik antara bahagian tepu empangan dan asas, β adalah 0.66 dan antara bahagian tepu dan asas, λ adalah 0.13 untuk mengurangkan tindak balas empangan bumi. Masa sejarah dan analisis spektrum gerak balas empangan Bakun menunjukkan anjakan tegak relatif minimum antara kedua-dua tepi puncak oleh pecutan bumi puncak kurang daripada 0.24g. Selain itu, nisbah anjakan(Δ=2) untuk kembali pada tempoh gempa bumi dari 2500 ke arah 500 tahun untuk semua kelas tapak direkodkan. Sehubungan dengan analisis modal, tingkah laku tegar asas dicapai oleh nisbah modulus lebih daripada tiga. Anjakan minimum menegak relatif dicapai apabila nisbah modulus keanjalan antara cengkerang dan teras tanah liat adalah kurang daripada lima. Tingkah laku yang optimum ditunjukkan dengan menggunakan tanah liat pada lapisan selimut apabila nisbah modulus keanjalan adalah sama dengan 2.50, antara lapisan ini dan asas tapak yang lemah. Lapisan selimut telah dibuat berdasarkan campuran produk daripada tanah laterit bersama hirisan tayar dan mikro silika. Peranan utama silika adalah untuk mengawal resapan. Kombinasi terbaik diperolehi daripada perbandingan lima belas sampel. Selepas itu, sembilan model fizikal telah digetarkan. Kebanyakan kerosakan berlaku di bahagian satu pertiga puncak. Penyerapan terbaik oleh tenaga tanpa apa-apa kemusnahan diperhatikan apabila ketebalan lapisan penutup bertetulang adalah satu perempat daripada ketinggian empangan. Selain itu, faktor keselamatan telah meningkat dengan lapisan selimut bertetulang. Akhirnya, system IDL menunjukkan kelakunan terbaik bagi memperkuatkan empangan di bawah gegaran sismik resonan.
vii
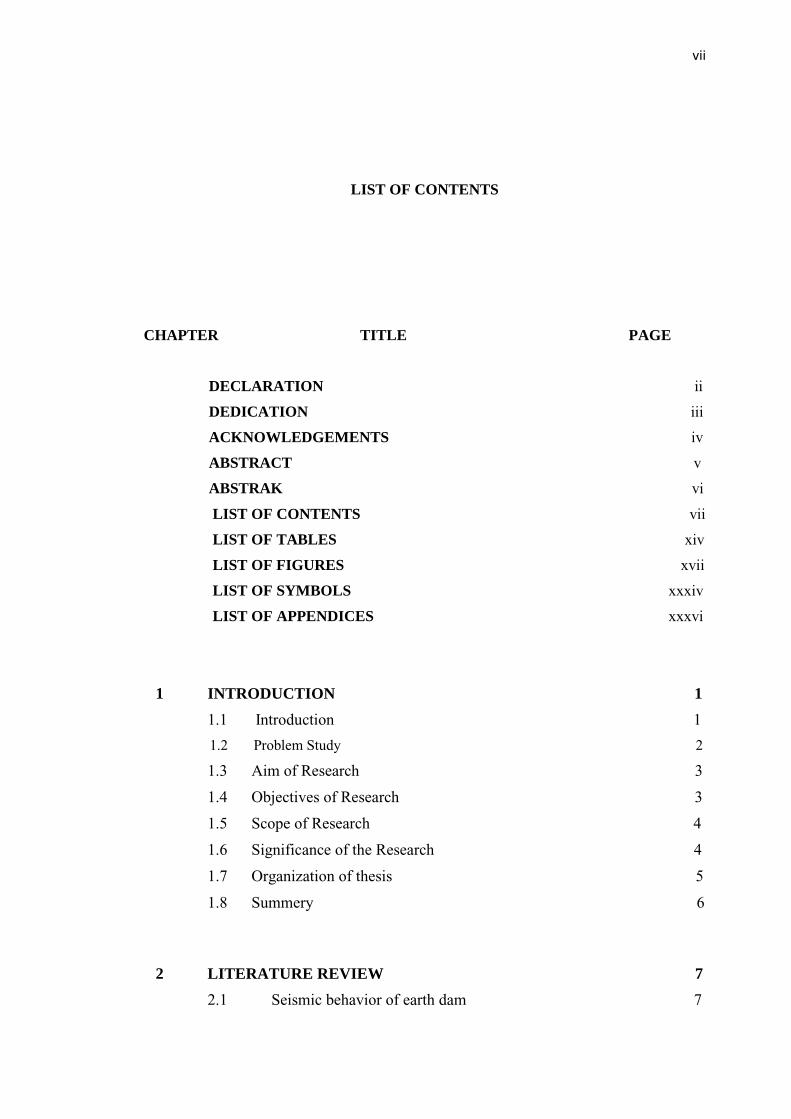
LIST OF CONTENTS
CHAPTER TITLE PAGE
DECLARATION ii
DEDICATION iii
ACKNOWLEDGEMENTS iv
ABSTRACT v
ABSTRAK vi
LIST OF CONTENTS vii
LIST OF TABLES xiv
LIST OF FIGURES xvii
LIST OF SYMBOLS xxxiv
LIST OF APPENDICES xxxvi
1 INTRODUCTION 1
1.1 Introduction 1
1.2 Problem Study 2
1.3 Aim of Research 3
1.4 Objectives of Research 3
1.5 Scope of Research 4
1.6 Significance of the Research 4
1.7 Organization of thesis 5
1.8 Summery 6
2 LITERATURE REVIEW 7
2.1 Seismic behavior of earth dam 7
viii
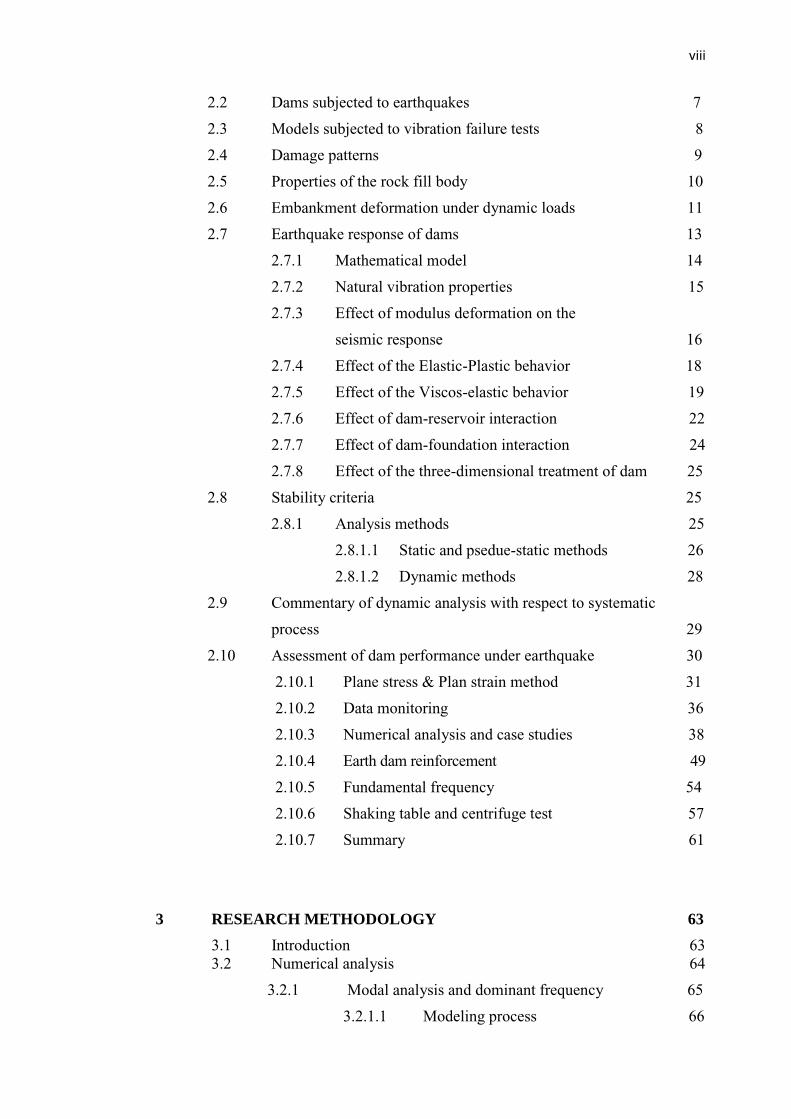
2.2 Dams subjected to earthquakes 7
2.3 Models subjected to vibration failure tests 8
2.4 Damage patterns 9
2.5 Properties of the rock fill body 10
2.6 Embankment deformation under dynamic loads 11
2.7 Earthquake response of dams 13
2.7.1 Mathematical model 14
2.7.2 Natural vibration properties 15
2.7.3 Effect of modulus deformation on the
seismic response 16
2.7.4 Effect of the Elastic-Plastic behavior 18
2.7.5 Effect of the Viscos-elastic behavior 19
2.7.6 Effect of dam-reservoir interaction 22
2.7.7 Effect of dam-foundation interaction 24
2.7.8 Effect of the three-dimensional treatment of dam 25
2.8 Stability criteria 25
2.8.1 Analysis methods 25
2.8.1.1 Static and psedue-static methods 26
2.8.1.2 Dynamic methods 28
2.9 Commentary of dynamic analysis with respect to systematic
process 29
2.10 Assessment of dam performance under earthquake 30
2.10.1 Plane stress & Plan strain method 31
2.10.2 Data monitoring 36
2.10.3 Numerical analysis and case studies 38
2.10.4 Earth dam reinforcement 49
2.10.5 Fundamental frequency 54
2.10.6 Shaking table and centrifuge test 57
2.10.7 Summary 61
3 RESEARCH METHODOLOGY 63
3.1 Introduction 63 3.2 Numerical analysis 64
3.2.1 Modal analysis and dominant frequency 65
3.2.1.1 Modeling process 66
ix
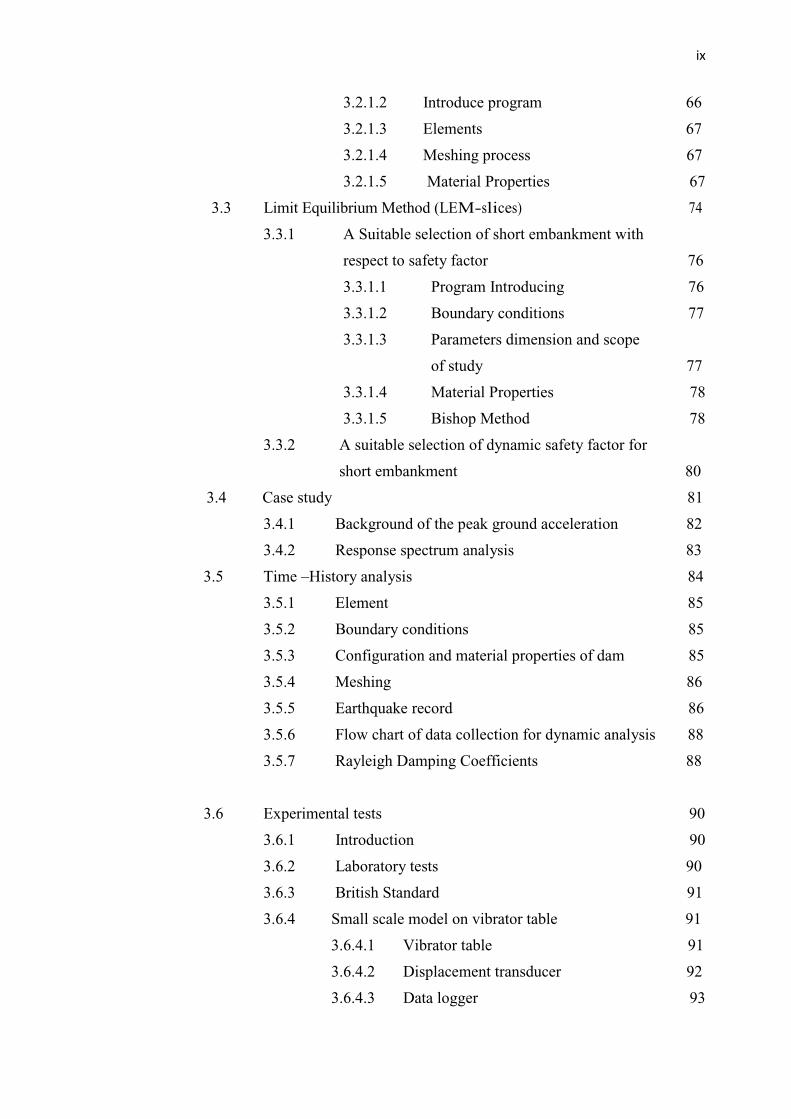
3.2.1.2 Introduce program 66
3.2.1.3 Elements 67
3.2.1.4 Meshing process 67
3.2.1.5 Material Properties 67
3.3 Limit Equilibrium Method (LEM-slices) 74
3.3.1 A Suitable selection of short embankment with
respect to safety factor 76
3.3.1.1 Program Introducing 76
3.3.1.2 Boundary conditions 77
3.3.1.3 Parameters dimension and scope
of study 77
3.3.1.4 Material Properties 78
3.3.1.5 Bishop Method 78
3.3.2 A suitable selection of dynamic safety factor for
short embankment 80
3.4 Case study 81
3.4.1 Background of the peak ground acceleration 82
3.4.2 Response spectrum analysis 83
3.5 Time –History analysis 84
3.5.1 Element 85
3.5.2 Boundary conditions 85
3.5.3 Configuration and material properties of dam 85
3.5.4 Meshing 86
3.5.5 Earthquake record 86
3.5.6 Flow chart of data collection for dynamic analysis 88
3.5.7 Rayleigh Damping Coefficients 88
3.6 Experimental tests 90
3.6.1 Introduction 90
3.6.2 Laboratory tests 90
3.6.3 British Standard 91
3.6.4 Small scale model on vibrator table 91
3.6.4.1 Vibrator table 91
3.6.4.2 Displacement transducer 92
3.6.4.3 Data logger 93
x
3.6.4.4 Sinusoidal vibrate loading 94
3.6.4.5 Scaling laws 95
3.6.4.6 Dynamic problems 97
3.6.4.7 Physical small modeling on vibrator table 97
3.7 Input data for Time –history analysis 102
3.7.1 Relationship between material property of foundation
and relative displacement in the earth dam 102 3.7.2 Effect of material property in the shallow foundation of earth dam on dynamic settlement 104
3.7.3 Effect of material property in foundation during
earthquake on the Embankment 106
3.7.4 Relationship between material properties of embankment
saturated on soft soil and dynamic settlement during
earthquake 107
3.7.5 Settlement during an earthquake in the unsaturated crest
of embankment on soft soil 109
3.7.6 Dynamic behaviour of homogenize earth dam using
different characteristics in the cut off wall method 112
3.7.7 Dynamic analysis of homogenize earthen dam using Blanket layer technique 115 3.7.8 Effect of material properties in CFRD Tailing-Embankment Bridge during a strong Earthquake 118 3.8 Soil properties 121
3.9 Computing of the secant modulus (E50%) for soil samples 122
3.10 Comparision between present methodology and literature review 122
3.11 Verify physical modeling 123
3.12 Summery 124
4 ANALYTICAL AND EXPERIMENTAL TESTS 125
4.1 Introduction 125
4.2 Numerical results 125
4.2.1 Dominant frequency result 126
xi
4.2.1.1 Modal Analysis of Short Embankment with
effect of Depth and Modulus Elasticity of
Foundation 126
4.2.1.2 Dominant Frequency Tailing Embankment
Interface to Bridge By 3D Finite Element
Method 130
4.2.1.3 Modal analysis of the earth dam in terms of
parametric configuration and material
properties 135
4.2.1.4 Modal analysis of the embankment with
parametric configuration and material
properties 143
4.2.2 Slope stability 150
4.2.2.1 A Suitable selection of short embankment with
respect to safety factor 150
4.2.2.2 A suitable selection of dynamic safety factor
for short embankment 155
4.3 Experimental test 160
4.3.1 Laboratory test with respect to soil Properties 160
4.3.1.1 Classification tests BS 1377-1 1990;
Determinati of the liquid limit test
BS 1377-2 1990 and Determination of
the plastic limit and plasticity
index BS 1377-2 1990 160
4.3.1.2 Determination of dry density/moisture
content relationship test BS 1377-4 1990 163
4.3.1.3 Quick shear strength test without measurement
of pore pressure 164
4.3.1.4 Consolidation test 179
4.3.1.5 Permeability test 181
4.3.1.6 Direct shear test 181
4.3.1.7 Estimation of damping ratio 183
4.4 Small scale model 185
4.4.1 Slop stability for physical modeling 185
xii
4.4.2 Free vibration Analysis for small-scale modeling 189
4.4.3 Small scale physical models 191
4.4.3.1 First model 191
4.4.3.2 Second model 195
4.4.3.3 Third model 198
4.4.3.4 Fourth model 202
4.4.3.5 Fifth model 204
4.4.3.6 Sixth model 206
4.4.3.7 Seventh model 210
4.4.3.8 Eighth model 213
4.4.3.9 Ninth model 216
5 TIME-HISTORY ANALYSIS WITH CASE STUDY (BAKUN DAM) 221
5.1 Introduction 221
5.2 Case study (Bakun Dam) 221
5.2.1 Response spectrum analysis of Bakun dam with concrete
face rock-fill dam 222
5.2.2 A seismic Assessment of Concrete Face Rock-Fill Dam
(CFRD); Bakun Dam 236
5.2.3 Safety factor for concrete face rock-fill dam (Bakun dam) 242
5.3 Time-history Analysis 243
5.3.1 Relationship between material property of foundation and
relative displacement in the earth dam 243
5.3.2 Effect of material property in the shallow foundation of
earth dam on dynamic settlement 245
5.3.3 Effect of material property in foundation during
earthquake on the Embankment 247
5.3.4 Relationship between material properties of embankment
saturated on soft soil and dynamic settlement during
earthquake 249
5.3.5 Settlement during an earthquake in the unsaturated crest
of embankment on soft soil 252
5.3.6 Dynamic behaviour of homogenize earth dam using
different characteristics in the cut off wall method 254
xiii
5.3.7 Dynamic analysis of homogenize earthen dam using
blanket layer technique 260
5.3.8 Effect of material properties in CFRD
Tailing-Embankment Bridge during a strong earthquake 267
6 CONCLUSION 275
6.1 Introduction 275
6.2 Conclusion of numerical results 275
6.3 Case study and parametric study 277
6.4 Slope stability 278
6.5 Experimental test to design isolated damping layer 279
6.6 Small-scale model on vibrator table 280
6.7 Recommendation 280
REFERENCES 281-287
Appendices A-C 288-315
xiv
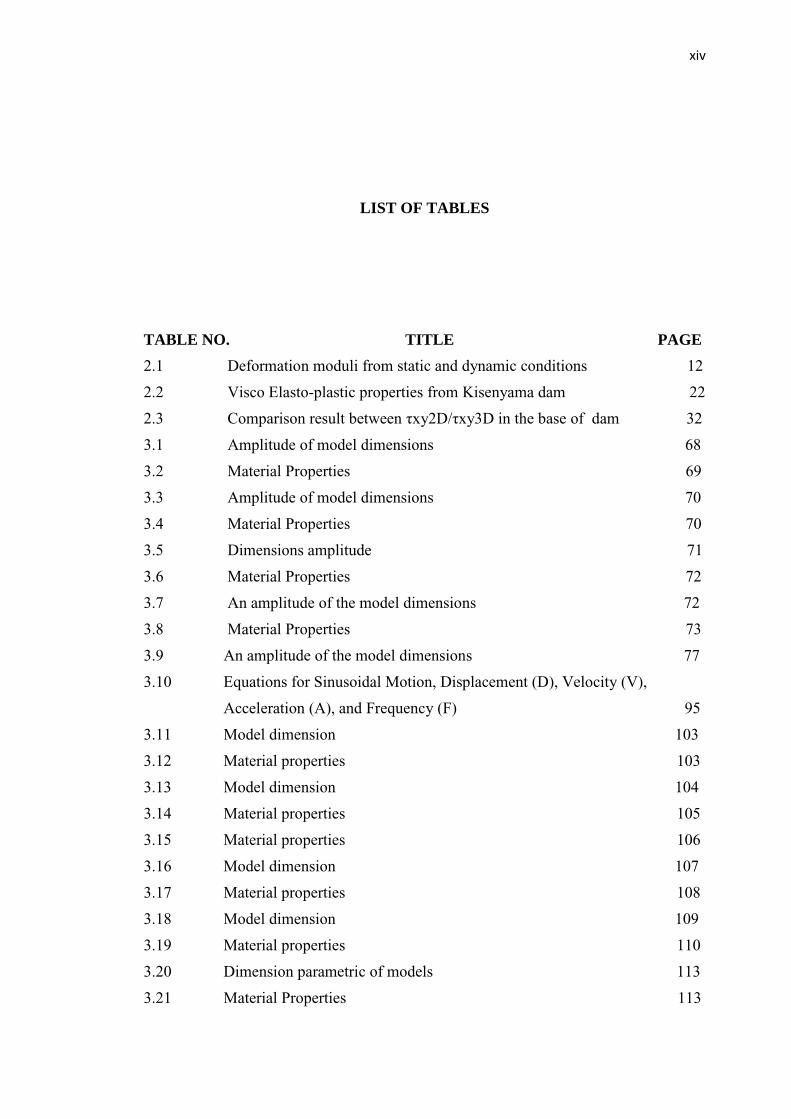
LIST OF TABLES
TABLE NO. TITLE PAGE
2.1 Deformation moduli from static and dynamic conditions 12
2.2 Visco Elasto-plastic properties from Kisenyama dam 22
2.3 Comparison result between τxy2D/τxy3D in the base of dam 32
3.1 Amplitude of model dimensions 68
3.2 Material Properties 69
3.3 Amplitude of model dimensions 70
3.4 Material Properties 70
3.5 Dimensions amplitude 71
3.6 Material Properties 72
3.7 An amplitude of the model dimensions 72
3.8 Material Properties 73
3.9 An amplitude of the model dimensions 77
3.10 Equations for Sinusoidal Motion, Displacement (D), Velocity (V),
Acceleration (A), and Frequency (F) 95
3.11 Model dimension 103
3.12 Material properties 103
3.13 Model dimension 104
3.14 Material properties 105
3.15 Material properties 106
3.16 Model dimension 107
3.17 Material properties 108
3.18 Model dimension 109
3.19 Material properties 110
3.20 Dimension parametric of models 113
3.21 Material Properties 113
xv
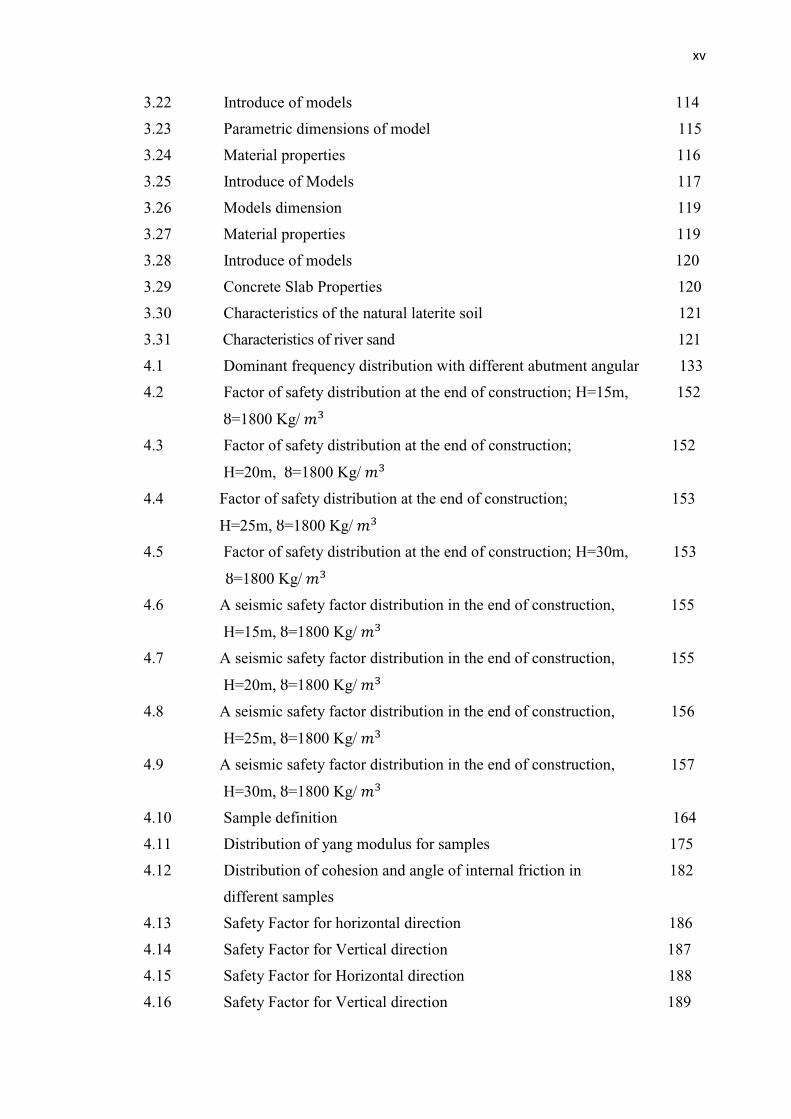
3.22 Introduce of models 114
3.23 Parametric dimensions of model 115
3.24 Material properties 116
3.25 Introduce of Models 117
3.26 Models dimension 119
3.27 Material properties 119
3.28 Introduce of models 120
3.29 Concrete Slab Properties 120
3.30 Characteristics of the natural laterite soil 121
3.31 Characteristics of river sand 121
4.1 Dominant frequency distribution with different abutment angular 133
4.2 Factor of safety distribution at the end of construction; H=15m, 152
ȣ=1800 Kg/
4.3 Factor of safety distribution at the end of construction; 152
H=20m, ȣ=1800 Kg/
4.4 Factor of safety distribution at the end of construction; 153
H=25m, ȣ=1800 Kg/
4.5 Factor of safety distribution at the end of construction; H=30m, 153
ȣ=1800 Kg/
4.6 A seismic safety factor distribution in the end of construction, 155
H=15m, ȣ=1800 Kg/
4.7 A seismic safety factor distribution in the end of construction, 155
H=20m, ȣ=1800 Kg/
4.8 A seismic safety factor distribution in the end of construction, 156
H=25m, ȣ=1800 Kg/
4.9 A seismic safety factor distribution in the end of construction, 157
H=30m, ȣ=1800 Kg/
4.10 Sample definition 164
4.11 Distribution of yang modulus for samples 175
4.12 Distribution of cohesion and angle of internal friction in 182
different samples
4.13 Safety Factor for horizontal direction 186
4.14 Safety Factor for Vertical direction 187
4.15 Safety Factor for Horizontal direction 188
4.16 Safety Factor for Vertical direction 189
xvi
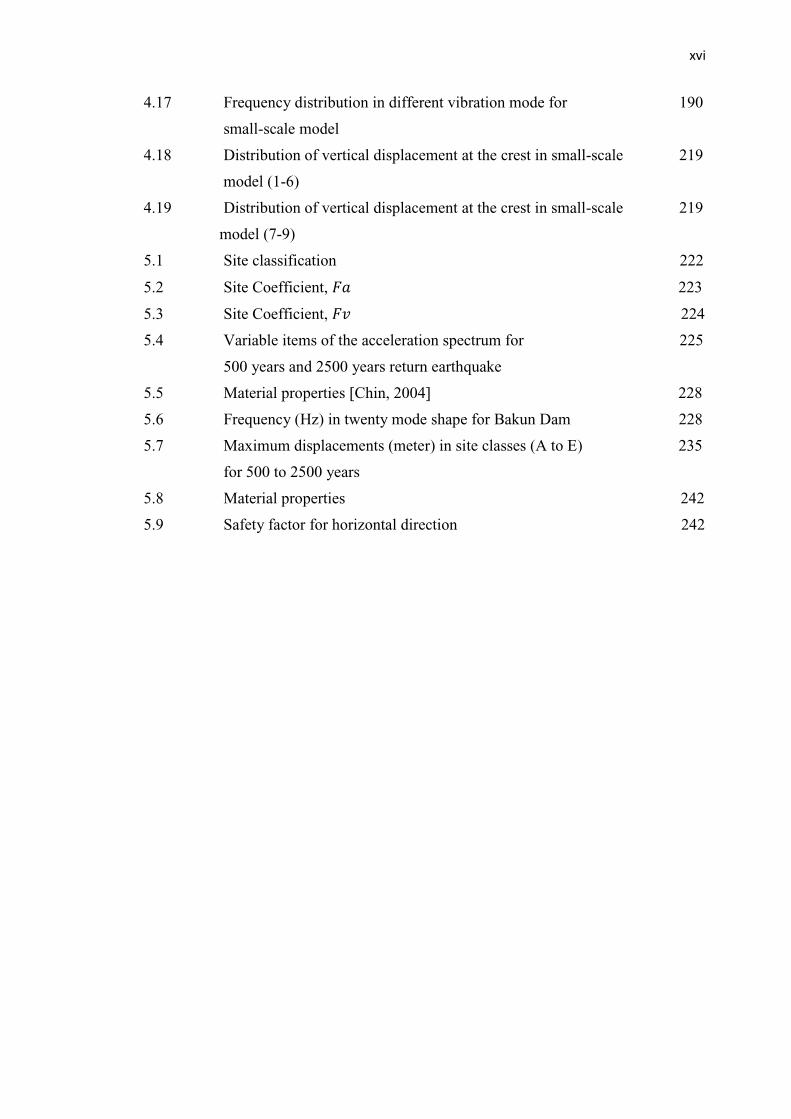
4.17 Frequency distribution in different vibration mode for 190
small-scale model
4.18 Distribution of vertical displacement at the crest in small-scale 219
model (1-6)
4.19 Distribution of vertical displacement at the crest in small-scale 219
model (7-9)
5.1 Site classification 222
5.2 Site Coefficient, 223
5.3 Site Coefficient, 224
5.4 Variable items of the acceleration spectrum for 225
500 years and 2500 years return earthquake
5.5 Material properties [Chin, 2004] 228
5.6 Frequency (Hz) in twenty mode shape for Bakun Dam 228
5.7 Maximum displacements (meter) in site classes (A to E) 235
for 500 to 2500 years
5.8 Material properties 242
5.9 Safety factor for horizontal direction 242
xvii
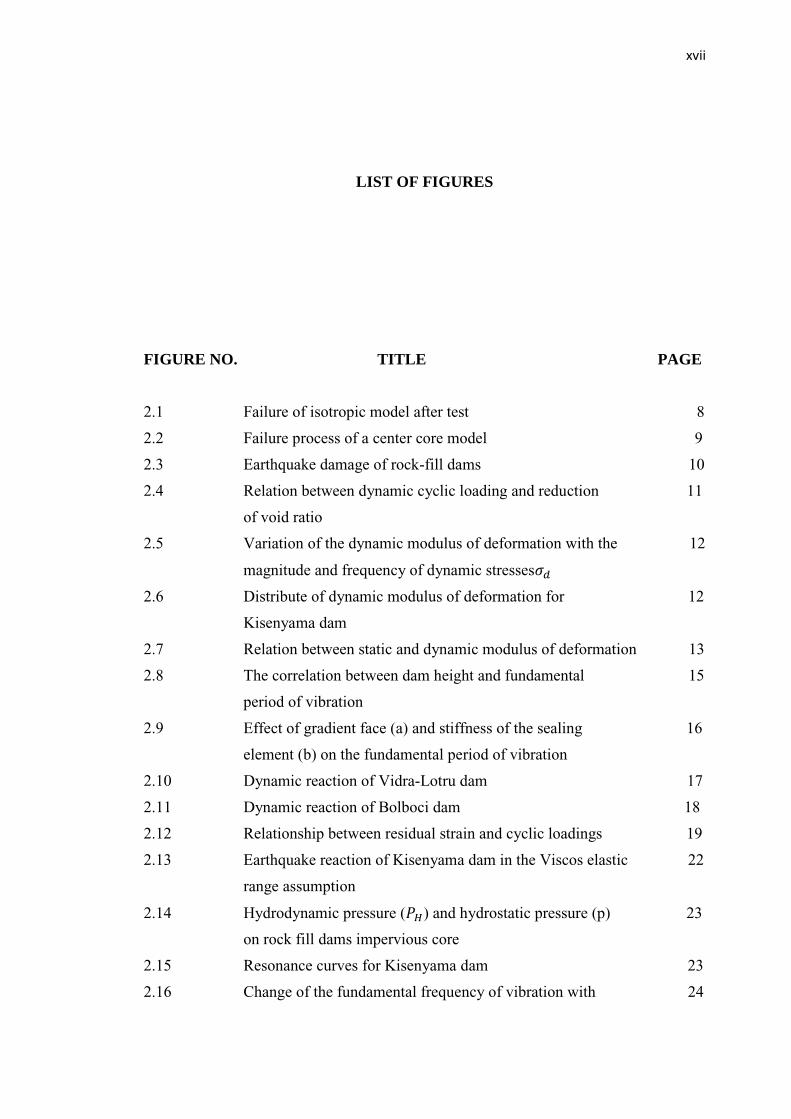
LIST OF FIGURES
FIGURE NO. TITLE PAGE
2.1 Failure of isotropic model after test 8
2.2 Failure process of a center core model 9
2.3 Earthquake damage of rock-fill dams 10
2.4 Relation between dynamic cyclic loading and reduction 11
of void ratio
2.5 Variation of the dynamic modulus of deformation with the 12
magnitude and frequency of dynamic stresses
2.6 Distribute of dynamic modulus of deformation for 12
Kisenyama dam
2.7 Relation between static and dynamic modulus of deformation 13
2.8 The correlation between dam height and fundamental 15
period of vibration
2.9 Effect of gradient face (a) and stiffness of the sealing 16
element (b) on the fundamental period of vibration
2.10 Dynamic reaction of Vidra-Lotru dam 17
2.11 Dynamic reaction of Bolboci dam 18
2.12 Relationship between residual strain and cyclic loadings 19
2.13 Earthquake reaction of Kisenyama dam in the Viscos elastic 22
range assumption
2.14 Hydrodynamic pressure ( ) and hydrostatic pressure (p) 23
on rock fill dams impervious core
2.15 Resonance curves for Kisenyama dam 23
2.16 Change of the fundamental frequency of vibration with 24
xviii
the deformation
2.17 Verification of stability of the rock-fill dams under 27
earthquake loading
2.18 Verity of the safety factor with the location of the 28
sliding surface
2.19 3D finite element mesh with 591 elementsand 705 nodal points 32
2.20 2D finite element mesh for quarter and maximum section 32
from Orovill dam
2.21 3D condition from Villita dam 33
2.22 Lavillita dam: a) Maximum crosses section 33
b) Plan view c) Geological profile
2.23 Main points at the crest of the La Villita dam with geometry 34
2.24 Acceleration distribution at the crest of the La Villita dam 34
2.25 Parametric modeling of dams 35
2.26 Relationship between Fs and ε with different gradient of slopes 35
2.27 Arrangement of sensors to record data on long valley dam 37
2.28 Arrangement of sensors to record data on dam at the crest 37
2.29 Distribution of vertical displacement during time for 38
S20 (middle) and S28 (toward the tail-end) at crest
2.30 Positions of node number along the centerline of the dam 39
2.31 Maximum acceleration along the vertical axis of the dam body 39
2.32 Dam deformation at the maximum excitation under Kocaeli 40
record (Umax=0.30m at the crest)
2.33 Velocity amplification in the dam axis 40
2.34 Influence of the core stiffness on the velocity response 41
under Kocaeli record
2.35 PGA=0.15g at the base 42
2.36 PGA=0.50g at the crest 42
2.37 Crest settlement as function of time for different 43
core arrangements
2.38 Settlement at the crest 43
2.39 Concrete slab dislocation Zpingpu dam during 44
Wenchuan earthquake
2.40 Distribution of stress along the concrete slab slope 44
2.41 Dam-axial concrete slab stress (Mpa) after earthquake(3D FEM) 45
xix
2.42 Regular mesh method with reservoir interaction 45
2.43 Vertical displacement at crest during loading 46
2.44 Safety factor during earthquake 46
2.45 Horizontal and vertical displacements during earthquake 47
2.46 Horizontal and vertical displacements contoures during 47
earthquake in each sub step
2.47 Typical buttress and dam cross section 48
2.48 Vertical drains on soft soil 50
2.49 Drain installation pattern 51
2.50 3D model of vertical drains 51
2.51 Mechanism of the pile with geotextile 52
2.52 Membrane effect observed over the pile 52
2.53 Membrane behavior of the geotextile 53
2.54 Idealized stress distribution on geotextile 53
2.55 Spectral ratio of Nanhua dam during the 55
16 February 2000 earthquake
2.56 The first natural frequency verse length-height ratio 56
2.57 The first natural frequency verse Width-height ratio 56
2.58 Cases on the shaking table test 57
2.59 Photographs after shaking for all cases 58
2.60 Excess pore water pressure distribution 59
2.61 Location of the pore water pressure sensor 59
2.62 Deformation shape of embankment-Subsoil system at 59
different instants of time
2.63 Primary centrifuge test 60
2.64 Embankment with reservoir on shaking table test 60
2.65 Central core dam model with relative density of dam body 61
(a) 70%(b) 50% (c) 20% and (d) dam model with membrane
coverd face
3.1 The framework of research methodology 64
3.2 Mass spring system 65
3.3 Mesh with regular method 67
3.4 Parametric dimensional of models 68
3.5 3D shape of model 70
3.6 Free mesh of model 70
xx
3.7 Configuration parameters of models in 2D condition 71
3.8 Mesh model, H =50m , = 72
3.9 A parametric dimensional of models 73
3.10 The regular mesh of the model with 30 m height and α= 74
3.11 The idea of slice method and definition of safety factor 75
according to equations 1-3
3.12 Flow chart of slope stability 76
3.13 A parametric dimensional of models 77
3.14 Safety Factor in the end of construction for isotropic 78
Embankment (H=30m, α= , C= , υ=
Kg/ SF=2.389)
3.15 Large scale of all slices in slip surface 79
3.16 Safety map 79
3.17 Distribution of Shear Mobilized in slice, same condition 80
3.18 Superposition from shear strength with Frictional and 80
Cohesive in critical surface slip; A) Shear strength, B) Frictional,
C) Cohesion
3.19 A) Tappar dam displayed longitudinal cracks at its upstream 81
toe during the Bhuj Earthquake. B) Lateral spreading zone at the
downstream toe of the Kaswati dam
3.20 Situation of Bakun dam (CRFD) in the east of Malaysia 81
3.21 Dam perspective before reservoir 82
3.22 PGA map, 500 years 82
3.23 PGA map, 2500 years 83
3.24 Chart process 84
3.25 Regular mesh for Bakun dam 86
3.26 Nagan earthquake, displacement on the vertical axis (meter) 86
and time on the horizontal axis (seconds)
3.27 Azna earthquake, displacement on the vertical axis (meter) 87
and time on the horizontal axis (seconds)
3.28 Palm Springs earthquake, displacement on the vertical 87
axis (meter) and time on the horizontal axis (seconds)
3.29 Flow Chart processing of dynamic analysis using 88
Time –history method
3.30 Variation of damping ratio with natural frequency of a system 90
xxi
3.31 Vibrator Table 92
3.32 Displacement transducer, CDP-100 93
3.33 Dimension of displacement transducer, CDP-100 93
3.34 Data logger, UCAM-70A 94
3.35 20 Hz Sinusoidal motion 95
3.36 First physical small scale modeling 98
3.37 Second physical small-scale modeling 98
3.38 Third physical small-scale modeling 99
3.39 Fourth physical small-scale modeling 99
3.40 Fifth physical small-scale modeling 100
3.41 Sixth physical small-scale modeling 100
3.42 Seventh physical small-scale modeling 101
3.43 Eighth physical small-scale modeling 101
3.44 Ninth physical small-scale modeling 102
3.45 Dam section with parameters for 2D analysis 103
3.46 Regular mesh with five main points 104
3.47 This figure illustrated a dam model for plane strain 105
analysis (2D) with parameters and main points
3.48 Mesh model with five main points 107
3.49 A dimension of models according to Table 3.16 for 108
plane strain analysis (2D)
3.50 Main points of model 109
3.51 Regular mesh of model 109
3.52 Model dimension according to Table 4.24 for 110
plane strain (2D) analysis
3.53 This figure main point (1-5) to exist data analysis 111
3.54 Model mesh with regular method 111
3.55 Parametric model 112
3.56 Parametric reinforcement models 112
3.57 Initial mesh 114
3.58 Reinforcement mesh 114
3.59 Main points for initial model 114
3.60 Main points for reinforcement models 114
3.61 Parametric initial model 116
3.62 Parametric blanket layer model 116
xxii
3.63 Initial model with regular mesh 117
3.64 Reinforcement model with regular mesh 117
3.65 Key points of the models 118
3.66 Parametric Dimension of model 118
3.67 Mesh of the initial model with regular method 120
3.68 Key points of models 120
3.69 Definition of secant modulus 122
3.70 Sinusoidal motion calculator 123
3.71 Factor of safety for PGA=0.4 g in third small scale model 124
4.1 Flowchart of results 125
4.2 Distribution of frequency (vertical axis) and Mode shape 126
(x= 1-5 (Horizontal axis)), n=0.5, k=0.25
4.3 Mode shape 1, n=0.50, K=0.25, Frequency=0.144186 Hz 127
4.4 Mode shape 2, n=0.50, K=0.25, Frequency=0.222663 Hz 127
4.5 Mode shape 3, n=0.50, K=0.25, Frequency=0.257265 Hz 127
4.6 Mode shape 4, n=0.50, K=0.25, Frequency=0.319943 Hz 127
4.7 Amplitude of dominant frequency with a variant of modulus 128
ratio (k=0.25-1.00) and depth ratio of foundation for short
embankment with h=30 meter so horizontal axis - deep
ratio (0.1-1.00) and vertical axis - dominate the frequency (Hz)
4.8 Horizontal displacement (meter) with different depth ratio 129
and modulus ratio
4.9 Vertical displacement (meter) with different depth ratio and 129
modulus ratio
4.10 Relative vertical displacement (meter) for slopes, 130
n=0.50 and k=0.25
4.11 DF curves for different modulus elasticity, relative density 131
is 1700 Kg/
4.12 DF curves for different modulus elasticity, relative density 131
is 1800 Kg/
4.13 DF curves for different modulus elasticity, relative density 132
is 1900 Kg/
4.14 Abutment angular 133
4.15 Relationship between angular abutment and (DF) 134
4.16 DF for mode shape 1-5. H=20m, relative density 134
xxiii
is 1900 Kg/
4.17 Total displacement, H=25m, 134
ȣ=1900 Kg/ , E=0. 50e6 Kg/ (Mode1)
4.18 Displacement (x), H=25m, 134
ȣ=1900 Kg/ , E=0. 50Kg/ (Mode1)
4.19 Displacement (Y), H=25m, 135
ȣ=1900 Kg/ , E=0.50e6 Kg/ (Mode1)
4.20 Displacement (Z), H=25m, 135
ȣ=1900 Kg/ , E=0.50e Kg/ (Mode1)
4.21 Dominate frequency curve; Core clay gradient=45 degree, 136
K=1-10
4.22 Dominate frequency curve; Core clay gradient=60 degree, 136
K=1-10
4.23 Dominate frequency curve; Core clay gradient=90 degree, 137
K=1-10
4.24 Dominate frequency curves with different core clay gradient 137
and modulus ratio
4.25 Frequency curves in vibration modes 1-5. The Horizontal 138
and vertical axis have introduced modulus ratio (K), and
dominant frequency(Hz) respectively
4.26 Mode shape 1, (f=0.098103Hz), = 45, k =1 139
4.27 Mode shape 1, (f=0.098103Hz), = 60, k = 1 139
4.28 Horizontal displacement in vibration 139
mode 1(f=0.098103Hz), =45, K=1
4.29 Vertical displacement in vibration mode 1 139
(f=0.098103Hz), =45, K=1
4.30 Horizontal displacement, mode vibration 1 140
4.31 Minimum vertical displacement, mode vibration 1 140
4.32 Maximum vertical displacement, mode vibration 1 140
4.33 Mode shape 1, =60, K=5 141
4.34 Mode shape 1, =60, K=10 141
4.35 Mode shape 1 for model with = , k=1 142
4.36 Mode shape 5 for model with = , k=1 142
4.37 H-displacement, mode 1 142
4.38 H-displacement, mode 1 142
xxiv
4.39 H-displacement, mode 1 142
4.40 V-displacement, mode 1 142
4.41 V-displacement, mode 1 143
4.42 V-displacement, mode 1 143
4.43 Dominant frequency of the first mode for H=30m in models 144
with different slope
4.44 Dominant frequency of the first mode for H=40m in models 144
with different slope
4.45 Dominant frequency of the first mode for H=50m in models 144
with different slope
4.46 Dominant frequency of the first mode for H=60m in models 145
with different slope
4.47 Dominant frequency of the first mode for H=70m in models 145
with different slope
4.48 Dominant frequency of the first mode for H=80m in models 145
with different slope
4.49 Dominant frequency of the first mode for H=90m in models 146
with different slope
4.50 Dominant frequency (Model 5) of the first mode for different 146
height of embankment (30-90 m) and different slope
4.51 Dominate frequency of the first mode for different height 147
of embankment (30-90 m) and different slope in model 6
4.52 Comparison of the dominant frequency between models 5-6 147
4.53 Mode shape 1 (H=30, α= ) 148
4.54 Mode shape 2 (H=30, α= ) 148
4.55 Mode shape 3 (H=30, α= ) 148
4.56 Mode shape 4 (H=30, α= ) 148
4.57 Mode shape 5 (H=30, α= ) 149
4.58 Horizontal displacement contour-Mode 1, (H=30, α= ) 149
4.59 Vertical displacement contour- Mode1, (H=30, α= ) 149
4.60 Factor of Safety distribution, H=15 m; α= , Black 151
rectangular showed the base value to compute another
condition of density
4.61 Safety Factor distribution, H=15m, C =20 KP, 151
xxv
ȣ=1800 Kg/ ; α =15, 20, 30 and 35
4.62 Factor of Safety distribution; C =50 KP; ȣ=1800 Kg/ 154
4.63 Acceptable area of Safety Factor for isotropic embankment 154
4.64 Dynamical safety factor, H=15m, C=20KP 158
4.65 Dynamical safety factor, H=15m, C=50KP 158
4.66 Dynamical safety factor, H=30m, C=20KP 159
4.67 Dynamical safety factor, H=30m, C=50KP 159
4.68 Dynamical safety factor for vertical direction 160
4.69 Laterite gradation 161
4.70 TDA gradation 162
4.71 Micro silica gradation 162
4.72 Distribution of particle density for samples 163
4.73 Compaction test 163
4.74 The undrained Shear Strength in the Triaxial Compression 165
without measurement of Pore Pressure (Quick undrained) for
sample 1 (laterite soil)
4.75 The undrained Shear Strength in the Triaxial Compression 165
without measurement of Pore Pressure (Quick undrained) for
sample 2 (laterite soil with 3% TDA)
4.76 The undrained Shear Strength in the Triaxial Compression 166
without measurement of Pore Pressure (Quick undrained) for
sample 3 (laterite soil with 5% TDA)
4.77 The undrained Shear Strength in the Triaxial Compression 166
without measurement of Pore Pressure (Quick undrained) for
sample 4 (laterite soil with 7% TDA)
4.78 The undrained Shear Strength in the Triaxial Compression 167
without measurement of Pore Pressure (Quick undrained) for
sample 5 (laterite soil with 10% TDA)
4.79 The undrained Shear Strength in the Triaxial Compression 168
without measurement of Pore Pressure, sample 1 to 5
4.80 The undrained Shear Strength in the Triaxial Compression 168
without measurement of Pore Pressure (Quick undrained) for
sample 6 (laterite soil with 3% TDA and 2%Si)
4.81 The undrained Shear Strength in the Triaxial Compression 169
without measurement of Pore Pressure (Quick undrained) for
xxvi
sample 7 (laterite soil with 3% TDA and 3%Si)
4.82 The undrained Shear Strength in the Triaxial Compression 169
without measurement of Pore Pressure, sample 2, 6 and 7
4.83 The undrained Shear Strength in the Triaxial Compression 170
without measurement of Pore Pressure (Quick undrained) for
sample 8 (laterite soil with 5% TDA and 2%Si)
4.84 The undrained Shear Strength in the Triaxial Compression 170
without measurement of Pore Pressure (Quick undrained) for
sample 9 (laterite soil with 5% TDA and 3%Si)
4.85 The undrained Shear Strength in the Triaxial Compression 171
without measurement of Pore Pressure, sample 3, 8 and 9
4.86 The undrained Shear Strength in the Triaxial Compression 172
without measurement of Pore Pressure (Quick undrained) for
sample 10 (laterite soil with 7% TDA and 3%Si)
4.87 The undrained Shear Strength in the Triaxial Compression 172
without measurement of Pore Pressure (Quick undrained) for
sample 11 (laterite soil with 7% TDA and 4%Si)
4.88 The undrained Shear Strength in the Triaxial Compression 173
without measurement of Pore Pressure, sample 4, 10 and 11
4.89 The undrained Shear Strength in the Triaxial Compression 173
without measurement of Pore Pressure (Quick undrained) for
sample 12 (laterite soil with10% TDA and 4%Si)
4.90 The undrained Shear Strength in the Triaxial Compression 174
without measurement of Pore Pressure (Quick undrained) for
sample 13 (laterite soil with10% TDA and 5%Si)
4.91 The undrained Shear Strength in the Triaxial Compression 174
without measurement of Pore Pressure, sample 5, 12 and 13
4.92 Distribution of modulus elasticity in sample one to five 175
4.93 Distribution of modulus elasticity for sample 2, 6 and7 176
4.94 Distribution of modulus elasticity for sample 3, 8 and 9 176
4.95 Distribution of modulus elasticity for sample 4, 10 and 11 177
4.96 Distribution of modulus elasticity for sample 5, 12 and 1 177
4.97 Distribution of elasticity modulus 178
4.98 Distribution of area under the stress strain curve of 178
unconfined test
xxvii
4.99 Coefficient of Volume Compressibility (mv) 180
4.100 Coefficient of Consolidation ( ) 180
4.101 Distribution of permeability for different samples 181
4.102 Distribution of cohesion in different sample 182
4.103 Distribution of aggregate friction in different samples 183
4.104 Damping definition, hysteretic and equivalent 184
bilinear stress–strain relationships for soil: a stress–strain
curves; b bilinear idealization
4.105 Estimation damping for sample 1 184
4.106 Estimation damping for sample 10 184
4.107 The end of construction before tank 185
4.108 The end of construction before tank with reinforced layer 185
4.109 Distribution of safety factor in small scale modeling with 186
different reinforced layers, horizontal direction
4.110 Distribution of safety factor in small-scale modeling 187
with different reinforced layers, vertical direction
4.111 The end of construction after tank with reinforced layer 187
4.112 Distribution of safety factor in small-scale modeling with 188
different reinforced layers, horizontal direction with reservoir
4.113 Distribution of safety factor in small scale modeling with 189
different reinforced layers, vertical direction with reservoir
4.114 Frequency distribution in different mode vibration of 190
small scale model
4.115 Vertical displacement distribution at the middle of 192
crest length, first model
4.116 Relative displacement at the middle of crest length, 192
first model
4.117 First small scale mode on vibrator table 193
4.118 Upstream damage after reservoir with vibration at 193
resonance condition
4.119 Longitude crack at line-c 194
4.120 Transverse crack at downstream-toe 194
4.121 Vertical displacement distribution at the middle of 195
crest length, second model
4.122 Relative displacement at the middle of crest length, 196
xxviii
second model
4.123 Construction of second small-scale model during 196
the compaction
4.125 Second model section with network index 197
4.126 Upstream damage during shaking, section view 197
4.127 Upstream damage, after drain more than half volume of tank 198
4.128 a)Transvers crack at the crest (Line-l), b) Zoom photo 198
4.129 Damage at upstream near to abutment in second small model 198
4.130 Vertical displacement distribution at the middle of crest 199
length, third model
4.131 Relative displacement at the middle of crest length, 200
third model
4.132 Third model view, upstream at right side 200
4.133 Third model view with reservoir 200
4.134 Damage at upstream, middle to left side, near to abutment 201
4.135 Damage at upstream, middle to right side, near to abutment 201
4.136 Damage at downstream, total length of the toe 201
4.137 Vertical displacement distribution at the middle of crest 202
length, fourth model
4.138 Relative displacement at the middle of crest length, 203
fourth model
4.139 Fourth model view, upstream at right side 203
4.140 Damage at upstream toe area 203
4.141 Damage at upstream toe area, the end of vibration 204
4.142 Vertical displacement distribution at the middle of crest 205
length, fifth model
4.143 Relative displacement at the middle length of crest fifth model 205
4.144 Fifth model view, upstream at right side 206
4.145 Toe damage at upstream, fifth model 206
4.146 Vertical displacement distribution at the middle of 207
crest length, sixth model
4.147 Relative displacement at the middle length of crest, sixth model 207
4.148 Sixth physical model view, upstream at right side 208
4.149 Perspective of sixth model 208
4.150 Sixth model at the end of vibration without damage 209
xxix
4.151 Upstream of sixth model at the end of vibration without damage 209
4.152 Vertical displacement distribution at the middle of crest 210
length, seventh model
4.153 Relative displacement at the middle length of crest, seventh 211
model
4.154 Dam view during reservoir in seventh small model 211
4.155 Dam section with blanket layer on the bedrock 212
4.156 Seventh model after vibration without damage 212
4.157 Vertical displacement distribution at the middle of 213
crest length, eighth model
4.158 Relative displacement at the middle length of crest, 214
eighth model
4.159 Seventh model view, upstream at right side 214
4.160 Seventh model during reservoir 215
4.161 Damage at upstream-toe in left side 215
4.162 Damage at upstream-toe, right side 215
4.163 Vertical displacement distribution at the middle of 216
crest length, eighth model
4.164 Relative displacement at the middle length of crest, ninth model 217
4.165 Ninth model view, upstream at right side 217
4.166 Dam stability after vibration without any damage at upstream 218
4.167 Dam section after vibration without any damage at upstream 218
5.1 Flowchart of results 221
5.2 ASCE Acceleration spectrum curve, The period and 224
acceleration spectrum matched by horizontal and vertical axis
5.3 Acceleration spectrum, 500 year 226
5.4 Acceleration spectrum, 2500 year 226
5.5 Section of dam with different zones 227
5.6 Upstream face of dam with different types of joints 227
5.7 The models mesh with regular method 228
5.8 a) First vibration mode 229
5.8 b) Second vibration mode 229
5.8 c) Third vibration mode 229
5.8 d) Fourth vibration mode 229
5.8 e) Fifth vibration mode 229
xxx
5.8 f) Six vibration mode 229
5.8 g) Seven vibration mode 230
5.8 h) Eight vibration mode 230
5.8 i) Ninth vibration mode 230
5.8 j) Tenth vibration mode 230
5.9 Frequency distribution of the Bakun dam for initial until 230
twentieth mode vibration. Vibration mode is horizontal axis
and vertical axis is frequency.
5.10 a) Horizontal displacement, A-500 years 231
5.10 b) Vertical displacement, A-500 years 231
5.10 c) Horizontal displacement, B-500 years 231
5.10 d) Vertical displacement, B-500 years 231
5.10 e) Horizontal displacement, C-500 years 232
5.10 f) Vertical displacement, C-500 years 232
5.10 g) Horizontal displacement, D-500 years 232
5.10 h) Vertical displacement, D-500 years 232
5.10 i) Horizontal displacement, E-500 years 232
5.10 j) Vertical displacement, E-500 years 232
5.11 a) Horizontal displacement, A-2500years 233
5.11 b) Vertical displacement, A-2500 years 233
5.11 c) Horizontal displacement, B-2500 year 233
5.11 d) Vertical displacement, B-2500 year 233
5.11 e) Horizontal displacement, C-2500 year 234
5.11 f) Vertical displacement, C-2500 year 234
5.11 g) Horizontal displacement, D-2500 year 234
5.11 h) Vertical displacement, D-2500 year 234
5.11 i) Horizontal displacement, E-2500 years 234
5.11 j) Vertical displacement, E-2500 year 234
5.12 Maximum horizontal displacement chart 235
5.13 Maximum vertical displacement chart 235
5.14 Main points of the model 236
5.15 Horizontal displacement in points 1to5 237
5.16 Vertical displacement in points 1-5 238
5.17 Horizontal displacement on slab 238
5.18 Vertical displacement on slab 239
xxxi
5.19 Shear stress distribution in dam 240
5.20 Shear stress XY in point 6 for 2500 years, The horizon axis is 240
time (second) and the vertical axis is the shear stress (kg/ )
5.21 Vertical displacement in point 1 for strong shock earthquake, 241
The horizon axis is time (second) and the vertical axis is
displacement (meter)
5.22 Vertical displacement at the end of earthquake for 2500 years, 241
The horizon axis is time (second) and the vertical axis is the
Value with meter unit
5.23 Safety factor for horizontal direction (PGA) 243
5.24 Horizontal displacements in main points, the horizontal axis is 244
main points, and the vertical axis is horizontal displacement
5.25 Compare vertical displacements in main points. The horizontal 244
axis is main points and the vertical axis is vertical displacement
(meter)
5.26 Vertical displacement in point2 (model1), Perpendicular axis is 245
displacement (meter), and horizontal axis is time (seconds)
5.27 Horizontal displacement in point1 (model1), vertical axis is 245
displacement (meter), and horizontal axis is time (seconds)
5.28. Horizontal displacement in the main points, Horizontal axis 246
is main points and vertical axis is horizontal displacement (meter)
5.29 Vertical displacements in main points, Horizontal axis is main 246
points, and vertical axis is vertical displacement (meter)
5.30 Horizontal dynamic displacement (meter) 247
5.31 Distribution of the vertical dynamic displacement in the end 248
of earthquake, Horizontal axis is main points, and the vertical axis
is dynamic vertical displacement (meter)
5.32 XY Shear strain in the end of earthquake for both models, the 249
horizontal axis is main points, and the vertical axis is an
XY Shear strain
5.33 XY Shear stress in the end of earthquake for both models, the 249
horizontal axis is main points, and the vertical axis is
XY Shear stress (Kg/ )
5.34 Horizontal displacement (m) in the end of dynamic load for 250
xxxii
models, Horizontal axis is main points, and the vertical axis is
horizontal dynamic displacement (meter)
5.35 Vertical displacement at the end of earthquake for models, 251
horizontal axis is main points, and the vertical axis is dynamic
displacement (meter)
5.36 XY Shear stress in the end of earthquake 251
5.37 Horizontal displacement (meter) in the end of earthquake 252
for models
5.38 Vertical dynamic displacement at the end of earthquake 253
for models
5.39 XY Shear stress (kg/ ) in the end of earthquake for models 254
5.40 XY Shear strain at the end of earthquake for both of models 254
5.41 Horizontal displacement (meter) in Points1-4 255
5.42 Horizontal displacement (m) in Points 5, 9, 10 and13 255
5.43 Vertical displacement (m) in Points1-2 256
5.44 Vertical displacement (m) in Points3 and 4 256
5.45 Vertical displacement (m) in Points 7, 9 and 11 257
5.46 Vertical displacement (m) in Points 9-10 257
5.47 Shear stress XY in Points 2, 3, 9 and 10 258
5.48 Shear stress XY in Points 5, 6, 10, 13 and 14 258
5.49 XY Shear stress in the secondary Reinforcement model 259
at point 10
5.50 Vertical displacement in the secondary Reinforcement 259
model at point 10
5.51 Vertical displacement in the Third Reinforcement model 259
at point 3
5.52 Horizontal displacement in Points1-4 260
5.53 Horizontal displacement in Points 5, 9, 10 and13 261
5.54 Vertical displacement in Points1-2 261
5.55 Vertical displacement in Points3-4 262
5.56 Vertical displacement in Points 7, 9 and 11 262
5.57 Vertical displacement in Points 9-10 263
5.58 Shear stress XY in Points 2, 3, 9 and 10 264
5.59 Shear stress XY in Points 5, 6, 10, 13 and 14 264
5.60 XY Shear stress in the Blanket Layer-3 model at point 10 265
xxxiii
5.61 XY Shear stress in the Blanket Layer-1 model at point 10 265
5.62 XY Shear stress in the Blanket layer-2 model 266
5.63 XY Shear stress in the initial model 266
5.64 XY Shear strain in the Blanket layer-2 model 266
5.65 XY Shear strain in the initial model 267
5.66 Horizontal displacement in Models1-4, the unit measurement 268
is meter
5.67 Horizontal displacement at crest and upstream slab, the vertical 268
axis is horizontal displacement (m)
5.68 Damages of concrete slab Zipingpu dam after the 269
Wenchuan earthquake in China
5.69 Buckling of canal lining elements has been caused in 269
the 21 September 1999 Chi-Chi earthquake in Taiwan
5.70 Vertical displacement in Points (1-2) 270
5.71 Vertical displacement in Points (3, 4 and 5) 270
5.72 Tension cracks on Cogoti dam crest associated earthquake 271
in 1997
5.73 Vertical displacement in the Upstream 271
5.74 Vertical displacement in Points 9-10 271
5.75 Shear stress XY at the crest and upstream 272
5.76 Shear stress XY in saturate and unsaturated zones 272
5.77 Shear stress XY in the foundation 273
5.78 XY Shear stress in the secondary model at point 2 273
6.1 Flowchart of results 275
xxxiv
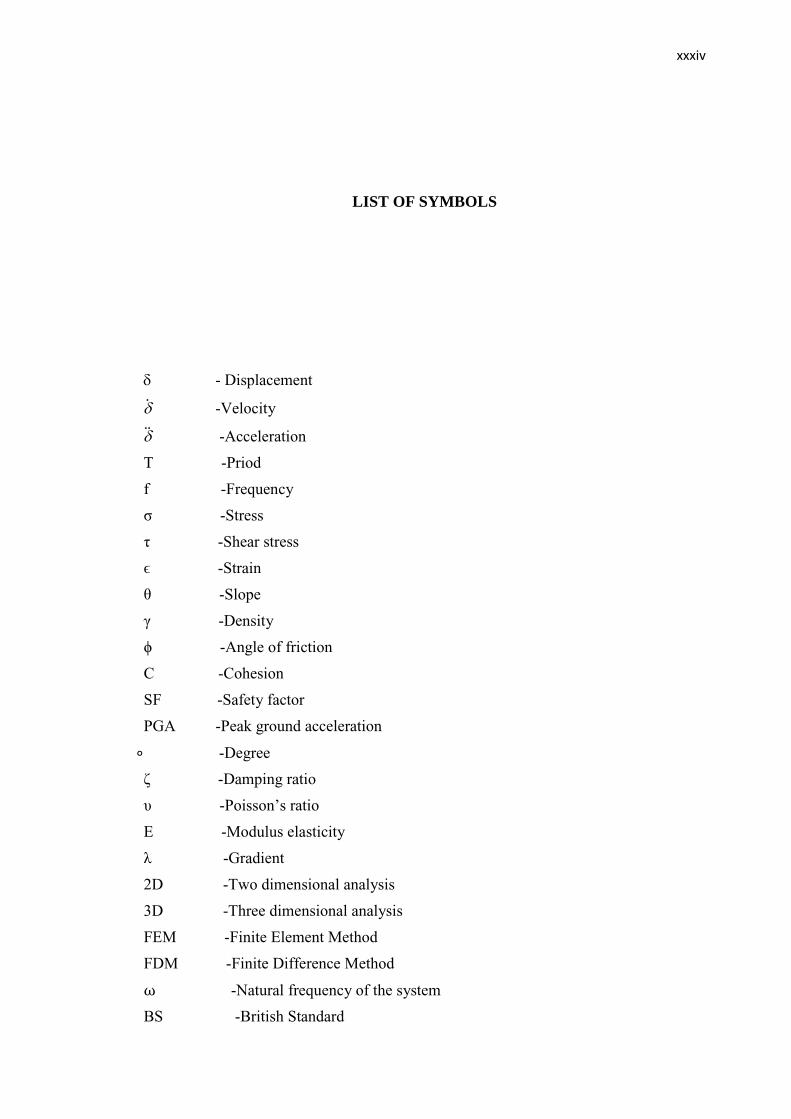
LIST OF SYMBOLS
- Displacement
-Velocity
-Acceleration
T -Priod
f -Frequency
σ -Stress
τ -Shear stress
ϵ -Strain
ζ -Slope
γ -Density
ϕ -Angle of friction
C -Cohesion
SF -Safety factor
PGA -Peak ground acceleration
-Degree
δ -Damping ratio
υ -Poisson’s ratio
E -Modulus elasticity
λ -Gradient
2D -Two dimensional analysis
3D -Three dimensional analysis
FEM -Finite Element Method
FDM -Finite Difference Method
-Natural frequency of the system
BS -British Standard

xxxv
H -Height
W -Width
Hz -Hertz
mv -Coefficient of Volume Compressibility
cv -Coefficient of Consolidation
g -Gravity
xxxvi
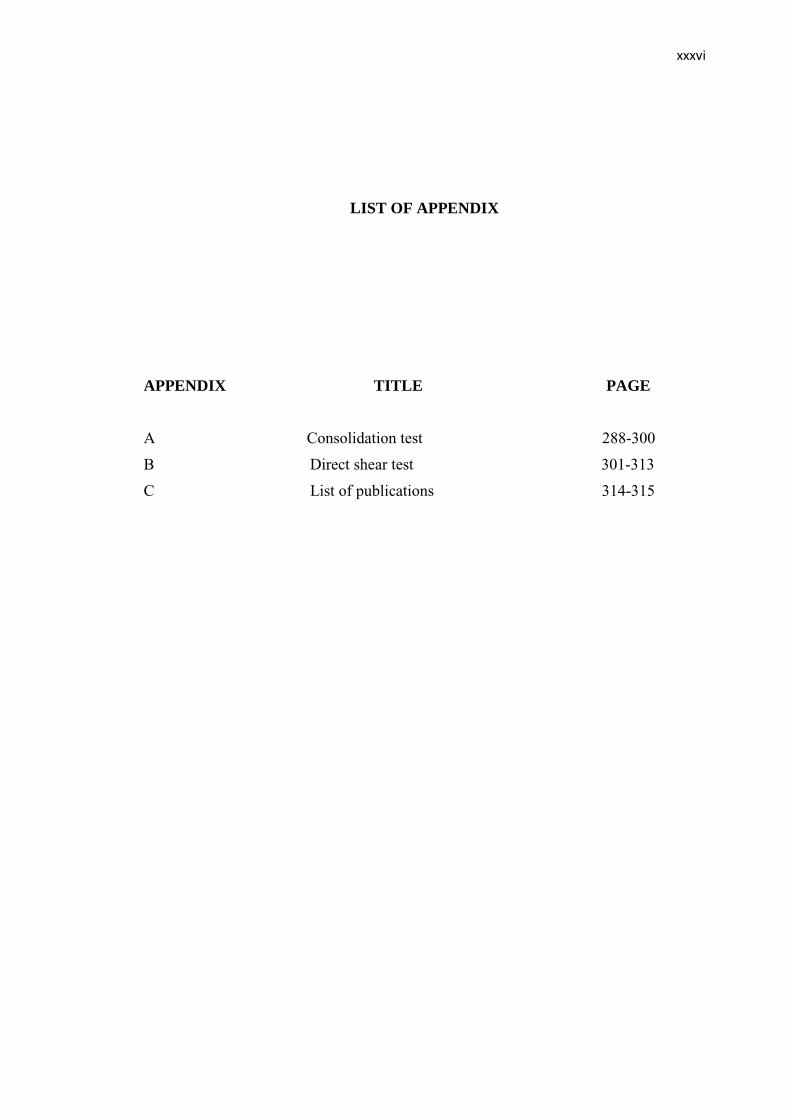
LIST OF APPENDIX
APPENDIX TITLE PAGE
A Consolidation test 288-300
B Direct shear test 301-313
C List of publications 314-315
CHAPTER 1
INTRODUCTION
1.1 Introduction
Nowadays, dam construction is critical trend in the world in order to access
some requirements. The major purposes defined by water supply and electricity. In
this context, some important aspects investigated by initial phase of design. One of
the main problems is structural behavior during an earthquake. Besides, there are
some case studies of damages. The earth dam damaged while some type of body
cracks made in dam or foundation. Some phenomena occurred such as overflow,
piping and structural failure in parallel to development of cracks. In brief, evaluation
of earth dam in order to earthquake effects is one of the major purposes of design.
Dynamic analysis of earth dam is one of the main purposes through design
process. According to the literature, there are some studies in this area like
reinforcement techniques, shaking table test, data monitoring and numerical analysis.
In terms of the numerical method, two famous methods such as Finite-element or
Finite-difference are used. Besides, not only the effect of material properties on
dynamic trend but also comparison of the two and three-dimensional analysis were
reviewed. In addition, the distribution of frequency and acceleration evaluated for
2
structure. In terms of earth dams under seismic load or earthquake, the integrated
response is the increase of acceleration and displacement at the crest based on
nonlinear aspect. The main role of this process appeared by interaction between dam
and reservoir. It seems to be that, improvement of earth dam behavior with
reinforced techniques is required.
Seismic-resistant capacity of the earth dams is a great issue within earthquake
active zone. However, dynamic behavior is one of the main concerns. For a realistic
evaluation of the seismic risk, one must consider some uncertainties. They are some
major aspects such as site geology, material stiffness, and analysis method. In
addition, depth investigation in this domain indicated that numerical methods
applicably used to assess dynamic behavior during the earthquake. Moreover, the
numerical results verified by some experimental tests like shaking table and
centrifuge.
1.2 Problem Statement
In terms of problem statement, failure mechanism is the main problem in
earth dams. Before failure, some significant factor like freeboard, overflow and
piping that should critically controlled by design approach. Overflow is very huge
danger for dam, and should avoid. In fact, most of the reports in order to damage in
dam related to the overflow. Therefore, freeboard design is very important to control
overflow. It is important to note that the wave height in reservoir increased during
earthquake. Moreover, interaction between dam and reservoir is very effective to
dam behavior under seismic load. It is worth noting that piping is other problem in
this category. This phenomenon related to the body cracks. In addition, body cracks
are directly corresponded to deformation during an earthquake. In this case, the
plastic deformation created by relative displacement. After all, the main goal in order
to control dynamic behavior is the relative displacement during earthquake with
respect to damage.
Lower San Fernando dam suffered an underwater slide during the San
Fernando earthquake, 1971. Fortunately, the dam barely avoided collapse, thereby
3
preventing a potential disaster of flooding of the heavily populated areas below the
dam[Karl V, 1971].
Two decades later, the 1994 Northridge earthquake put the Los Angeles Dam
with concrete face rock-fill dam (CFRD) to the test [Robert et al, 1994]. The
Northridge earthquake was almost equal in magnitude to the previous San Fernando
earthquake. Ground shaking was very strong, with amplitudes among the highest
ever recorded but consistent with the USGS estimates. Yet the dam showed only
minor deformation and superficial cracking. Despite the intense shaking, the crest of
the dam moved only 1 inch sideways and settled only 3.5 inches. Moreover,
longitudinal crack reported in Fengshou reservoir dam. Dam was 200 meters (656
feet) long, 0.6 meters (2 feet) wide and 3 meters (10 feet) deep at its largest degree.
Furthermore, On May 12, 2008, a strong earthquake with 8.0 Richter scale jolted
Wenchuan County in Sichuan province of China [Xu Zeping, 2008]. Zipingpu
concrete faced rock-fill dam, which is only 17 km away from the epicenter, survived
from the earthquake. However, it is also suffered severe damages during the strong
earthquake.
1.3 Aim of Research
The main aim of this research work is improvement of earth dam behavior
under earthquake by new reinforcement technique. This study tried to introduce
Isolator Damper Layer (IDL) system in order to reinforce dam with respect to
increase resistance under the strong earthquake.
1.4 Objectives of Research
To achieve such aim the following objectives are considered for the research
work:
4
i. To identify the location of damage by evaluating the effect of material
properties in dam body and performing vibration analysis, time history
and response spectrum analysis.
ii. To study the effect of blanket layer using Isolated Damping Layer (IDL)
system between dam and foundation to control dynamic behavior by
investigating material properties, layer thickness and reinforcement
arrangement.
iii. To evaluate slope stability in earth dam by evaluating the safety factor under
static and dynamic load conditions.
1.5 Scope of Research
This scope covers all objectives as mentioned in last section. Finite –Element
method (FEM) is performed using Ansys13 program for numerical analysis such as
time-history and response spectra in order to consider the location of damage. In
parallel, evaluation of slope stability by Geostudio 2007 (Slope/W) program was
performed utilizing equilibrium method to compute safety factor in both static and
dynamic load conditions. Moreover, the British standard is applied for IDL
geotechnical tests. Furthermore, for small-scale physical modeling, the short
homogenized dam of 16.5 meter with scale ratio (1/100) is tested on top of the
vibrator table. In addition, in terms of critical situation for earthquake effect, the
resonance condition is evaluated according to dominant frequency. The vibrator table
functions in one dimension (vertical motion) only and the duration is two minutes for
all samples. The reason for two minutes is about background in Sumatra fault that is
near to Malaysia. In terms of limitation for this research, Local soil (Laterite) is used
from campus of the University Teknologi Malaysia. Vibrator table is used with
capacity equal 250 kg. Data logger is used to record data in each two seconds during
the vibration.
1.6 Significance of the Research
5
This research covers earthquake effect on some structures such as earth dam;
homogenize embankment, concrete face rock-fill dam and embankment-bridge. This
research also includes a case study for Bakun dam in the east of Malaysia. In
addition, this research is the pioneer study to introduce new material (IDL), as can be
used to increase structural resistance under seismic load. According to the use of
blanket layer reinforced with new material (IDL), dam performance during the
strong intensity of ground motion like resonance condition is very good. It is worth
noting that, this material can use for different structures based on next study.
1.7 Organization of thesis
The organization of the thesis can described briefly as follows:
Chapter 1 is the Introduction, which explains on the background, the aim,
objectives, and scope.
Chapter 2 is on Literature review that explains analysis of earth dam during
an earthquake. This chapter included comprehensive review in some methods
such as Finite-Element method (FEM), Finite-Difference method (FEM),
Plane stress (3D), Plan strain (2D), Free vibration analysis, Time-history
analysis, Response spectra analysis, Reinforcement techniques, Data
monitoring and Shaking table test.
Chapter 3 is Research Methodology that explains the methodology to
complete the research besides the data collection and analysis technique used
in this study.
Chapter 4 is Analytical and experimental tests that includes dominant
frequency and slope stability in dam, experimental test to design Isolated
Damping Layer (IDL) and small-scale physical modeling.
Chapter 5 is Time-history analysis with case study (Bakun dam).
Chapter 6 is conclusion and recommendation that explains the significance of
the research finding including recommendation or suggestion and benefit of
the research for future study.

6
1.8 Summery
Introduction of thesis presented in this chapter. In addition, problem statement
and aim of the research are described. Moreover, objectives of study based on scope
with are explained. Finally, the significant points of present study and thesis
organization are presented in this chapter.
References
Abusharar, S. W., Zheng, J. J., Chen, B. G., & Yin, J. H. (2009). A simplified method for
analysis of a piled embankment reinforced with geosynthetics. Geotextiles and
Geomembranes, 27(1), 39-52.
Adnan, A., Hendriyawan., Sunaryati, J., Suhana, S., Sophia, A. and Norsurian, BA, R.
(2005). Siesmic Hazard Assessmenet for Bakun Hydroelectriv Project. Structural
Earthquake Engineering Research University teknologi Malaysia
Ahmad, M. H., Noorzaie, J., & Al Qbadi, F. (2008) Principal Stresses in non-linear
analaysis of Bakun concrete faced rockfill dam. AJSTD Vol. 25 Issue 2 pp. 469-479
ASCE 2007, seismic design chapter 11.
Baker. R. (2006). A relation between safety factors with respect to strength and height of
slopes.Computers and Geotechnics; 33: 275–277, 2006.
Bayraktar, A., Kartal, M. E., & Adanur, S. (2011). The effect of concrete slab–rockfill
interface behavior on the earthquake performance of a CFR dam. International
Journal of Non-Linear Mechanics, 46(1), 35-46.
Berhe, T. G., Wang, X. T., & Wu, W. (2010, June). Numerical Investigation into the
arrangement of Clay Core on the Seismic Performance of Earth Dams.
In Soil Dynamics and Earthquake Engineering (pp. 131-138). ASCE.
Bishop. A.W. (1955). The use of slip circle in the stability analysis of slopes.
Geotechnique; 5(1): 7–17, 1955. Board on Hydraulic structure department,
Modern methods concerning the dam static and dynamic analysis (1977). Civil
engineering institute. Bucharest, Romania.
Borges, J. L. (2004). Three-dimensional analysis of embankments on soft soils
incorporating vertical drains by finite element method. Computers and
Geotechnics, 31(8), 665-676.
Chakraborty, D., & Choudhury, D. (2009). Investigation of the behavior of tailings
earthen dam under seismic conditions. American Journal of Engineering and
Applied Sciences, 2(3), 559.
Chin, L. C. (2004). A Study on Concrete Faced Rockfill Dams. University of Southern
Queensland Faculty of Engineering and Surveying
Cho. S. E. (2009). Probabilistic stability analyses of slopes using the ANN-based
response surface. Computers and Geotechnics; 36: 787–797, 2009.
Chopra, A. k. and Perumalswami, P. R.(1971). Dynamic of rock and earthfill dams with
foundation interaction. Journal of the Eng Mech. Div, April.
Chowdhury, I., & Dasgupta, S. P. (2003). Computation of Rayleigh damping coefficients
for large systems. The Electronic Journal of Geotechnical Engineering, 8(0).
Clough. R.W. and Chopra. A.K. (1966). Earthquake stress analysis in earth dams. J. Eng.
Mech., ASCE., 92: 197-211. http://nisee.berkeley.edu/elibrary/Text/300451.
Das, B. M. (2008). Advanced soil mechanics. Psychology Press.
Das, B. M., & Ramana, G. V. (2010). Principles of soil dynamics. Cengage Learning,
USA, 128-129.
Duncan, J. M., & Chang, C. Y. (1970). Nonlinear analysis of stress and strain in
soils. Journal of the Soil Mechanics and Foundations Division, 96(5), 1629-1653.
El-Ramly. H., Morgenstern. N.R. and Cruden. D.M. (2002). Probabilistic slope stability
analysis for practice. Canadian Geotechnical Journal; 39 (3): 665–683.
Elgamal, A. W. (1992). Three-dimensional seismic analysis of La Villita dam. Journal
of geotechnical engineering, 118(12),1937-1958.
Fellenius. W. (1936). Calculations of the stability of earth dams, in: Transactions of the
2nd
Congress on Large Dams. Washington, DC, vol. 4, p. 445, 1936.
Finn, W. D. L., Yogendra kumar, M., Yoshida, N. and Yoshida, H. (1986). TARA-3: A
Program for Nonlinear Static and Dynamic Effective Stress Analysis. Department of
Civil Engineering, University of British Columbia, Vancouver, British Columbia,
Canada.
Garnier, J.; Gaudin, C.; Springman, S.M.; Culligan, P.J.; Goodings, D.J.; Konig, D.;
Kutter, B.L.; Phillips, R.; Randolph, M.F. and Thorel, L. (2007), Catalogue of
scaling laws and similitude questions in geotechnical centrifuge modelling 7 (3),
International Journal of Physical Modelling in Geotechnics, pp. 1–23, ISSN:
1346-213X, E-ISSN: 2042-6550
GEO-SLOPE International Ltd, Calgary, Alberta, Canada www.geos-slope.com. WABA
Dam Permanent Deformation due to an earthquake.
Geostudio. (2007). Manuel. www. Geo-slope.com
Gikas, V., & Sakellariou, M. (2008). Settlement analysis of the Mornos earth dam
(Greece): evidence from numerical modeling and geodetic monitoring.
Engineering Structures, 30(11), 3074-3081.
Griffiths. D.V., and Fenton. G.A. (2004). Probabilistic slope stability analysis by finite
elements. Journal of Geotechnical and Geoenvironmental Engineering; 130 (5):
507- 518.
Hayashi, M., Fuziwara,Y and Komada, H. (1975). Dynamic viscosity and dynamic
deformability of rock-fill material in laboratory, application to response analysis
and comparison with observed damping during earthquakes. Proc. of symp. On
criteria and assumptions for numerical analysis of dams. Swansea.
Hwang, J. H., Wu, C. P., & Chou, J. T. (2008, May). Motion Characteristics of
Compacted Earth Dams under Small Earthquake Excitations in Taiwan. In
Geotechnical Earthquake Engineering and Soil Dynamics IV (pp. 1-12). ASCE.
IITK-GSDMA Guidelines for seismic design of earth dams and Provisions with
Commentary and Explanatory Examples(August 2005; Revised May 2007).
Indian institute of technology Kanpur. India.
Ionescu, S. (1977). Contributions to the analysis of rockfill dams sealed with non-earthy
materials (in Romanian). Doctoral Paper, ICB. Romania.
Jahed. H., Noban. M. R., and Eshraghi. M. A. (2009). ANSYS Finite Element.
Tehran University
Janbu. N. (1973). Slope stability computations, in: R.C. Hirshfield, S.J. Poulos (Eds.),
Embankment Dam Engineering. Cassagrande Volume, John Wiley and Sons;
47–86, 1973.
Karl. V., Steinbrugge Collection, Earthquake Engineering Research Center, University of
California, Berkeley.
Kong, X. J., Zhou, Y., Xu, B., & Zou, D. G. (2010). Analysis on seismic failure
mechanism of zipingpu dam and several reflections of aseismic design for high
Rock-fill dam. Earth and Space, 3177-3189.
Le Hello, B., & Villard, P. (2009). Embankments reinforced by piles and geosynthetics—
Numerical and experimental studies dealing with the transfer of load on the soil
embankment. Engineering Geology, 106(1), 78-91.
Li. K.S., and Lumb. P. (1987). Probabilistic design of slopes. Canadian Geotechnical
Journal; 24: 520–535, 1987.
Low, B., Tang, S., and Choa, V. (1994). Arching in Piled Embankments. J. Geotech.
Engrg., 120(11), 1917–1938.
Matsumaru, T., Watanabe, K., Isono, J., Tateyama. M. and Uchimura, T. (2008)
Application of cement-mixed gravel reinforced by ground for soft ground
improvement. Proceedings of the 4th Asian Regional Conference on
Geosynthetics June 17 - 20, 2008.Shanghai, China.
Maosong. H. and Cang-Qin. J. (2009). Strength reduction FEM in stability analysis of soil
slopes subjected to transient unsaturated seepage. Computers and Geotechnics;
36: 93–101.
Marto, A., Latifi, N., & Sohaei, H. (2013). Stabilization of laterite soil using GKS soil
stabilizer. Electron J Geotech Eng (EJGE), 18, 521-532.
Mejia, L. H., & Seed, H. B. (1983). Comparison of 2-D and 3-D dynamic analyses of
earth dams. Journal of Geotechnical Engineering, 109(11), 1383-1398.
Mizokoshi, T and Minura , S.(1975). Studies on the earthquake forces in the design of
Takase dam. Proc. of. Symp. on Criteria and assumption for numerical analysis of
dams. Swansea.
Morgenstern. N. R. and V.E. Price. (1965). The analysis of the stability of general slip
surface. Geotechnique; 15 (4): 289–290, 1965.
Namdar. A. and Pelko. A. K. (2010). Seismic Evaluation of Embankment Shaking Table
Test and Finite Element Method. The Pacific Journal of Science and Technology -
volume11, Number2, November.
Newmark, M. N. and Rosenblueth, E. (1971). Fundamental of earthquake engineering.
Mc Graw-Hill, New Jersey.
Noorzad, R., & Omidvar, M. (2010). Seismic displacement analysis of embankment dams
with reinforced cohesive shell. Soil Dynamics and Earthquake
Engineering, 30(11), 1149-1157.
Nose, M., Takahashi, T and Kunii, K. (1976). Results of earthquake observation and
dynamic tests on rockfill dams and their consideration. 12-th ICOLD Congress,
Mexico.
Okamoto, S. (1973). Introduction to earthquake engineering. Tokyo University of Tokyo
Press.

Okamoto, S., Tamura, C., Kato, K. and Ohmachi, T.(1974). A study on the dynamic
stability of rockfill dams during earthquakes based on vibration failure tests of
models. Bull of ERS, University of Tokyo.
Özkan, M. Y., Erdik, M., Tuncer, M. A., & Yilmaz, C. (1996). An evaluation of Sürgü
dam response during 5 May 1986 earthquake. Soil Dynamics and Earthquake
Engineering, 15(1), 1-10.
Palmeria, E. M., Pereira, J. H.F and da Silva, A. R.L. (1998). Back analyses of
geosynthetic reinforced embankmen-ts on soft soils. Geotextiles and
Geomembrances 16 (1998) 273-292.
Papalou, A., & Bielak, J. (2001). Seismic elastic response of earth dams with canyon
interaction. Journal of geotechnical and geoenvironmental engineering,127(5),
446-453.
Parish, Y., & Abadi, F. N. (2009). Dynamic Behaviour of Earth Dams for Variation of
Earth Material Stiffness. World Academy of science Engineering and
Technology, 50, 2009.
Papalou, A., & Bielak, J. (2001). Seismic elastic response of earth dams with canyon
interaction. Journal of geotechnical and geoenvironmental engineering,127(5),
446-453.
Popovici, A. (1978). Hydrotechnical structure analysis of large structure (dams, dukes,
etc.). doctoral paper, ICB. Romania.
Priscu, R. (1974). Hydrotechnical construction (in Romanian). Editura didactica si
pedagogica, Bucharest.
Priscu, R. (1985). Earthquake engineering for large dams.
Priscu, R., Lonescu, S and Stematiu. (1978). A new model for movement analysis of
rockfill dams ―L’Energia Elettrica”, Milan.
Robert. A., Page, David M., Boore , Robert F, Yerkes (1994). The Los Angeles Dam
Story. USGS. http://earthquake.usgs.gov
Sarma. S. K. (1973). Stability analysis of embankments and slopes. Geotechnique; 23 (3):
423–433.
Sarma. S. K. (1979). Stability analysis of embankments and slopes. Journal of the
Geotechnical Engineering Division. ASCE; 105 (12): 1511–1524, 1979.
Schanz, T., Vermeer, P. A., & Bonnier, P. G. (1999). The hardening soil model:
formulation and verification. Beyond 2000 in computational geotechnics, 281-
296.
Seed, B. H. (1973). Stability of earth and rock-fill dams during earthquakes. Embankment
dam engineering, Prentice-Hall. New York.
Seed, H. B. (1979). Considerations in the Earthquake Resistant Design of Earth and
Rockfill Dams. Geotechnique, 29(3), pp. 215-263.
Seed, H. B., Wong, R. T., Idriss, I. M., & Tokimatsu, K. (1986). Moduli and damping
factors for dynamic analyses of cohesionless soils. Journal of Geotechnical
Engineering, 112(11), 1016-1032.
Sivakumar. B. G. L., Srivastava. A., and Sahana. V. (2007).Analysis of stability of
earthen dams in kachchh region, Gujarat, India. Engineering Geology
94(2007)123-136.
Siyahi, B., & Arslan, H. (2008). Earthquake induced deformation of earth dams. Bulletin
of Engineering Geology and the Environment, 67(3), 397-403.
Spencer. E. (1967). A method of analysis of the stability of embankments assuming
parallel inter-slice forces. Geotechnique; 17 (1): 11–26, 1967.
Torisu, S. S., Sato, J., Towhata, I., & Honda, T. (2010). 1-G model tests and hollow
cylindrical torsional shear experiments on seismic residual displacements of fill
dams from the viewpoint of seismic performance-based design. Soil Dynamics
and Earthquake Engineering, 30(6), 423-437.
Tsai, P. H., Hsu, S. C., & Lai, J. (2009, August). Effects of Core on Dynamic Responses
of Earth Dam. In Slope Stability, Retaining Walls, and Foundations@ sSelected
Papers from the 2009 GeoHunan International Conference (pp. 8-13). ASCE.
Wang, L., Zhang, G., & Zhang, J. M. (2011). Centrifuge model tests of geotextile-
reinforced soil embankments during an earthquake. Geotextiles and
Geomembranes, 29(3), 222-232.
Watanabe, H. (1975). A numerical method of seismic analysis for rock and earthfill dams
and verification of its reliability through both model test and observation of
earthquake on an actual dam. Proc. of Symp. on Criteria and assumptions for
numerical analysis of dam. Swansea.
Wieland. M. (2008). Analysis aspects of dams subjected to strong ground shaking.
International water power & Dam construction, pp:28-31
Xie. G., Zhang. J., and Li. J.(2008). Adapted genetic algorithm applied to slope reliability
analysis, in: 4th International Conference on Natural Computation. vol. 1, pp.
520-524.
Xia, Z. F., Ye, G. L., Wang, J. H., Ye, B., & Zhang, F. (2010). Fully coupled numerical
analysis of repeated shake-consolidation process of earth embankment on
liquefiable foundation. Soil Dynamics and Earthquake Engineering, 30(11), 1309-
1318.
Yang. C.X., Tham. L. G., Feng. X. T., Wang. Y. J., and Lee. P.K.K. (2004). Two-
stepped Evolutionary algorithm and its application to stability analysis of slopes.
Journal of Computing in Civil Engineering; 18 (2): 145–153.
Yildiz, A. (2009). Numerical analyses of embankments on PVD improved soft
clays. Advances in Engineering Software, 40(10), 1047-1055.
Yu, Y., Xie, L., & Zhang, B. (2005). Stability of earth–rockfill dams: influence of
geometry on the three-dimensional effect. Computers and Geotechnics, 32(5),
326-339.
Zeghal, M. and Abdel‐Ghaffar, A. (1992). Analysis of Behavior of Earth Dam Using
Strong‐ Motion Earthquake Records. J. Geotech. Engrg., 118(2), 266–277.
Zeping, X. (2008). Performance of Zipingpu CFRD during the strong earthquake. China
Institute of Water Resources and Hydropower Research.
Recommended