Journal of International Money and Finance
24 (2005) 607e630
www.elsevier.com/locate/econbase
The Asian financial crisis: The roleof derivative securities tradingand foreign investors in Korea
Eric Ghysels a,*, Junghoon Seon b,1
a Department of Economics, University of North Carolina and
the Department of Finance, KenaneFlagler School of Business, Chapel Hill,
NC 27599-3305, USAb Korea Securities Research Institute, 33 Youido-dong, Yongdungpo-gu,
Seoul 150-977, South Korea
Abstract
This paper is part of a larger research program pertaining to the role of derivatives duringfinancial crisis and also part of the research pertaining to the causes of the Asian financialcrisis. The Korean market is studied because of two reasons: (1) it is an important example of
the Asian financial meltdown and (2) there is a detailed data set available of all transactions bydifferent types of protagonists, including foreign investors. The results in this paper indicatethat futures markets and trading by foreign investors played a key role during the Korean
stock market turbulence in 1997.� 2005 Elsevier Ltd. All rights reserved.
JEL classification: G1; F3
Keywords: Financial crisis; Foreign investors; Derivative securities; Herding
* Corresponding author. Tel.: C1 919 966 5325; fax: C1 919 966 4986.
E-mail addresses: [email protected] (E. Ghysels), [email protected] (J. Seon).1 Tel.: C82 237710680; fax: C82 237710658.
0261-5606/$ - see front matter � 2005 Elsevier Ltd. All rights reserved.
doi:10.1016/j.jimonfin.2005.03.002

608 E. Ghysels, J. Seon / Journal of International Money and Finance 24 (2005) 607e630
1. Introduction
The role of derivatives during financial market meltdowns is still not wellunderstood. The Brady Report, written by a Presidential task force in the wake of theOctober 1987 stock market crash, blamed trading in stock index futures for thefinancial crisis. According to the report, portfolio insurers tried to cover their equityexposure by ‘mechanical, price-insensitive selling’ stock market index futures. Theiractions drove down futures prices and created arbitrage opportunities which led indexarbitrageurs to implement reverse cash-and-carry strategies, i.e. they bought futuresand sold the underlying stocks. The dynamic interaction between portfolio insurersand index arbitrageurs was lethal and caused a spiral downward tumbling of prices.The events of October 1987 were characterized by the BradyReport as a vivid exampleof the dire consequences derivative securities can have during a financial crisis.2
The Asian financial crisis is certainly not a carbon copy of the October 1987 crash.There are similarities and differences which make a comparison interesting. The mostblatant difference is the role played by foreign investors. Several authors, includingRadelet and Sachs (1998) and Kim and Wei (1999), have put the blame for the Asiancrisis on foreign investors. In particular, Radelet and Sachs argue that the sudden pull-out of foreign investments exacerbated the crisis by causing a financial panic combinedwith policy mistakes by Asian governments and the International Monetary Fund.Along the same lines, Kim and Wei argue that the financial crisis in the East Asiancountries should, to a large degree, be ascribed to the panic reaction and herd behaviorof foreign investors rather than economic fragility of those countries. Choe et al.(1999) refute the idea of market destabilization by foreign investors. They takeadvantage of a unique data set covering transactions by domestic and foreigninvestors on the Korean Stock Exchange (henceforth KSE). The KSE trading systemis very similar to the Paris Bourse screen-driven market, studied by Biais et al. (1995).The pure order-driven market makes identification of foreign and domestic traderseasy, particularly since the former have to register before they are allowed to trade.
This paper examines two questions. First, what was the role of derivativesecurities in the Korean stock market crash. Second, to what extend did derivativestrading by either domestic or foreign investors, or both together, exert a destabilizinginfluence during the KSE October 1997 crash. Despite the fact that futures andoptions markets are typically not as well developed in emerging economies, Koreahad very active futures trading. Established only 2 years prior to the crisis, themarket for the KOSPI 200 index futures contracts grew fast and established itselfquickly. Moreover, in the Korean case, futures contracts had the appealing featurethat foreign ownership restrictions were removed before the crisis.3 Futures and
2 Much has been written about the Brady Report, both supportive and critical. For further details see
Kleidon and Whaley (1992), Blume et al. (1989) and Santoni (1988).3 To be more precise, foreign ownership restrictions were removed for futures and options in July 1997,
i.e. 3 months before the crisis. More recently, namely in May 1998, they were also lifted for equities. Choe
et al. (1999) provide a detailed discussion of the restrictions which were in place for non-resident equity
holders.

609E. Ghysels, J. Seon / Journal of International Money and Finance 24 (2005) 607e630
options on the KOSPI 200 market index are traded on the KSE. The data collectedfrom the electronic trading system enables us to investigate the pattern and impact oftransactions by domestic (institutions and individuals) and foreign investors. Hence,similar to the equity trading study of Choe et al., we can identify the contractsbought and sold by domestic institutional and individual investors as well as non-residents.4 Choe et al. (1999) examine buy and sell strategies of domestic and non-resident traders thoroughly and do not find any evidence supporting the idea thatforeigners had a destabilizing effect during the crisis. To make a direct comparisonbetween equity and futures trading we reexamine equity trading focusing exclusivelyon the 200 stocks of the KOSPI 200 index.5 Many of the arguments put forward bythe opponents of financial liberalization apply to equity as well as derivativestrading. For instance, the argument that foreign investors act like a herd applies tostock buy and sell strategies as well as the long and short positions in futurescontracts.
This paper is part of a larger research program pertaining to the role ofderivatives during financial crisis and also part of the research pertaining to thecauses of the Asian financial crisis. Many of the key questions we try to address arethe same as in Radelet and Sachs (1998), Kim and Wei (1999) and Choe et al. (1999).Many of the techniques used in the paper are closely related to those presented inChoe et al. Our study is, however, not simply adding derivatives market data to theiranalysis. New results pertaining to equity trading are uncovered in conjunction withthe derivatives trading findings. Namely, we examine extensively the intra-dailypatterns for each group of market participants. The KSE has different tradingsessions throughout the day which features different market microstructures andhence price discovery mechanism.
We first document that foreign investors increased their presence in the futuresmarket. This is understandable since restrictions were lifted. Given this observation,we test several hypotheses pertaining to the role of stock index futures trading byforeign investors during the crisis. The first hypothesis is whether herding and priceimpacts of foreign investors increased in the futures market. The second hypothesisis whether feedback trading strategies were used by foreign investors and werecontributed to the increase in their herding. The third and final hypothesis is whetherstock index futures trading by foreign investors exerted a destabilizing influence onthe stock market, i.e., selling pressures by foreign investors in the futures marketwere transmitted to the cash market inducing stock sales by domestic institutions.
The paper is organized as follows. In Section 2, we examine the role of the futuresmarket during the KSE crisis. In Section 3, we describe the trading mechanism of theKSE and the nature of our data set in order to dissect and separate the influence offoreign investors. In Section 4, we analyze whether foreign and domestic traders herdand whether they pursue positive feedback trading strategies. For domestic market
4 We will use foreign investors and non-resident investors interchangeably. Strictly speaking, however,
there are foreigners who reside in Korea and have to register to trade.5 Choe et al. (1999) considered a larger set of stocks, namely 414 of the 762 stocks listed on the KSE at
the end of November 1996.

610 E. Ghysels, J. Seon / Journal of International Money and Finance 24 (2005) 607e630
participants we make a distinction between institutional and individual traders. Theimpact of foreign investors on prices and market returns in both the stock andfutures market and the linkage between futures and cash market is studied,respectively, in Sections 5 and 6. Finally, Section 7 concludes the paper.
2. Why Korea, why equities and futures?
The Asian financial crisis can certainly not be confined to the crash of equitymarkets. Yet, the focus on the stock market is warranted given the chronology ofevents, as will be explained in this section. We also will explain why futures contractsare the focus of our attention as well when we want to study the influence of foreigninvestors.
Korea, Indonesia, Malaysia and Thailand were among the countries hardest hitby the Asian crisis. By the end of 1997, the market capitalization in these fourcountries had fallen 70% to about $188 billion from $637 billion.6 Since Korea is theonly country among these four countries which has stock index futures and optionsmarkets during the Asian financial crisis, we examine Korea as a representativeexample in studying the role of derivative securities trading and the foreign investors.
There is evidence that the stockmarket crash was not a result of currency crisis sincethe stock market crash preceded sharp increases in the won/dollar exchange rate andcorporate bond yields (AA�). On October 23, 1997, the Korean governmentannounced that it would take over debt-ridden KIA Motors. As Standard & Poorscut Korea’s foreign debt rating in response to the news on the next day, the Koreanstockmarket started to show a dramatic downward trend. Over a span of 4 consecutivebusiness days, from October 24 to October 28, the KOSPI 200 market index lost 20.72of its value.7However, as can be seen fromFig. 1, the exchange rate ofKoreanwon andthe yield on 3-year corporate bonds (AA�) had restricted movements until November21, when the government announced that it was discussing details of a bailout packagewith the IMF to cope with the rapid deterioration in its external financial position.
At the time of the crisis, the KOSPI 200 futures contracts were traded on a liquidmarket with significant daily volume and open interest, even though it was in-troduced 2 years earlier.8 The underlying asset for the contracts is the KOSPI 200index, which is composed of the 200 most actively traded stocks on the KSE. Thecontract months for futures are March, June, September and December, and thelongest maturity period is 1 year. The last trading day of each contract is the secondThursday of each expiration month. Fig. 2 plots monthly averages of daily volumefor nearest month KOSPI 200 contracts in 1997 and S&P 500 futures contracts
6 For an elaborate discussion of the stock market crashes during the Asian financial crisis, see for
instance Barth and Zhang (1999).7 KOSPI stands for Korean Stock Price Index, the KOSPI 200 index represents the 200 most actively
traded stocks in Seoul, which take up about 80% of the total market value.8 From its incubation the trading volume of futures contract increased by 203.4%. Comparable figures
for the Nikkei 225 futures contract are 0.49% (from 1988 to 1990), for the S&P 500 futures contract
106.96% (from 1982 to 1984) and 191.82% for the Han-Seng futures contract (from 1986 to 1988).

611E. Ghysels, J. Seon / Journal of International Money and Finance 24 (2005) 607e630
in both 1987 and 1997 as a fraction of the trading volume of the underlying asset. Priorto July 1997 the KOSPI 200 futures-to-cash market volume was comparable to levelsfor the S&P500 futures and cash market during the 1987 and 1997 crash years. AfterJuly 1997 the monthly averages in Korean markets soared far above levels observedfor S&P 500 futures contracts. At the peak of the crisis the ratio exceeded 13%, morethan double the typical level found prior to the crisis (and levels applicable to S&P500 futures markets). Fig. 3 shows the strong upward trend of KOSPI futurestransactions by foreign investors. The upward trend started in the third quarter of1997 and continued its path through the following year.
For several reasons, the trading of KOSPI 200 index futures will be the onlyrelevant market for our analysis, though it is among various types of derivativecontracts that were traded before, during and after the Korean financial crisis. First,trading in options on the KOSPI 200 index, established in June 1997, was still in itsinfancy during the crisis roughly 4 months later. Second, speculative trades on equity
KOSP
I
KOSP
I 200
20.00
30.00
40.00
50.00
60.00
70.00
80.00
KOSPI KOSPI 200
Oct. 23, 1997C
orpo
rate
Bon
d Yi
eld
(%)
Exch
ange
Rat
e
3-year Corporate Bond Yield(AA-) Won / Dollar Exchange Rate
Nov. 21, 1997
300
400
500
600
700
800
901
906
912
922
927
1004
1010
1016
1022
1028
1103
1108
1114
1120
1126
1202
1208
1213
1220
1227
901
906
912
922
927
1004
1010
1016
1022
1028
1103
1108
1114
1120
1126
1202
1208
1213
1220
1227
5.00
10.00
15.00
20.00
25.00
30.00
35.00
600
800
1000
1200
1400
1600
1800
2000
2200
Fig. 1. Korean Stock Price Indexes, corporate bond yields and exchange rates.

612 E. Ghysels, J. Seon / Journal of International Money and Finance 24 (2005) 607e630
swaps and individual stock options by foreign investors were prohibited by the lawof foreign exchange control at the time of the Korean financial crisis. Third, currencyand interest rate swaps were seldom initiated by foreign financial institutions as theywere possible only with real goods transactions.9
3. The market structure and the data
We can classify investors active on the KSE into the following three groups:Korean individuals, Korean institutions and foreign investors. Foreign investors arerequired to register with the Financial Supervisory Service. In 1997, there werea total of 6514 foreign investors from 66 countries registered, 4514 (69.3%) wereinstitutional and the remaining 2000 (30.7%) were individuals. Consequently, it willbe more meaningful to compare foreign investors with Korean institutional traders.Choe et al. (1999) discuss in detail the Korean government restrictions which applyto both individual and aggregate foreign investment in stocks and derivatives.According to the restrictions, stock holdings cannot exceed a certain percentage ofthe total outstanding shares of each company and futures cannot exceed the averagedaily open interest for the last 3 months for futures. In July 1997, right before thecrisis, the aggregate ceiling for the derivatives was removed, even though theindividual ceiling was not changed. Individual contract restrictions remained in placeuntil May 1998 when all types of ownership restrictions were completely removed.The relaxing of restrictions on holding derivatives obviously provided extra
1 2 3 4 5 6 7 8 9 10 11 12Month
'97 KOSPI200 '97 S&P500 '87 S&P500
0.00
0.02
0.04
0.06
0.08
0.10
0.12
0.14
Fig. 2. Monthly average near-month futures volume relative to underlying assets volume (futures
volume! 100/underlying assets volume).
9 The principle of real demand was lifted on April 1999.

613E. Ghysels, J. Seon / Journal of International Money and Finance 24 (2005) 607e630
incentives for foreign investors to trade futures and options instead of stocks duringthe Korean crisis. In Table 1 we report the percentage upper bounds on aggregateand individual foreign ownerships. While these restrictions were gradually removedafter the Asian financial crisis, we note from Table 1 that throughout the crisis, theaggregate ceiling for equities ranged from 20% to 26% and from 5% to 7% forindividual foreign investor ownership.
So far, we have shown that trading in futures by foreign investors is the onlyderivative which may have had an impact during the Korean financial crisis. In theremainder of the paper, we try to identify who is responsible for trading in stocksand futures prior to and during the crisis. More importantly, we want to examinewhether any of the main protagonists changed their trading behavior during thecrisis and if this had any impact during the crisis. We need to elaborate first on themarket microstructure of the KSE to pursue further our analysis. This section isentirely devoted to a description of the market and the data that are recorded.
The KSE is a pure order-driven market, like the Paris Bourse, where buy and sellorders compete for the best prices. Liquidity is provided by limit and market orderssubmitted by investors who buy and sell at the ask and bid prices set throughpreviously placed limit orders or market orders.10 Both limit and market orders are
Quarter
1,00
0 C
ontra
cts
0
50
100
150
200
250
300
1st '97 2nd 3rd 4th 1st '98 2nd 3rd
Fig. 3. Stock index futures transactions by foreign investors. Data source: The Financial Supervisory
Service in Korea.
10 More specifically, the KSE is a pure order-driven market which has neither formal dealers nor
specialists. The NASDAQ and the NYSE are classified respectively as a quote-driven market and a hybrid
of order-driven and quote-driven market. The KSE and Tokyo Stock Exchange (hereafter TSE) have no
liquidity-provider of last resort. Moreover, the KSE has no exchange-designated agencies unlike the
NYSE or the TSE. On the NYSE, exchange-designated specialists have affirmative obligation to provide
continuous liquidity and to maintain a limit order book with the public’s limit orders. The TSE has
exchange-designated intermediaries (saitori) who collect limit orders and match limit and market orders
but have no obligation of market making. For more details on the institutional structure of the TSE, see
Lehmann and Modest (1994) and Hamao and Hasbrouck (1995). The KSE market microstructure is
discussed in Choe et al. (1999).

614 E. Ghysels, J. Seon / Journal of International Money and Finance 24 (2005) 607e630
continuously fed into the Automated Trading System (ATS) which is a matchingscheme satisfying supply and demand according to price, time, customer and sizepriorities. In addition, a call trading system is used at the market open and close.Since all the security trading on the KSE is fully computerized, transactions areexecuted promptly and are recorded completely and accurately. The marketmicrostructure of equity trading also applies to derivatives trading, with theexception that only limit orders are allowed in the KSE futures and options markets.
KSE trading hours for stocks are divided into three sessions: the morning, theafternoon and the post-closing session. The morning session is from 9:30 until 11:30AM. The afternoon session starts at 1 PM and ends at 3 PM, whereas the post-closingsession operates from 3:10 through 3:40 PM. The post-closing session has a specialcharacter distinct from the morning and afternoon regular trading sessions. The post-closing session only features equity trading andwas introduced onNovember 25, 1996to provide investors with additional opportunities to trade stocks after the close andfacilitate trading block orders by institutional investors. This session also featureslimited price discovery since the price of paired block orders can be negotiated withintwo ticks from the closing price of the day. Futures trading hours are the same asequity market sessions except that: (1) the afternoon session ends at 3:15 PM and (2)there is no post-closing session for futures. In our sample period, the KSE was alsoopen for trading on Saturdays but with shorter trading hours. To make our analysiscomparable to Choe et al., we excluded Saturdays from our sample.
For our analysis we use real-time data of trades in all stocks comprised in theKOSPI 200 and the KOSPI 200 index futures contracts from January 3 to December26, 1997, a sample period which brackets the crash from October 24 to October 28,1997. Each record in our data set provides detailed information on orders andtransactions: the time stamp, size and type of each order, bid or offer price, the
Table 1
Foreign ownership limits in Korea
Oct.
’96
Nov.
’96
May
’97
June
’97
July
’97
Nov.
’97
Dec.
’97
May
’98
Equities
KSE-listed stocks Individual (%) 5 5 6 6 6 7 50 100
Aggregate (%) 20 20 23 23 23 26 50 100
Derivatives
KOSPI200 futures Individual (%) 3 5 5 5 5 5 5 100
Aggregate (%) 15 30 30 30 100 100 100 100
KOSPI200 options Individual (%) 5 5 5 5 100
Aggregate (%) 30 100 100 100 100
Entries to the tables are the individual and aggregate foreign ownership restrictions for KSE-listed stocks
and derivatives. Individual restrictions apply to investment holdings of individual foreign investors, while
aggregate restrictions apply to the total investment holdings of all foreign investors for a particular stock
or derivatives contract. According to the restrictions, both individual and aggregate foreign investment in
stocks (derivatives) cannot exceed a certain percentage of the total outstanding shares of each company
(average daily open interest for the last 3 months).

615E. Ghysels, J. Seon / Journal of International Money and Finance 24 (2005) 607e630
country of residence and type of buyers and sellers. Henceforth, we will divide theentire sample period into two sub-period: before the crisis (JanuaryeSeptember1997) and during the crisis period (OctobereDecember 1997). The source of our datais the same as Choe et al. (1999) who provide specific details we omit here. However,as noted before, we do not examine all the stocks used by Choe et al. Instead, wesynchronize equity trading with futures and, therefore, focus exclusively on the 200stocks in the index. In addition, we aggregate all activity in stocks and characterize itas equity trading. Moreover, for futures we consider only the nearest month contractat any time, since it has the most liquidity.11
4. Herding and feedback trading
The behavior of U.S. institutional investors features herding and positive feedbacktrading, according to evidence documented in Nofsinger and Sias (1999) andWermers(1999). Theoretical foundations for the herding of institutional investors can bedivided into five categories e information cascades, investigative herding, fads,reputation herding and characteristic herding.12 Calvo andMendoza (2000) argue thatherd behavior accounts for a substantial fraction of the volatility in capital flows toemerging markets. Kaminsky and Schmukler (1999) examined 20 largest 1-day swingsin stock prices in nine Asian countries during the crisis period and documented thatsome of the largest 1-day swings cannot be explained by any apparent substantial news,economic or political, but seems to be driven by herd instincts of themarket itself. Kimand Wei (1999), among others, also argue that foreign investors in emerging markets,most of whom are institutional investors, follow feedback strategies similar to theirdomestic market behavior. They investigate the behavior of foreign institutionalinvestors around the Asian crisis using monthly Korean share holdings data and findthat foreign institutional investors engage in positive feedback trading before, duringand after the crisis and herd significantly more than their domestic counterpart. Theirresults, furthermore, suggest that foreign investors’ positive feedback strategiescombined with their herding behavior might have exacerbated or even caused marketcrashes during the Asian financial crisis. Choe et al. (1999) examine trading strategiesof foreign investors on the KSE using transaction-level data and find no evidenceshowing that herding is more important during the crisis. In addition, there appears tobe no clear evidence of positive feedback trading by foreign investors during the crisis,while before the crisis there is evidence. Their analysis focuses exclusively on equitytrading. Given the significance of futures trading we complement their analysis byexamining herding and feedback futures market trading for each type of investors.
Herding is trading by a group of investors in the same direction over a certainperiod of time (the herding interval).13 Like Choe et al. (1999), we first take the
11 The nearest term contract changes maturity at the end of the first week of the expiration months,
namely March, June, September and December.12 See Wermers (1999) and Nofsinger and Sias (1999) for further discussions of these classifications.13 Nofsinger and Sias (1999) provide more details about the definition of herding.

616 E. Ghysels, J. Seon / Journal of International Money and Finance 24 (2005) 607e630
narrow and simple view of herding that is prevalent in the empirical literature.Namely, we regard that a group of investors herd if they move together over a spanof time. To test the hypothesis that foreign investors increased herding in the futuresmarket in which they increased their presence during the crisis period, we calculateherding measures for equities (using all KOSPI 200 stocks) and futures (using nearestmonth KOSPI 200 futures contracts) following the method proposed by Lakonishoket al. (1992) (hereafter LSV).
4.1. Herding measures
Lakonishok et al. (1992) measure the herding by group i on day t for equities as:
HEitZ
����BEit
NEit
�Pit
�����E
"����BEit
NEit
�Pit
����#
ð1Þ
where BEit/NEit is the observed ratio of buys to trades of all KOSPI 200 stocks bygroup i on day t and Pit is the expected value of the ratio of buys to trades by group ion day t. Since Pit is a population quantity, we need to compute its samplecounterpart. As a sample estimate of Pit for equities, we use the portion of buysrelative to the total transactions by group i for all stocks traded on day t at the KSE.The herding by group i on day t for futures (using nearest month KOSPI 200 futurescontracts) is measured as:
HFitZ
����BFit
NFit
�Pit
�����E
"����BFit
NFit
�Pit
����#
ð2Þ
where BFit/NFit is the observed ratio of buys to trades of nearest month KOSPI 200futures contracts by group i on day t and Pit is the expected value of the ratio of buysto trades by group i on day t. As a sample estimate of Pit for futures, the same ratiowith equities is used to make direct comparisons with the measures obtained fromequities trading. The first term of HEit or HFit in this measure will be larger if thetrading by group i is polarized on either the buy- or sell-side of the market. Thesecond term of HEit or HFit is a mean adjustment factor, since the first term is alwaysgreater than zero due to the absolute value. The adjustment factor is computedunder the assumption that BEit or BFit follows, in the absence of herding, a binomialdistribution with probability Pit of success. The herding measures are computedevery day and averaged separately across days before (JanuaryeSeptember 1997)and during (OctobereDecember 1997) the crisis period. We counted the totalnumber of buys and trades for the 200 stocks and constructed the herding measuresfor equities in Eq. (1), whereas Choe et al. compute the measure in Eq. (1) forindividual stocks and report averages and medians of individual stock herdingmeasures across size-sorted portfolios. We prefer to report herding measures for theentire portfolio of the 200 KOSPI stocks in order to make comparisons with themeasures obtained for futures trading.
617E. Ghysels, J. Seon / Journal of International Money and Finance 24 (2005) 607e630
Table 2 covers herding measures for equities on a daily basis and specific tradingsessions, namely the closing auction, post-closing session, and all the time slotsexcluding closing auction and post-closing sessions. We compute herding forparticular time slots of the day because there might be some significant movements intrading across the day by the main protagonists active in both markets. The herdingmeasures in Table 2 reflect how much each group’s trades of KOSPI 200 stocks aretilted towards either buying or selling. The herding measures for an entire tradingday show increases for Korean individual and institutional investors, compared totheir pre-crash levels, and decline for foreigners during the KSE crisis. The herdingmeasures increase from 1.21 to 1.89 and from 3.92 to 4.71, respectively, for Koreanindividuals and Korean institutions. The herding measure of foreign investorsdecreased to 1.48 from 3.46. The changes are strongly statistically significant. Whenwe examine the intra-daily patterns for each group of market participants we findthat the herding measures increased for all investors during the closing auction, whilethe increase by Korean individuals was not statistically significant. The herdingmeasures for the post-closing session reveal that herding by Korean individualsincreased significantly and herding by foreign investors declined significantly, whileherding by Korean institutions did not have any significant change. When theherding measures are computed for the time slots excluding closing auction and post-closing sessions, herding by all types of investors increased significantly during the
Table 2
Herding measures (in percent) for equities
Pre-crisis
(Jan.eSept. ’97)
Crisis period
(Oct.eDec. ’97)
t-test for mean
difference
Entire trading day
Korean individuals 1.21 1.89 (3.20)*
Korean institutions 3.92 4.71 (1.83)
Foreign investors 3.46 1.48 (�8.23)*
Closing auction
Korean individuals 4.07 4.80 (1.46)
Korean institutions 17.65 21.97 (2.39)*
Foreign investors 13.92 24.17 (4.11)*
Post-closing
Korean individuals 2.05 5.47 (4.20)*
Korean institutions 30.34 26.13 (�1.49)
Foreign investors 31.04 29.53 (�5.11)*
Excluding closing
auction and post-closing
Korean individuals 1.71 3.43 (5.11)*
Korean institutions 7.61 17.84 (6.32)*
Foreign investors 10.10 17.94 (4.39)*
Herding measures for equities (using by all KOSPI 200 stocks) following the method proposed by
Lakonishok et al. (1992) are reported. The herding by group i on day t is measured as given in Eq. (1).
t-statistics for the differences in means (assuming unequal variances) before and during the crisis period are
also provided. * Indicates statistical significance at the 5% level.

618 E. Ghysels, J. Seon / Journal of International Money and Finance 24 (2005) 607e630
KSE crisis period. Hence, foreign investors’ herding increased significantly duringthe closing auction session and time slots excluding closing auction and post-closingsession, meanwhile their herding decreased significantly during post-closing. Duringthe KSE crisis, foreign investors increased their share of trading during the post-closing session in the equity market in terms of the number of transactions as well astrading volume.14 Hence, the overall decline in herding for foreign investors ismainly due to their increased presence in the post-closing session where there is noprice uncertainty and where herding seem to have been less important as measuredby the traditional measures. Yet, the fact that foreign investors moved to the samesession is in some sense herding too, albeit not measured via the LSV statistics. Notethat the direction of herding measure changes obtained for the 200 KOSPI stocksalso differ from those of Choe et al. (1999), since they find no evidence showing thatherding is more important during the crisis.
Table 3, which covers futures, reports the three types of herding measurescomputed for different time spans: entire trading day, only closing auction, andtime slots excluding closing auction. The herding measures reported in Table 3indicate how much each group’s trades for nearest month futures contracts arepolarized compared to its trading activity for all stocks. The magnitude of theherding measures for futures are much larger compared to the results in Table 2for equities. For domestic investors, we report only one type of measure, themeasure of herding among a type of investors. Meanwhile, we report an additionalmeasure of herding for foreign investors, the measure of herding across foreigninvestor groups. The measure of herding among foreign investors treats each buyas a buy by a different foreign investor, while the measure of herding acrossforeign investor groups counts buys (sells) from a group of foreign investors asa buy (sell) if the net purchase of the group is positive (negative). To calculate thesecond type of herding measures, we classify trades by foreign investors into 21groups (three countries of residence, i.e. US, UK and other countries times seventypes of investors, i.e. banks, non-resident securities companies, company-typetrust companies, contract-type trust companies, pension and fund, residentsecurities companies, and others). The measure of herding across foreign investorgroups could understate herding by ignoring herding within groups of foreigninvestors, since it aggregates many buys and sells into just one trade. Meanwhilethe measure of herding among foreign investors could overestimate the degree ofherding, since the same foreign investors may buy or sell the nearest month futurescontract several times during the same span of time.
Herding among foreigners and domestic institutions is strong and even increasesduring the crisis. Herding measures for an entire trading day increased from 6.44 to13.88 and from 16.16 to 25.81, respectively, for Korean institutions and foreigninvestors. Only the herding of Korean individuals for an entire trading day, which isthe weakest, remains the same during the crisis. The t statistics in the last column of
14 The evidence on this is documented at the previous version of the paper, which is available at
http://www.unc.edu/weghysels/papers/Kse0301.pdf.

619E. Ghysels, J. Seon / Journal of International Money and Finance 24 (2005) 607e630
Table 3 reveal, that the movements are statistically significant except for the minordecline of herding in the futures market among Korean individuals.15 It is alsointeresting to note that for equities the level of herding before the crisis is roughly thesame for Korean institutions and foreign investors (who are mostly institutions).
Table 3
Herding measures (in percent) for futures
Pre-crisis
(Jan.eSept. ’97)
Crisis period
(Oct.eDec. ’97)
t-test for mean
difference
Entire trading day
Korean individuals 3.82 3.14 (�1.39)
Korean institutions 6.44 13.88 (4.08)*
Foreign investors 16.16 25.81 (3.98)*
Herding across
foreign investor groups
10.59 21.42 (7.10)*
Closing auction
Korean individuals 11.73 12.05 (0.15)
Korean institutions 8.72 25.71 (6.01)*
Foreign investors 24.18 44.27 (5.35)*
Herding across
foreign investor groups
10.81 21.11 (6.00)*
Excluding closing auction
Korean individuals 3.55 3.25 (�0.63)
Korean institutions 6.44 13.69 (4.08)*
Foreign investors 16.60 22.24 (2.54)*
Herding across
foreign investor groups
10.59 21.44 (7.12)*
Herding measures for futures (using by near-month KOSPI 200 futures contracts) following the method
proposed by Lakonishok et al. (1992) are reported. The herding by group i on day t is measured as given in
Eq. (2). For foreign investors, we report two types of herding measures: herding among foreign investors
and herding across foreign investor groups. The first type which is used to computed all equities’ herding
measures and domestic investors’ futures herding measures treats each buy as a buy by a different foreign
investor, while the second counts buys (sells) from a group of foreign investors as a buy (sell) if the net
purchase of the group is positive (negative). To compute the second type of herding measures, we classify
trades by foreign investors into 21 groups (three countries of residence, i.e. US, UK and other countries
times seven types of investors, i.e. banks, non-resident securities companies, company-type trust
companies, contract-type trust companies, pension and fund, resident securities companies, and others).
t-statistics for the differences in means (assuming unequal variances) before and during the crisis period are
also provided. * Indicates statistical significance at the 5% level.
15 It is worth noting at this point that one might have some reservations about the validity of the t
statistics reported in Table 3. As noted by Wylie (1998), the LSV test of herding may be imperfect for
several reasons. Firstly, the means of the herding measures may not be equal to zero since HEit and HFit
are computed using the sample estimate of Pit. Under such circumstances the standard the Central Limit
Theorem is not applicable and statistical tests are not valid. Secondly, short sale restrictions, which are
implicitly ruled out in the LSV measure, imply a left truncation in the distribution of for instance BEit and
therefore invalidate the binomial distributional assumption. Moreover, the distribution of BEit can be
misspecified, even in the absence of herding.

620 E. Ghysels, J. Seon / Journal of International Money and Finance 24 (2005) 607e630
When the herding measures are computed for only closing auction session and thetime slots excluding closing auction, the results are the same. During the crisisherding by Korean institutions and foreign investors on both closing auction andtime slots excluding closing auction showed significant increases, while herding byKorean individuals did not show any significant change. Herding across foreigninvestor groups is also strong and increases during the crisis. Even though themeasures of herding across foreign investor groups (the second type) are lower thanthose by the first method, the story of herding by foreign investors does not changedue to the method of counting. During the crisis, herding of foreign investorsincreases for an entire trading day, only closing auction, and time slots excludingclosing auction.
4.2. Feedback trading
Having examined herding measures, we turn our attention now to the analysisof feedback trading. Theoretical models, along the line of DeLong et al. (1990),show that the presence of positive feedback traders can make rational speculationdestabilize the security market as against the prediction of market efficiencyliterature. Cutler et al. (1990) showed that profitable speculation can raise thevariance of returns relative to the variance of shocks to fundamental values in thefutures market. If positive feedback traders exist in a market and their tradingbehavior is expected by rational speculators, rational speculators will not counterthe irrational price movement by positive feedback traders. Instead, they will hopon the bandwagon and thus will form a herd with positive feedback traders.Their behavior will drive prices further away from fundamentals and thusincrease the volatility of the market. Balduzzi et al. (1995) investigate the effect ofpositive and negative feedback trading on asset price dynamics using a multi-assetmodel in which stocks and bonds are traded by two types of agents: speculatorsand feedback traders. They find positive feedback strategies make stock returnsmore volatile while negative feedback strategies decrease the volatility of stockreturns. To investigate whether each group of investors choose positive feedbackstrategies in both the cash and futures market, we define a measure of orderimbalance, namely price-setting order imbalances (PSOI). Trades on the KSE canbe divided into two categories: buy price-setting trades, and sell price-settingtrades. A buy (sell) price-setting trade is defined as a trade where the buy-side(sell-side) comes after the sell-side (buy-side) and thus the former makes the tradepossible. We can only consider price-setting trades during the continuous tradingperiods. Hence, the analysis in this section complements the discussion in theprevious subsection where the intra-day allocation between continuous tradingand post-closing sessions was analyzed. Moreover, the analysis in this subsectionalso complements the finding of Choe et al. (1999) who also examine price-settingorder imbalances.
The PSOI for investor group i (for a stock or futures contract) on day t, denotedPSOI(i, t), is computed as the price-setting buy volume of i on day t minus the price-setting sell volume on the same day by the same group of investors normalized by the
621E. Ghysels, J. Seon / Journal of International Money and Finance 24 (2005) 607e630
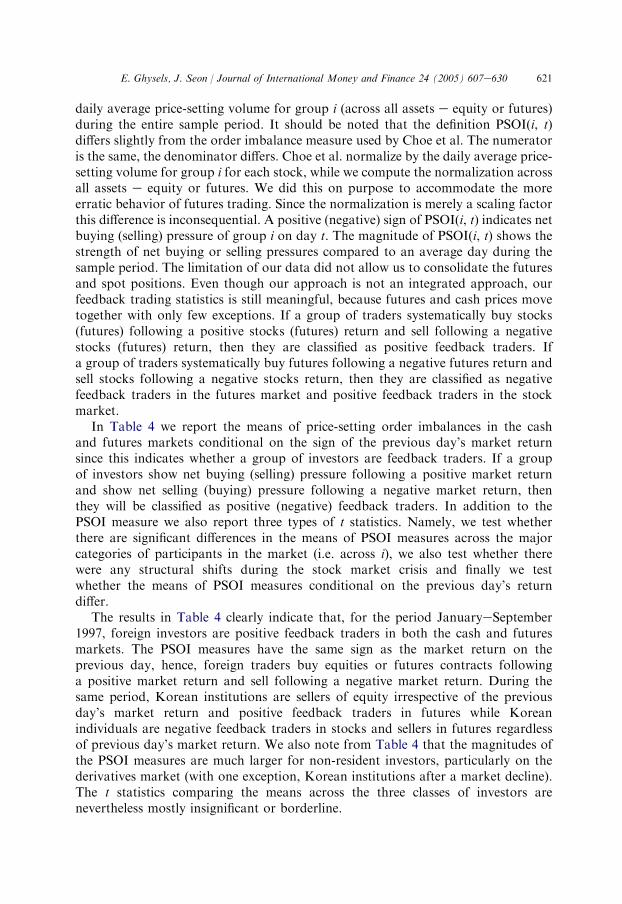
daily average price-setting volume for group i (across all assets e equity or futures)during the entire sample period. It should be noted that the definition PSOI(i, t)differs slightly from the order imbalance measure used by Choe et al. The numeratoris the same, the denominator differs. Choe et al. normalize by the daily average price-setting volume for group i for each stock, while we compute the normalization acrossall assets e equity or futures. We did this on purpose to accommodate the moreerratic behavior of futures trading. Since the normalization is merely a scaling factorthis difference is inconsequential. A positive (negative) sign of PSOI(i, t) indicates netbuying (selling) pressure of group i on day t. The magnitude of PSOI(i, t) shows thestrength of net buying or selling pressures compared to an average day during thesample period. The limitation of our data did not allow us to consolidate the futuresand spot positions. Even though our approach is not an integrated approach, ourfeedback trading statistics is still meaningful, because futures and cash prices movetogether with only few exceptions. If a group of traders systematically buy stocks(futures) following a positive stocks (futures) return and sell following a negativestocks (futures) return, then they are classified as positive feedback traders. Ifa group of traders systematically buy futures following a negative futures return andsell stocks following a negative stocks return, then they are classified as negativefeedback traders in the futures market and positive feedback traders in the stockmarket.
In Table 4 we report the means of price-setting order imbalances in the cashand futures markets conditional on the sign of the previous day’s market returnsince this indicates whether a group of investors are feedback traders. If a groupof investors show net buying (selling) pressure following a positive market returnand show net selling (buying) pressure following a negative market return, thenthey will be classified as positive (negative) feedback traders. In addition to thePSOI measure we also report three types of t statistics. Namely, we test whetherthere are significant differences in the means of PSOI measures across the majorcategories of participants in the market (i.e. across i), we also test whether therewere any structural shifts during the stock market crisis and finally we testwhether the means of PSOI measures conditional on the previous day’s returndiffer.
The results in Table 4 clearly indicate that, for the period JanuaryeSeptember1997, foreign investors are positive feedback traders in both the cash and futuresmarkets. The PSOI measures have the same sign as the market return on theprevious day, hence, foreign traders buy equities or futures contracts followinga positive market return and sell following a negative market return. During thesame period, Korean institutions are sellers of equity irrespective of the previousday’s market return and positive feedback traders in futures while Koreanindividuals are negative feedback traders in stocks and sellers in futures regardlessof previous day’s market return. We also note from Table 4 that the magnitudes ofthe PSOI measures are much larger for non-resident investors, particularly on thederivatives market (with one exception, Korean institutions after a market decline).The t statistics comparing the means across the three classes of investors arenevertheless mostly insignificant or borderline.

Table 4
Price-se
Condit
of cash
of the p
Near-month KOSPI 200 Futures Contracts
f a
2)
Korean
individuals
(1)
Korean
institutions
(2)
Foreign
investors
(3)
t-test of a
(3)� (1)
t-test of a
(3)� (2)
Pre-cris
Rt�1 �0.138 1.398 6.435 (1.89) (1.48)
!0 �1.428 �0.999 �8.412 (�1.99)* (�2.06)*
t-test (�1.00) (�1.84) (�3.10)*
Crisis (
Rt�1 ) �12.582 �8.348 �27.251 (�0.47) (�0.61)
!0 ) 8.533 2.943 20.334 (0.42) (0.65)
t-test (1.88) (2.41)* (1.16)
t-test fo
Rt�1 (�3.95)* (�5.44)* (�2.01)*
!0 (1.74) (1.36) (1.62)
Entries ily price-setting order imbalances for a group of investors, PSOI(i,t)
are com by their average daily price-setting volume across the entire sample
period. n of cash or futures returns of the previous trading day. A group of
investo rket, if they show net buying (selling) pressure following a positive
market . * Indicates statistical significance at the 5% level.a t-tesb t-te s with negative market returns.
622
E.Ghysels,
J.Seon/JournalofIntern
atio
nalMoney
andFinance
24(2005)607e
630
tting order imbalances for equities and futures
ional on the sign
or futures return
revious day
All KOSPI 200 Stocks
Korean
individuals
(1)
Korean
institutions
(2)
Foreign
investors
(3)
t-test of a
(3)� (1)
t-test o
(3)� (
is (Jan.eSept. ’97)
O 0 �0.102 �0.805 5.456 (1.62) (1.58)
0.888 �9.587 �7.565 (2.84)* (0.51)
for mean differencesb (0.72) (�2.43)* (�3.02)*
Oct.eDec. ’97)
O 0 1.059 �44.918 �64.823 (�4.10)* (�0.83
13.161 �26.777 �47.878 (�5.16)* (�1.59
for mean differencesb (1.32) (0.96) (0.98)
r mean differences between the two periods
O 0 (0.28) (�4.02)* (�7.18)*
(3.17)* (�2.51)* (�5.17)*
to the tables are price-setting order imbalances for each group of investors. The da
puted as their buy price-setting volume minus sell price-setting volume normalized
The figures represent average price-setting order imbalances conditional on the sig
rs are regarded as positive (negative) feedback traders in either stock or futures ma
return and show net selling (buying) pressure following a negative market return
t for mean differences between two types of investors.
st for mean differences between the days with positive market returns and the day

623E. Ghysels, J. Seon / Journal of International Money and Finance 24 (2005) 607e630
During the crisis, foreign investors are sellers in the stock market regardless ofprevious day’s market return. The hypothesis of negative feedbacking trading byforeign investors in the futures market is rejected since the difference between PSOImeasures with positive return days and with negative return days is not significant.This result suggests that feedbacking trading strategies were not a source of increasein their herding.
5. The price impact of foreign investors on the market
Thus far, we only examine the direction of trades either via herding measures orvia the PSOI measure. In this section we focus on the price impact of trades by non-resident and Korean investors during continuous trading hours. We test whetherprice impacts of trades by non-resident investors increased during the crisis. Wecompute temporary and permanent price impacts of trades for equities and futures,using the real-time data. Note that we have chosen a slightly different approach fromChoe et al. who use two distinct event studies. In the first event study, they measureabnormal returns for 11 5-min intervals centered around large trades by foreignmarket participants. In the second event study, they use a coarser daily samplingfrequency. To define temporary and permanent price impacts associated witha trade, we follow the conventional definition of price impacts used in the empiricalliterature.16 A temporary price impact is defined as the difference between the priceof a trade and the price of a subsequent trade, i.e., tZ�ln(PtC1/Pt). A permanentprice impact is defined as the difference between price before and after a trade, thatis, pZ ln(PtC1/Pt�1). Temporary price impacts reflect the liquidity effect of a tradewhile permanent price impacts the information effect of a trade.
We calculate the components of price impacts, respectively, for sell price-settingtrades and buy price-setting trades. Table 5 reports the average temporary andpermanent price impacts, classified by types of trader, before and during the crisisperiod. The upper panel of Table 5 pertains to sell price-setting trades, and thelower to buy price-setting trades. For equities, the results pertain to the 200 stocksof the KOSPI index, while for futures the results pertain to the various activecontracts.17 For Korean institutions and foreign investors, the average temporaryand permanent price impacts are represented as a percentage of the correspondingmeasures for Korean individuals. For sell price-setting trades, we note that Koreaninstitutions and foreign investors have smaller temporary components and largerpermanent components of price impact, compared to Korean individuals. For the
16 For more details on temporary and permanent price effects, see Keim and Madhavan (1996).17 The price impacts of trade for futures have much smaller value that the price impacts of trade for
equities because the price unit of futures contract is much smaller than those of equities. In 1997 the
futures price ranged from 75 to 40, while the prices of most KOSPI 200 stocks were well above 5000
Korean Won.

Permanent price impacts (p)
orean
dividuals
)
Korean
institutions
(2)
Foreign
investors
(3)
t-test of a
(3)� (1)
t-test of a
(3)� (2)
0.00058 168.92% 123.46% 30.79* �4.24*
0.00008 147.18% 144.46% 1.56 �0.10
0.00082 114.01% 81.75% �9.33* �14.95*
0.00014 139.40% 187.50% 4.36* 3.03*
5.84* �2.75* �2.83*
5.83* 10.26* 3.74*
0.00073 53.99% 64.06% �10.80* 10.29*
0.00012 87.23% 101.05% 0.06 0.71
0.00083 55.27% 59.61% �18.28* 1.51
0.00018 67.37% 58.61% �2.65* �0.55
7.17* 3.60* 1.72
6.09* 1.35 �0.46
es (near-month futures contracts), using the real-time data.
tC1/Pt), pZ ln(PtC1/Pt�1). Each trade is classified into two
ean individuals, temporary and permanent price impacts are
(OctobereDecember 1997) the crisis. The temporary and
ges of the corresponding Korean individuals’ entries. t-tests
impacts. * Indicates statistical significance at the 5% level.
624
E.Ghysels,
J.Seon/JournalofIntern
atio
nalMoney
andFinance
24(2005)607e
630
Table 5
Temporary and permanent price impacts of trades for equities and futures
A. Temporary price impacts (t) B.
Korean
individuals
(1)
Korean
institutions
(2)
Foreign
investors
(3)
t-test of a
(3)� (1)
t-test of a
(3)� (2)
K
in
(1
Sell price-setting trades
Pre-crisis Equities �0.00049 9.37% 11.19% �54.63* 0.98 �Futures �0.00012 25.32% 57.47% �3.01* 2.36* �
Crisis period Equities �0.00045 28.37% 15.74% �13.20* �22.22* �Futures �0.00027 27.79% 25.07% �8.70* �0.43 �
t-testb Equities �11.41* 7.98* 1.43 4
Futures 17.90* 8.04* �0.12
Buy price-setting trades
Pre-crisis Equities 0.00040 192.10% 140.79% 21.12* �21.47*
Futures 0.00006 102.09% 107.71% 0.25 0.18
Crisis period Equities 0.00044 179.80% 134.26% 26.27* �6.31*
Futures 0.00013 210.74% 155.54% 3.42* �3.27*
t-testb Equities 9.38* 1.67 2.37* 1
Futures 10.23* 29.86* 3.93*
Temporary and permanent price impacts of trade for equities (all KOSPI 200 stocks) and futur
Temporary price impacts (t) and permanent price impacts (p) are defined as follows: tZ�ln(P
types: sell price-setting trades and buy price-setting trades. For each type of trade executed by Kor
computed each day and averaged across days before (JanuaryeSeptember 1997) and during
permanent price impacts of Korean institutions and foreign investors are represented as percenta
for the differences in means are also reported. Note that all t-tests were performed on raw pricea t-test for mean differences between two types of investors.b t-test for mean differences between the pre-crisis and crisis period.

625E. Ghysels, J. Seon / Journal of International Money and Finance 24 (2005) 607e630
temporary impact, the percentages range between 10% and 60%. It is interestingto note that the temporary price impact changes significantly for Koreanindividuals and institutions in both cash and futures markets. The temporaryimpacts of sell price-setting trades of foreigners slightly increase in equity marketsand dramatically decrease in the futures markets but neither movements appearstatistically significant. Now we turn our attention to the permanent price impact.The evidence for permanent price impacts is far different. Here the permanent priceimpacts of foreign traders on the futures market dramatically increase from144.46% before the crisis to 187.50% during the crisis. This finding is of courseimportant and significant, considering the information impact of foreign investorson the Korean stock market. In the Korean stock market, domestic investors keepwatching foreign investors’ buying or selling and net position of stocks andderivatives, believing that they affect significantly on the stock market. Sinceforeigners were mostly net sellers of contracts, and increased their share of volume,and they also increased their herding, the information impact of trades by non-resident investors became larger and more influential to domestic investors. Thepermanent impacts of futures sell price-setting trades by Korean institutions alsoincrease during the crisis but their percentage as a fraction of Korean individualsdecreased from 147.18% to 139.40%. For equities, the permanent impacts ofKorean institutions actually decline slightly during the crisis as the permanentimpact of foreign investors does.
For buy price-setting trades, the relative magnitudes of temporary and permanentprice impacts relative to Korean individuals are reversed. The temporary impact ofKorean institutions and foreigners are larger than 100% and drop in the equitymarkets during the crisis, while they increase significantly in futures market. Therelative permanent impacts of buy price-setting trades by foreigners and Koreaninstitutions are about 60% in both equities and futures and have a tendency not tochange during the crisis.
6. The linkage between futures and cash market
We examined trading in futures and equities without paying much attention to thelinkage between both markets. We found that foreign investors are net sellers ofnear-term futures contracts and their permanent price impact of sell price-settingfutures trades became larger during the crisis period. Selling pressures of foreigninvestors in the futures market may have transmitted to the cash market causing netselling of equities by domestic investors, especially domestic institutions. To verifywhether the near-month futures trading by non-resident investors have biggerinformation effects on domestic institution in either the futures or equities market,we investigate the linkages between net selling of near-term futures by foreigninvestors and net selling of near-term futures or equities by domestic institutionsusing 15-min intra-daily data and impulse response analysis. The trading day isdivided into 17 15-min intervals.

626 E. Ghysels, J. Seon / Journal of International Money and Finance 24 (2005) 607e630
The linkage is modeled via impulse response analysis using a bivariate system ofthe net buys of near-term futures or equities by domestic institutions and the netbuys of near-term futures contracts by foreign investors:
ytZmCXk
iZ1
Aiyt�iCDbatchCDpost-closeCet ð3Þ
where yt is a vector of the two endogenous variables which are computed over15-min intervals, m is a vector of constants, Dbatch are dummies for opening andclosing batch auction sessions, Dpost-close are dummies for post-closing period, andet is a vector of white noise process with E(et)Z 0, E(ete#t)ZU, and E(ete#s)Z 0for ts s. Dummies for batch auctions and post-closing periods are incorporatedto control microstructure effects due to non-continuous auction and post-closingtrading. The lag lengths for the VARs are chosen via the Akaike InformationCriterion. The VARs are estimated before (September 22eOctober 23, 1997),during (October 24eNovember 23, 1997) and after (November 24eDecember 26,1997) the stock market crash period to examine the impulse response patternclosely around the stock market crash.18 Before estimating the VARs, we appliedAugmented DickeyeFuller tests to the 15-min net buys of equities or futures byeach type of investors for the entire year of 1997 and found that all the series arestationary.
We first examine whether net buys of futures by foreign investors have anyinformation effect on domestic institutions’ behavior in the futures market. Fig. 4shows the impulse responses of net buys of futures by domestic institutions to a unitshock in net buys of futures by foreign investors before, during and after the stockmarket crash periods. The impulse response patterns do not display any persistentresponses of domestic futures trading to a shock in the net buys of the near-termfutures contract by foreign investors before, during and after the crash period.Hence, for the futures market, we cannot find any evidence that a shock in the netsells of futures by foreign investors induce further net sells of futures by domesticinstitutions.
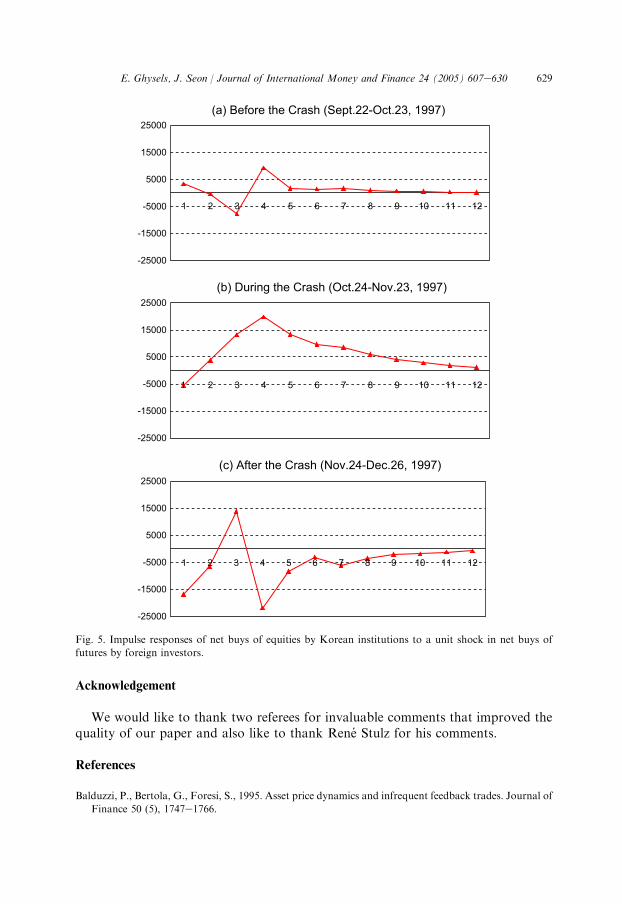
Next we turn our attention to the responses of equities trading by domesticinstitutions to the same type of shocks. We investigate whether futures tradingby foreign investors have any information impact on the behavior of domesticinstitutions in the equities market. Table 6 reports the impulse responses of net buysof equities by domestic institutions to a unit shock in net buys of futures by foreigninvestors before, during and after the stock market crash periods. The figures inTable 6 indicate that the impulse responses by domestic institutions are significantduring the crash period but not before and after the crash periods. The plots in Fig. 5
18 At this time we define sub-periods of analysis differently from those in preceding sections. In order to
focus on the period around the crash when net futures sell volume of foreign investors was highest, we
divide the entire period into three rather than two sub-periods. They are before, during and after the crash
instead of before and during the crisis period.

627E. Ghysels, J. Seon / Journal of International Money and Finance 24 (2005) 607e630
confirm this, they display the impulse response to a shock in net buys of futures byforeign investors, respectively, for before, during and after the stock market crashperiod. According to the impulse response patterns, there are no persistent andsignificant responses to shock in the net buys of the near-term futures contract byforeign investors before and after the crash period. However, during the crashperiod, domestic institutions as a group react positively to a shock in the net buys offutures contract by foreign investors and their positive responses persist from the 4thperiod to the 9th period. The impulse response analysis indicates that futures tradesby foreign investors have information effects on the trades of equities by domesticinstitutions during the crash period while there was no evidence of such effects beforeand after the crash period.
-80.00
-60.00
-40.00
-20.00
0.00
20.00
40.00
-80.00
-60.00
-40.00
-20.00
0.00
20.00
40.00
-80.00
-60.00
-40.00
-20.00
0.00
20.00
40.00
1 2 3 4 5 6 7 8 9 10 11 12
1 2 3 4 5 6 7 8 9 10 11 12
1 2 3 4 5 6 7 8 9 10 11 12
(a) Before the Crash (Sept.22-Oct.23, 1997)
(b) During the Crash (Oct.24-Nov.23, 1997)
(c) After the Crash (Nov.24-Dec.26, 1997)
Fig. 4. Impulse responses of net buys of futures by Korean institutions to a unit shock in net buys of
futures by foreign investors.

628 E. Ghysels, J. Seon / Journal of International Money and Finance 24 (2005) 607e630
7. Conclusion
Many papers, including Choe et al. (1999), Kim and Wei (1999) and Radelet andSachs (1998), have examined the Korean market as a representative example of theAsian financial crisis. The role of derivative securities is typically, either implicitly orexplicitly, overlooked when examining the crisis. In this paper, we investigated firstthe role of trading in index futures during the Korean crash. We find that thefraction of futures volume as a percentage of cash volume soared around the crisisand that selling pressures in the futures market were transmitted to the cash marketcausing a decline in cash prices. These phenomena were not observed prior to thecrisis, indicating that index futures trading played a role during the stock marketturbulence in 1997. Given the significance of futures trading, we complement Choeet al.’s (1999) analysis examining whether futures trading by either domestic orforeign investors, or both together, exerted a destabilizing influence during the crash.We find that foreign investors increased their presence in the futures market anddramatically increase their herding of futures trading. The permanent impact of theirfutures contracts sales increases substantially during the crisis. We also find thatnear-term futures trades by foreign investors have information effect on the trades ofequities by domestic institutions during the crash period. A shock in the net buys(sells) of near-term futures contracts by foreign investors induces subsequent netbuys (sells) of equities by domestic investors during the crash period. Meanwhilethere was no evidence of such effect before and after the crash period. We can onlyconclude that overlooking the role of futures trading understates the influence offoreign traders on the Asian financial crisis.
Table 6
Impulse responses of net buys of equities by Korean institutions to a unit shock in net buys of futures by
foreign investors
Period Before the crash
(Sept. 22eOct. 23)
During the crash
(Oct. 24eNov. 23)
After the crash
(Nov. 24eDec. 26)
1 3381 (0.59) �5621 (�0.59) �16,812 (�0.56)
2 �431 (�0.07) 3780 (0.38) �6670 (�0.21)
3 �7763 (�1.31) 13,173 (1.30) 13,820 (0.44)
4 9256 (�1.53) 19,835 (2.06)** �21,872 (�0.70)
5 1581 (0.56) 13,246 (1.99)** �8398 (�0.50)
6 1452 (0.63) 9671 (2.08)** �3053 (�0.24)
7 1685 (1.01) 8597 (2.02)** �6210 (�0.56)
8 802 (0.76) 5990 (1.91)* �3502 (�0.50)
9 673 (0.86) 3968 (1.81)* �2081 (�0.42)
10 453 (0.85) 2861 (1.67) �1820 (�0.50)
11 302 (0.81) 1923 (1.53) �1166 (�0.48)
12 217 (0.82) 1225 (1.38) �754 (�0.45)
Entries to the tables are impulse responses of the net buys of equities by Korean institutions to a unit
shock in the net buys of futures by foreign investors before, during and after the stock market crash
period. t-statistics on each response is also provided. ** (*) Indicates significance of a response at the 5%
(10%) significance level.
629E. Ghysels, J. Seon / Journal of International Money and Finance 24 (2005) 607e630
Acknowledgement
We would like to thank two referees for invaluable comments that improved thequality of our paper and also like to thank Rene Stulz for his comments.
References
Balduzzi, P., Bertola, G., Foresi, S., 1995. Asset price dynamics and infrequent feedback trades. Journal of
Finance 50 (5), 1747e1766.
-25000
-15000
-5000
5000
15000
25000
-25000
-15000
-5000
5000
15000
25000
-25000
-15000
-5000
5000
15000
25000
(a) Before the Crash (Sept.22-Oct.23, 1997)
(b) During the Crash (Oct.24-Nov.23, 1997)
(c) After the Crash (Nov.24-Dec.26, 1997)
1 2 3 4 5 6 7 8 9 10 11 12
1 2 3 4 5 6 7 8 9 10 11 12
1 2 3 4 5 6 7 8 9 10 11 12
Fig. 5. Impulse responses of net buys of equities by Korean institutions to a unit shock in net buys of
futures by foreign investors.

630 E. Ghysels, J. Seon / Journal of International Money and Finance 24 (2005) 607e630
Barth, M., Zhang, X., 1999. Foreign equity flows and the Asian financial crisis. In: Harwood, A.,
Litan, R.E., Pomerleano, M. (Eds.), Financial Markets and Development: The Crisis in Emerging
Markets. Brookings Institution Press, Washington DC, pp. 179e218.Biais, B., Hillion, P., Spatt, C., 1995. An empirical analysis of the limit order book and the order flow in
the Paris Bourse. Journal of Finance 50 (5), 1655e1689.
Blume, M.E., MacKinlay, C.A., Terker, B., 1989. Order imbalances and stock price movement on October
19 and 20, 1987. Journal of Finance 44 (4), 827e848.
Calvo, G., Mendoza, E., 2000. Contagion, globalization, and the volatility of capital flows. In:
Sebastian, E. (Ed.), Capital Flows and the Emerging Economies. The University of Chicago Press,
Chicago, IL, pp. 15e42.
Choe, H., Kho, B., Stulz, R.M., 1999. Do foreign investors destabilize stock markets? The Korean
experience in 1997. Journal of Financial Economics 54 (2), 227e264.
Cutler, D.M., Poterba, J.M., Summers, L.H., 1990. Speculative dynamics and the role of feedback traders.
The American Economic Review 80 (2), 63e68.
DeLong, J.B., Shleifer, A., Summers, L.H., Waldmann, R.J., 1990. Positive feedback investment strategies
and destabilizing rational speculation. Journal of Finance 45 (2), 379e395.
Hamao, Y., Hasbrouck, J., 1995. Securities trading in the absence of dealers: trades, and quotes on the
Tokyo Stock Exchange. Review of Financial Studies 8 (3), 849e878.Kaminsky, G.L., Schmukler, S.L., 1999. What triggers market jitters? A chronicle of the Asian crisis.
Journal of International Money and Finance 18 (4), 537e560.
Keim, D.B., Madhavan, A., 1996. The upstairs market for large-block transactions: analysis and
measurement of price effects. Review of Financial Studies 9 (1), 1e36.Kim, W., Wei, S., 1999. Foreign portfolio investors before and during a crisis. NBER Working Paper no.
6968, Cambridge, MA.
Kleidon, A.W., Whaley, R.E., 1992. One market? Stocks, futures, and options during October 1987.
Journal of Finance 47 (3), 851e877.
Lakonishok, J., Shleifer, A., Vishny, R.W., 1992. The impact of institutional trading on stock prices.
Journal of Financial Economics 32 (1), 23e43.
Lehmann, B.N., Modest, D.M., 1994. Trading and liquidity on the Tokyo Stock Exchange: a bird’s eye
view. Journal of Finance 49 (3), 951e984.
Nofsinger, J.R., Sias, R.W., 1999. Herding and feedback trading by institutional and individual investors.
Journal of Finance 54 (6), 2263e2295.
Radelet, S., Sachs, J., 1998. The onset of the East Asian financial crisis. Unpublished working paper,
Harvard University, Cambridge, MA.
Santoni, G.J., 1988. The October crash: some evidence on the cascade theory. Federal Reserve Bank of St.
Louis Review May/June, 18e33.Wermers, R., 1999. Mutual fund herding and the impact of stock prices. Journal of Finance 54 (2),
581e622.
Wylie, S., 1998. Tests of the accuracy of measures of herding. Unpublished working paper, Dartmouth
College, Hanover, NH.
Recommended