ACEEE International Journal on Signal and Image Processing Vol 1, No. 2, July 2010
Texture Defect Detection Technique For MRI Knee Images
Ms. P.N. Jebarani Sargunar,Asst. Professor Dept. of IT, SSN College of Engineering, Kalavakkam-603110.
India, Email: [email protected], Professor, ECE Dept., Thiagarajar College of Engineering, ,Madurai-15.India.
ABSTRACT: In this paper, the segmentation of data in 2D and 3D by texture analysis using Fourier domain filtering is processed. The textural measurements are extracted from the Fourier domain of the data via sub-band filtering. Measurements are extracted by using a novel Bhattacharya- distance and a compact feature space is produced. Each dimension of the feature space is used to form the Quad tree. The classification is performed over the higher level of the tree using fractal measures and is projected to lower levels where a boundary refinement procedure is performed using 3D equivalent of butterfly filters. This is implemented for MRI knee images. The performance of the algorithm was tested with 3D artificial data and a magnetic resonance imaging set of human knees with encouraging results.
KEY WORDS: Filtering, Texture Segmentation, Multi-resolution, Digital Image Processing.
1.INTRODUCTION
There are number of problems where a study of volumetric texture is of great importance. Volumetric analysis is desirable for various applications such as medical imaging applications such as magnetic resonance imaging (MRI) segmentation, Ultrasound or Computed Tomography, analysis of Crystallographic texture. There are many techniques for feature extraction, classification and segmentation for 2D textures. For 3D texture also there are numerous techniques dealt with segmentation. Most of the techniques are to slice the volume of the volumetric data in 2D cross sections and the individual slices can be used in a 2D texture analysis. But the high frequency oriented textures could easily be missed by these planes. A sub-band filtering scheme for volumetric textures is proposed that provides a series of measurements which capture the different textural characteristics of the data. The filtering is performed in the frequency domain with filters that are easy to generate. To select a subset of features, in order to obtain a quantitative measure of how separable are two classes given a feature, a distance measure is required. The Bhattacharyya distance works best on a range of textures. This is developed into the concept of a feature selection space in which discrimination decisions can be made. A multi-resolution classification scheme is
then developed which operates on the joint data-feature space within an oct-tree structure. This benefits both the efficiency of the computation and ensures only the certain labeling at a given resolution is propagated to the next. Interfaces between regions (planes), where the label decisions are uncertain, are smoothed by the use of 3-D butterfly filters.
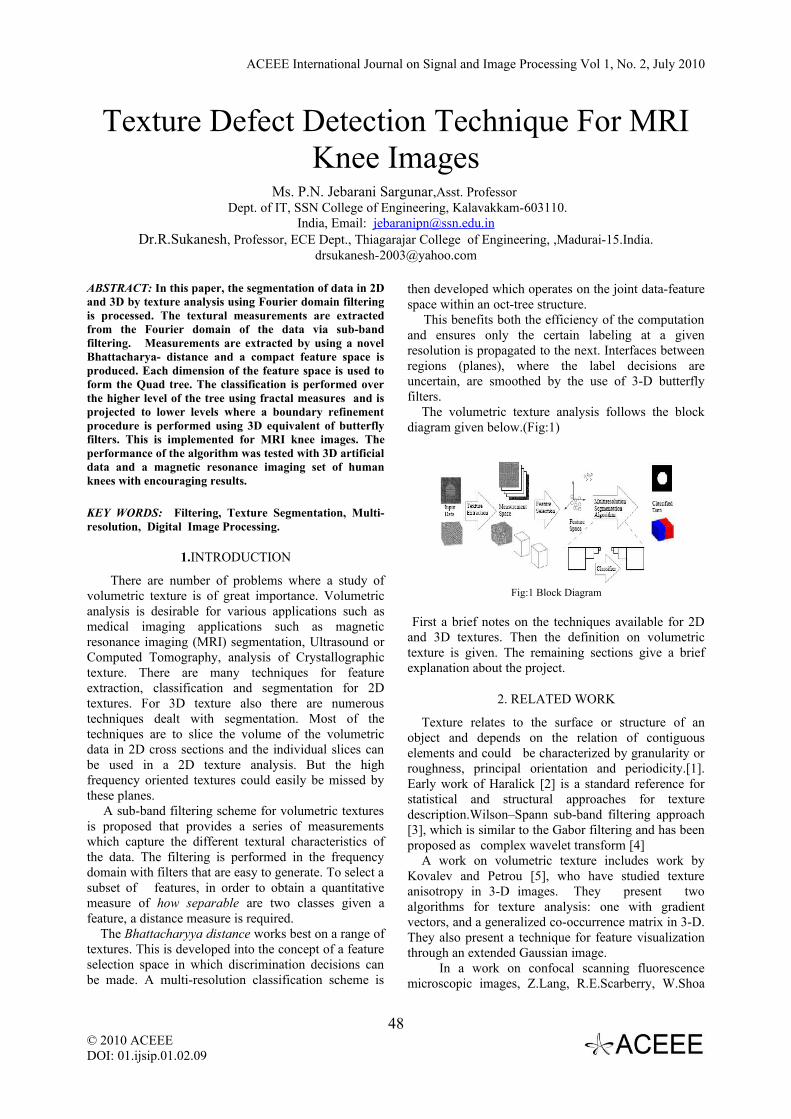
The volumetric texture analysis follows the block diagram given below.(Fig:1)
Fig:1 Block Diagram
First a brief notes on the techniques available for 2D and 3D textures. Then the definition on volumetric texture is given. The remaining sections give a brief explanation about the project.
2. RELATED WORK
Texture relates to the surface or structure of an object and depends on the relation of contiguous elements and could be characterized by granularity or roughness, principal orientation and periodicity.[1]. Early work of Haralick [2] is a standard reference for statistical and structural approaches for texture description.Wilson–Spann sub-band filtering approach [3], which is similar to the Gabor filtering and has been proposed as complex wavelet transform [4]
A work on volumetric texture includes work by Kovalev and Petrou [5], who have studied texture anisotropy in 3-D images. They present two algorithms for texture analysis: one with gradient vectors, and a generalized co-occurrence matrix in 3-D. They also present a technique for feature visualization through an extended Gaussian image. In a work on confocal scanning fluorescence microscopic images, Z.Lang, R.E.Scarberry, W.Shoa
48© 2010 ACEEE DOI: 01.ijsip.01.02.09
ACEEE International Journal on Signal and Image Processing Vol 1, No. 2, July 2010
and X.Sun [6], has experienced an Iterative Octree Expansion and Linking Control Algorithm for 3D segmentation with a knowledge based classification.
On intensity based inhomogenities, W.M.Wells and W.Grimson [7], worked on a new method called adaptive segmentation that uses knowledge of tissue intensity properties and intensity inhomogeneities to correct and segment MR images. Use of the expectation-maximization (EM) algorithm leads to a method that allows for more accurate segmentation of tissue types as well as better visualization of magnetic resonance imaging (MRI) data. A comparative study is made by Trygve Randen and John Hakon Husoy[8] on Filtering for Texture Classification and discussed various methods including Laws masks, ring/wedge filters, dyadic Gabor filter banks, wavelet transform, wavelet packets and wavelet frames.
3. PROPOSED APPROACH
Gonzalez [1] relates certain properties of texture with the approaches to textural analysis:• Statistical: smooth, coarse, grainy,…• Structural: arrangement of features primitives
according to certain rules,• Spectral: global periodicity based on the Fourier
Spectrum.These properties are helpful to describe textures.
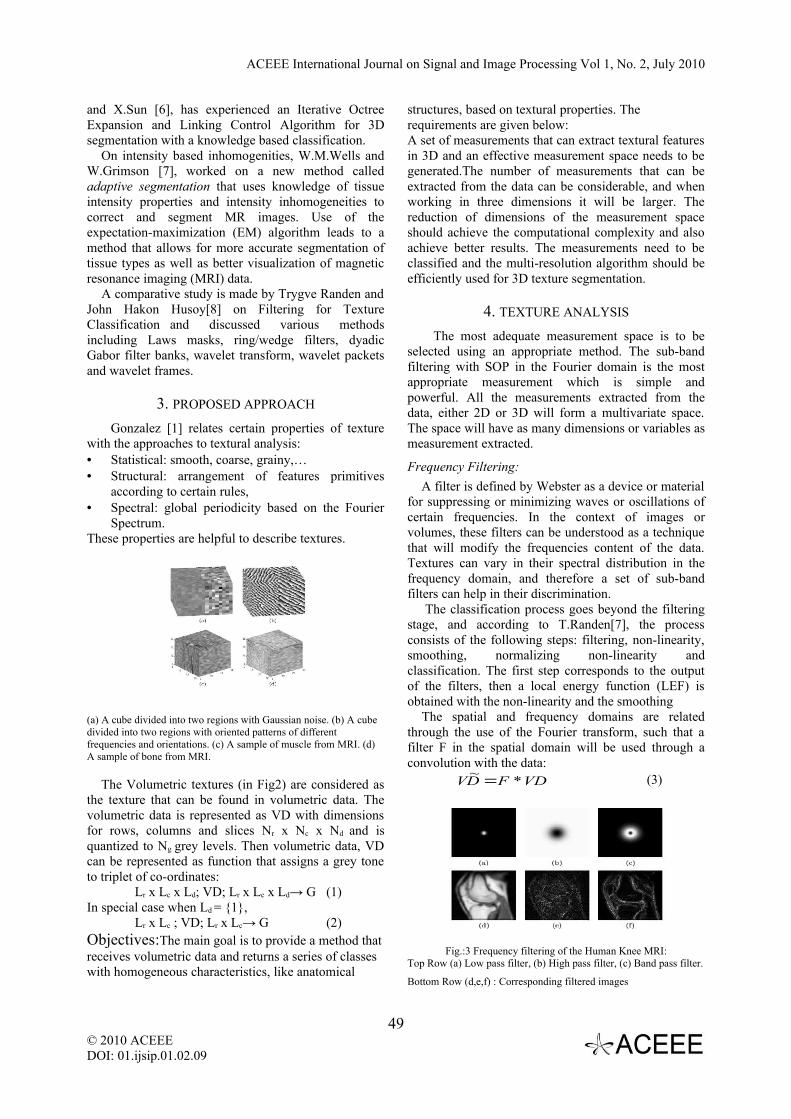
(a) A cube divided into two regions with Gaussian noise. (b) A cube divided into two regions with oriented patterns of different frequencies and orientations. (c) A sample of muscle from MRI. (d) A sample of bone from MRI.
The Volumetric textures (in Fig2) are considered as the texture that can be found in volumetric data. The volumetric data is represented as VD with dimensions for rows, columns and slices Nr x Nc x Nd and is quantized to Ng grey levels. Then volumetric data, VD can be represented as function that assigns a grey tone to triplet of co-ordinates:
Lr x Lc x Ld; VD; Lr x Lc x Ld→ G (1)In special case when Ld = {1},
Lr x Lc ; VD; Lr x Lc→ G (2)Objectives:The main goal is to provide a method that receives volumetric data and returns a series of classes with homogeneous characteristics, like anatomical
structures, based on textural properties. The requirements are given below:A set of measurements that can extract textural features in 3D and an effective measurement space needs to be generated.The number of measurements that can be extracted from the data can be considerable, and when working in three dimensions it will be larger. The reduction of dimensions of the measurement space should achieve the computational complexity and also achieve better results. The measurements need to be classified and the multi-resolution algorithm should be efficiently used for 3D texture segmentation.
4. TEXTURE ANALYSIS
The most adequate measurement space is to be selected using an appropriate method. The sub-band filtering with SOP in the Fourier domain is the most appropriate measurement which is simple and powerful. All the measurements extracted from the data, either 2D or 3D will form a multivariate space. The space will have as many dimensions or variables as measurement extracted.
Frequency Filtering:
A filter is defined by Webster as a device or material for suppressing or minimizing waves or oscillations of certain frequencies. In the context of images or volumes, these filters can be understood as a technique that will modify the frequencies content of the data. Textures can vary in their spectral distribution in the frequency domain, and therefore a set of sub-band filters can help in their discrimination. The classification process goes beyond the filtering stage, and according to T.Randen[7], the process consists of the following steps: filtering, non-linearity, smoothing, normalizing non-linearity and classification. The first step corresponds to the output of the filters, then a local energy function (LEF) is obtained with the non-linearity and the smoothing
The spatial and frequency domains are related through the use of the Fourier transform, such that a filter F in the spatial domain will be used through a convolution with the data:
VDFDV *~ = (3)
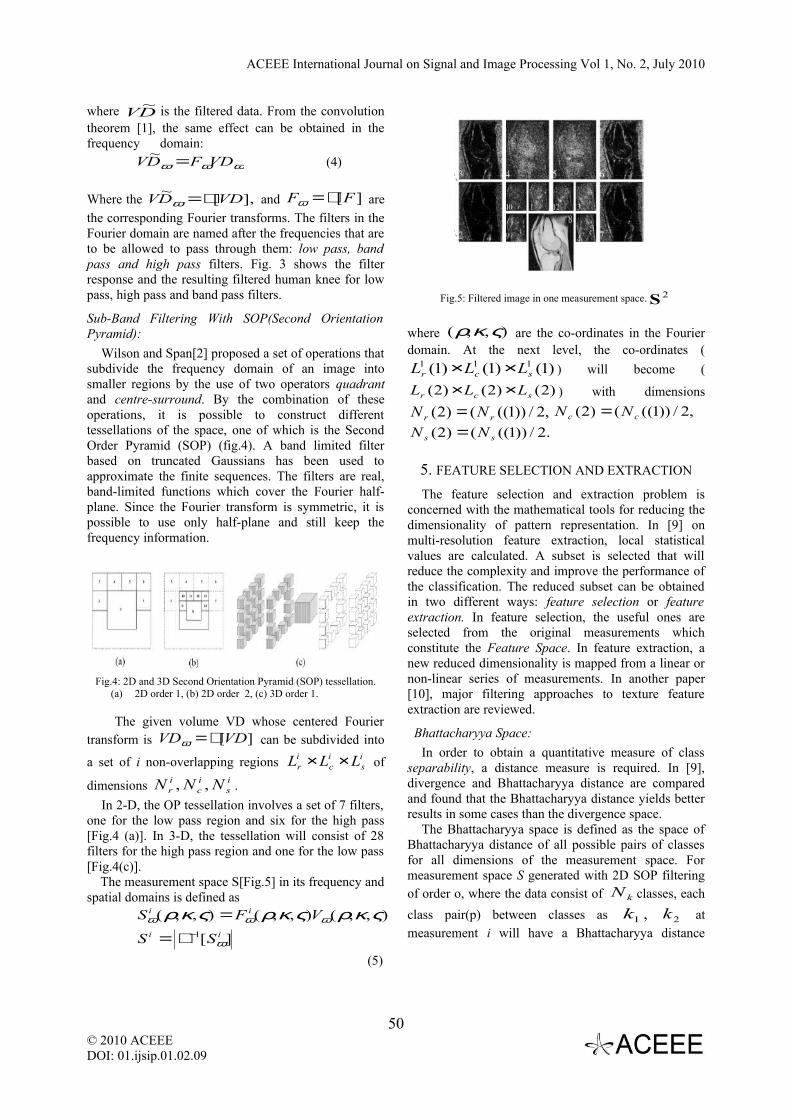
Fig.:3 Frequency filtering of the Human Knee MRI:Top Row (a) Low pass filter, (b) High pass filter, (c) Band pass filter.
Bottom Row (d,e,f) : Corresponding filtered images
49© 2010 ACEEE DOI: 01.ijsip.01.02.09
ACEEE International Journal on Signal and Image Processing Vol 1, No. 2, July 2010
where DV~ is the filtered data. From the convolution
theorem [1], the same effect can be obtained in the frequency domain:
ωωω VDFDV =~(4)
Where the ],[~
VDDV ℑ=ω and ][FF ℑ=ω are
the corresponding Fourier transforms. The filters in the Fourier domain are named after the frequencies that are to be allowed to pass through them: low pass, band pass and high pass filters. Fig. 3 shows the filter response and the resulting filtered human knee for low pass, high pass and band pass filters.
Sub-Band Filtering With SOP(Second Orientation Pyramid):
Wilson and Span[2] proposed a set of operations that subdivide the frequency domain of an image into smaller regions by the use of two operators quadrant and centre-surround. By the combination of these operations, it is possible to construct different tessellations of the space, one of which is the Second Order Pyramid (SOP) (fig.4). A band limited filter based on truncated Gaussians has been used to approximate the finite sequences. The filters are real, band-limited functions which cover the Fourier half-plane. Since the Fourier transform is symmetric, it is possible to use only half-plane and still keep the frequency information.
Fig.4: 2D and 3D Second Orientation Pyramid (SOP) tessellation.
(a) 2D order 1, (b) 2D order 2, (c) 3D order 1.
The given volume VD whose centered Fourier transform is ][VDVD ℑ=ω can be subdivided into
a set of i non-overlapping regions is
ic
ir LLL ×× of
dimensions is
ic
ir NNN ,, .
In 2-D, the OP tessellation involves a set of 7 filters, one for the low pass region and six for the high pass [Fig.4 (a)]. In 3-D, the tessellation will consist of 28 filters for the high pass region and one for the low pass [Fig.4(c)]. The measurement space S[Fig.5] in its frequency and spatial domains is defined as
][
),,(),,(),,(1 ii
ii
SS
VFS
ω
ωωω ςκρςκρςκρ−ℑ=
=
(5)
Fig.5: Filtered image in one measurement space. 2S
where ),,( ςκρ are the co-ordinates in the Fourier domain. At the next level, the co-ordinates (
)1()1()1( 111scr LLL ×× ) will become (
)2()2()2( scr LLL ×× ) with dimensions
,2/))1((()2( rr NN = ,2/))1((()2( cc NN =.2/))1((()2( ss NN =
5. FEATURE SELECTION AND EXTRACTION
The feature selection and extraction problem is concerned with the mathematical tools for reducing the dimensionality of pattern representation. In [9] on multi-resolution feature extraction, local statistical values are calculated. A subset is selected that will reduce the complexity and improve the performance of the classification. The reduced subset can be obtained in two different ways: feature selection or feature extraction. In feature selection, the useful ones are selected from the original measurements which constitute the Feature Space. In feature extraction, a new reduced dimensionality is mapped from a linear or non-linear series of measurements. In another paper [10], major filtering approaches to texture feature extraction are reviewed.
Bhattacharyya Space:
In order to obtain a quantitative measure of class separability, a distance measure is required. In [9], divergence and Bhattacharyya distance are compared and found that the Bhattacharyya distance yields better results in some cases than the divergence space.
The Bhattacharyya space is defined as the space of Bhattacharyya distance of all possible pairs of classes for all dimensions of the measurement space. For measurement space S generated with 2D SOP filtering of order o, where the data consist of kN classes, each
class pair(p) between classes as 1k , 2k at measurement i will have a Bhattacharyya distance
50© 2010 ACEEE DOI: 01.ijsip.01.02.09
ACEEE International Journal on Signal and Image Processing Vol 1, No. 2, July 2010
),(21
ik
ikB SSD , and will produce a Bhattacharyya
spaceofdimensions
=
2k
p
NN . (6)
Multiresolution Classification
A Multi-resolution algorithm is presented to improve the results of classification of textured data. As Hanan Samet[10] discussed a class of hierarchical data-structures whose common property is that they are based on the principle of recursive decomposition of space- Quad Trees. Many multi-resolution access methods are discussed to search in a database [11]. The clustering method for image segmentation has been discussed earlier by B.Colmer in [12]. This is implemented as a method of data reduction by the combination of neighboring elements to form a parent element. The height of the tree is important and it is selected through (i) through the variances of some measurements and (ii) with the use of classifier.
At the highest level, the new reduced space can be classified. Partitioning of the measurement space can be considered. This partitioning should minimize the Euclidean distance from the elements of the space. Once the measurement space is calculated for every training image, the average can be used as an estimate of the mean of the class.
6.RESULTS
In this paper, several MRI knee images and 3D artificial images are used. The MRI knee images are 2D image which is used to provide the feature extraction using SOP. The 3D artificial texture is a volumetric test data with one measurement of the two bivariate Gaussian distributions with similar means and variances. The multi-resolution volumetric segmentation algorithm is tested with MRI knee image.
The experiments are tested over several MRI knee images and 3D artificial data. The sample inputs and outputs are provided as snap shots. The sets of MRI knee images obtained for the experiments had dimensions of 512 x 512 JPEG images and 256 x 256 BMP images. When 256 x 256 BMP images are used for SOP filtering, it is resized to 1024 x 1024 in dimension to get a better result. The sample input images are provided in Figures 6 and Figure 7.
Figure 6. A sample input of MRI knee image (256 x 256 pixel value)
Figure 7 A Sample input of MRI Knee image (512 x 512 pixel value)
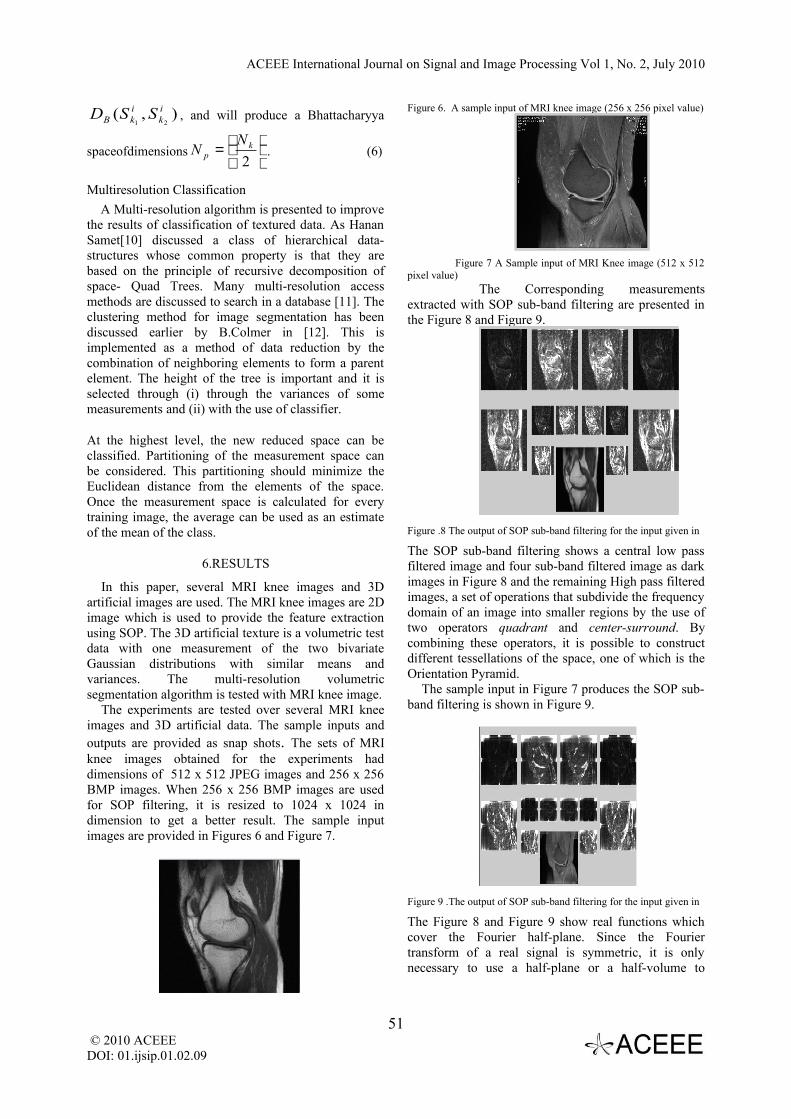
The Corresponding measurements extracted with SOP sub-band filtering are presented in the Figure 8 and Figure 9.
Figure .8 The output of SOP sub-band filtering for the input given in
The SOP sub-band filtering shows a central low pass filtered image and four sub-band filtered image as dark images in Figure 8 and the remaining High pass filtered images, a set of operations that subdivide the frequency domain of an image into smaller regions by the use of two operators quadrant and center-surround. By combining these operators, it is possible to construct different tessellations of the space, one of which is the Orientation Pyramid.
The sample input in Figure 7 produces the SOP sub-band filtering is shown in Figure 9.
Figure 9 .The output of SOP sub-band filtering for the input given in
The Figure 8 and Figure 9 show real functions which cover the Fourier half-plane. Since the Fourier transform of a real signal is symmetric, it is only necessary to use a half-plane or a half-volume to
51 © 2010 ACEEE DOI: 01.ijsip.01.02.09
ACEEE International Journal on Signal and Image Processing Vol 1, No. 2, July 2010
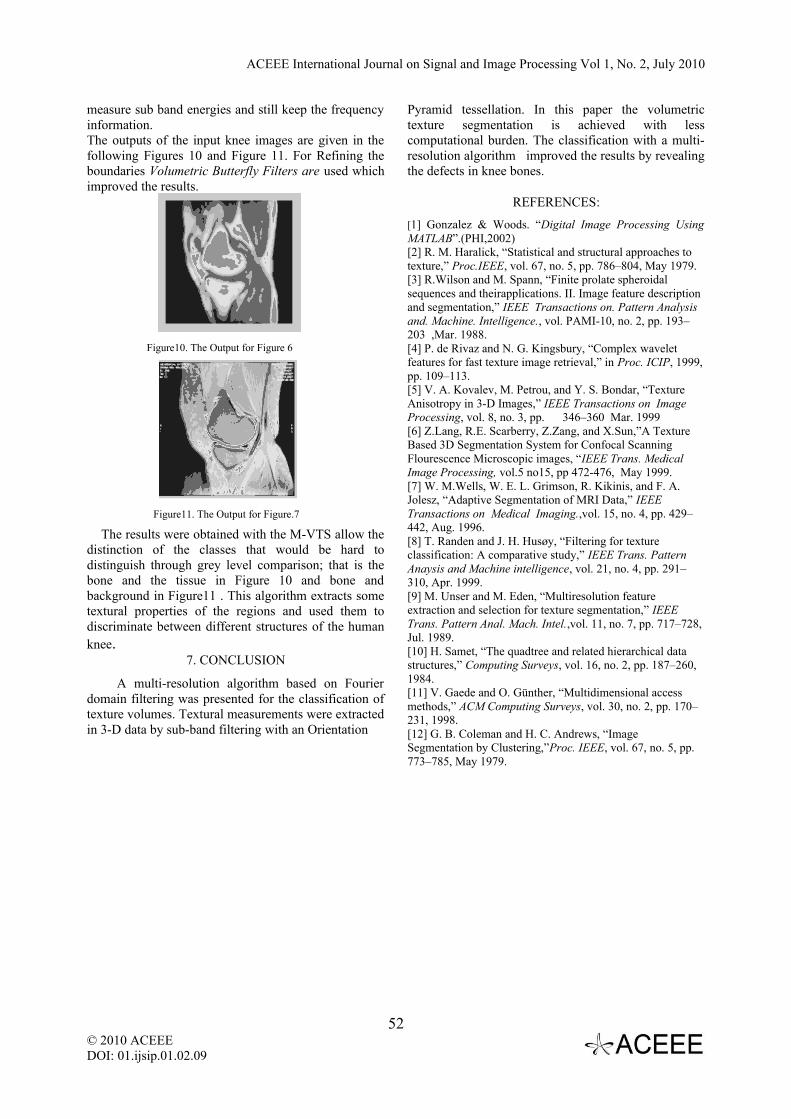
measure sub band energies and still keep the frequency information. The outputs of the input knee images are given in the following Figures 10 and Figure 11. For Refining the boundaries Volumetric Butterfly Filters are used which improved the results.
Figure10. The Output for Figure 6
Figure11. The Output for Figure.7
The results were obtained with the M-VTS allow the distinction of the classes that would be hard to distinguish through grey level comparison; that is the bone and the tissue in Figure 10 and bone and background in Figure11 . This algorithm extracts some textural properties of the regions and used them to discriminate between different structures of the human knee.
7. CONCLUSION
A multi-resolution algorithm based on Fourier domain filtering was presented for the classification of texture volumes. Textural measurements were extracted in 3-D data by sub-band filtering with an Orientation
Pyramid tessellation. In this paper the volumetric texture segmentation is achieved with less computational burden. The classification with a multi-resolution algorithm improved the results by revealing the defects in knee bones.
REFERENCES:
[1] Gonzalez & Woods. “Digital Image Processing Using MATLAB”.(PHI,2002)[2] R. M. Haralick, “Statistical and structural approaches to texture,” Proc.IEEE, vol. 67, no. 5, pp. 786–804, May 1979.[3] R.Wilson and M. Spann, “Finite prolate spheroidal sequences and theirapplications. II. Image feature description and segmentation,” IEEE Transactions on. Pattern Analysis and. Machine. Intelligence., vol. PAMI-10, no. 2, pp. 193–203 ,Mar. 1988.[4] P. de Rivaz and N. G. Kingsbury, “Complex wavelet features for fast texture image retrieval,” in Proc. ICIP, 1999, pp. 109–113.[5] V. A. Kovalev, M. Petrou, and Y. S. Bondar, “Texture Anisotropy in 3-D Images,” IEEE Transactions on Image Processing, vol. 8, no. 3, pp. 346–360 Mar. 1999[6] Z.Lang, R.E. Scarberry, Z.Zang, and X.Sun,”A Texture Based 3D Segmentation System for Confocal Scanning Flourescence Microscopic images, “IEEE Trans. Medical Image Processing, vol.5 no15, pp 472-476, May 1999.[7] W. M.Wells, W. E. L. Grimson, R. Kikinis, and F. A. Jolesz, “Adaptive Segmentation of MRI Data,” IEEE Transactions on Medical Imaging.,vol. 15, no. 4, pp. 429–442, Aug. 1996.[8] T. Randen and J. H. Husøy, “Filtering for texture classification: A comparative study,” IEEE Trans. Pattern Anaysis and Machine intelligence, vol. 21, no. 4, pp. 291–310, Apr. 1999.[9] M. Unser and M. Eden, “Multiresolution feature extraction and selection for texture segmentation,” IEEE Trans. Pattern Anal. Mach. Intel.,vol. 11, no. 7, pp. 717–728, Jul. 1989.[10] H. Samet, “The quadtree and related hierarchical data structures,” Computing Surveys, vol. 16, no. 2, pp. 187–260, 1984.[11] V. Gaede and O. Günther, “Multidimensional access methods,” ACM Computing Surveys, vol. 30, no. 2, pp. 170–231, 1998.[12] G. B. Coleman and H. C. Andrews, “Image Segmentation by Clustering,”Proc. IEEE, vol. 67, no. 5, pp. 773–785, May 1979.
52© 2010 ACEEE DOI: 01.ijsip.01.02.09
Recommended


![Effect of the sintering technique on the ferroelectric and ...The sinter-forging technique in ceramic materials induces a crystallographic texture with a preferred orientation [12]](https://img.dokumen.tips/doc/110x75/61219e592f84f469642ef27f/effect-of-the-sintering-technique-on-the-ferroelectric-and-the-sinter-forging.jpg)