Technical Working Group #3:
Demand Curve Shape Analysis
May 04, 2018
Intent
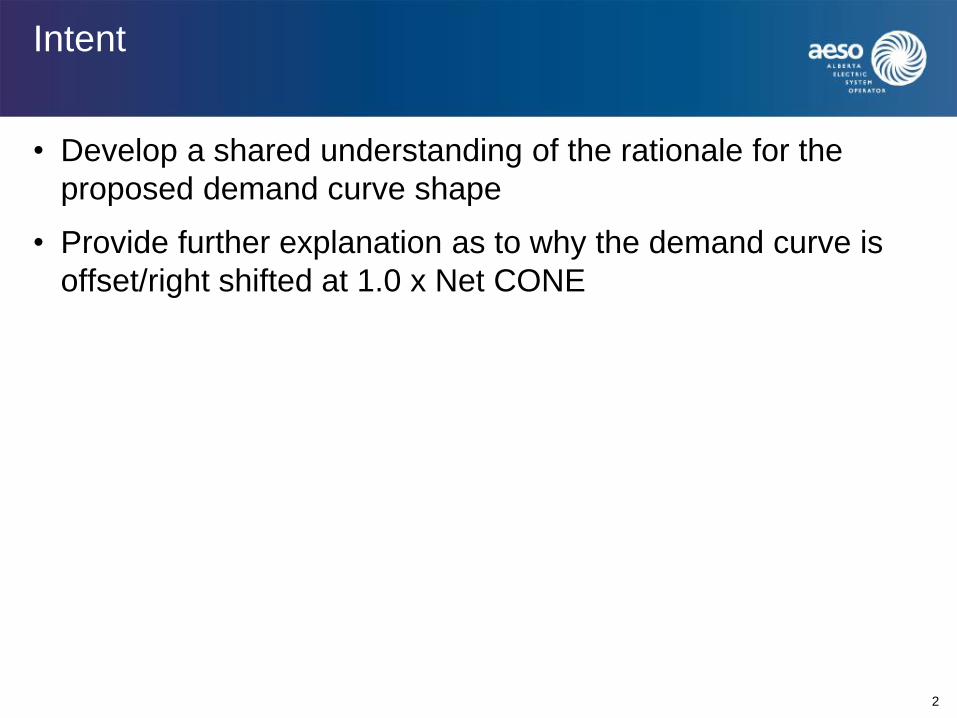
• Develop a shared understanding of the rationale for the
proposed demand curve shape
• Provide further explanation as to why the demand curve is
offset/right shifted at 1.0 x Net CONE
2
Outline
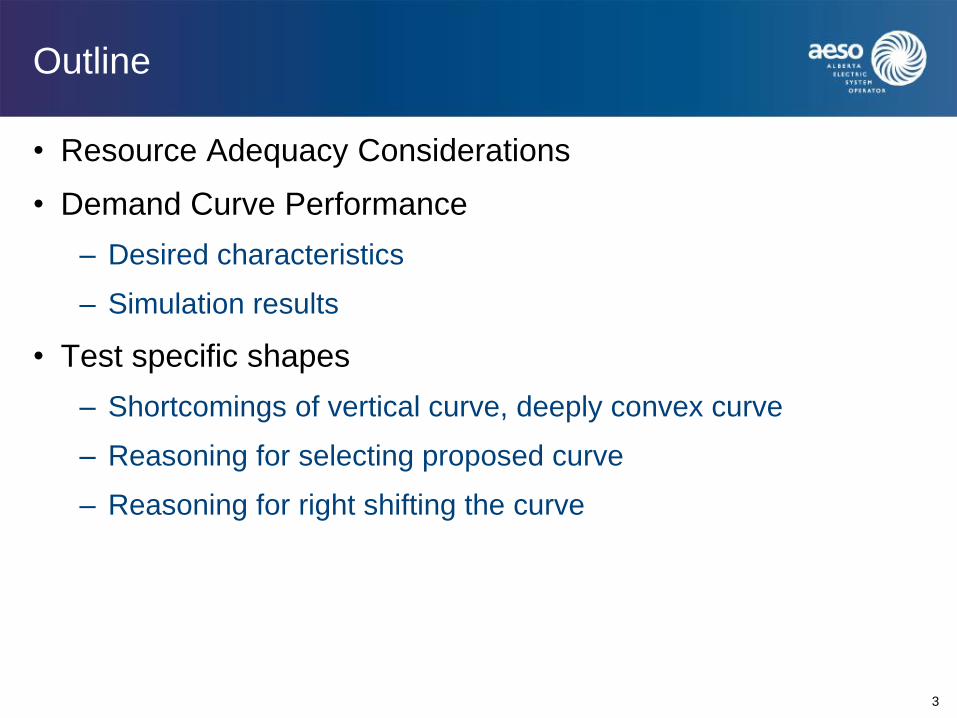
• Resource Adequacy Considerations
• Demand Curve Performance
– Desired characteristics
– Simulation results
• Test specific shapes
– Shortcomings of vertical curve, deeply convex curve
– Reasoning for selecting proposed curve
– Reasoning for right shifting the curve
3
4
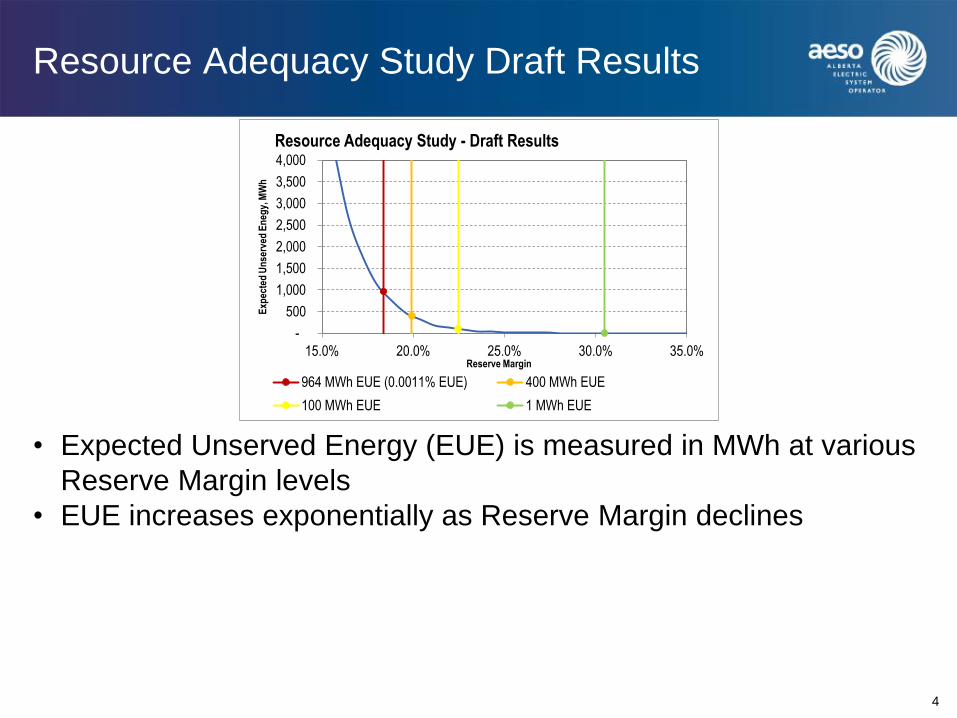
Resource Adequacy Study Draft Results
• Expected Unserved Energy (EUE) is measured in MWh at various
Reserve Margin levels
• EUE increases exponentially as Reserve Margin declines
-
500
1,000
1,500
2,000
2,500
3,000
3,500
4,000
15.0% 20.0% 25.0% 30.0% 35.0%
Exp
ecte
d U
nse
rved
En
egy,
MW
h
Reserve Margin
Resource Adequacy Study - Draft Results
964 MWh EUE (0.0011% EUE) 400 MWh EUE
100 MWh EUE 1 MWh EUE
5
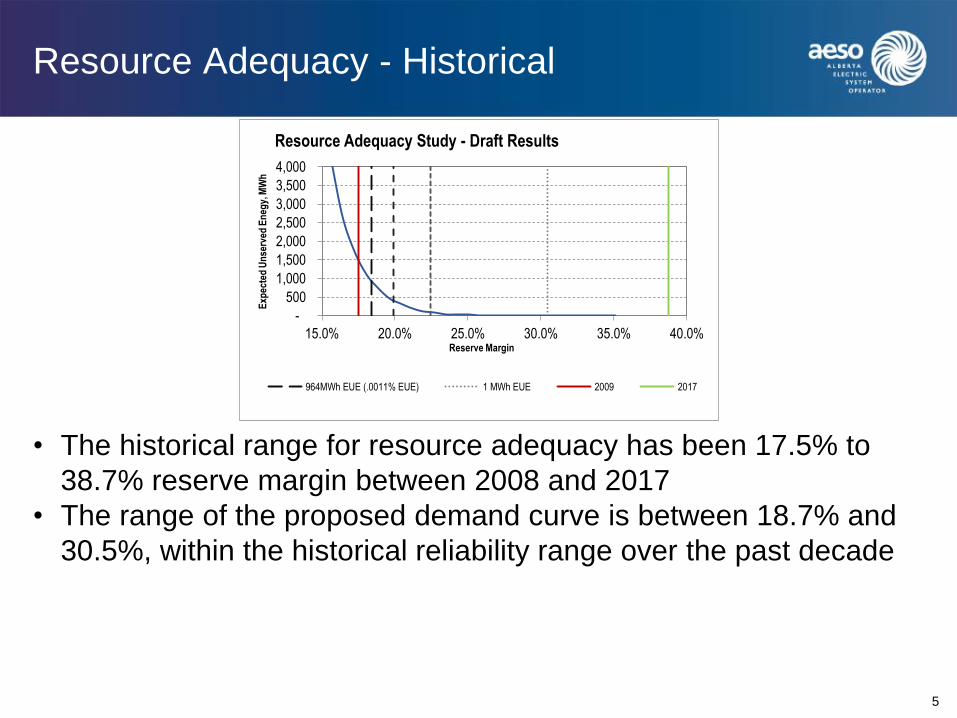
Resource Adequacy - Historical
• The historical range for resource adequacy has been 17.5% to
38.7% reserve margin between 2008 and 2017
• The range of the proposed demand curve is between 18.7% and
30.5%, within the historical reliability range over the past decade
-
500
1,000
1,500
2,000
2,500
3,000
3,500
4,000
15.0% 20.0% 25.0% 30.0% 35.0% 40.0%
Exp
ecte
d U
nse
rved
En
egy,
MW
h
Reserve Margin
Resource Adequacy Study - Draft Results
964MWh EUE (.0011% EUE) 1 MWh EUE 2009 2017
6
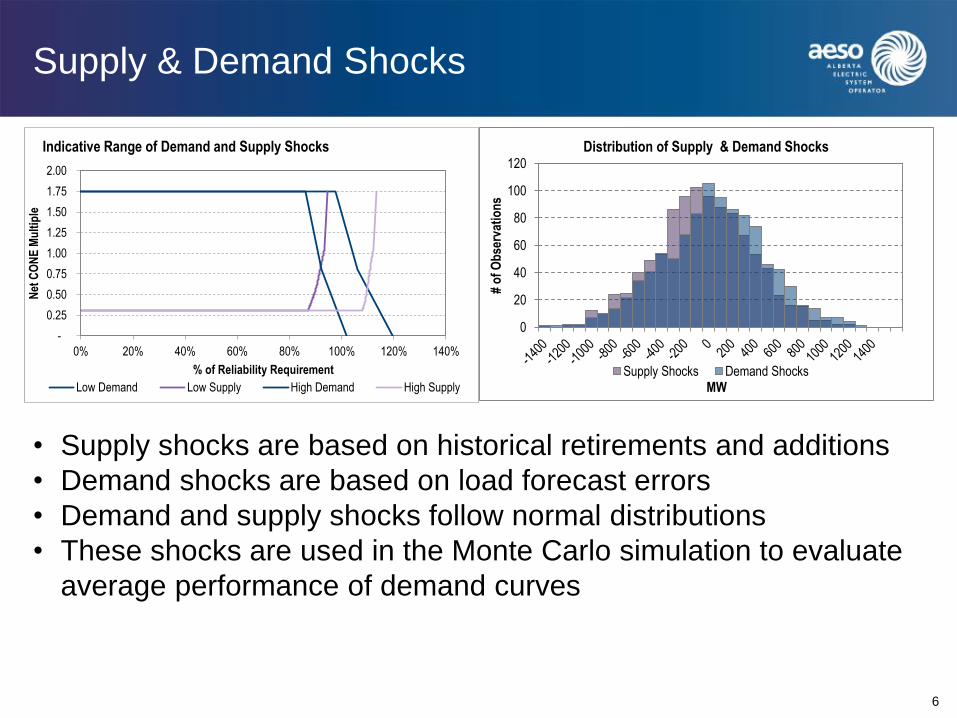
Supply & Demand Shocks
• Supply shocks are based on historical retirements and additions
• Demand shocks are based on load forecast errors
• Demand and supply shocks follow normal distributions
• These shocks are used in the Monte Carlo simulation to evaluate
average performance of demand curves
-
0.25
0.50
0.75
1.00
1.25
1.50
1.75
2.00
0% 20% 40% 60% 80% 100% 120% 140%
Net
CO
NE
Mu
ltip
le
% of Reliability Requirement
Indicative Range of Demand and Supply Shocks
Low Demand Low Supply High Demand High Supply
0
20
40
60
80
100
120
# o
f O
bse
rvat
ion
s
MW
Distribution of Supply & Demand Shocks
Supply Shocks Demand Shocks
-
500
1,000
1,500
2,000
2,500
3,000
3,500
4,000
15.0% 20.0% 25.0% 30.0% 35.0% 40.0%
Exp
ecte
d U
nse
rved
En
egy,
MW
h
Reserve Margin
Resource Adequacy Study and Distribution of Shocks
Distribution of Shocks Resource Adequacy Curve
964MWh EUE (.0011% EUE) 400 MWh EUE
1 MWh EUE
7
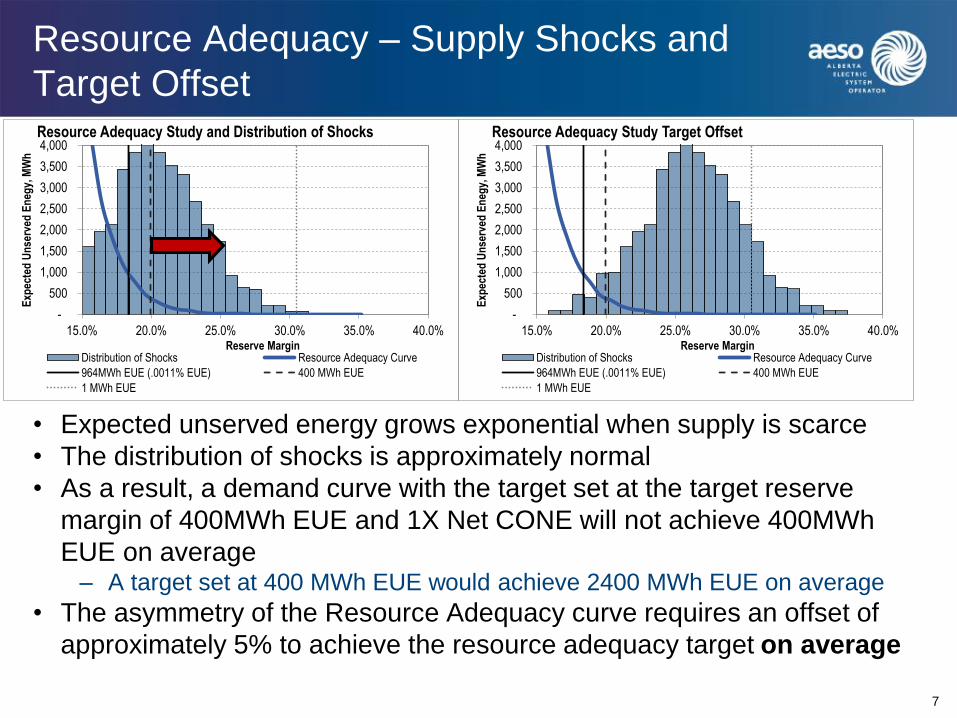
Resource Adequacy – Supply Shocks and
Target Offset
• Expected unserved energy grows exponential when supply is scarce
• The distribution of shocks is approximately normal
• As a result, a demand curve with the target set at the target reserve
margin of 400MWh EUE and 1X Net CONE will not achieve 400MWh
EUE on average– A target set at 400 MWh EUE would achieve 2400 MWh EUE on average
• The asymmetry of the Resource Adequacy curve requires an offset of
approximately 5% to achieve the resource adequacy target on average
-
500
1,000
1,500
2,000
2,500
3,000
3,500
4,000
15.0% 20.0% 25.0% 30.0% 35.0% 40.0%
Exp
ecte
d U
nse
rved
En
egy,
MW
h
Reserve Margin
Resource Adequacy Study Target Offset
Distribution of Shocks Resource Adequacy Curve
964MWh EUE (.0011% EUE) 400 MWh EUE
1 MWh EUE
8
Resource Adequacy Target
• The Government has provided a minimum reliability standard of 0.0011%
unserved energy– This equates to a minimum of approximately 964MWh EUE in the reference
year
• A target level has not yet been defined, but a range of 100MWh EUE to
400 MWh EUE has been tested

Select Demand Curve Evaluations
10
Demand Curve Performance
• In line with the Demand Curve Principles developed in SAM 3.0, a
demand curve can be considered to perform well if it:
Can accommodate shocks in supply and demand
Performs consistently to a reliability target, and typically above
the minimum reliability standard
Accommodates a wide range of possible outcomes, with
changes in supply, allowing for a well functioning and
competitive market
Minimizes the scope of market power exercise
Provides adequate revenue to incent entry and exit when
required i.e. leads to the ‘right’ level of capacity
Demand Curve Evaluation
• Market Conditions are simulated using a Monte Carlo
simulation model
– Model solves to an average price of net cone
– Tests the impacts of supply/demand shocks on price and
reliability outcomes under various demand curves
• Key ‘characteristics’ are evaluated to assess if the curve is
meeting the performance requirements
– Price Volatility
– Cleared capacity
– Average reliability, and frequency
11
12
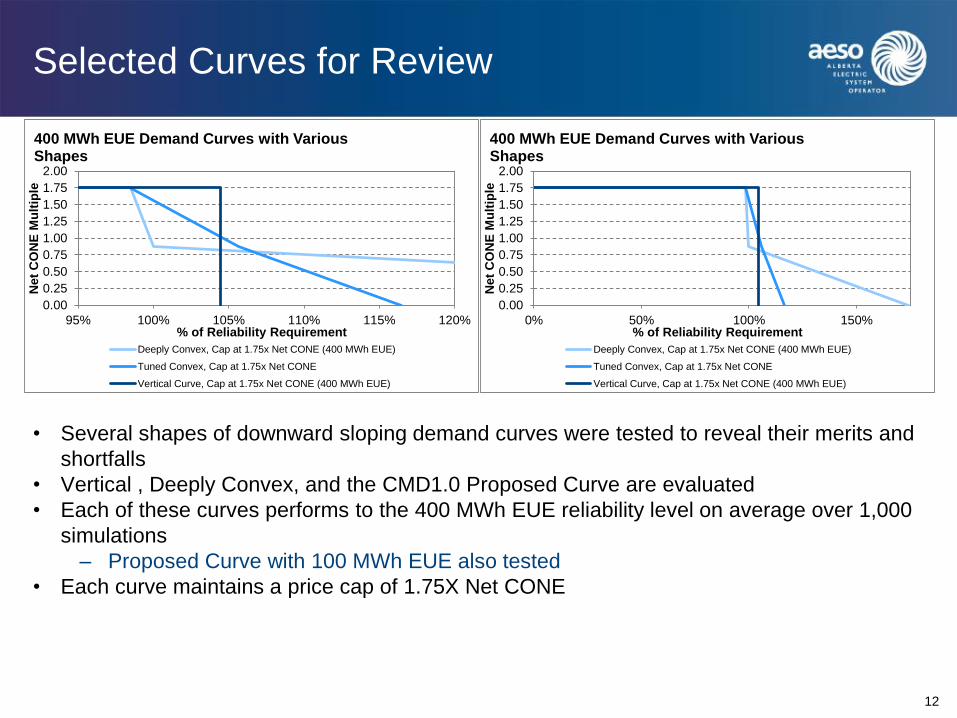
Selected Curves for Review
• Several shapes of downward sloping demand curves were tested to reveal their merits and
shortfalls
• Vertical , Deeply Convex, and the CMD1.0 Proposed Curve are evaluated
• Each of these curves performs to the 400 MWh EUE reliability level on average over 1,000
simulations
– Proposed Curve with 100 MWh EUE also tested
• Each curve maintains a price cap of 1.75X Net CONE
0.00
0.25
0.50
0.75
1.00
1.25
1.50
1.75
2.00
95% 100% 105% 110% 115% 120%
Net
CO
NE
Mu
ltip
le
% of Reliability Requirement
400 MWh EUE Demand Curves with Various Shapes
Deeply Convex, Cap at 1.75x Net CONE (400 MWh EUE)
Tuned Convex, Cap at 1.75x Net CONE
Vertical Curve, Cap at 1.75x Net CONE (400 MWh EUE)
0.00
0.25
0.50
0.75
1.00
1.25
1.50
1.75
2.00
0% 50% 100% 150%
Net
CO
NE
Mu
ltip
le
% of Reliability Requirement
400 MWh EUE Demand Curves with Various Shapes
Deeply Convex, Cap at 1.75x Net CONE (400 MWh EUE)
Tuned Convex, Cap at 1.75x Net CONE
Vertical Curve, Cap at 1.75x Net CONE (400 MWh EUE)
13
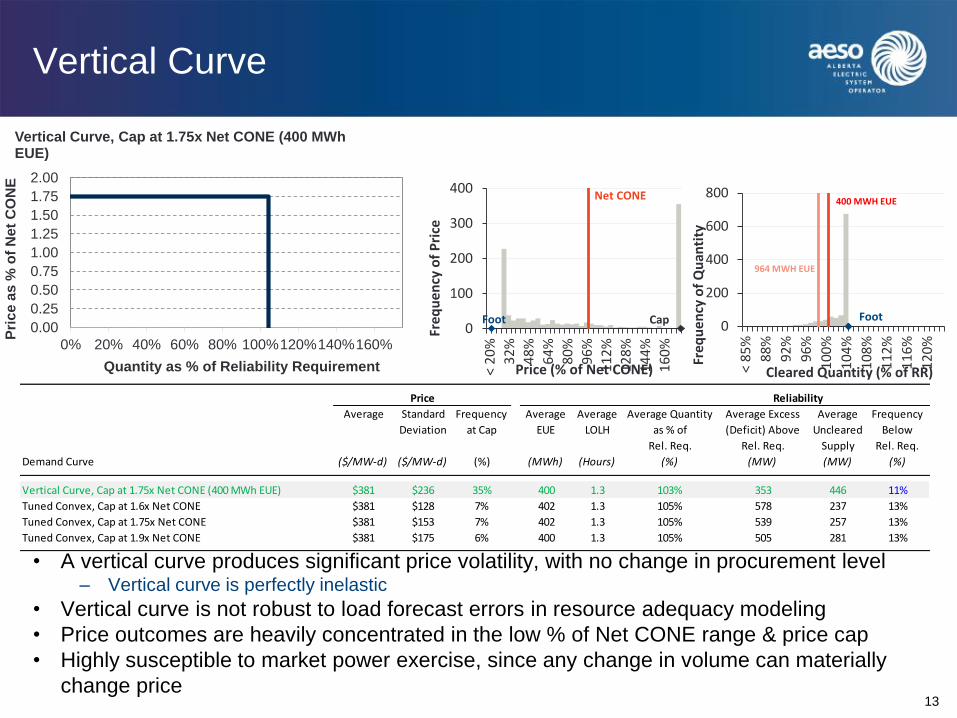
Vertical Curve
• A vertical curve produces significant price volatility, with no change in procurement level– Vertical curve is perfectly inelastic
• Vertical curve is not robust to load forecast errors in resource adequacy modeling
• Price outcomes are heavily concentrated in the low % of Net CONE range & price cap
• Highly susceptible to market power exercise, since any change in volume can materially
change price
0.00
0.25
0.50
0.75
1.00
1.25
1.50
1.75
2.00
0% 20% 40% 60% 80% 100%120%140%160%
Pri
ce
as
% o
f N
et
CO
NE
Quantity as % of Reliability Requirement
Vertical Curve, Cap at 1.75x Net CONE (400 MWh EUE)
0
100
200
300
400
< 2
0%
32
%
48
%
64
%
80
%
96
%
11
2%
12
8%
14
4%
16
0%
Freq
uen
cy o
f P
rice
Price (% of Net CONE)
Foot Cap
Net CONE
Price Reliability
Average Standard
Deviation
Frequency
at Cap
Average
EUE
Average
LOLH
Average Quantity
as % of
Rel. Req.
Average Excess
(Deficit) Above
Rel. Req.
Average
Uncleared
Supply
Frequency
Below
Rel. Req.
Demand Curve ($/MW-d) ($/MW-d) (%) (MWh) (Hours) (%) (MW) (MW) (%)
Vertical Curve, Cap at 1.75x Net CONE (400 MWh EUE) $381 $236 35% 400 1.3 103% 353 446 11%
Tuned Convex, Cap at 1.6x Net CONE $381 $128 7% 402 1.3 105% 578 237 13%
Tuned Convex, Cap at 1.75x Net CONE $381 $153 7% 402 1.3 105% 539 257 13%
Tuned Convex, Cap at 1.9x Net CONE $381 $175 6% 400 1.3 105% 505 281 13%
0
200
400
600
800
< 8
5%
88
%
92
%
96
%
10
0%
10
4%
10
8%
11
2%
11
6%
12
0%
Freq
uen
cy o
f Q
uan
tity
Cleared Quantity (% of RR)
Foot
964 MWH EUE
400 MWH EUE
14
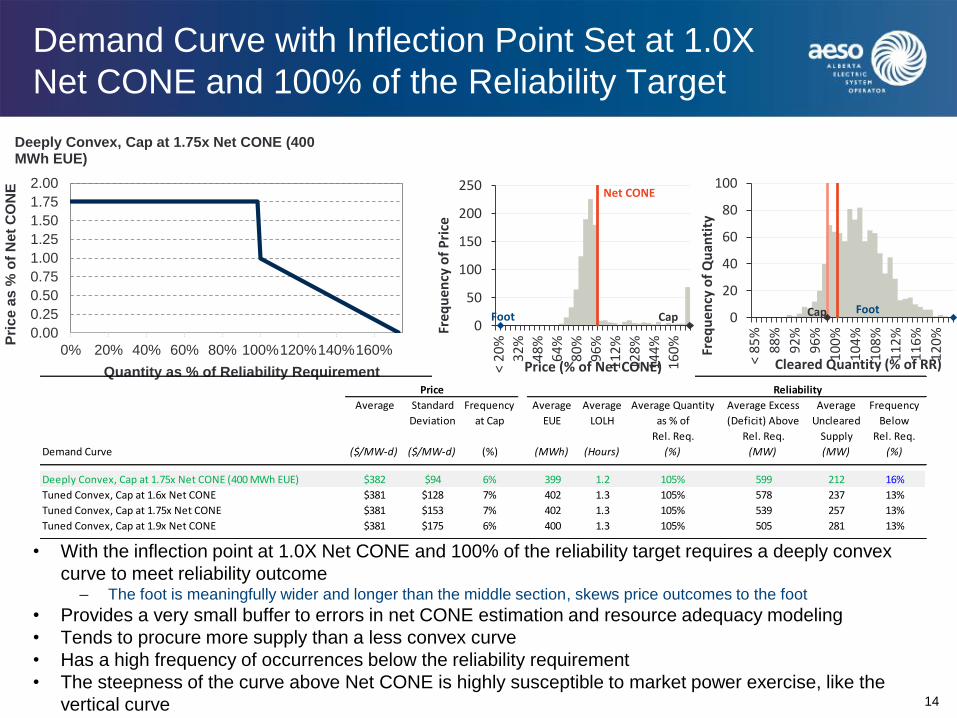
Demand Curve with Inflection Point Set at 1.0X
Net CONE and 100% of the Reliability Target
• With the inflection point at 1.0X Net CONE and 100% of the reliability target requires a deeply convex
curve to meet reliability outcome– The foot is meaningfully wider and longer than the middle section, skews price outcomes to the foot
• Provides a very small buffer to errors in net CONE estimation and resource adequacy modeling
• Tends to procure more supply than a less convex curve
• Has a high frequency of occurrences below the reliability requirement
• The steepness of the curve above Net CONE is highly susceptible to market power exercise, like the
vertical curve
0
20
40
60
80
100
< 8
5%
88
%
92
%
96
%
10
0%
10
4%
10
8%
11
2%
11
6%
12
0%
Freq
uen
cy o
f Q
uan
tity
Cleared Quantity (% of RR)
FootCap
0.00
0.25
0.50
0.75
1.00
1.25
1.50
1.75
2.00
0% 20% 40% 60% 80% 100%120%140%160%
Pri
ce
as
% o
f N
et
CO
NE
Quantity as % of Reliability Requirement
Deeply Convex, Cap at 1.75x Net CONE (400 MWh EUE)
Price Reliability
Average Standard
Deviation
Frequency
at Cap
Average
EUE
Average
LOLH
Average Quantity
as % of
Rel. Req.
Average Excess
(Deficit) Above
Rel. Req.
Average
Uncleared
Supply
Frequency
Below
Rel. Req.
Demand Curve ($/MW-d) ($/MW-d) (%) (MWh) (Hours) (%) (MW) (MW) (%)
Deeply Convex, Cap at 1.75x Net CONE (400 MWh EUE) $382 $94 6% 399 1.2 105% 599 212 16%
Tuned Convex, Cap at 1.6x Net CONE $381 $128 7% 402 1.3 105% 578 237 13%
Tuned Convex, Cap at 1.75x Net CONE $381 $153 7% 402 1.3 105% 539 257 13%
Tuned Convex, Cap at 1.9x Net CONE $381 $175 6% 400 1.3 105% 505 281 13%
0
50
100
150
200
250
< 2
0%
32
%
48
%
64
%
80
%
96
%
11
2%
12
8%
14
4%
16
0%
Freq
uen
cy o
f P
rice
Price (% of Net CONE)
Foot Cap
Net CONE
15
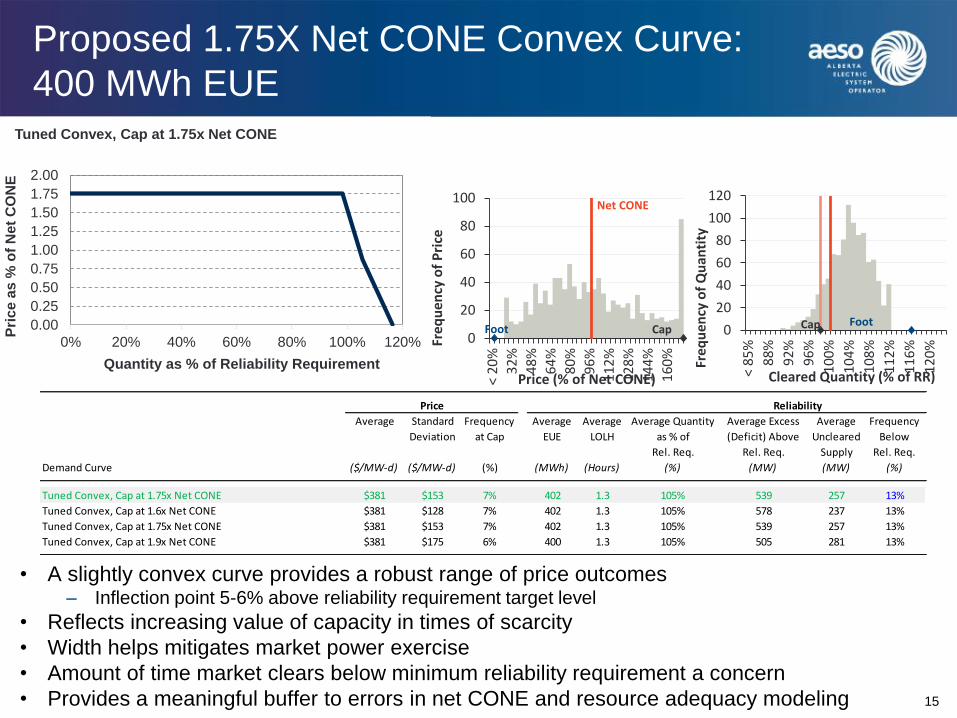
Proposed 1.75X Net CONE Convex Curve:
400 MWh EUE
• A slightly convex curve provides a robust range of price outcomes– Inflection point 5-6% above reliability requirement target level
• Reflects increasing value of capacity in times of scarcity
• Width helps mitigates market power exercise
• Amount of time market clears below minimum reliability requirement a concern
• Provides a meaningful buffer to errors in net CONE and resource adequacy modeling
0.00
0.25
0.50
0.75
1.00
1.25
1.50
1.75
2.00
0% 20% 40% 60% 80% 100% 120%
Pri
ce
as
% o
f N
et
CO
NE
Quantity as % of Reliability Requirement
Tuned Convex, Cap at 1.75x Net CONE
0
20
40
60
80
100
120
< 8
5%
88
%
92
%
96
%
10
0%
10
4%
10
8%
11
2%
11
6%
12
0%
Freq
uen
cy o
f Q
uan
tity
Cleared Quantity (% of RR)
FootCap
Price Reliability
Average Standard
Deviation
Frequency
at Cap
Average
EUE
Average
LOLH
Average Quantity
as % of
Rel. Req.
Average Excess
(Deficit) Above
Rel. Req.
Average
Uncleared
Supply
Frequency
Below
Rel. Req.
Demand Curve ($/MW-d) ($/MW-d) (%) (MWh) (Hours) (%) (MW) (MW) (%)
Tuned Convex, Cap at 1.75x Net CONE $381 $153 7% 402 1.3 105% 539 257 13%
Tuned Convex, Cap at 1.6x Net CONE $381 $128 7% 402 1.3 105% 578 237 13%
Tuned Convex, Cap at 1.75x Net CONE $381 $153 7% 402 1.3 105% 539 257 13%
Tuned Convex, Cap at 1.9x Net CONE $381 $175 6% 400 1.3 105% 505 281 13%
0
20
40
60
80
100
< 2
0%
32
%
48
%
64
%
80
%
96
%
11
2%
12
8%
14
4%
16
0%
Freq
uen
cy o
f P
rice
Price (% of Net CONE)
Foot Cap
Net CONE
16
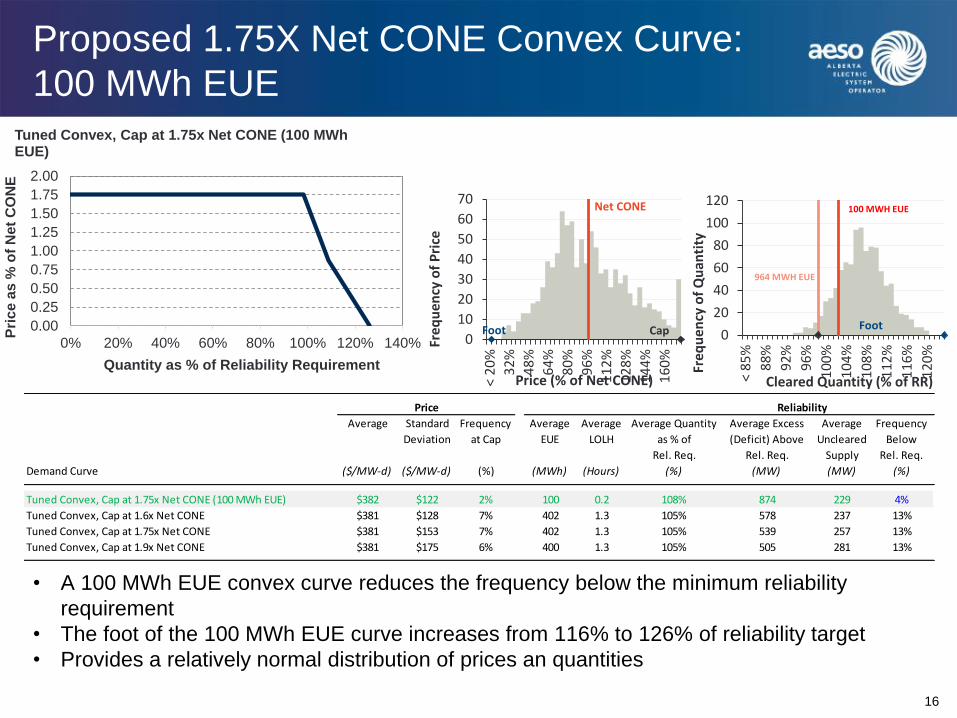
Proposed 1.75X Net CONE Convex Curve:
100 MWh EUE
• A 100 MWh EUE convex curve reduces the frequency below the minimum reliability
requirement
• The foot of the 100 MWh EUE curve increases from 116% to 126% of reliability target
• Provides a relatively normal distribution of prices an quantities
0.00
0.25
0.50
0.75
1.00
1.25
1.50
1.75
2.00
0% 20% 40% 60% 80% 100% 120% 140%
Pri
ce
as
% o
f N
et
CO
NE
Quantity as % of Reliability Requirement
Tuned Convex, Cap at 1.75x Net CONE (100 MWh EUE)
0
10
20
30
40
50
60
70
< 2
0%
32
%
48
%
64
%
80
%
96
%
11
2%
12
8%
14
4%
16
0%
Freq
uen
cy o
f P
rice
Price (% of Net CONE)
Foot Cap
Net CONE
Price Reliability
Average Standard
Deviation
Frequency
at Cap
Average
EUE
Average
LOLH
Average Quantity
as % of
Rel. Req.
Average Excess
(Deficit) Above
Rel. Req.
Average
Uncleared
Supply
Frequency
Below
Rel. Req.
Demand Curve ($/MW-d) ($/MW-d) (%) (MWh) (Hours) (%) (MW) (MW) (%)
Tuned Convex, Cap at 1.75x Net CONE (100 MWh EUE) $382 $122 2% 100 0.2 108% 874 229 4%
Tuned Convex, Cap at 1.6x Net CONE $381 $128 7% 402 1.3 105% 578 237 13%
Tuned Convex, Cap at 1.75x Net CONE $381 $153 7% 402 1.3 105% 539 257 13%
Tuned Convex, Cap at 1.9x Net CONE $381 $175 6% 400 1.3 105% 505 281 13%
0
20
40
60
80
100
120
< 8
5%
88
%
92
%
96
%
10
0%
10
4%
10
8%
11
2%
11
6%
12
0%
Freq
uen
cy o
f Q
uan
tity
Cleared Quantity (% of RR)
Foot
964 MWH EUE
100 MWH EUE
17
Conclusions
• A downward-sloping, convex, demand curve is preferred to vertical
curve
• Too much convexity can cause concentration of the price
outcomes below Net CONE
• Very steep curves enable market power exercise
• Stakeholder concerns regarding over procurement in CMD 1.0
proposed curve – Proposed curve clears below minimum resource adequacy standard
6.5% of iterations
• AESO continues to evaluate resource adequacy target and
demand curve shapes– Continued feedback welcomed
Recommended