Spontaneous Irony in Post-stroke Individuals
by
Diane Kathleen Pinch B. A., University of Victoria, 1980
M.Sc., University of British Columbia, 1982
A Dissertation Submitted in Partial Fulfillment o f the Requirements for the Degree of
DOCTOR OF PHILOSOPHY
in the Department o f Psychology
We accept this dissertation as conforming to the required standard
Dr. E. Strauss, Supervisor (Department of Psychology)
Bavelas, Departmental Member (Department of Psychology)
epartment o f Psychology)
Di^iJ/Esling, Outside Member (Department of Linguistics)
Dr. A Holland, External Examiner (Department o f Speech & Hearing Sciences, University o f Arizona)
© Diane Kathleen Pinch, 1995 University of Victoria
All rights reserved. This dissertation may not be reproduced in whole or in part, by photocopying or other means, without the permission of the author.

Supervisor; Dr. Esther Strauss
ABSTRACT
This study examines spontaneous irony in elicited conversations between dyads assigned
to three groups: left-hemisphere-damaged (LHD), right-hemisphere-damaged (RHD), and
non-hemisphere-damaged (NHD). The conversational partners in all three groups were
non-hemisphere-damaged. Subjects were also administered a battery o f
neuropsychological tests designed to assess functions hypothesized to underlie the
successful communication of irony and sarcasm (i.e., recognition of auditory patterns and
facial displays conveying emotions, speed of processing, and comprehension of nonliteral
language). Spontaneous irony involves a set o f utterances in conversation that is not
meant to be interpreted literally and can include such devices as irony, sarcasm, punning,
and hyperbole. The communication o f spontaneous irony in normal speakers is
accomplished through a quick, tight coordination of behavioural and/or prosodic features.
For a variety of reasons this coordination may break down when one of the speakers has
brain damage. This study found that the rate of production of irony was significantly less
in the two clinical groups as compared to the control group with no significant difference
between the LHD and RHD groups. There was no significant difference amongst the
groups in terms of success of communication; all three had a success rate o f approximately
90 per cent. Individual profiles were examined to determine whether any patterns
emerged in the test results, however, no pattern unique to the clinical subjects with the
lowest rates of irony emerged. When the conversations were examined in more detail, it
was found that the NHD partners in the clinical groups produced a significantly lower rate
o f irony than the NHD partners in the control group. The rate was also significantly lower
than the rate of irony of the clinical subjects. These results suggest that the NHD partners
U1
adjust their content when their partners have had brain damage. Part o f this adjustment
may be due to the accommodation, described in previous literature, that occurs in
interactions between disabled and nondisabled individuals. However, further exploration
suggests that in addition to this overall accommodation there may be an adjustment that is
dependent on whether the partner has had left or right hemisphere damage. Features
present in the LHD group were pauses and paraphasias leading to disruptions in
tumtaking. These were not present in the RHD group which consisted of fluent speakers
with no disruptions in tumtaking. However, a reduction in discourse-oriented facial
displays and prosodic features and a tendency toward tangential speech may act to change
the quality o f conversations in the RHD group. These aspects would have to be studied
objectively in a future study to determine whether they were upheld.
Examiners;
Dr. E. Strauss, Supervisor (Department o f Psychology)
Dr?'î;B^Bavelas, Departmental Member (DepartmenTof Psychology)
Dr. R. Graves, Departmental Member (Department of Psychology)
D i(^ Eslihg, Outside Member (D^artm ent of Linguistics)
Dr. A. Holland, External Examiner (Department of Speech & Hearing Sciences)
IV
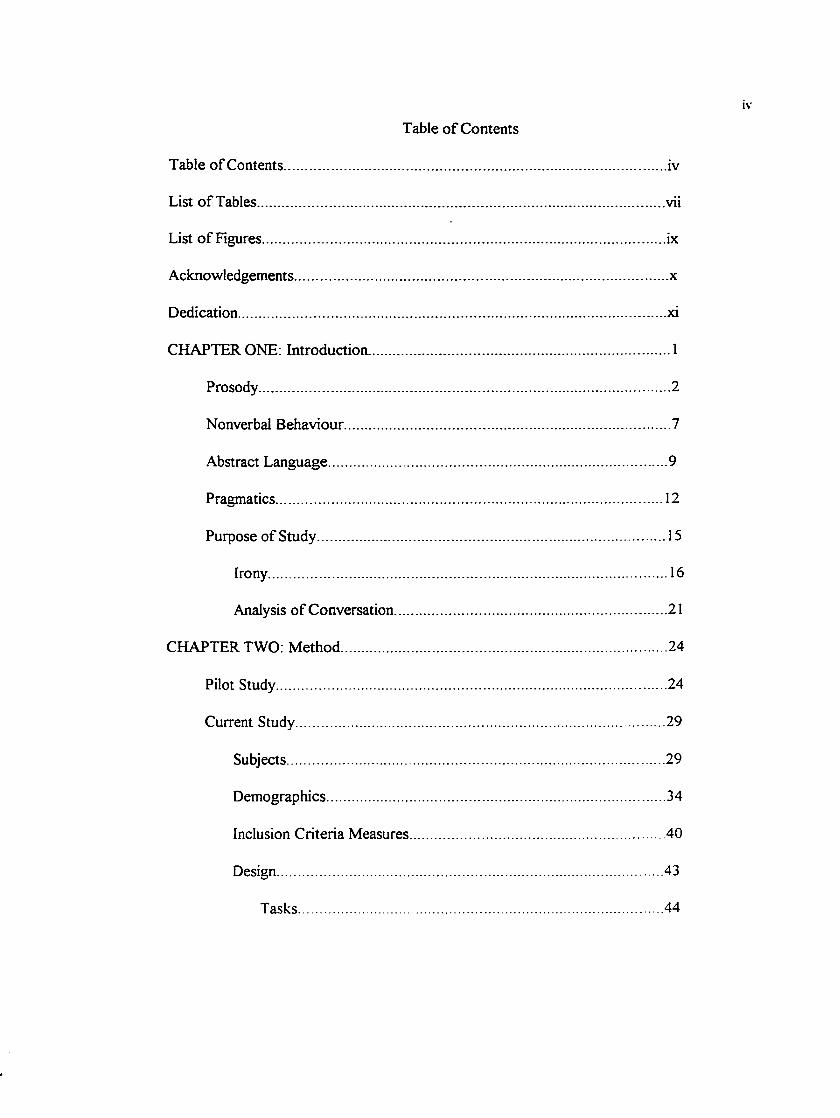
Table o f Contents
Table of Contents................................................................................................... iv
List o f Tables.......................................................................................................... vii
List o f Figures......................................................................................................... be
Acknowledgements..................................................................................................x
Dedication............................................................................................................... xi
CHAPTER ONE; Introduction.............................................................................. 1
Prosody...........................................................................................................2
Nonverbal Behaviour.................................................................................... 7
Abstract Language.........................................................................................9
Pragmatics..................................................................................................... 12
Purpose of Study............................................................................................15
Irony.........................................................................................................16
Analysis of Conversation...................................................................... 21
CHAPTER TWO: Method.................................................................................... 24
Pilot Study..................................................................................................... 24
Current Study................................................................................................ 29
Subjects...................................................................................................29
Demographics........................................................................................ 34
Inclusion Criteria Measures.................................................................. 40
Design..................................................................................................... 43
Tasks................................................................................................44
Neuropsychological Measures.....................................................46
Questionnaires....................................................................................... 49
Procedure............................................................................................... 50
Scoring of Videotapes........................................................................... 52
Reliability of Scoring............................................................................ 52
Statistical Analyses/Hypotheses.......................................................... 57
CHAPTER THREE; Results.................................................................................59
Description of Conversations......................................................................59
Group Differences....................................................................................... 60
Post Hoc Analyses...................................................................................... 72
Individual Differences.................................................................................73
Questionnaires.............................................................................................78
CHAPTER FOUR: Discussion............................................................................ 81
References............................................................................................................. 98
Appendix...............................................................................................................105
Information Provided in Poster Soliciting Subjects.................................106
Letter Sent to Potential Clinical Subjects.................................................107
Information and Consent Form................................................................. 108
Permission Form Specifying Videotape Usage........................................ 109
Questionnaires for Subjects and Family Members...................................110
Health Status Questionnaire...................................................................... 112
Instructions for Identifying Instances of Spontaneous Irony................. 113
\1
Procedure to Judge Success or Failure o f Spontaneous Irony..............122
Spontaneous Irony Scoring Form with Examples..................................126
Summary of Data from Conversations.................................................... 127
Rates for Conversational Tasks................................................................129
Number and Rate of Ironic Instances by Each Subject..........................131
Inclusion Criteria Results..........................................................................132
Neurological Test Results.........................................................................135
Test Measures Not Included in Statistical Analyses (RHLB)............... 138
Correlation Matrix o f Demographic and Test Scores for NHD, LHD,
& RHD Subjects....................................................................................... 141
Dyad Composition.....................................................................................142
vu
List o f Tables
Demographic Information...................................................... ..............................30
Education Level o f Groups.................................................................................34
Gender Composition of Groups......................................................................... 35
Gender Composition of Dyads........................................................................... 35
Age Composition o f Groups............................................................................... 36
Time Post-onset ofCVA.....................................................................................36
NHD Subjects; Gender Composition................................................................. 38
NHD Subjects: Age Composition.......................................................................38
NHD Subjects: Education Composition.............................................................39
NHD Subjects: Raven’s Coloured Progressive Matrices Scores.....................39
Inclusion Criteria Results o f Clinical Subjects................................................... 40
Summary of Group Results for Inclusion Criteria Measures........................... 41
Summary of Group Results for Conversational Measures............................... 59
Summary of Hierarchical Regression Analysis for Variables Hypothesized to
Contribute to Rate o f Irony Variance.................................................................67
Summary of Stepwise Regression Analysis for Variables Hypothesized to Contribute
to Rate of Irony Variance.................................................................................... 68
Summary of Hierarchical Regression Analysis for Variables Hypothesized to Contribute
to Percentage of Successfully Communicated Irony Variance.........................69
Analysis of Variance for Neuropsychological Measures...................................71
Total Number of Ironic Utterances for Each Partner in Dyads........................72
VllI
Test Results o f Clinical Subjects in Dyads with Lowest Rates o f Irony.......... 75
Test Results o f Subjects Showing a Similar Pattern of Deficits but with Rates of Irony in
Normal Range........................................................................................................76
Clinical Subjects with Highest Rates o f Irony.................................................... 78
Results o f Questionnaires.......................................................... :.......................... 79
Questionnaire Results for Clinical Subjects with Lowest Rates o f Irony........80
IX
List of Figures
Performance on the VERT; Total Scores.......................................................... 64
Performance on the VERT: Auditory Identification........................................... 64
Performance on the VERT: Visual Identification................................................65
Performance on the VERT: Auditory/Visual Identification............................... 65
Rate o f Spontaneous Irony....................................................................................74
Acknowledgements
I would like to thank the many people who helped me with this project. These
include my supervisor and the members o f ray committee, the Sara Spencer Foundation,
the Greater Victoria Hospital Society, the many volunteers who agreed to be subjects
(former patients o f the Greater Victoria Hospital Society, members of the Victoria Stroke
Club, Victoria Taoist Tai Chi Association, Weavers Guild, and International Training in
Communication, and others from the Victoria community), Shirley Pinch who helped
solicit volunteers, Darlene Pinch for the videotape transcription, and Trudy Johnson and
Hilary Dibben who helped with the reliability measures.
I would also like to thank Dr. Janet Bavelas for providing advice and helping to
maintain my motivation during the doldrums of the project, Linda Coates for her helpfiil
suggestions. Dr. Michael Hunter for sharing his knowledge of statistics, and Dr. Roger
Graves for his beneficial feedback.
XI
To my husband and best friend, Brian
and my parents,
Kathleen and Edward Sweeney
CHAPTER ONE
Introduction
From a psycholinguistic point of view, oral communication can be subdivided into
phonology/prosody, morphology/vocabulary, and syntax. In addition to these
components, there are also nonverbal behaviours, including facial displays and body
language, that accompany oral language and influence communication. A compilation of
data from research with patients with aphasia, hemispherectomy cases, sodium-amytal
tests with epileptic patients, commissurotomized subjects, and dichotic and tachistoscopic
studies with neurologically intact subjects as well as other types o f studies suggests that in
the majority of people, the left hemisphere is dominant for, or processes more efficiently,
speech and language, i.e., phonological distinctions, vocabulary, and syntax (examples of
reviews: Critchley, 1991, Springer and Deutsch, 1989). On the other hand, the right
hemisphere appears to be more involved with prosody and the nonverbal aspects of
communication.
Both the literature and clinical observations suggest that brain-damaged
individuals and particularly those with right-hemisphere-damage may have "inappropriate
reactions to humor, misinterpretation of metaphors, and difficulty producing and
perceiving the emotional tone of linguistic utterances" (Sohlberg and Mateer, 1989, p.
215, see also Ylvisaker, 1992). These are individuals for whom traditional speech and
language measures (i.e., those examining production and comprehension of vocabulary
and grammatical structures) often indicate that performance is within the normal range.
Yet further investigation frequently finds more subtle deficits in communication
particularly at the conversational level and within social contexts.
Extensive literature reviews have listed some of the deficits attributed to right
hemisphere damage (see Ross, 1984, Gardener, Brownell, Wapner, and Michelow, 1983,
Searleman, 1983). Below is a summary of some of the findings relevant to this study
under the headings: prosody, nonverbal behaviour, abstract language, and pragmatics.
Prosody
Ross, Edmondson, Seibert, and Homan (1988) provide a comprehensive
definition of prosody as representing “a complex component of the acoustic signal that
communicates linguistic, attitudinal, emotional, pragmatic, and idiosyncratic information
through the use of pitch, loudness, timbre, tempo, stress, accent, pausing, and intonation”
(p. 130). Monrad Krohn (1947) suggested that prosody can be subdivided into four
categories: 1 ) intrinsic prosody which refers to the standard patterns used linguistically to
differentiate words or phrases such as statements versus questions or nouns from verbs
(e.g., con’-vict vs. con-vict’); 2) emotional prosody which is used to convey feelings such
as anger, pleasure, fear, and so on; 3) intellectual prosody which involves using prosody to
subtly change the meaning of the words spoken in order to convey emphasis, sarcasm,
skepticism, and so on; and 4) inarticulate prosody which includes grunts and other
nonlinguistic sounds that nevertheless provide the listener with information.
3
For a relatively recent review of the literature relevant to the various types of
prosody and the associated neuroanatomy and neuropsychology in normal, brain-injured,
and psychiatric populations see Merewether and Alpert (1990). Studies looking at
emotional prosody, have found that right-hemisphere-damaged (RHD) patients are
impaired in the comprehension and/or production of "afiTective speech." For example,
Heilman, Scholes, and Watson (1975) found that right-hemisphere-damaged patients made
more errors than left-hemisphere-damaged (LHD) patients in identifying neutral sentences
read in happy, sad, angry, or indifferent tones. Tucker, Watson, and Heilman (1977)
replicated this experiment and found that the RHD patients had difiBculty not just in
naming the emotions but also in discrimination (i.e., determining whether they were the
same or different). Weintraub, Mesulam, and Kramer (1981) found not only similar
results with RHD patients concerning discrimination of prosodic patterns but also that
they had difficulty with the repetition and production of prosody. The flaw with their
study was the lack of a LHD group with which to compare results. Heilman, Bowers,
Speedie, and Coslett (1984) found that both left- and right-hemisphere-damaged patients
were impaired in identifying intrinsic (or linguistic) prosody, i.e., filtered sentences with
interrogative, declarative, or command prosodic patterns, relative to normals but that only
RHD patients were impaired in comprehending emotional prosody.
On the other hand, Emmorey (1987) demonstrated that left hemisphere damage
affects the ability to comprehend intrinsic prosody used at the lexical level. LHD patients
had difficulty discriminating between noun compounds and noun phrases that were
contrasted by means of stress (e.g., greenhouse versus green house); RHD patients
performed as well as normals on this task. She suggested that "the left hemisphere may be
involved in the comprehension o f both sentential and lexical prosody, while the right
hemisphere may be involved with sentential intonation" (p.315).
Blumstein and Cooper (1974) found a left ear advantage (suggesting right
hemisphere involvement) in a dichotic listening experiment using interrogative, declarative,
continuation, and command prosodic patterns. Ley and Bryden (1982) demonstrated a
dissociation by showing a left ear advantage for recognizing the emotional intonation of
sentences (happy, sad, angry, and neutral) but a right ear advantage for the verbal content
of the sentences. Shipley-Brown, Dingwall, Berlin, Yeni-Komshian, and Gordon-Salant
(1988) showed left ear advantages for sentences with either intrinsic prosody (statement,
question, continuation) or emotional prosody (happy, angry, sad).
Ross and his colleagues have written several articles suggesting that damage in
the right hemisphere can produce aprosodias that are analogous to the subtypes of aphasia
depending on the locus of the lesion (Ross, 1984, 1981; Ross, Hamey, deLacoste-
Utamsing, and Purdy 1981; Ross and Mesulam, 1979). He and his associates have
hypothesized and provided evidence from case studies that a lesion in the anterior portion
of the right hemisphere would produce an “expressive aprosodia” whereas a posterior
lesion would produce a “receptive aprosodia.” Other terms that have been used are
“motor aprosodia” and “sensory aprosodia” (see Hughes, Chan, & Su, 1983). Ross,
Edmondson, Seibert and Homan (1988) performed Wada tests sequentially in both
hemispheres on five epileptic candidates for-surgery. They found that a left-sided Wada
produced a dense aphasia while a right-sided Wada caused the patients to lose the ability
to convey affect through speech. The effect was demonstrated through significant within-
subject differences of the parameters obtained from acoustic analyses of the speech
productions.
Mandarin Chinese speakers with focal right hemisphere lesions have been
examined with interest because Mandarin is a tonal language (Hughes, Chan and Su,
1983). Twelve such subjects were given tests assessing their ability to identify the
emotional content o f phrases, discriminate (i.e., decide whether two phrases had the same
or different emotional content) and repeat emotional prosody, and independently produce
phrases with specified emotional prosody. They were found to have changes similar to
English speakers, in their ability to produce and comprehend affective prosody, but no
change in their ability to produce or comprehend the tones necessary for the linguistic
aspects o f Mandarin (i.e., these lesions did not produce a “tone” aphasia). The latter
ability was assessed by having the subjects name and choose from a multiple choice
format, pictures o f words in which at least two were homophones differentiated
semantically by tone only. Not only did they find evidence for an aprosodia in the subjects
but that there were subcategories of aprosodia (e.g., motor, sensory, global and even
transcortical) dependent on lesion site as suggested by Ross (1981).
Shapiro and Danly (1985) acoustically analyzed the speech patterns o f RHD and
LHD patients and found that damage in the anterior portion of the right hemisphere
caused the patients to produce flat speech whereas the speech of patients with damage in
the posterior portion of the right hemisphere was hypermelodic. This pattern was found
to be the case with both emotional and nonemotional stimuli in a task in which the patients
were required to read the stimuli aloud. These deficits were not found in the LHD group.
Ryalls (1986) questioned their interpretation of the results and later tried to replicate the
findings. Ryalls, Joanette, and Feldman (1987) used a repetition rather than a reading task
and concentrated on nonaflfective as opposed to affective stimuli. The reasoning for the
latter change was because Shapiro and Danly had argued for a primary disturbance in
speech prosody caused by damage to the right hemisphere and, if this was so, Ryalls and
his colleagues argued that the effect should be seen clearly with nonaflfective stimuli. They
acoustically analyzed the subjects’ productions and found no significant differences among
the three groups (LHD, RHD, and NHD). Because the examiners, like other researchers,
could “hear” differences in the RHD subjects’ speech, they queried whether acoustic
analyses fully capture the changes in speech about which the patients complain. These
changes include such aspects as changes in average pitch, reduction in vocal pitch range,
reduced volume, and occasionally hoarseness. Ryalls et al. suggest that these changes are
similar to a description of “dysphonia or phonatory incompetence” and may be this
problem as opposed to a dysprosodia (at least when nonafifective stimuli are considered).
Thus, most studies have explored either intrinsic (e.g., statement versus question)
or emotional prosody (e.g., happy versus sad). LHD subjects appear to have difiBculty
processing prosody at the word and possibly the sentence level, whereas RHD subjects
have difiBculty with sentence level intonation. Results have been most clear with
emotional prosody as demonstrated by RHD subjects' difiBculty with discrimination,
comprehension, repetition, and/or production of afifective speech. Consequently, some
authors (e.g., Ross) have suggested that there may be aprosodias comparable to the
various aphasias. The literature is less clear with the production of prosody and in
particular if nonafifective stimuli are used. Some authors suggest that the changes in
output may be due to a dysphonia as opposed to a dysprosodia.
Nonverbal Behaviour
The literature suggests that not only is the right hemisphere involved in
visuospatial processing but in particular it may be involved with processing the visual cues
related to speech (i.e., lip-reading) or emotional expression (Thompson, 1985, Borod and
Koflf, 1990). Strauss and Moscovitch (1981) found a left visual field superiority
(implicating the right hemisphere) for recognizing facial expression in a tachistoscopic
study of normal subjects. Campbell (1986) also performed a tachistoscopic study and
8
showed a left visual field superiority for matching the sounds to the appropriate
photographs o f lip shapes. However, Campbell, Landis, and Regard (1986) studied two
patients showing a double dissociation related to face recognition and lipreading. The
patient with the right hemisphere lesion (right posterior temporal region) was impaired at
identifying and producing facial expressive gestures and recognizing familiar faces but not
with lip-reading. The patient with the left hemisphere lesion (left medial occipitotemporal
region) was able to recognize faces and facial gestures but was impaired with lip-reading.
Benowitz, Bear, Rosenthal, Mesulam, Zaidel, and Sperry (1983) used the Profile
of Nonverbal Sensitivity with commissurotomized patients with known lateralized
damage. Five of the six RHD patients had difficulty evaluating facial expressions. Most
of them were still able, however, to evaluate emotions conveyed auditorily or by body
movements. The latter suggests that the difficulty was not due simply to a deficit in
visuospatial processing. The LHD group performed in the normal range on the PONS.
There was one commissurotomized patient to whom the stimuli could be presented to one
hemisphere at a time due to the use of an occlusive optical system. This person showed
more difficulty evaluating facial expressions when required to use his right hemisphere and
with body movements when the left hemisphere processed the stimuli.
A phenomenon known as the McGurk illusion involves blends that are formed
when different oral and visual speech sounds are presented simultaneously (e.g., a visual
"ga" presented with an oral "ba" creates a heard "da" or "ta" (McGurk and MacDonald,

9
1976)). Another study discovered that the illusion is not under voluntary control nor
limited to consonants (Summerfield and McGrath, 1984). It is possible that this
coordination between visual and auditory processing also occurs at other levels of
language comprehension, e.g., visual and auditory cues for conveying emotional mood,
irony, or sarcasm.
In summary, the McGurk illusion studies suggest that visual and auditory
processing may be coordinated and thus both intonation and facial expression may be
relevant to signalling messages in conversation. RHD patients have been found to have
difficulty identifying and producing facial expressive gestures whereas LHD patients
appear to have difficulty recognizing facial shapes related to language (i.e., lip-reading).
Abstract Language
A review of psycholinguistic and neurolinguistic studies suggest that nonliteral
and literal language “are organized according to different principles in the mind and
represented in different places in the brain” (Van Lancker, 1990 p. 174). Subjects have
been to shown to make faster judgements and show better recall for familiar idioms as
opposed to novel literal phrases (e.g., Swinney and Cutler, 1979, Horowitz and Manelin,
1973). Gibbs (1986) found that normal subjects comprehended and remembered better
the ironic meaning as opposed to the literal meaning of the same expression.
10
Goldstein (1948) has termed the deficit found in certain brain-damaged
individuals as “a loss of the abstract attitude.” They tend to interpret utterances such as
metaphors, proverbs, indirect requests, and idioms in a more literal or concrete fashion.
Many authors suggest that the right hemisphere is involved in efficient processing of
abstract or nonliteral language although others have implicated the fi-ontal lobes. Benton
(1986) concluded that fi-ontal lobe damage was responsible for impaired interpretation of
proverbs but as emphasized by Van Lancker (1990) the patients with right fi-ontal damage
were more impaired than the ones with left fi-ontal damage.
Hier and Kaplan (1980) found that RHD patients were able to perform as well as
controls on a vocabulary test but were impaired in their ability to interpret proverbs (e.g.,
“Don’t cry over spilt milk”) and logico-grammatical sentences (e.g., “The elephant sat on
the mouse. Was the mouse on top?”). The authors suggested that the difficulty with
logico-grammatical sentences may be due to different mechanisms depending on the type
of construction: 1) visuospatial deficits perhaps contributed to the difficulty with spatial
relationships and 2) an “inability to manipulate the inner schemata of language may have
contributed to difficulties... with passives.”
Studies have demonstrated that RHD subjects show an impairment in the
interpretation of metaphors (e.g., “He has a heavy heart”) (Winner and Gardener, 1977) as
well as difficulty with idioms (e.g., “He’s turning over a new leaf’) (Myers and
Linebaugh, 1981 ; Van Lancker and Kempler, 1987). The latter study showed a double
II
dissociation with LHD subjects demonstrating difficulty with novel phrases but not
familiar idioms and RHD subjects showing the reverse pattern. “Most idioms, proverbs,
and social formulas are learned, produced, and comprehended as entire units rather than as
a sequence of grammatically independent lexical components” (Van Lancker, 1990, p.
180). Van Lancker and Kempler (1987) suggest that perhaps the right hemisphere is
involved in the interpretation of “formulaic speech.” because of its stronger propensity to
recognize familiar patterns. That is, the idiom, proverb, etc. become a “frozen” phrase
which is analyzed as a whole and because the right hemisphere is no longer able to
recognize the pattern there is a failure in comprehension. On the other hand, a person
with an intact right hemisphere but a damaged left hemisphere would be able to recognize
the “frozen” speech pattern and interpret it as well as single words are interpreted
However, there may be more involved than this in a complete explanation as Brownell,
Simpson, Bihrle, Potter, and Gardner (1990) found that RHD as opposed to LHD subjects
do not appreciate metaphoric meaning even at the single word level. A partial explanation
may be that the RHD subjects have difficulty generating alternative meanings although the
researchers argue that this postulation still does not fully explain the differences between
the groups.
Hirst, Ledoux, and Stein (1984) examined LHD and RHD subjects’ ability to
interpret indirect requests (e.g., “Can you X?”). The task involved viewing videotaped
episodes in which an individual asked another “Can you X?” and the other responded
12
either with an action or a simple “yes”. The subjects judged whether the response was
appropriate given the context. Anterior aphasies were found to comprehend the nonliteral
but not the literal meanings o f the sentences. On the other hand, RHD subjects
demonstrated comprehension of the literal interpretations but frequently failed to
“distinguish between appropriate and inappropriate action responses.” For example,
passing the salt when asked “Can you pass the salt?,” an indirect request, would be an
appropriate response whereas swinging a tennis racquet in the living room as a response to
the question, “Can you play tennis?,” a direct question, is not. Perhaps these indirect
requests are similar to idioms in that they too have become “frozen” phrases or social
formulas that are recognized as a whole and thus interpreted more readily by LHD than
RHD subjects.
In summary, RHD subjects appear to have difficulty interpreting abstract
language. Suspected contributions to the impairment appear to be their reduced
visuospatial abilities (e.g., necessary for logico-grammatical sentences involving spatial
relationships), reduced ability to recognize familiar patterns (e.g., necessary for formulaic
speech such as idioms and indirect requests), and reduced ability to generate alternative
meanings (e.g., necessary for metaphors).
Pragmatics
Pragmatics can be defined as a

i :
system o f rules that clarify (sic) the use o f language in terms of situational or social context. For example, language may be used to command, placate, query, impress, threaten, or establish rapport with the listener. (Sohlberg and Mateer, 1989, p. 214)
It involves many of the paralinguistic aspects already discussed above (i.e., prosody, facial
displays, gestures, and other nonverbal behaviours). It also involves such aspects as
tumtaking, greetings, repairing misunderstandings, and maintaining cohesiveness.
RHD individuals are often typified as being verbose and tangential with
difiBculties in interpreting humour and inferences. A study o f humour in brain-damaged
individuals by Bihrle, Brownell, Powelson, and Gardner (1986), an extension of Brownell,
Michel, Powelson, and Gardner’s (1983) study, found that RHD subjects had a preserved
sense that a joke should have a surprise ending but had difiBculty maintaining cohesion
such that they often chose a nonsequitur ending. LHD patients erred in the other direction
by often choosing an ending that fit the story but was not funny or surprising.
This inability to maintain cohesion or to integrate the important details necessary
to understand a story also affects the RHD individual’s ability to make inferences.
Wapner, Hamby, and Gardner (1981) found that RHD subjects were poorer at providing
the moral of a story or describing the emotions or motives of the characters although they
could recall isolated facts. One suggestion is that this deficit is related to the proposed
ability of the right hemisphere to process material in a holistic or gestalt fashion. In
addition. Blonder, Bowers, and Heilman (1991) found that RHD subjects had difficulty
14
making logical inferences even when only one target sentence and four multiple choice
responses were presented. They tended more frequently than either the LHD or control
group to choose a nonsequitur or contradictory response. Thus, even in linguistically
rather simple circumstances in which they had to weave few elements together to form a
cohesive whole they had more difficulty than the other groups making a leap in logic or an
inference.
A study by Brownell, Potter, Bihrle, and Gardner (1986) showed RHD subjects
to have deficits in understanding connected discourse. They attributed the difficulties to
being at least in part due to problems making inferences, a “susceptibility to following
associations that are tangential to the overall meaning of a discourse,” and to difficulty
“switching gears” thereby becoming fixed on the initial interpretation. Roman, Brownell,
Potter, Seibold, and Gardner (1987) examined script knowledge in RHD and elderly
subjects as well as a younger control group. The subjects were asked to provide the
sequence of steps for two common activities. In general, the RHD subjects were able to
do this albeit with some abnormalities such as “an inability to inhibit personalizations and
tangential remarks (and) difficulty continuing an incomplete script” (p. 167).
Kaplan, Brownell, Jacobs, and Gardner (1990) examined RHD subjects’ ability to
judge whether a speaker was being sarcastic (associated with a desire to be mean) or using
well-motivated deceit (associated with a desire to protect someone’s feelings). It was
suggested that a deficit would be “consistent with a decreased ability to make an inference

15
based in large part on affective information” (p. 318). Taped vignettes without a
“unique” or “sarcastic intonation” in the final utterance, were presented to the subjects.
They were required to make their judgments based on the contextual information, i.e., the
knowledge concerning the speaker’s relationship to the other person in the vignette. The
RHD subjects in general had no problem with the literally true statements but appeared to
have difficulty integrating the contextual information with the false statements as an aid to
interpreting them successfully.
To summarize, RHD subjects tend to be verbose, make tangential or
personalizing remarks, and have difficulty interpreting humor and making inferences.
Contributions to the impairments appear to be an inability to inhibit inappropriate
responses, difficulty maintaining cohesion and integrating the important details as opposed
to inconsequential details, and problems with “switching gears” such that alternative
explanations are not explored (as with metaphors and other examples of abstract language
described above).
Purpose of the Study
Much of what we say is not meant to be taken in a literal fashion. For example,
we extend indirect requests such “Can you open the window?” but are not actually asking
the listener if s/he can physically open the window but rather whether s/he would mind
doing so. We think the person dense or rude if s/he does not open the window but merely

16
responds aflSrmativeiy. We also use devices such as metaphors (e.g., “he has a heavy
heart”), slang (e.g., “that’s a cool car”), or idioms (e.g., “bring home the bacon”) as a
means o f adding spice to communication, fitting in with the group with whom we are
speaking, or conducting conversations in a quick, formulaic manner. The purpose of these
devices is dependent upon the situation. Irony is another device that adds variety to
conversations and is not meant to be interpreted literally. The following sections will
discuss this device in more depth along with an argument for studying irony within a
conversational format.
Irony
Irony involves a combination of words and paralinguistic features such as
intonation, facial displays, gestures, etc. that together with context convey a meaning
different from that imparted by the words alone. Schaffer (1982) describes verbal irony as
a “conflict between the literal meaning of the spoken words and what the speaker is
believed to intend” (p. 2). In many cases it is approximately the opposite o f the literal
meaning of the words themselves. Some researchers (e.g., Coates, 1991) consider
sarcasm and hyperbole as being subcategories of irony. Others (e.g., Schaffer, 1982) note
that although irony and sarcasm overlap in some aspects, sarcasm is not merely a subset of
irony. Instead, it is suggested that one can find examples o f each that do not involve the
17
other. For the purposes o f this study, sarcasm has been included as a category of irony
because of the overlapping similarities.
Dictionary definitions (New Webster Encyclopedic Dictionary (Eds.; Thatcher
and McQueen, 1984)) and examples of each of these devices are provided:
a) Irony - “a mode of speech by which words express a sense contrary to that really
intended; sarcasm (sic), in which apparent praise really conveys disapprobation,” e.g.,
"What a lovely day for a picnic" (it is pouring rain); "Isn't she a fantastic dancer" (she has
just stepped on her partner's toes); "You're a great fiiend" (you have just told me I carmot
borrow one of your CD's).
b) Sarcasm - “a bitter cutting expression; a satirical remark; a bitter gibe; a taunt,” e.g., "I
love your dress. Did you get it at Sally Ann?" (speaker would never consider shopping
there and said it in a negative manner).
c) Hyperbole - “a figure of speech which expresses much more or less than the truth; an
exaggerated statement; exaggeration,” e.g., "He has a million suits" (someone has quite a
few suits in his closet but not exactly a million).
Demo rest, Meyer, and Phelps (1984) differentiate between sarcasm and
deception. If a speaker tries to hide the truth so that the listener takes the words literally.

18
the remark is deceptive; however, if the speaker tries to signal in some way that the
remark is not true, the statement is sarcastic. The authors suggest that
with sincerity and deception, the speaker’s statements, behavior and intonation are congruent, and each may be used to judge the communicative purpose. However, in the case of sarcasm, the speaker’s statement is out of line with his behavior and intonation, and only the latter two cues may be used to accurately assess his purpose (p. 1528).
Several studies have dealt with the psycholinguistic aspects and the development of
comprehension of irony or sarcasm in children (see Grice, 1978, Clark and Gerrig, 1984,
Jorgensen, Miller, and Sperber, 1984, Demorest et al., 1984, Gibbs, 1986, ECreutz and
Glucksberg, 1989).
Coates (1991) discusses the four main theories of irony which include the
standard pragmatic theory (see Grice, 1978), pretense theory (see Clark and Gerrig,
1984), echoic mention theory (see Jorgensen et al. 1984), and echoic reminder theory (see
Kreutz and Glucksberg, 1989). These theories do not suggest that signalling through
intonation or behaviour is an important aspect in the comprehension of irony. The
important element according to these theories appears to be the recognition by the listener
that the ironic statement is counterfactual or against social norms or expectations. Much
of the research has been performed with written irony which may be different from that
encountered in natural conversation.
19
Gibbs (1986) reported on past suggestions that sarcastic utterances were thought
to have special intonation properties such as nasalization, exaggeratedly slow speaking
rate, and/or very heavy stress, however, his experiments involved written vignettes rather
than spoken material. Schaffer (1982) described a larger inventory of vocal cues used by
the four subjects in her study to signal irony including variations in pausing, voice quality
changes (e.g., laryngealization, nasality, hyponasality, breathiness), heavier stress, more
frequent pitch peaks or drops, and laughter (p. 45). She found that ironic statements are
more marked than sincere ones and that any kind of marking would do as long as in some
way it was different from that of the nonironic statements. Vocal cues are not the only
means to mark a statement as ironic or sarcastic. In addition to prosody, there may be
some types of nonverbal behaviour (e.g., facial expression, gestures) that help listeners
disambiguate ironic comments from sincere ones. These nonverbal cues were not
available in Schaffer’s study as it involved taped stimuli which listeners had to decide were
ironic or literal. Thus, it is possible to mark ironic statements through either visual or
auditory means or a combination of the two. It is important to note also that the
paralinguistic features may not be a necessary component. Sometimes the utterance may
be recognized as ironic only because o f the shared knowledge of the context or
background relevant to the conversation (as with written irony). One has only to think of
a friend or acquaintance with a particularly dry wit who provides little if any changes in
20
prosody or facial displays when speaking ironically to realize that these cues are not
necessary although they do aid in successful communication.
Coates (1991) studied, in dyadic conversations between normal speakers, what
she termed “inversions” in her original thesis but in a later manuscript (under revision) has
called “spontaneous irony”. Her definition o f an instance o f spontaneous irony is "a
discourse event in which the words actually spoken are understood by those involved to
mean the approximate opposite of their literal meaning" and could include irony, sarcasm,
hyperbole, and other similar events. She observed that the speaker and listener used
behavioural signals coUaboratively to mutually comprehend that an instance had occurred.
These behavioural signals included smiling, laughter, facial displays, head nodding and
shaking, and discourse shift markers. Coates saw the spontaneous ironic device as being
comprised of four phases consisting of
calibration (wherein participants agreed to accept a viewpoint about the subject matter); delivery (in which the inversion was actually presented); acknowledgement (where the participants conveyed their mutual understanding and appreciation of the inversion); and closure (in which the participants signalled the closing of the inversion frame) (Coates, 1991, p. ii)
To summarize, most theories appear to have been developed to explain written
irony and thus have not included behaviours used in conversation to convey that spoken
utterances are not to be interpreted literally. Although some authors have suggested that
there may be a special intonation pattern used to mark sarcastic comments, others have
21
noted a wider range of possible signals. Because of the variety o f possible signals and the
quick delivery and processing required in conversation, Coates suggested a collaborative
approach consisting of a sequence of four phases to explain the process.
Analvsis o f Conversation
There are two main reasons for using a conversational format as the most
appropriate means to study the phenomenon in question. The first involves the device
itself and the second is the subject group in whom the device is observed. These are
discussed below.
Coates (1991) has argued persuasively that irony needs to be examined in a
conversational context. Her thesis is that spontaneous irony in dialogue is a collaborative
affair that occurs quickly. Speakers signal in some manner that they are speaking
nonliterally, listeners convey that they have understood, and they mutually indicate that the
nonliteral portion has been completed. She also suggests, as have other discourse
researchers, that it helps or is even necessary in order to fully understand the process, to
study certain pragmatic aspects within a conversational context (see Watzlawick, Beavin,
and Jackson, 1967, ch. 4, Black, 1988, Bavelas, Chovil, Lawrie, and Wade, 1991, Clark
and Wilkes-Gibbs, 1986). Newman, Lovett, and Dennis (1986) state, “A basic fact of
language research is that language use in isolation often bears little resemblance to
language use in context” (p. 31). Coates points out that irony and sarcasm have typically
22
been studied as something that is said or written by one person. Irony in conversation, on
the other hand, is created by two people in a conversational context.
Many of the aspects suggested as cues for recognizing irony or sarcasm such as
prosody, facial displays, and context are those features that are supposedly not eflBcientiy
processed or attended to by RHD individuals. Some researchers have attempted to isolate
these various parameters to examine the performance of brain-damaged individuals. As
discussed earlier, RHD subjects may not show their subtle deficits until their performance
is examined at the conversational level. To date very little research has focused on
analyzing spontaneous conversations o f RHD individuals.
This study is an attempt to amalgamate the techniques of discourse analysis used
in the area of social psychology with the knowledge gained through neuropsychology
about the deficits in communication firom focal lesions. Spontaneous conversations were
taped and analyzed according to objective and reproducible methods. The subjects
producing these conversations were administered neuropsychological tests aimed at
analyzing the underlying abilities thought to be necessary for successful performance.
Statistical analyses were conducted to determine whether there are relevant relationships
between the underlying abilities and functional performance.
The overall purpose of this study is to ascertain whether irony occurs less
frequently or that there are more breakdowns in the communication of irony when one of
the speakers is brain-damaged (in particular with RHD) than with two non-brain-damaged
23
speakers during dyadic conversations. Coates' (1991) framework of analysis of the four
phases o f spontaneous irony is incorporated to aid in determining whether and at what
stage the breakdown occurs. In order for an ironic instance to be successful, both
participants must be aware that irony has occurred and that it was understood by the other
participant. A failure may be due to behaviours by either o f the participants.
As described above, individuals with damage to the right hemisphere may have
more difficulty producing and/or comprehending prosody (i.e., intonation, rate, rhythm of
speech) and thus may misinterpret the prosodic cues used to convey emotion or mark
nonliteral expressions and may rely instead on the words alone to convey the meaning. In
addition, they may have visuoperceptual problems and, in particular, difficulty recognizing
and interpreting facial expressions, body language, and gestures. Thus, they may have
difficulty processing the subtle paralinguistic cues we use to embellish our
communication. Also, both right- and left-hemisphere-damaged people may be slower in
processing information. This may cause a delay in their ability to process the information
typically used in the calibration and delivery phases of irony such that they are not able to
follow that there has been a shift from literal to nonliteral communication. Thus, the
purpose of the study is to determine whether there are more frequent failures in irony
found in conversations with either right- or left-hemisphere-damaged people and to
attempt an explanation of why this occurs.

24
CHAPTER TWO
Method
Pilot study
A pilot study was conducted to determine which tests and methods o f analysis
would be most appropriate. The subjects consisted of four neurologically intact
volunteers and four individuals who had had a cerebral vascular accident (CVA) and were
recruited from the local Stroke Club. Two had had left hemisphere damage and two had
had lesions in the right hemisphere. There were no criteria regarding time post-onset and
information about the presumed locus o f lesion was obtained from self report concerning
which side of the body had been affected by the stroke.
The original plan had been to pair these subjects with their spouses or a close
friend for the conversational portion o f the data. This decision was made partially for
convenience as it was assumed the individuals post-stroke would not be driving but
instead would be traveling to the lab with a fiiend or spouse. This assumption was wrong.
In addition, after viewing the conversation between two spouses, it appeared that the
quality of conversation was different from a conversation between strangers. This
difference may be due to several possibilities, (I) people who know each other well may
not require the same amount of calibration as strangers, (2) there may be more in-jokes or
irony not understood by an outside observer, and (3) less overt acknowledgement may be
required to show the speaker that the irony was understood. These factors made the

25
conversation harder to analyze and more diflScult for the reliability measure. Also there
was concern that that the tasks used may be sensitive issues with people who know each
other well, e.g., holiday activities or plans disliked by each or tacky presents received by
either participant.
In the pilot study, the dyads were given six tasks to discuss. Two of these were
eliminated from the final study and one was adjusted. The tasks were as follows:
a) Pictures o f seven bizarre-looking outfits from a feature in the “National Enquirer” were
given along with the instructions, “Look at these with your partner. Choose the three
worst-looking outfits. Talk to your partner about them and why you chose those three. If
you had to wear one of the three you chose, where would you wear it?”
b) Wild and Wacky Weddings (again from the “National Enquirer”) “Here are three
weddings. Choose the one that seems the silliest or craziest to you. Describe it to your
partner. Tell your partner what the ceremony was like and why you think it is silly or
crazy.”
c) “Plan a meal made of foods that you and your partner dislike. Discuss with your
partner what this meal should consist of. Then both of you should decide who you would
like to serve this meal to.”
d) “Think o f a holiday plan made up o f places and activities that neither you nor your
partner like. Talk about what this holiday would be. Then think of whom you would like
to send on this holiday.”

26
e) “What was the worst or tackiest present you have ever received. Describe it to your
partner and tell what the occasion was. (You can also describe something that someone
else has received or that you have given to someone if you cannot think of something you
have received.)”
f) “Read this cartoon to yourself. Describe it to your partner.” (There are three cartoons.)
Not all tasks were presented to each dyad, resulting in each dyad having a
different selection of tasks to discuss. Dyads were stopped after approximately fifteen
minutes of conversation. Some topics were more successful than others in generating
instances of irony. In general, tasks (a) to (d) appeared to be the most successful. Thus
(e) and (f) were eliminated and different pictures were used for (c) in the actual study.
Coates’ (1991) rules were used to identify the instances of irony. The pilot data
was then used to generate rules for determining success and failure in communication of
the irony. The videotapes were watched carefully during the delivery of the identified
instances and immediately after the delivery. Behaviours such as mutual smiling, laughter,
head nodding, etc. seemed to indicate that the instances were acknowledged by the
listeners. Observations of the successful instances suggested that the features that made
them seem successful were at least one of the following: 1) the listener said or did
something appropriate to the paraphrased rather than the literal meaning, 2) the listener
and possibly the speaker smiled or laughed to acknowledge the irony, 3) the listener or the
speaker closed the irony through some means such as a discourse marker (e.g., “well”.
27
“O.K.”), or 4) the listener escalated the irony by adding to it. The failures either showed
an absence of the above or the speaker had to expand on what was said earlier to make the
irony clearer. These observations were formed into a set of descriptive rules and then
later into a decision tree (see appendix for final set o f rules). These rules were then used
by a second observer to score the set of data in order to obtain a reliability measure. This
person was trained to recognize the irony by reading the appendices of Coates’ thesis.
Then practice was given in scoring the successes and failures. Once the agreement in the
practice sections appeared to be high enough, the scorer then scored independently a
different set o f instances. The instances o f irony were identified for the second scorer
along with literal and paraphrased interpretations o f each instance. The task for the scorer
was to determine whether the instance was a success or failure according to the set of
rules.
Because of the cooperative nature of irony as theorized by Coates and
substantiated by the viewing of the videotapes, there had to be an interpersonal focus
when analyzing the data. Both participants had to be viewed and the behaviours of either
could contribute to the judgement o f success or failure of the irony. If the instance of
irony could not be considered a clear success, then it was decided that it should be
considered a failure. It is quite possible that the listener was aware that the utterance was
ironic, however, if it was not acknowledged then the speaker would not be aware that s/he
28
had been understood and thus it would not be completely successful. This bias is evident
in the scoring rules.
The percentage agreement between the two scorers was 79 per cent. To
determine whether this was significantly above chance level (this was necessary to
determine because there are only two choices: success or failure), 79 was converted to a
z-score and then compared to the Normal curve. The z-score of 2.14 is at .015 on the
Normal curve and significantly above chance when the p = .05 level is considered. Thus,
the scoring of the success or failure of the irony was considered to be reliable.
A variety o f neuropsychological measures were used with these pilot subjects to
determine what tests should be in the battery. These subjects had not been assessed
previously and thus retrospective measures could not be used. Factors such as
administration time, portability of test materials (some subjects were assessed within their
homes), and subject fiustration were considered along with the hypothesized parameters
to be measured. For example, the Profile of Nonverbal Sensitivity was tried but eliminated
from the battery because subjects became frustrated, it was too long, and it was not
portable. The battery that was used for the actual study is described below.
29
Current Study
Subjects
Subjects comprise three groups; 1)JRHD: 9 right-hemisphere-damaged CVA*
subjects paired with 9 neurologically normal partners, 2) LHD: 9 left-hemisphere-damaged
CVA subjects paired with 9 neurologically normal partners, 3) NHD: 11 neurologically
normal subjects act as a control group and are paired with 11 neurologically normal
partners. The decision regarding which role the NHD subjects would play was quasi-
randomly determined. As they called to volunteer for the study, their names were placed
on a list. When they were called to set an appointment for videotaping, the decision
regarding whether they were paired with another NHD subject or a clinical subject was
based on their availability. The 22 NHD subjects making up the control group dyads were
randomly assigned by flipping a coin as either the control group member or the
conversational partner o f the control group member.
The brain-damaged groups have met the following criteria: (a) have been given a
CT or MRI scan to determine locus o f lesion or have been seen by a neurologist who has
determined approximate site of lesion from clinical symptoms; (b) do not have a
concomitant neurological problem as determined from a self-administered health status
questionnaire (see appendbc); (c) adequate visual acuity - with or without glasses to match
' CVA: Cerebral Vascular Accident (stroke)

30
pictures in a picture-matching task; (d) adequate hearing for one-to-one conversation; (e)
onset of CVA was between 6 and 24 months prior to the study; and (f) score 12 or more
on the Auditory Comprehension Test for Sentences (Shewan, 1979); (g) score above the
16th percentile on the Raven's Coloured Progressive Matrices (Raven, 1947); and (h)
subjects with left CVA, score at least 17/20 (reliability determined by means o f a second
rater) on the Spontaneous Speech section of the Western Aphasia Battery (Kertesz, 1982)
(such that they are able to comprehend instructions and their content, structure, and length
of utterances are potentially adequate to support inversions).
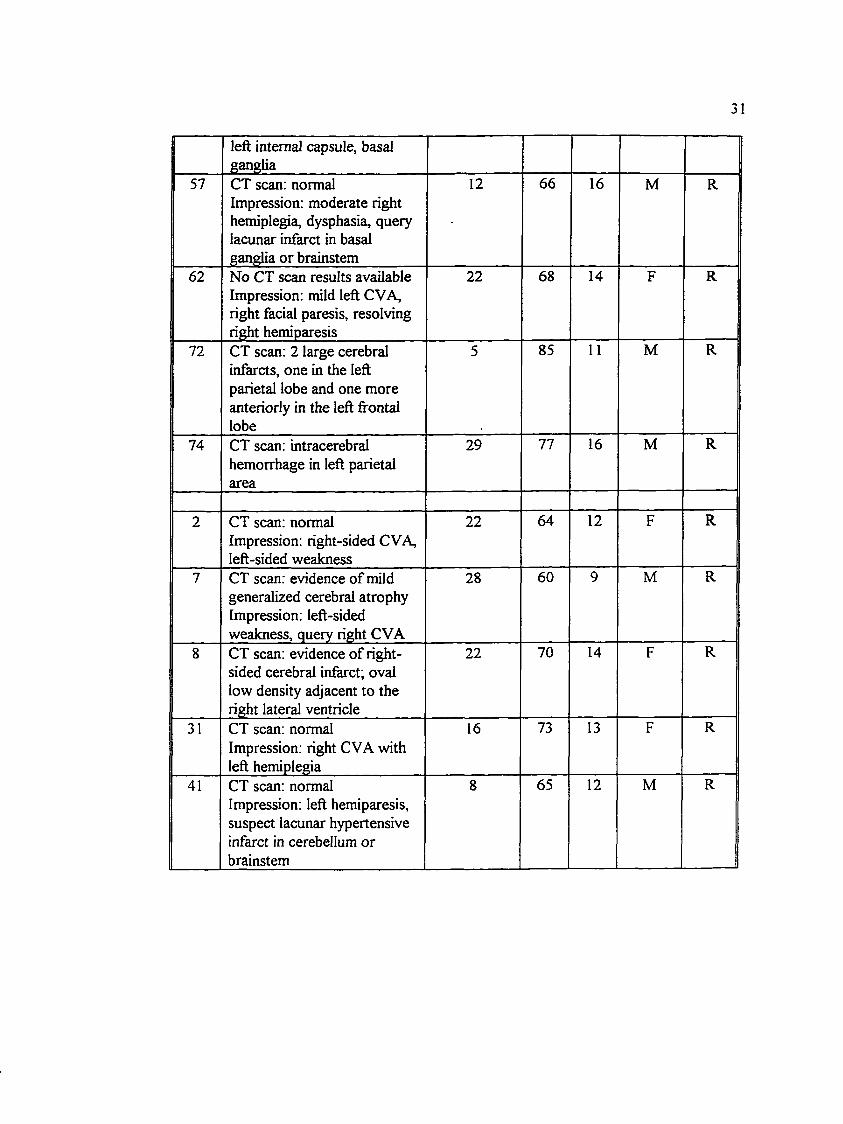
Table 1Demoeraohic Information of Clinical Subjects
Subj.No.
Locus of Lesion Time Postonset (mos.)
Age(yrs)
Ed.(yrs)
Gender Hand.
11 CT scan; normal Impression^: left-sided CVA, verbal apraxia, dysphasia
15 72 16 M R
17 CT scan: normal Impression: left-sided CVA, right hemiparesis, mild anomia
19 64 11 F R
42 CT scan: posterior limb of left internal capsule with upward extension into paraventricular area
17 58 13 M R
45 CT scan: left internal capsule 10 70 10 M R50 CT scan: intracerebral bleed
involving posterior limb of18 69 14 M R
' If CT scan results were normal or unavailable, the neurologist’s impression based on such features as hemiparesis. communication difficulties, etc. was used to assign subjects to LHD or RHD groups.
left internal capsule, basal ganglia
57 CT scan: normal Impression: moderate right hemiplegia, dysphasia, query lacunar infarct in basal ganglia or brainstem
12 66 16 M R
62 No CT scan results available Impression: mild left CVA, right facial paresis, resolving right hemiparesis
22 68 14 F R
72 CT scan: 2 large cerebral infarcts, one in the left parietal lobe and one more anteriorly in the left fi"ontal lobe
5 85 11 M R
74 CT scan: intracerebral hemorrhage in left parietal area
29 77 16 M R
2 CT scan: normal Impression: right-sided CVA, left-sided weakness
22 64 12 F R
7 CT scan: evidence of müd generalized cerebral atrophy Impression: left-sided weakness, query right CVA
28 60 9 M R
8 CT scan: evidence of rightsided cerebral infarct; oval low density adjacent to the right lateral ventricle
22 70 14 F R
31 CT scan: normal Impression: right CVA with left hemiplegia
16 73 13 F R
41 CT scan: normal Impression: left hemiparesis, suspect lacunar hypertensive infarct in cerebellum or brainstem
8 65 12 M R
32
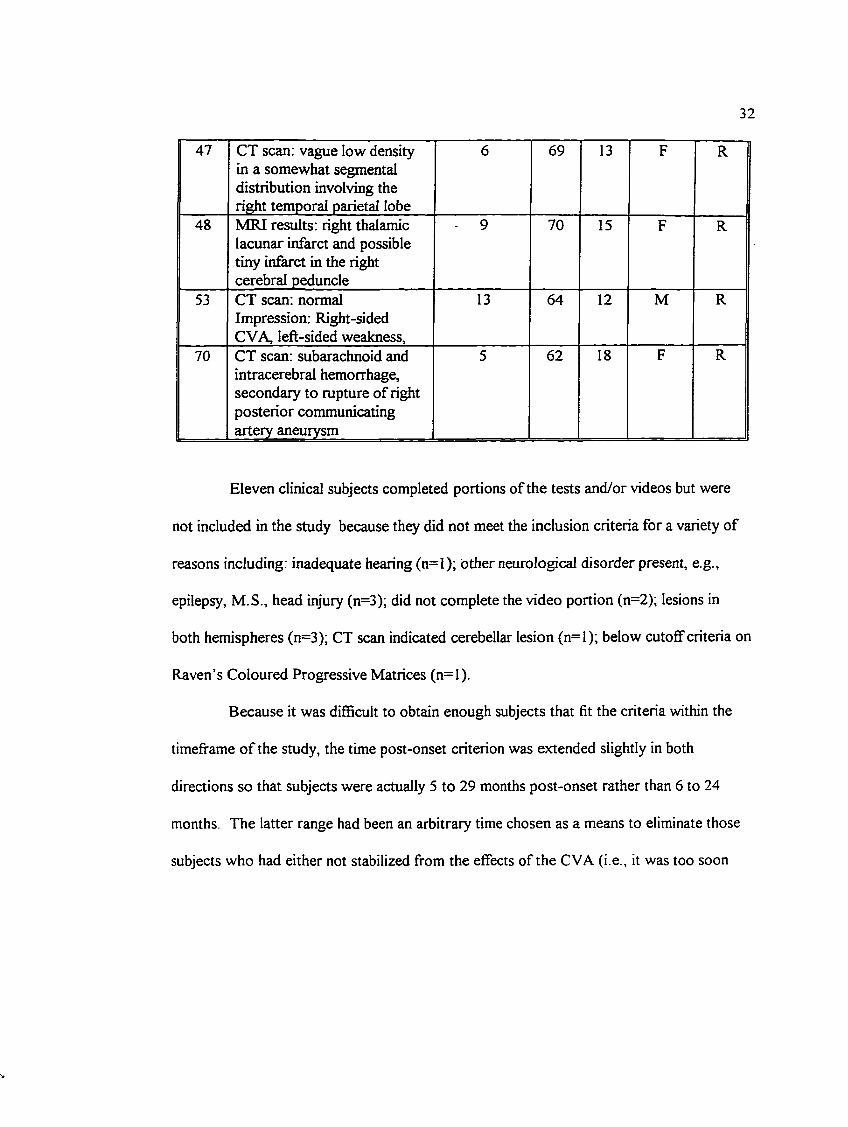
47 CT scan: vague low density in a somewhat segmental distribution involving the right temporal parietal lobe
6 69 13 F R
48 MRI results: right thalamic lacunar infarct and possible tiny infarct in the right cerebral peduncle
9 70 15 F R
53 CT scan: normal Impression: Right-sided CVA, left-sided weakness.
13 64 12 M R
70 CT scan: subarachnoid and intracerebral hemorrhage, secondary to rupture of right posterior communicating artery aneurysm
5 62 18 F R
Eleven clinical subjects completed portions of the tests and/or videos but were
not included in the study because they did not meet the inclusion criteria for a variety of
reasons including: inadequate hearing (n=I); other neurological disorder present, e.g.,
epilepsy, M.S., head injury (n=3); did not complete the video portion (n=2); lesions in
both hemispheres (n=3); CT scan indicated cerebellar lesion (n=l); below cutoff criteria on
Raven’s Coloured Progressive Matrices (n=l).
Because it was difScult to obtain enough subjects that fit the criteria within the
timeframe o f the study, the time post-onset criterion was extended slightly in both
directions so that subjects were actually 5 to 29 months post-onset rather than 6 to 24
months. The latter range had been an arbitrary time chosen as a means to eliminate those
subjects who had either not stabilized from the effects of the CVA (i.e., it was too soon
33
after the CVA to test for ongoing symptoms) or perhaps had learned to compensate for
the communication difficulties associated with the CVA. It was thought that a slight
taxing o f the acceptable range would not jeopardize the intent of this inclusion criterion.
Two subjects (# 57 and #41) were included in the study despite the fact that the
neurological impression indicated that possibly the lesion was in the cerebellar or
brainstem region. This impression was not corroborated by the CT scan which was unable
to localize a lesion. #57 had right hemiplegia and dysphasia, symptoms also suggestive of
a lesion in the left hemisphere and #41 had left hemiparesis, suggestive of a possible right
hemisphere lesion. Thus, they were included in the appropriate groups. Also subject #72
was left in the study despite having two lesions. Because both lesions were localized to
the left hemisphere only and he fit the rest of the inclusion criteria, the decision was made
to keep him in the LHD group. Other subjects with multiple lesions were dropped
because the lesions were in both hemispheres and thus did not allow assignment to an
appropriate group.
The Spontaneous Speech section of the Western Aphasia Battery was scored
separately by two examiners. The scores varied by a difference of +/- 2 points. The
correlation between the two sets of scores of the two examiners was r = .63, p = .068,
thus making the strength o f the relationship between the two sets of scores to be 39 ,7%
More to the point, however, was the fact that the reliability between the two scorers that
the subjects met the criteria level (i.e., scored at least 17/20 on the subtest) was 100%. In
34
other words, both scorers agreed that these 9 left CVA subjects were eligible according to
this criterion.
Demographics
1) Education:
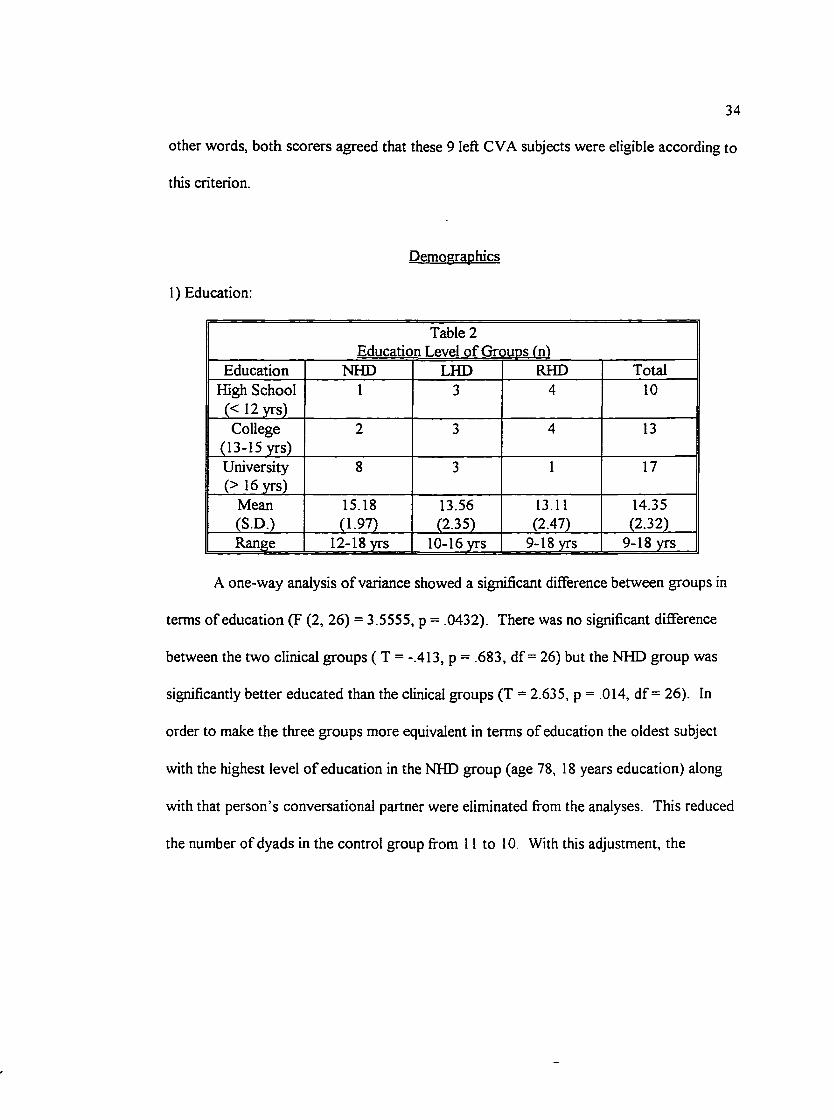
Table 2Education Level o f Groups fnl
Education NHD LHD RHD TotalHigh School 1 3 4 10
(< 12 yrs)College
(13-15 yrs)2 3 4 13
University (> 16 yrs)
8 3 1 17
Mean 15.18 13.56 13.11 14.35(S.D.) (1.97) (2.35) (2.47) (2.32)Range 12-18jyrs 1 0 -1 6 j t s 9-18 yrs 9-18 yrs
A one-way analysis of variance showed a significant difference between groups in
terms of education (F (2, 26) = 3.5555, p = .0432). There was no significant difference
between the two clinical groups ( T = -.413, p = .683, df = 26) but the NHD group was
significantly better educated than the clinical groups (T = 2.635, p = .014, df = 26). In
order to make the three groups more equivalent in terms of education the oldest subject
with the highest level of education in the NHD group (age 78, 18 years education) along
with that person’s conversational partner were eliminated from the analyses. This reduced
the number of dyads in the control group from 11 to 10 With this adjustment, the
35
between group difference for education level was no longer significant (F(2, 25) = 2.7359,
p = .0842; control group mean = 15.40, S.D. = 2.0II).
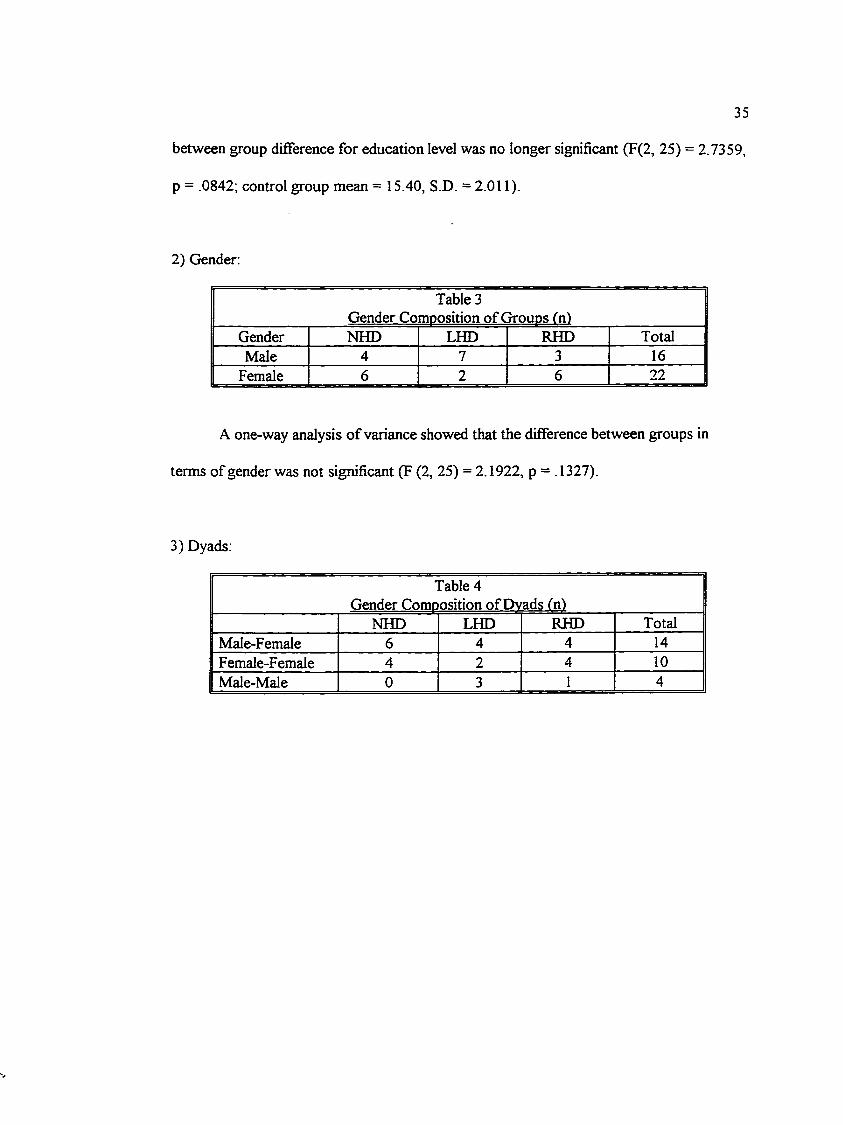
2) Gender:
Table 3Gender Comoosition of Grouos fn)
Gender NHD LHD RHD TotalMale 4 7 3 16
Female 6 2 6 22
A one-way analysis o f variance showed that the difference between groups in
terms of gender was not significant (F (2, 25) = 2.1922, p = .1327).
3) Dyads:
Table 4Gender Comoosition of Dvads fn)
NHD LHD RHD TotalMale-Female 6 4 4 14Female-Female 4 2 4 10Male-Male 0 3 1 4
36
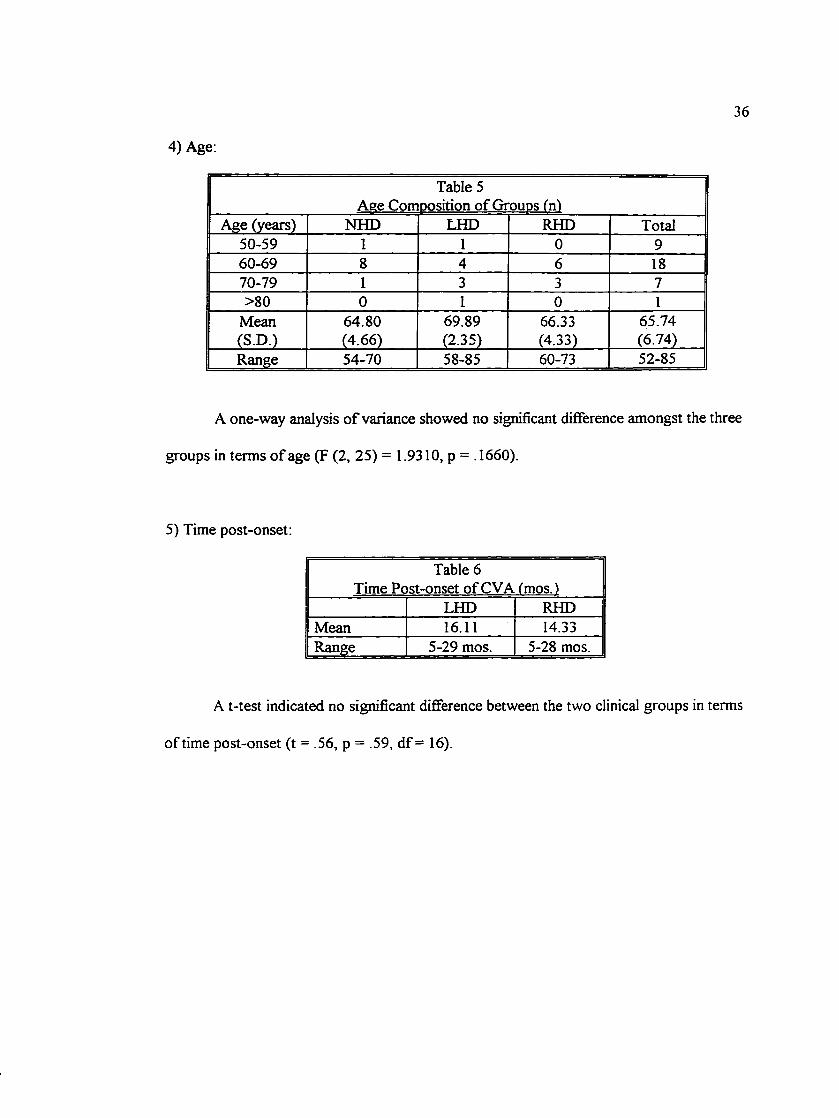
4) Age:
Table 5Aee Comoosition of Groups fnl
Age (years) NHD LHD RHD Total50-59 1 1 0 960-69 8 4 6 1870-79 1 3 3 7>80 0 1 0 1
Mean 64.80 69.89 66.33 65.74(S.D.) (4.66) (2.35) (4.33) (6.74)Range 54-70 58-85 60-73 52-85
A one-way analysis o f variance showed no significant difference amongst the three
groups in terms o f age (F (2, 25) = 1.9310, p = .1660).
5) Time post-onset:
Table 6Time Post-onset of CVA fmos.)
LHD RHDMean 16.11 14.33Range 5-29 mos. 5-28 mos.
A t-test indicated no significant difference between the two clinical groups in terms
of time post-onset (t = .56, p = .59, df = 16).
37
6) Locus of Lesion;
As can be noted from the table, the CT scan results for 9 out of the 18 clinical
subjects were either unable to localize the lesion or unavailable. For these cases, the
neurological impression (obtained from the medical chart) or apparent physical symptoms
(as in the cases o f #57 and #41, see above) were used to localize the lesion to the left or
right hemisphere but further localization was not possible. The neurological impression
was usually based on one or a combination of features such as hemiplegia, hemiparesis,
dysphasia, etc.
7) Native Language:
It must be noted that two of the RHD subjects had English as a second language
with German as their first language (#41 and #53). Both had been in Canada for the
majority o f their adult life (i.e., > 30 years) and were fluent speakers of English.
8) Non-Hemisphere-Damaged Subjects
The NHD subjects made up two groups;(l) the control group subjects and their
conversational partners and (2) the conversational partners of the clinical subjects. The
demographics o f the NHD subjects in these two groups were examined to determine
whether there were any statistically significant differences.
38
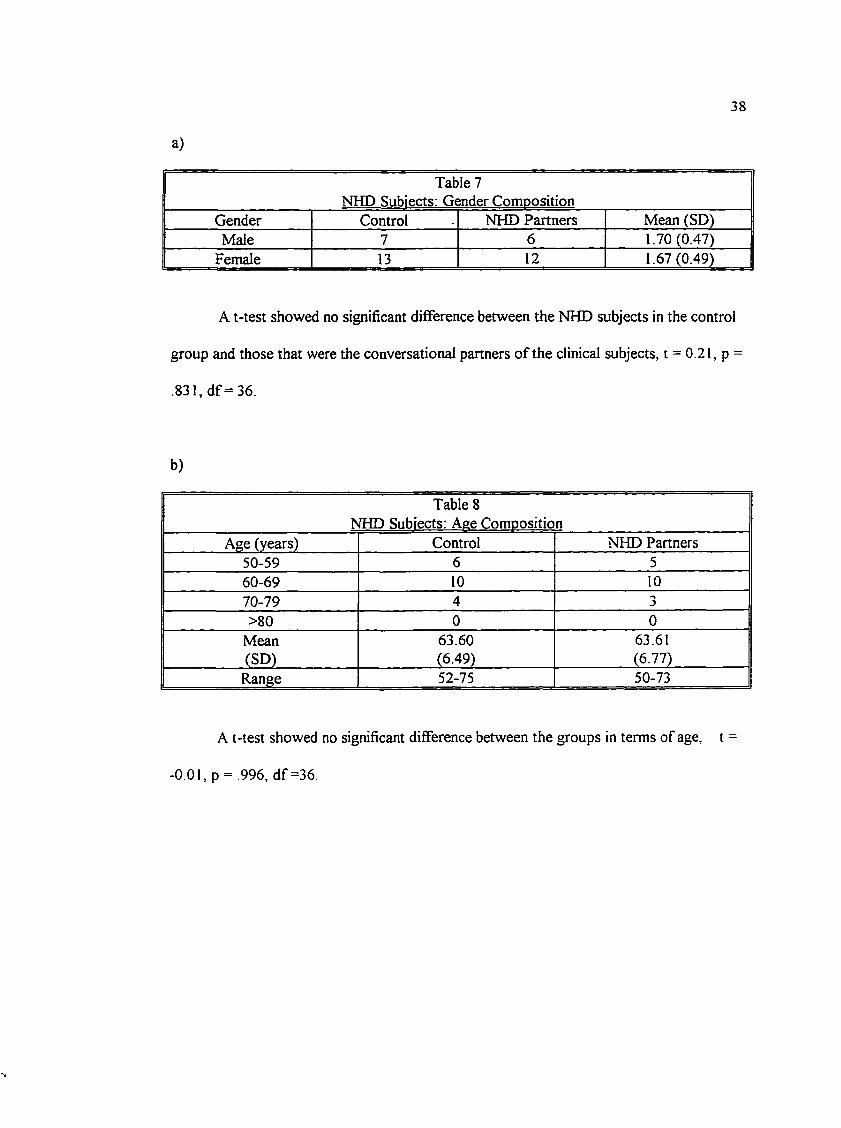
a)
Table 7NHD Subjects; Gender Composition
Gender Control NHD Partners Mean (SD)Male 7 6 1.70(0.47)
Female 13 12 1.67 (0.49)
A t-test showed no significant difference between the NHD subjects in the control
group and those that were the conversational partners of the clinical subjects, t = 0 .21, p =
831,df=36.
b)
Table 8NHD Subjects: Aee Composition
Age (years) Control NHD Partners50-59 6 560-69 10 1070-79 4 3>80 0 0
Mean 63.60 63.61(SD) (6.49) (6.77)
Range 52-75 50-73
A t-test showed no significant difference between the groups in terms of age, t
-0.01, p = .996, df =36.
39
c)
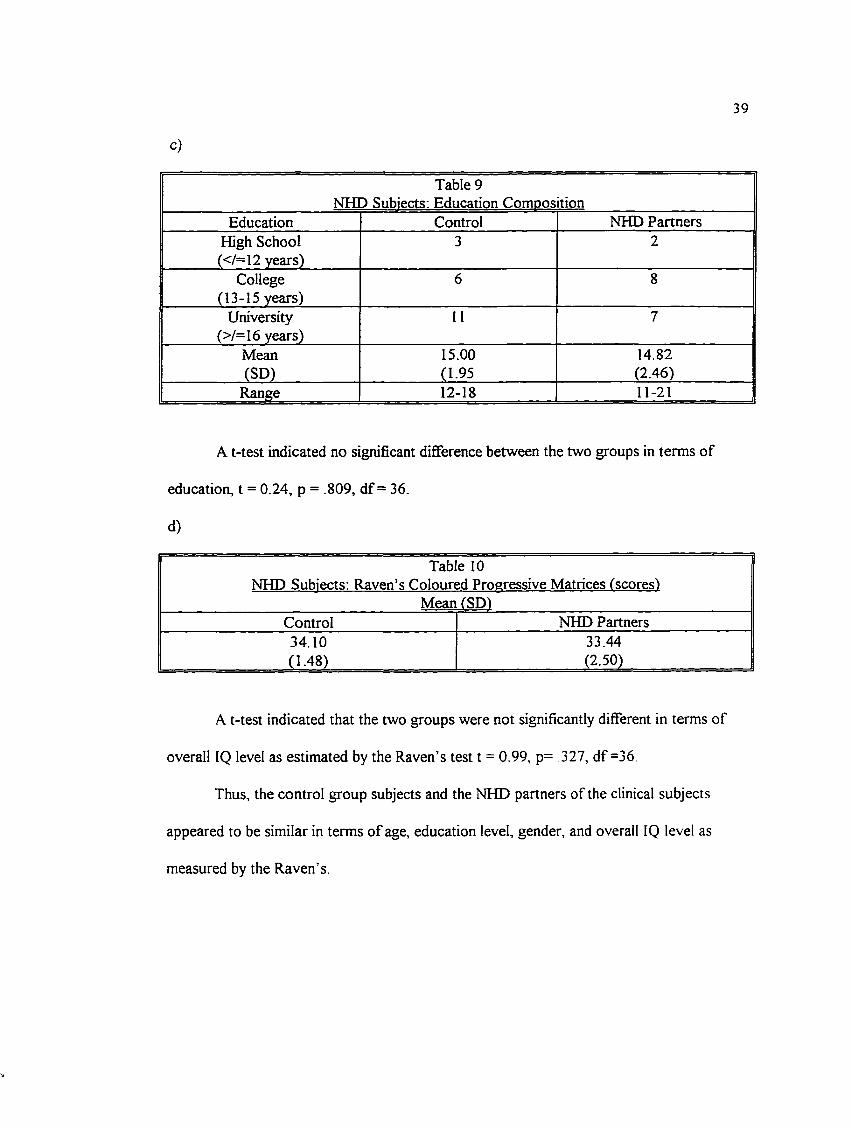
NHlTable 9
9 Subiects; Education CompositionEducation Control NHD Partners
High School (</=12 years)
3 2
College (13-15 years)
6 8
University (>/=16 years)
11 7
Mean(SD)
15.00(1.95
14.82(2.46)
Range 12-18 11-21
A t-test indicated no significant difference between the two groups in terms of
education, t = 0.24, p = .809, df = 36.
d)
Table 10NHD Subjects: Raven’s Coloured Progressive Matrices (scores)
____________________Mean fSD")______________________Control NHD Partners34.10(148)
33.44(2.50)
A t-test indicated that the two groups were not significantly different in terms of
overall IQ level as estimated by the Raven’s test t = 0.99, p= 327, df =36.
Thus, the control group subjects and the NHD partners of the clinical subjects
appeared to be similar in terms of age, education level, gender, and overall IQ level as
measured by the Raven’s.
Inclusion Criteria Measures
40
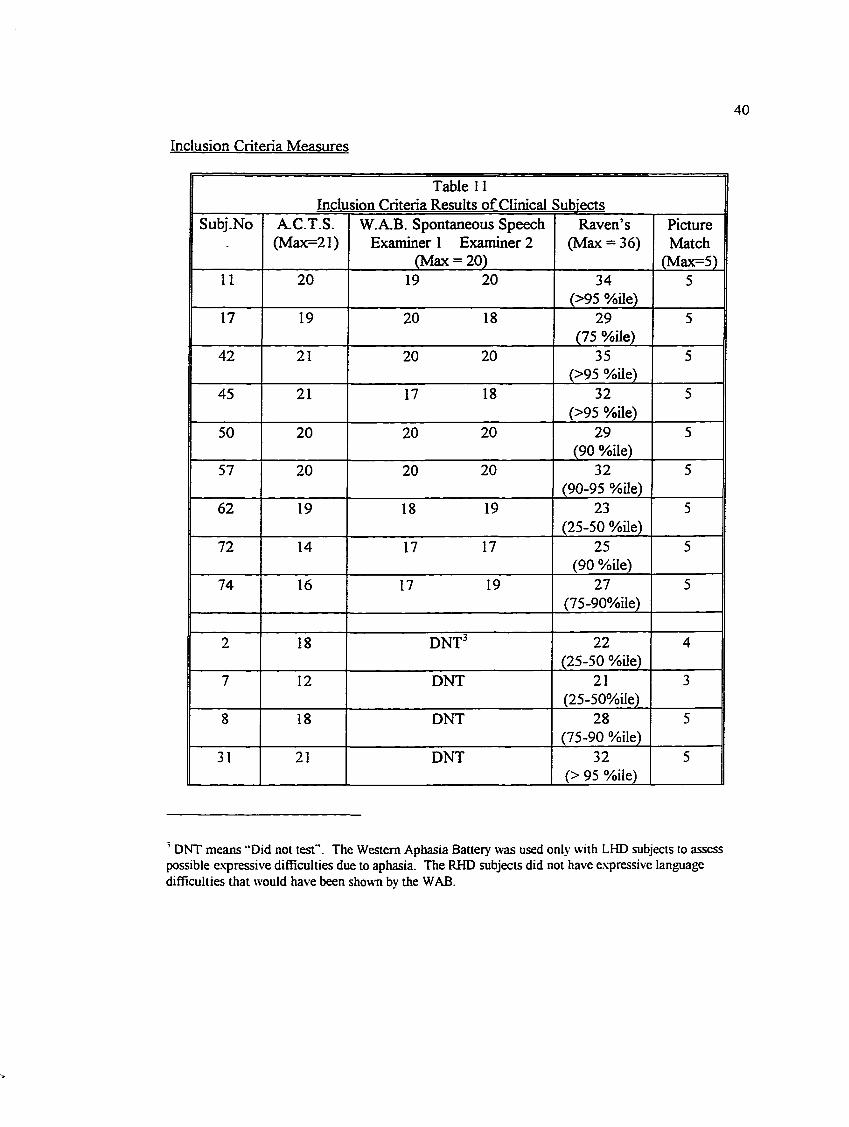
Table 11Inclusion Criteria Results of Clinical Subiects
Subj.No A.C.T.S.(Max=21)
W.A.B. Spontaneous Speech Examiner 1 Examiner 2
(Max = 20)
Raven’s (Max = 36)
PictureMatch
(Max=5)11 20 19 20 34
(>95 %ile)5
17 19 20 18 29 (75 %ile)
5
42 21 20 20 35(>95 %ile)
5
45 21 17 18 32(>95 %ile)
5
50 20 20 20 29 (90 %Ue)
5
57 20 20 20 32(90-95 %ile)
5
62 19 18 19 23(25-50 %Ue)
5
72 14 17 17 25 (90 %ile)
5
74 16 17 19 27(75-90%ile)
5
2 18 DNT^ 22(25-50 %üe)
4
7 12 DNT 21(25-50%ile)
3
8 18 DNT 28(75-90 %ile)
5
31 21 DNT 32(> 95 %ile)
5
’ DNT means “Did not test”. The Western Aphasia Battery was used only with LHD subjects to assess possible expressive difficulties due to aphasia. The RHD subjects did not have expressive language difficulties that would have been shown bv the WAB.
41
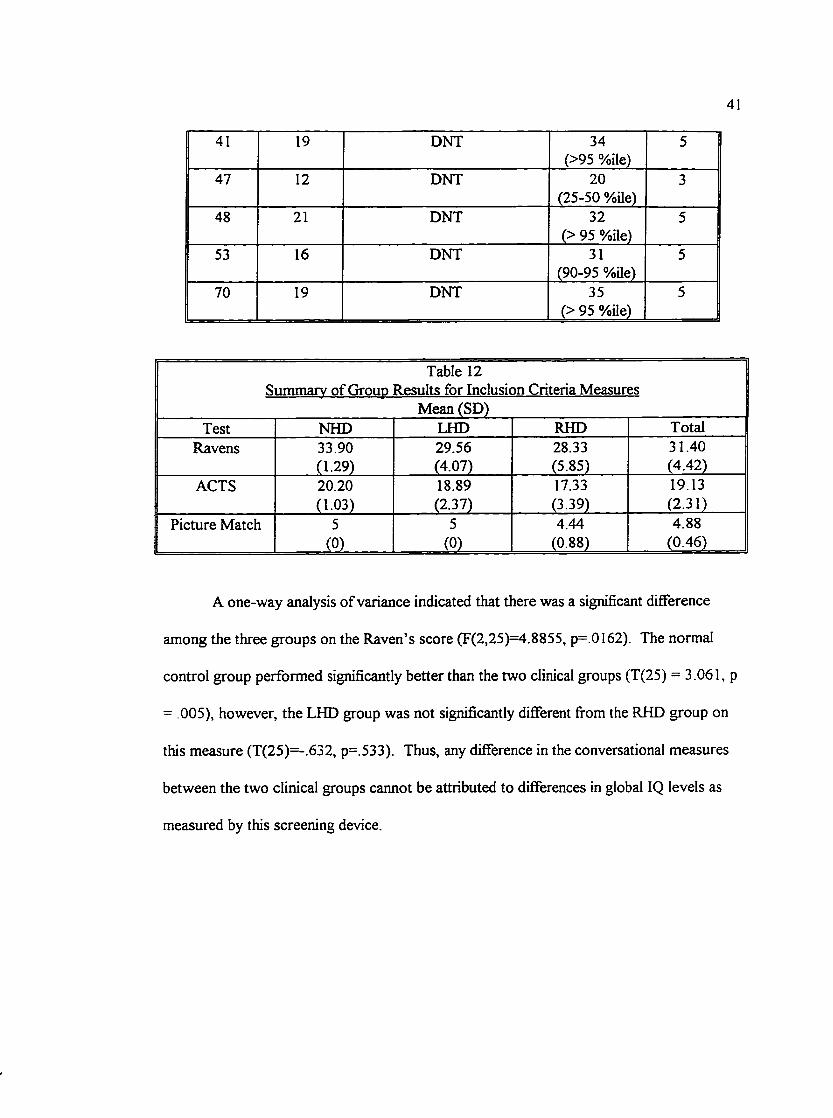
41 19 DNT 34(>95 %ile)
5
47 12 DNT 20(25-50 %üe)
3
48 21 DNT 32(> 95 %Ue)
5
53 16 DNT 31(90-95 %Ue)
5
70 19 DNT 35(> 95 %Ue)
5
Table 12Summary of Group Results for Inclusion Criteria Measures
Mean (SD)Test NHD LHD RHD Total
Ravens 33.90 29.56 28.33 31.40(1.29) (4.07) (5.85) (4.42)
ACTS 20.20 18.89 17.33 19.13(1.03) (2.37) (3.39) (2.31)
Picture Match 5 5 4.44 4.88. m _ _ _ . (0) (0.88) (0.46)
A one-way analysis of variance indicated that there was a significant difference
among the three groups on the Raven’s score (F(2,25)=4.8855, p=.0I62). The normal
control group performed significantly better than the two clinical groups (T(25) = 3.061, p
= .005), however, the LHD group was not significantly different from the RHD group on
this measure (T(25)=-.632, p=.533). Thus, any difference in the conversational measures
between the two clinical groups cannot be attributed to differences in global IQ levels as
measured by this screening device.
42
Likewise, the difference between groups was significant for the results of the
Auditory Comprehension Test for Sentences (F(2,25) = 3.3228, p = .0525). There was a
significant difference between the NHD group and the clinical groups (T(25) = 2.188, p =
.038, however, the RHD group was not significantly different fi’om the LHD group (T(25)
= -1.363, p = .185). At first glance, this may seem to be surprising because the LHD
group would be expected to perform more poorly than the RHD group on this language
measure, however, the reduced scores may be due to different causes. Although the test
purports to assess auditory comprehension, it involves choosing amongst four pictures
that vary in minor details thus requiring adequate visuoperceptual skills for success. It is
likely that the RHD subjects had difficulty not because of poor auditory comprehension
but rather because of their reduced attention to visual detail.
The picture matching task showed three subjects to have some difficulty with
matching pictures. These subjects all had right hemisphere damage. The errors were
pointed out to the subjects and thus, this measure functioned as a training and/or
information-gathering procedure rather than an exclusionary measure per se. The
original purpose for this measure was to exclude subjects who had poor visual acuity and
to sensitize the examiner as to whether the subject had a hemianopia or neglect. These
three subjects did not appear to suffer from either poor visual acuity or a visual field
problem but rather from an inattention to detail. Pointing out the errors, it was hoped,
would act to make them aware of the need to pay closer attention. Nevertheless, it is
43
possible that this reduced attention to detail may explain at least some of the errors on the
tests involving making choices amongst a set o f pictures vaiying in minor details (e.g., the
ACTS and the Metaphor Picture subtest o f the RHLB).
Design
The study consists of two parts: 1) videotaped spontaneous conversations
between pairs of subjects and 2) a series o f neuropsychological measures administered
individually to each of the subjects. The first part is similar in design to that used by
Coates (1991) to elicit instances of irony between dyadic speakers in spontaneous
conversation. Interactions between pairs consisting of one brain-damaged subject and one
non-brain-damaged subject and between pairs of two neurologically normal speakers
(control group) were videotaped, analyzed, and compared.
To allow the information, both visual and auditory, to be as accessible as
possible, subjects were videotaped in the Human Interaction Lab with a split screen.
Subjects were seated at a table across from each other. The screen shows frontal views of
each person from the table top up so that facial expressions and gestures of both partners
can be seen clearly and simultaneously. The audio allows for qualitative analysis of
prosodic features.
44
Tasks.
Tasks similar to the ones used in Coates' study were presented to the subjects for
two reasons (1) to allow comparison with her study and (2) because they seemed to be
tasks that elicit irony well. Although they are similar to the ones used in the pilot study,
some changes were made and so they are outlined again as follows;
a) "Plan a full course meal made of really awful foods that both of you (and probably
others) dislike. Discuss what this meal should consist of. Then both of you should decide
who you would serve this meal to. How you would issue the invitation?"
b) Pictures of seven bizarre-looking outfits fi’om a ‘T4ational Enquirer” feature o f the ten
worst dresses were given along with the instructions, "Both o f you are to look at these
pictures, (i) Agree upon the three worst-looking outfits and discuss why you think so. (ii)
If female: Decide which of these three outfits you would wear if you had to and where
would you wear it. (iii) If male: Decide which of these three worst outfits you would give
as a present and who you would give it to.”
c) Each person looks at three pictures. "Look at these pictures together. Talk about what
you see in the pictures and give your opinion about the situations." One is of a wedding
taking place on a roller coaster (again from the “National Enquirer”), the second is of a
woman impersonating the Queen doing her ironing, and the third is an advertisement
depicting ridiculously dressed people at a pre-Christmas sale.
45
d) "Think of a holiday plan made up of places and activities that both of you (and probably
others) agree would be awful. Talk about what this holiday would be. Then think of who
you would like to send on this holiday. How would you encourage that person to go?"
As Coates summarized, at least two o f the tasks involve "describing or telling
something absurd" (p. 28) (such as, talking about pictures of bizarrely dressed women, or
describing a silly picture from a paper such as the “National Enquirer”) while the other
two tasks create "an incongruity between what subjects were asked to do and what they
normally do" (p.28) (e.g., planning a meal of disliked foods or a holiday consisting of
disliked places and activities). Each dyad performed the four tasks to produce a video
approximately fifteen to twenty minutes long.
The first review of the data suggested that the third task involving the description
of silly pictures did not yield many instances so rather than using valuable time rescoring
something that does not add to the information already available, this task was eliminated
from the data set. Discourse analysis can be labour intensive so it makes sense to
concentrate resources on the material that yields the most information. As Potter &
Wetherell (1987) state.
Discourse analysis, at least at present, is an extremely labour-intensive approach... There is a danger here o f getting bogged down in too much data and not being able to let the linguistic detail emerge from the mountain of texts.(p.l61)
46
Neuropsychological Measures.
To further explore the abilities that may be reduced in those subjects having
difiBculty comprehending irony the following, neuropsychological tests were administered
to the three groups of subjects to investigate possible relationships.
1) Picture Matching Task.
The Picture Matching task involved practice pictures from the ACTS and
Metaphor Picture subtest. Subjects were shown a picture and asked to match it to one of
four choices. This task was used to help screen out subjects with visual acuity too poor to
recognize pictures. It also helped sensitize the examiner to those subjects who may have
had a visual field cut or neglect in which case an adaptation in the presentation of stimuli
could be made. It also acted as a training method to prepare subjects for the amount of
attention to detail required for later tasks.
2) Victoria Emotion Recognition Test.
The Victoria Emotion Recognicion Test (VERT; Mountain, 1993) was used to
investigate the ability to recognize intonational patterns and facial expressions. A pilot
study indicated that this measure was preferable to the Profile of Nonverbal Sensitivity
(PONS: Rosenthal, Hall, DiMatteo, Rogers, and Archer 1979) because of ease of
administration, reduced administration time, and fewer complaints from subjects regarding
difficulty of judgements. Mountain (1993) critiqued the PONS in her dissertation as being
‘Very long and not consistent with the materials and methodology used in experimental
47
studies of deficits in recognition of emotion” (p.29). The VERT involves three sections 1)
a visual subtest wherein pairs of photographs depicting the four emotions, happy, angry,
sad, and afraid, are presented. Subjects are requested to indicate whether the pictures are
the same or different in intensity and emotion and to identify the intensity and emotion of
each picture; 2) an auditory subtest in which two taped phrases o f nonsense words are
presented with the same instructions as the visual subtest; and 3) an auditory/visual subtest
in which a photograph and taped phrase are presented simultaneously with similar
instructions to the previous two subtests. During the pilot study, subjects were found to
have difficulty with the auditory subtest. They encountered difiBculty in retaining both
phrases in mind in order to make the necessary judgements and fi"equently requested
repetitions o f the stimuli. Thus, it was decided that this subtest would be altered to
present one phrase at a time. This eliminated the measure of judging whether the phrases
were the same or different; only the identification score was obtained. Because all three
groups would have the test presented in the same way and because comparisons were to
be made with the control group’s performance rather than with the norms provided with
the test, this change was deemed to be preferable to frustrating the subjects.
3) Symbol Digit Modalities Test
Another contributing factor may be reduced speed of processing and so the
Symbol Digit Modalities Test (oral version) (SDMT; Smith, 1973) was used as a measure
48
This test was found by Ponsford and Kinsella (1992) to be the "best single measure of the
deficit in speed of information processing" (p. 830). It also had the advantage o f avoiding
reduced performance due to hemiparesis or poor motor control. The test has a series of
nine symbols paired with numbers at the top of the page (similar to the Digit Symbol
Subtest on the WAIS-R). The symbols are arranged below in random order with blank
boxes beneath each symbol. The subject must identify orally the required digits to match
each symbol as quickly as possible for a period of ninety seconds. The examiner rather
than the subject writes the digit in the box.
4) Right Hemisphere Language Battery
Another possible explanation for difiBculty comprehending irony may be a
reduced ability to understand nonliteral or figurative language. The Metaphor Picture
subtest from the Right Hemisphere Language Battery (Bryan, 1989) was used as a
measure of this ability. This subtest involves choosing fi'om a series of four line drawings
the picture that best matches a sentence containing a metaphor (e.g., “He was very busy so
she gave him a hand.”). The choices include a metaphorical meaning, a literal meaning,
and two foils. The choice of this subtest with its pictorial stimuli and multiple choice
format was an attempt to reduce any difficulty the LHD group may have had due to
expressive difficulties.
49
In addition, the other subtests of the Right Hemisphere Language Battery
(Written Metaphors, Comprehension of Inferred Meaning, and Appreciation of Humour)
were presented to the subjects for further information. These measures were not used for
statistical comparisons but instead were included as additional information regarding the
abilities of the subjects and are elaborated upon in the discussion section of the study. In
the Written Metaphor subtest, the subjects are presented with a written metaphor and four
possible choices. The metaphor and choices are read to the subject and they are requested
to choose the one that is closest in meaning to the original stimulus. The choices include a
metaphoric meaning, a literal interpretation and two foils. The Inference subtest involves
a short written paragraph that is read to the subjects with four questions which request
information that can be inferred from the paragraph. The Humour subtest presents a joke
in written format that again is read to the subject. The subject is then required to choose
the fiinny ending for the joke from a set of four possibilities.
Questionnaires
Subjects and families were asked to complete a questionnaire regarding the
subject’s use of language (pragmatics) in situations that they have encountered in daily
life (see appendix for questionnaire). The problems addressed in the questionnaire are not
those that are typically associated with aphasia which involves more overt receptive and
expressive language difficulties. Instead, they are questions related to the recognition and
50
use of humour, whether the subject varies prosody or speaks in a monotone, the ability to
recognize when someone has misunderstood, and so on. Aphasie patients may or may not
have these communication problems. The results of these questionnaires were compared
to the statistical results o f the study to see whether there is any ecological validity to the
study, that is, if one group is found to be significantly different, that this difference
corresponds to a perceived difficulty in everyday life.
Procedure
Potential participants for the control group and as conversational partners for the
post-stroke individuals were solicited through posters or letters (see appendix for content)
to various organizations that had a high senior citizen membership (i.e., over age 50) and
by word-of-mouth. Names and addresses of potential CVA subjects were obtained from
hospital records. These people were contacted by letter that provided similar information
to that in the poster and were informed that they would receive a telephone call asking if
they wished to participate. The subjects were informed that the videotaping would require
a visit to the university but that the testing could occur either at the university or in their
homes. Because of logistics, some received the testing prior to the videotaping and others
vice versa. Again because of logistics, no attempt was made to randomize or control this
factor. It depended on a variety of circumstances including transportation, time
commitment, and so on. Some subjects completed the testing and videotaping on the
51
same day while others required two appointments at varying intersession periods. Prior to
the testing or videotaping, whichever occurred first, the participants read and completed
an information and consent form (see appendix). When necessary, this form was read to
the participant.
The videotaping portion o f the study occurred at the Human Interaction Lab in
the Psychology Department o f the University of Victoria. Prior to the conversation, the
participants were briefed as to the nature o f the conversation. They were informed that
the topics were not serious and that they were meant to be fUn. Each topic was written on
a card in separate file folders. These were read to the participants and clarifications that
were needed were provided at that point. They were told that most participants took
about fifteen minutes for all four topics but that there was no time limit. When they had
exhausted discussing one topic, they were to proceed to the next. At the end of the
videotaping the participants were encouraged to observe a portion o f their videotape to
allow them to make an informed decision regarding the use of the videotape by the
researcher (see appendix).
The neuropsychology tests were completed in the same order with all subjects.
Factors that influenced the choice of order included subject motivation and ease of
administration. The order was Picture Matching, Symbol Digit Modalities Test, Victoria
Emotion Recognition Test, Right Hemisphere Language Battery, Raven’s Coloured
Progressive Matrices, and Auditory Comprehension Test for Sentences.
52
Scoring o f Videotapes
After the conversational data was collected via videotape, it was analyzed for
instances of irony using the scoring rules developed by Coates as a basis. The rules had to
be expanded upon and clarified in order to develop an objective and reliable measure (see
appendix for an outline o f the rules). These instances were then scored as to whether or
not they were successful (see appendix for the decision tree).
Reliabilitv o f Scoring
A measure of inteijudge reliability is required because of the subjective nature of
the decisions required for scoring the videotapes; “we require evidence that the observer
saw the behavior of interest, categorized it correctly, and recorded this accurately”
(Bavelas, 1978, p. 222). Ideally there should be 90 to 100 per cent agreement between
two independent scorers using the same scoring rules on the data in order to produce a
minimal amount o f error variance in the data due to scoring error.
A second observer was used to ascertain the reliability of the videotape scoring.
Training was provided through reading Appendix B and C fi'om Coates' thesis for
familiarity in how to identify the various types of instances of irony, looking at examples
of successes and failures from the pilot study, and practicing the scoring of the pilot
videotapes.

53
Because the reliability between the two scorers was initially low in this practice
phase, the rules were examined and clarified to help improve the reliability. Clarifications
included adding examples of what was to be considered an instance and what was not and
a decision tree to be used for ambiguous situations. It was important for both scorers to
diligently follow these rules. After revising the rules, both scorers scored a few sections
together. Because reliability was still not high enough, the more subtle types of irony
(hyperbole and minimizations) were eliminated from the scoring rules. As stated, these
types are more subtle and, thus, easily missed by overhearers. We, as normal-functioning
communicators, are extremely adept at understanding nonliteral language which forms a
large component o f our daily communication. Because nonliteral language is so frequent
and often so easily interpreted we may not notice that the words do not convey their literal
meaning. Thus, although the two examiners had high agreement when working in
conjunction, some of these more subtle examples slipped by when each was listening
separately.
Once it was established that both scorers were looking for the same types of
examples and were achieving a high rate o f reliability, some practice sections were scored
separately. On the final practice section, the two scorers achieved 92 per cent agreement
which was judged to be high enough to justify going to the next step. This involved
having the second examiner independently score a stratified random sample of the data
54
To ascertain the reliability between the two scorers, the percentage agreement
was calculated by dividing the number of instances of spontaneous irony agreed upon by
both scorers by all possible instances identified by either scorer. This method is in fact a
conservative measure of the amount of agreement between the two scorers. Considering
only the instances of irony does not take into account all the utterances for which the two
scorers agreed were not irony. Thus, if the total number of utterances agreed upon,
whether they were ironic or not, was divided by the total number o f utterances in the
sample used for the reliability measure, then well over 90 per cent agreement would have
been achieved. However, it is possible that this 90 per cent agreement level may consist
primarily of the nonironic utterances and that any discrepancies between the two scorers
may consist o f mainly the ironic statements. To avoid achieving a spurious measure of
agreement, the more conservative approach was used, resulting in a level o f 78 per cent
agreement.
As discussed by Schober and Clark (1989), overhearers are at a disadvantage in
understanding conversations from which they are excluded. The two scorers would be
considered overhearers and even though they are able to observe and listen to the speakers
and can stop the tape and relisten at any point, they are not a part o f the collaboration that
exists between the two speakers. Schober and Clark (1989) suggest that whenever
“grounding” (i.e., establishing a mutual framework of understanding) is a component of
the communication, that overhearers will be at a disadvantage. They found that
55
participants in a conversation in which the task involved one of the speakers matching a
sequence o f tanagram shapes to his/her partner’s hidden sequence, were 99 per cent
accurate in their matching. However, overhearers who listened to the conversation but
did not participate were only 88 per cent accurate after the third trial whereas late
overhearers (i.e., they heard the conversation fi'om trial 3 onwards but not the earlier
trials) were only 68 per cent accurate. According to Coates’ hypothesis, calibration or
grounding is a feature o f irony and thus is a relevant consideration in this study. This
overhearer disadvantage may have played a role in reducing the reliability measure from
the ideal level o f at least 90 per cent agreement to the actual level o f 78 per cent.
Because the reliability was less than this ideal level and, as described above, the instances
are often quite subtle and easy to miss, the scoring of the whole set o f data was double
checked by the second scorer and discrepancies were eliminated through joint discussion.
Any ambiguous ones were judged to be non-scorable and eliminated from the data sample
The use of two scorers was thought to be a necessary protection to ensure that a
consistent set of instances of irony was fully captured. Unlike Coates’ (1991) study which
was a descriptive one that did not claim to have identified all instances of irony within the
data set, this study is a quantitative one which is attempting to show differences between
the three groups in terms of the rate of irony. Thus, consistency in analyzing the three
groups is important.
56
Reliability of the judgements regarding success and failure of the ironic instances
between the two scorers was determined by calculating the percentage agreement between
the two observers for the instances o f irony which both had identified. There was 100 per
cent agreement between the two scorers with these judgements. The reason perhaps for
the higher reliability in determining success and failure as opposed to the actual
identification may be that the rules were biased in favor o f the overhearers’ interpretation.
If it was not clear from the overhearer’s perspective whether or not the instance was
successful then it was considered a failure. The decision for this bias was made because it
was felt that if it was not clear to the scorer, then it likely was also not clear to the speaker
and thus should be considered a failure because all aspects o f the ironic instance (i.e.,
calibration, delivery, acknowledgement, closure) were not engaged. For example, often
the lack of acknowledgement on the part of the listener forced the instance to be
considered a failure. It was thought that if the listener did not acknowledge the irony in
some way, then the speaker would not be able to judge that the s/he had been understood.
However, it is possible that if the two interlocutors had been consulted they may have had
a different view from that o f the overhearers about the rate of success. Thus, the
reliability between speakers and overhearers quite likely would be less than the 100%
agreement found between the two scorers (or overhearers).

57
Statistical Analyses and Hypotheses
The measures determined from the videotapes for the study consist of; 1 ) rate of
instances o f irony created, and 2) percentage o f instances successfully comprehended.
Rate was used rather than the total number o f instances in order to equalize the differences
in speaking time. That is, one dyad may have more instances merely because they spoke
for a longer period of time during the task. Thus, rate was calculated by dividing the
number of instances by the time period (number of minutes). The unsuccessful instances
were also examined in terms of the four phases suggested by Coates (calibration, delivery,
acknowledgement, and closure) to determine at what stage the breakdowns occurred.
The hypotheses that were tested are as follows:
1. The dyads in the RHD group will have a lower rate of spontaneous irony than those in
the LHD or NHD groups.
2. The dyads in the RHD group will have a lower percentage of irony that is successful
than those in the LHD or NHD groups.
3. The total score on the Victoria Emotion Recognition Test (VERT) will account for a
significant portion of the variance in the rate of irony produced by the dyads.
4. The total score on the VERT will account for a significant portion of the variance in
the percentage o f irony that is successful for each dyad. Scores on the Symbol Digit
Modalities Test (SDMT) and the Matching Metaphors to Pictures from the Right
Hemisphere Language Battery (RHLB) will also account for some of the variance
58
5. Both LHD and RHD subjects will have lower scores on the SDMT (i.e., will show a
deficit when compared to NHD subjects).
6. RHD subjects, as a group, will score lower on the VERT - Visual Identification of
Emotion than LHD or NHD subjects.
7. RHD subjects, as a group, will score lower on the VERT - Auditory Identification of
Emotion than LHD or NHD subjects.
8. RHD subjects, as a group, will score lower on the RHLB - Matching Metaphors to
Pictures than LHD or NHD subjects.

59
CHAPTER THREE
Results
SPSS for Windows 6.0 was used to calculate the statistics and an alpha level of
.05, unless otherwise stated, was the test for significance.
Description o f Conversations
The average length of the conversation period was 13.27 minutes. Mean time
spent talking about each o f the topics was: meal planning, 4.84 minutes; outfits, 3.30
minutes, holiday plan, 5.16 minutes. Table 13 lists the means and standard deviations for
each of the three groups in terms of length of spoken time, number o f ironic instances, and
rate of ironic instances. The rate was calculated by dividing the number of instances by
the time and was used as the comparison measure in order to equalize the time taken
amongst the dyads for each of the tasks.
Table 13Summarv of Group Results for Conversational Measures
Mean (SD)Meal Outfits Holiday Total
Grp Time(tnin.)
Irony(n)
Rate Time(min.)
Irony(n)
Rate Time(min.)
Irony(n)
Rate Time(min.)
Irony(n)
Rale
N 5.82(2.39)
3.70(2.11)
0.68(0.33)
3.17(1.31)
2.00(1.49)
0.70(0.54)
5.47(1.59)
5.80(4.37)
1.08(0.80)
14.45(3.98)
11.50(5.56)
0.80(0.35)
Lt 4.56(1.18)
2.67(1.73)
0.58(0.29)
3.76(1.25)
1.89(1.90)
0.56(0.61)
4.77(0.58)
2.44(2.13)
0.51(0.42)
13.01(1.74)
7.00(3.43)
0.51(0.42)
Rt 4.03(1.31)
2.33(2.65)
0.55(0.59)
2.99(0.86)
1.44(0.88)
0.47(0.30)
5.20(2.49)
2.22(2.44)
0.60(0.66)
12.22(3.02)
6.00(4.24)
0.60(0.66)
60
Group Differences
Hypothesis 1 : The dyads in the RHD group will have a lower rate o f spontaneous irony
than those in the LHD or NHD groups.
A one-way analysis of variance was used to determine whether there was a
significant difference amongst the groups in terms of rate of instances of irony. The overall
between group difference was found to be nonsignificant (F(2, 25) = 1.7482, p = . 19).
When the normal control group was contrasted with the two clinical groups combined, the
difference was significant (T(25) = 1.860, p = .04, one-tailed test''), however, the
difference between the two clinical groups was not significant (T(25) = .189, p = .85).
Therefore the hypothesis was not supported by the data.
The number of subjects in each group was small. A power analysis suggested
that to show the large effect size that is expected given the above results (i.e.. Effect size =
f = ^ , = 0.37^) at a power level o f 0.8, 25 dyads per group would be requiredV 1-7*
(Cohen, 1988, p. 384). Obtaining these many subjects is not a feasible option both
Because k=2 for this contrast. The ANOVA is virtually the same as a t-test and thus an expected direction can be specified in advance allowing a one-tailed test to be used.* For a discussion of what constitutes a “small”, “medium”, or “large” effect size and how these relate to correlation ratios and proportion of variance, see Cohen (1988, pp. 280-288). He defines effect size as “the degree to which the phenomenon is present in the population” (p. 9) and provides tables to determine appropriate sample sizes given the effect size expected, degrees of freedom dependent on the number of groups in the study, alpha level (e.g., .05, .01), and power level. Cohen suggests that in socio-behavioural research that large effect sizes are not common (see p. 284). He also suggests using a power level of .8 as a means of protection against Type II errors (b = .2). Thus with df =2, a = .05, p = .8, f = .40; the above value was obtained from the appropriate table (p. 384).
61
because of the lack of a large enough subject pool to draw upon and because the analysis
is so labour intensive. Thus, further subject recruitment was not instigated. Instead the
dyads were examined individually to determine whether any patterns were evident.
Hypothesis 2: The dyads in the RHD group will have a lower percentage of irony that is
successful than those in the LHD or NHD groups.
The percentage of successfully communicated ironic instances was calculated for
each group. The NHD group produced 100/115 (87%); the LHD group produced 59/63
(94%), and the RHD group produced 49/54 (91%) successful instances. Thus, there does
not appear to be a significant difference amongst the three groups in terms of overall
percentage of success.
Hypothesis 3 : The total score on the Victoria Emotion Recognition Test (VERT) will
account for a significant portion of the variance in the rate of irony produced by the dyads.
A multiple regression analysis was conducted to determine which, if any, of the
test results contributed more to the variance in irony production amongst the subjects.
The rate o f spontaneous irony for each dyad was used as the dependent variable.
Education level and the scores on the Raven’s Coloured Progressive Matrices (as a gross
measure of IQ level) were entered as a block first in the multiple regression equation.
These were thought of almost as control measures with the view of determining what
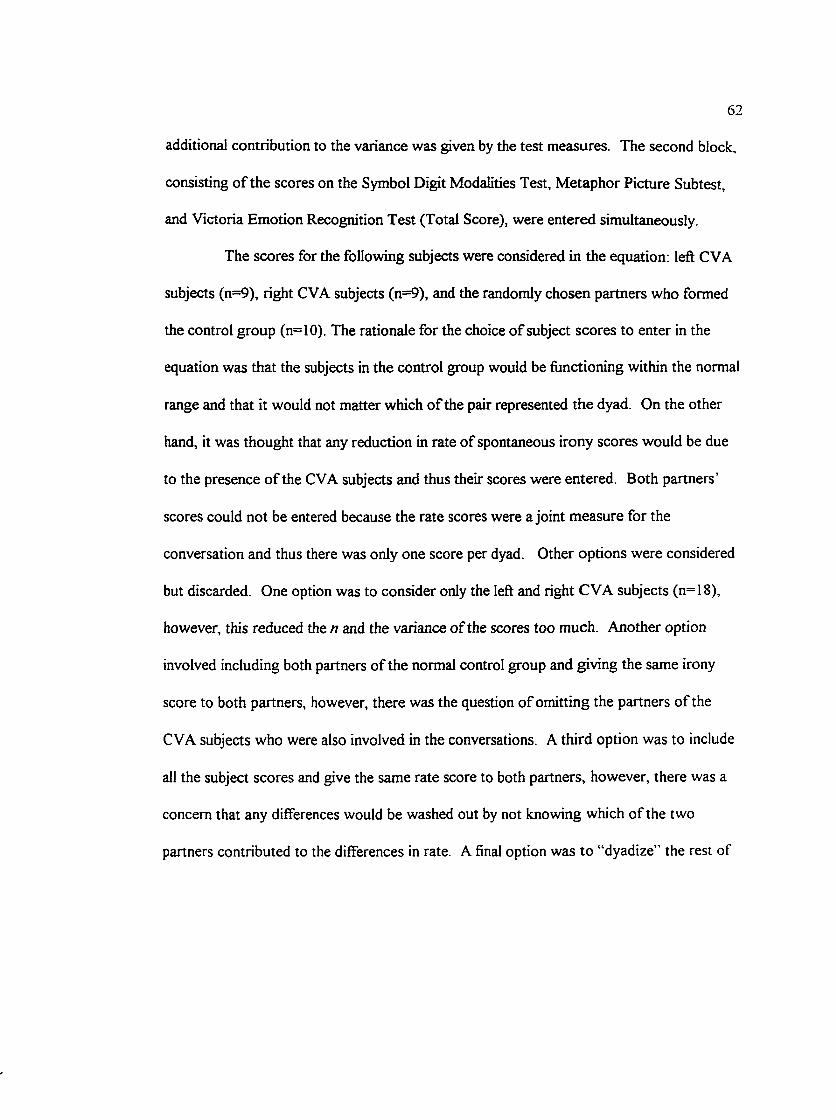
62
additional contribution to the variance was given by the test measures. The second block,
consisting of the scores on the Symbol Digit Modalities Test, Metaphor Picture Subtest,
and Victoria Emotion Recognition Test (Total Score), were entered simultaneously.
The scores for the following subjects were considered in the equation: left CVA
subjects (n=9), right CVA subjects (n=9), and the randomly chosen partners who formed
the control group (n=10). The rationale for the choice of subject scores to enter in the
equation was that the subjects in the control group would be functioning within the normal
range and that it would not matter which of the pair represented the dyad. On the other
hand, it was thought that any reduction in rate of spontaneous irony scores would be due
to the presence o f the CVA subjects and thus their scores were entered. Both partners’
scores could not be entered because the rate scores were a joint measure for the
conversation and thus there was only one score per dyad. Other options were considered
but discarded. One option was to consider only the left and right CVA subjects (n=18),
however, this reduced the n and the variance of the scores too much. Another option
involved including both partners of the normal control group and giving the same irony
score to both partners, however, there was the question o f omitting the partners of the
CVA subjects who were also involved in the conversations. A third option was to include
all the subject scores and give the same rate score to both partners, however, there was a
concern that any differences would be washed out by not knowing which of the two
partners contributed to the differences in rate. A final option was to “dyadize” the rest of
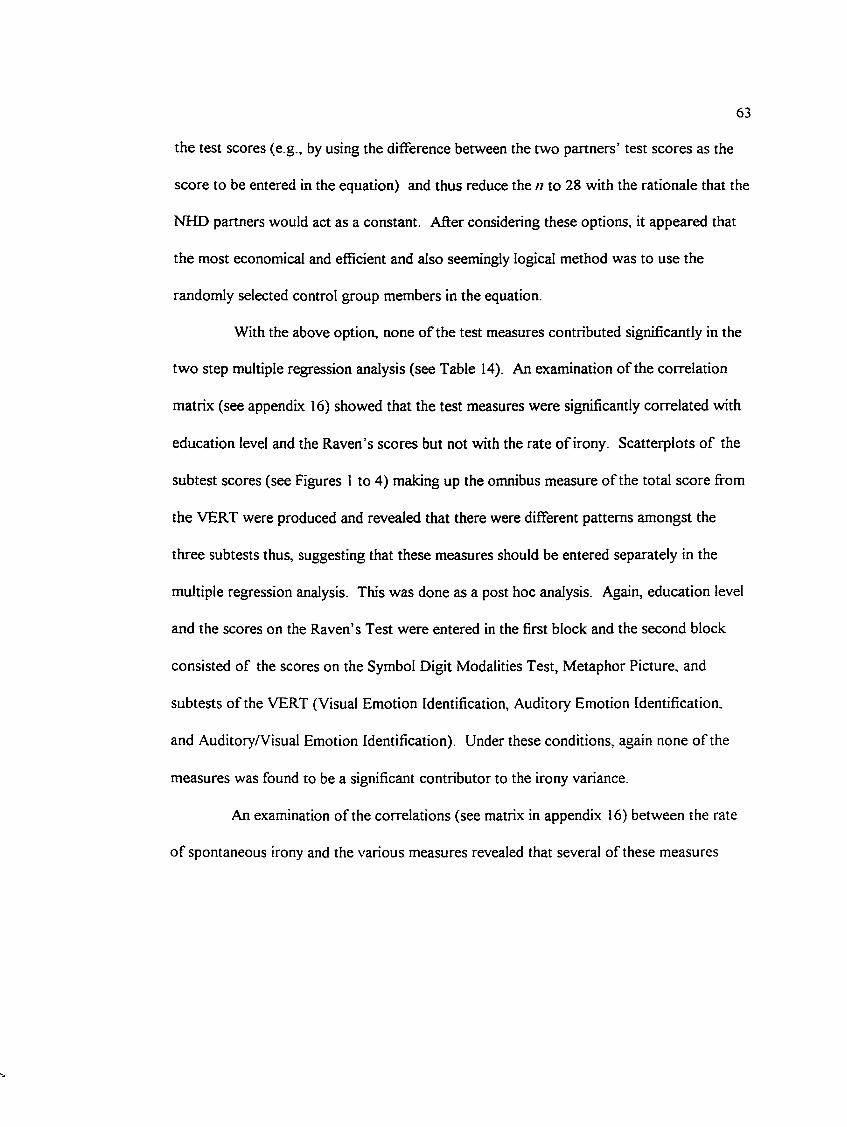
63
the test scores (e.g., by using the difference between the two partners’ test scores as the
score to be entered in the equation) and thus reduce the n to 28 with the rationale that the
NHD partners would act as a constant. After considering these options, it appeared that
the most economical and efficient and also seemingly logical method was to use the
randomly selected control group members in the equation.
With the above option, none of the test measures contributed significantly in the
two step multiple regression analysis (see Table 14). An examination of the correlation
matrix (see appendix 16) showed that the test measures were significantly correlated with
education level and the Raven’s scores but not with the rate o f irony. Scatterplots o f the
subtest scores (see Figures 1 to 4) making up the omnibus measure of the total score from
the VERT were produced and revealed that there were different patterns amongst the
three subtests thus, suggesting that these measures should be entered separately in the
multiple regression analysis. This was done as a post hoc analysis. Again, education level
and the scores on the Raven’s Test were entered in the first block and the second block
consisted of the scores on the Symbol Digit Modalities Test, Metaphor Picture, and
subtests of the VERT (Visual Emotion Identification, Auditory Emotion Identification,
and Auditory/Visual Emotion Identification). Under these conditions, again none of the
measures was found to be a significant contributor to the irony variance.
An examination of the correlations (see matrix in appendix 16) between the rate
o f spontaneous irony and the various measures revealed that several of these measures
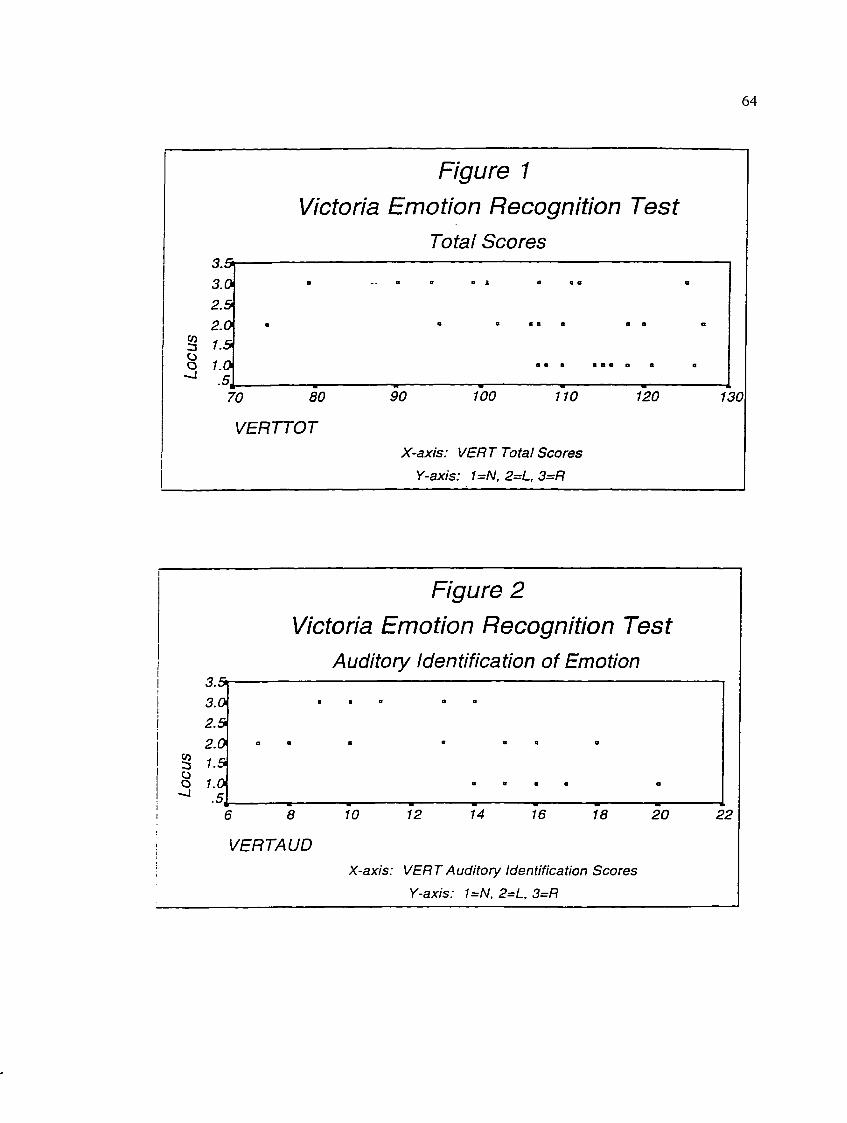
3 .53.02 .52.0
3 y.5 o 1.0
Figure 1 Victoria Emotion Recognition Test
Total Scores
70 80
VERTTOT
90 100 110 120
X-axis: VERT Total Scores
Y-axis: 1=N, 2=L, 3=R
64
a # » # a * o o a
130
Figure 2 Victoria Emotion Recognition Test
Auditory Identification of Emotion
8
3 .5 -3.02.52.01.51.0.5 ,.
6 8
VERTAUD
10 12 14 16 18 20
X-axis: VERT Auditory Identification Scores Y-axis: 1=N, 2=L, 3=R
22
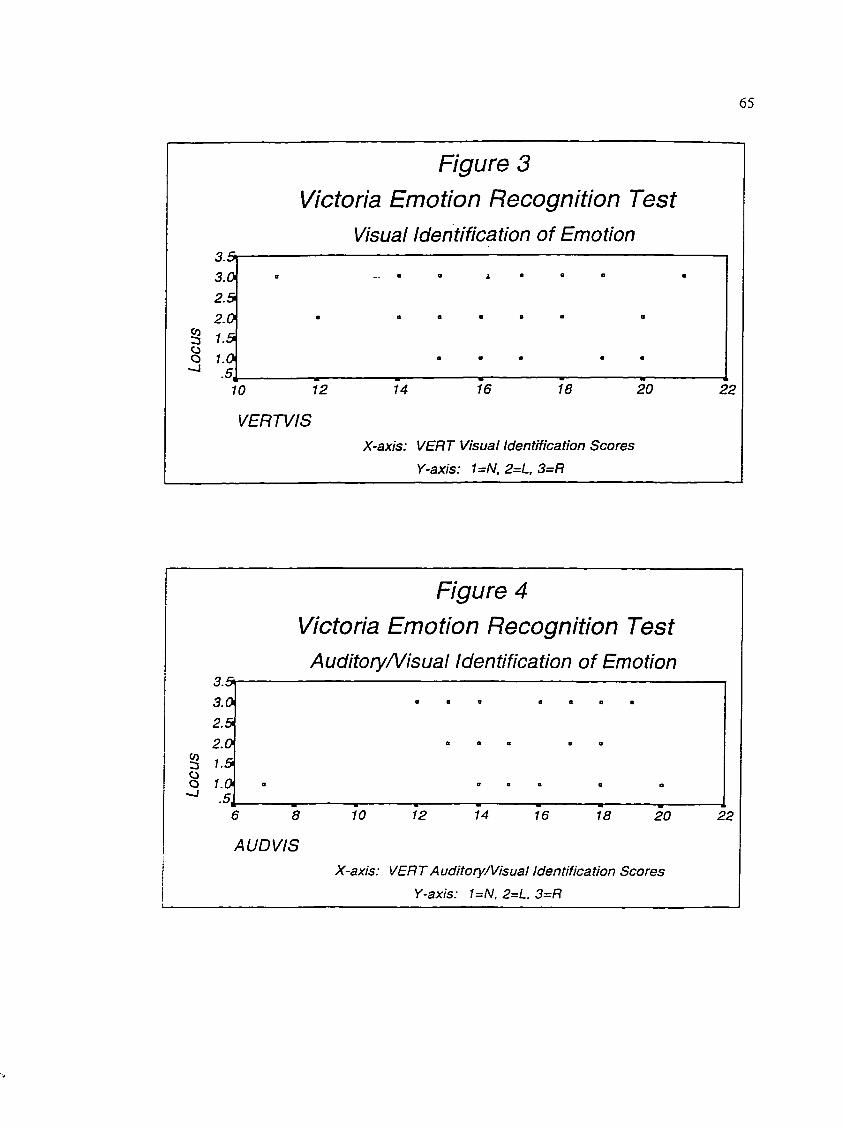
65
Figure 3 Victoria Emotion Recognition Test
Visual identification of Emotion3.5i3.02.52.0
g 1.5Clo 1.0
A10 12 14 16 18 20 22
VERTViSX-axis: VERT Visual Identification Scores
Y-axis: UN, 2=L, 3=R
Figure 4Victoria Emotion Recognition Test
Auditory/Visuai identification of Emotion3.5»
3.02.52.0
CO3 1.5O 1.0
^ .5,6 8 10 12 14 16 18 20 22
AU D VISX-axis: VERT AuditoryA/isuai Identification Scores
Y-axis: UN, 2=L, 3=R
66
were highly correlated with each other. Because of this factor and the fact that the
method of regression used is a highly conservative one, there is less chance of one of the
tests being shown as a significant contributor on its own. The correlation matrix also
showed that age (r = -.391, p = .039) and the Auditory Emotion Identification subtest (r =
.4719, p = .011) were significantly correlated with the rate of irony. To determine which
of the measures and the demographic variables was the best predictor of the rate of
spontaneous irony, a stepwise multiple regression analysis was conducted. Education
level, the Raven’s scores, and age were entered as a first block and SDMT, Metaphor
Picture, Auditory Emotion Identification, Visual Emotion Identification, and
Auditory/Visual Emotion Identification were entered in the second block in a stepwise
fashion. This analysis revealed that age contributed significantly to the rate of irony
variance (see Table 15).
Hypothesis 4; The total score on the VERT will account for a significant portion of the
variance in the percentage of irony that is successful for each dyad.
As above, the scores for the 9 LHD, 9 RHD, and 10 NHD control subjects were
considered in a hierarchical multiple regression analysis. The scores that were entered in
Step 1 in the equation were Education level and Raven’s Coloured Progressive Matrices
and in Step 2 were Symbol Digit Modalities Test, Metaphor Picture, Victoria Emotion
Recognition Test (Total Score). The percentage of successfully communicated
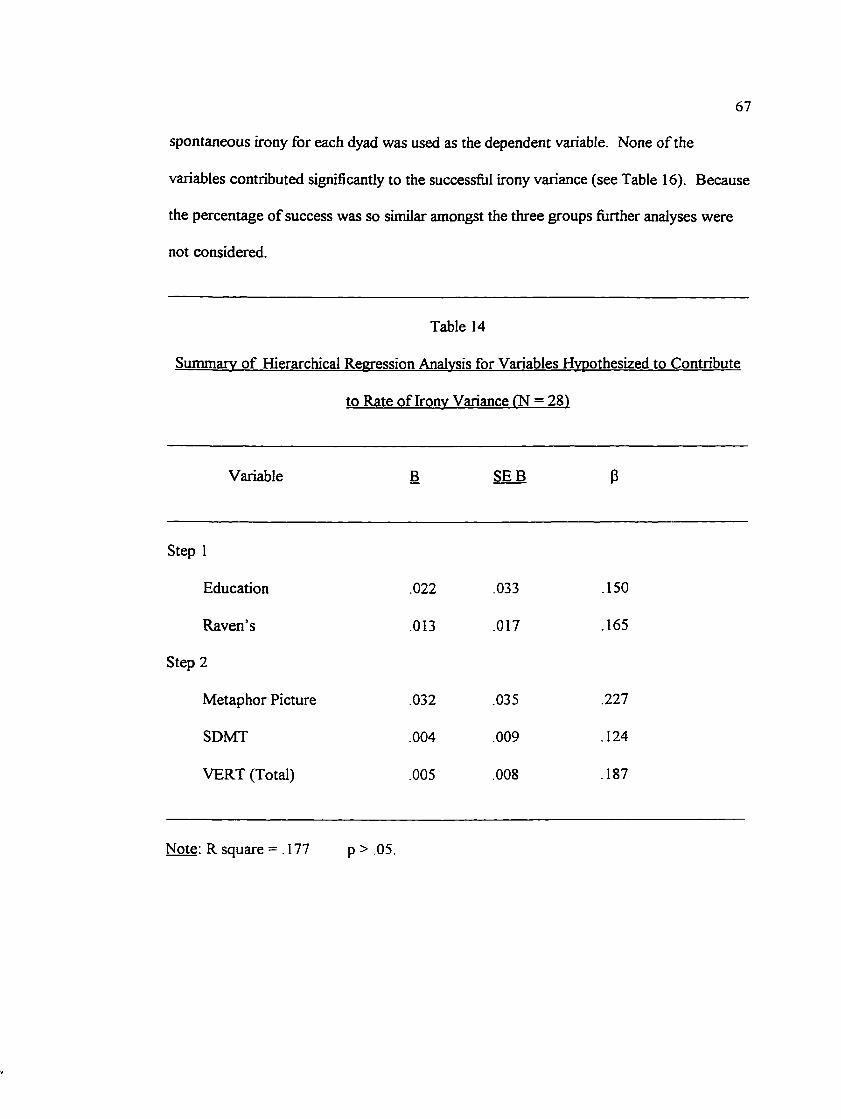
67
spontaneous irony for each dyad was used as the dependent variable. None of the
variables contributed significantly to the successful irony variance (see Table 16). Because
the percentage of success was so similar amongst the three groups further analyses were
not considered.
Table 14
Summary of Hierarchical Regression Analysis for Variables Hyoothesized to Contribute
to Rate of Irony Variance (N = 28)
Variable B SEE P
Step 1
Education .022 .033 .150
Rayen’s .013 .017 .165
Step 2
Metaphor Picture .032 .035 .227
SDMT .004 .009 .124
VERT (Total) .005 .008 .187
Note: R square = .177 p > .05.

68
Table 15
Summarv of Stepwise Regression Analysis for Variables Hypothesized to Contribute To
Rate o f Irony Variance ('n=28)
Variable B SEB 3
Step 1
Age -.023 Oil -384*
Education .032 .031 .219
Rayen’s .003 .017 .035
Step 2
No yariables entered/remoyed for this block.
Note: R Square = 210
* B < 0 5
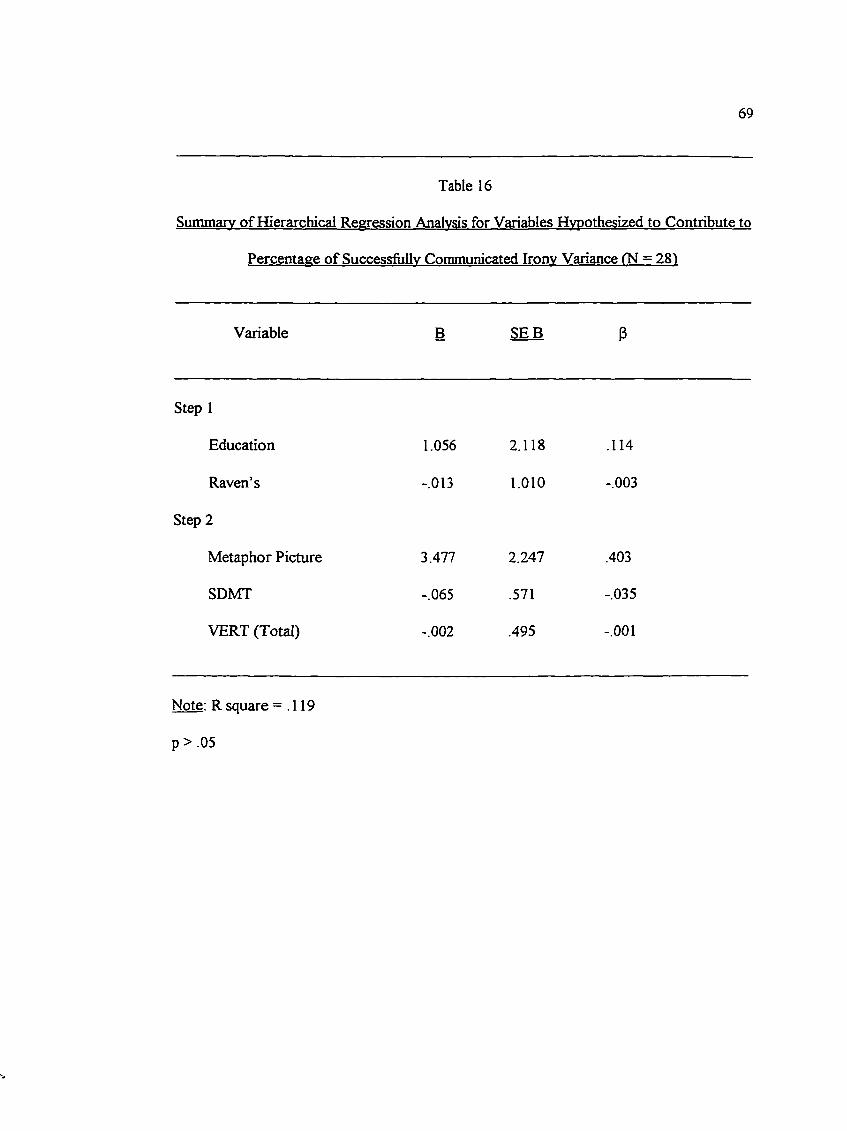
69
Table 16
Summarv o f Hierarchical Regression Analysis for Variables Hypothesized to Contribute to
Percentage of Successfully Communicated Irony Variance (N = 281
Variable B SEB 3
Step 1
Education 1.056 2.118 .114
Raven’s -.013 1.010 -.003
Step 2
Metaphor Picture 3.477 2.247 .403
SDMT -.065 .571 -.035
VERT (Total) -.002 .495 -.001
Note: R square =.119
p > .05
70
Remaining Hypotheses;
5. Both LHD and RHD subjects will have lower scores on the SDMT (i.e., will show a
deficit when compared to NHD subjects).
6. RHD subjects, as a group, will score lower on the VERT - Visual Identification of
Emotion than LHD or NHD subjects.
7. RHD subjects, as a group, will score lower on the VERT - Auditory Identification of
Emotion than LHD or NHD subjects.
8. RHD subjects, as a group, will score lower on the RHLB - Matching Metaphors to
Pictures than LHD or NHD subjects.
A one-way analysis o f variance was used to examine the group differences that
were hypothesized on the various neuropsychological measures (see Table 17). As can be
seen fi’om Table 17, the fifth hypothesis (i.e., that the clinical groups would have lower
scores on the SDMT than the NHD group) was supported by the data but hypotheses 6
through 8 were not.

71
Table 17Analysis of Variance for Neuropsychological Measures
Source df F T yalue (pooled variance)
Symbol Digit Modalities TestBetween Groups 2 3.2679*Within Group Error 25 (128.6382)NHD contrasted with LHD & RHD 25 2.499**LHD contrasted with RHD group 25 .540
Visual Identification of Emotion (VERT)Between Groups 2 .5361Within Group Error 25 (5.9396)NHD contrasted with LHD & RHD 25 1.017LHD contrasted with RHD group 25 -.193
Auditory Identification of Emotion (VERT)Between Groups 2 7.8165*Within Group Error 25 (6.9156)NHD contrasted with LHD & RHD 25 3.749**LHD contrasted with RHD group 25 1.255
Metaphor PictureBetween Groups 2 2.5401Within Group Error 25 (5.9840)NHD contrasted with LHD & RHD 25 1.935**LHD contrasted with RHD group 25 1.156
Note: Values enclosed in parentheses represent mean square errors.
*p < .05. **p < .05, one-tailed test.
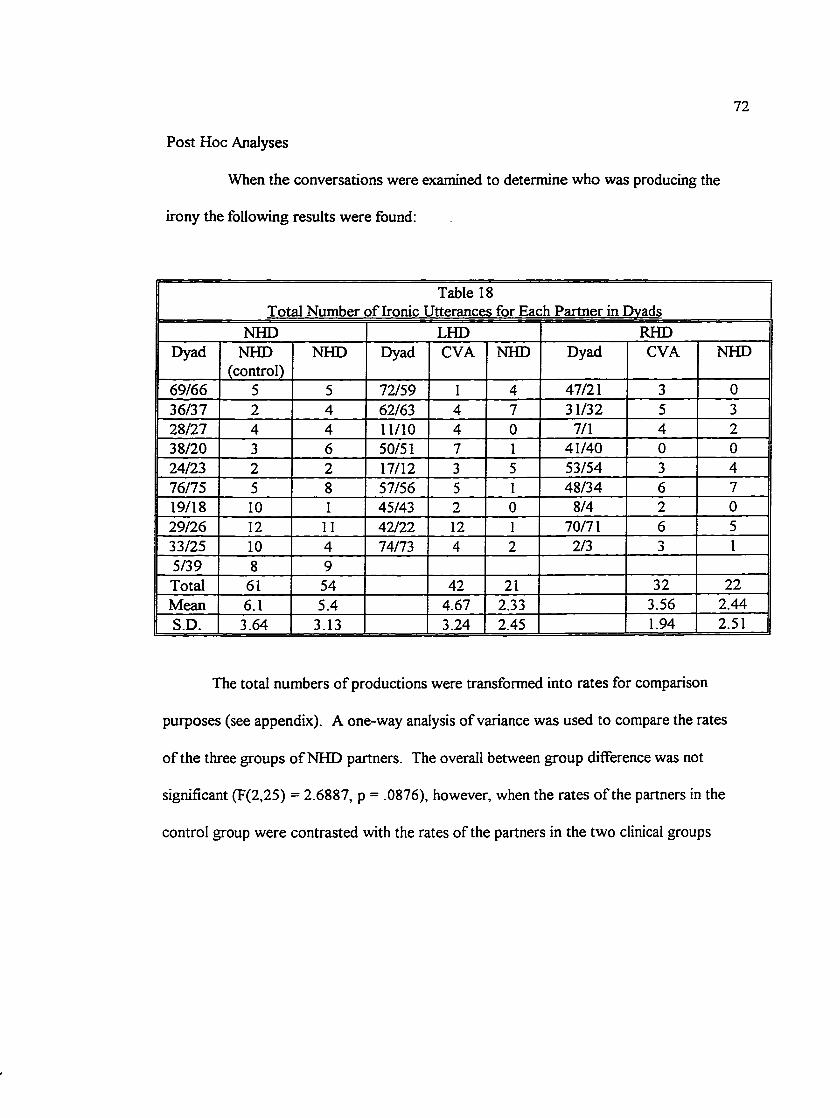
72
Post Hoc Analyses
When the conversations were examined to determine who was producing the
irony the following results were found:
Table 18Total Number o f Ironic Utterances for Each Partner in Dvads
NHD LHD RHDDyad NHD
(control)NHD Dyad CVA NHD Dyad CVA NHD
69/66 5 5 72/59 1 4 47/21 3 036/37 2 4 62/63 4 7 31/32 5 328/27 4 4 11/10 4 0 7/1 4 238/20 3 6 50/51 7 1 41/40 0 024/23 2 2 17/12 3 5 53/54 3 476/75 5 8 57/56 5 1 48/34 6 719/18 10 1 45/43 2 0 8/4 2 029/26 12 11 42/22 12 1 70/71 6 533/25 10 4 74/73 4 2 2/3 3 15/39 8 9Total 61 54 42 21 32 22Mean 6.1 5.4 4.67 2.33 3.56 2.44S.D. 3.64 3.13 3.24 2.45 1.94 2.51
The total numbers o f productions were transformed into rates for comparison
purposes (see appendix). A one-way analysis of variance was used to compare the rates
o f the three groups o f NHD partners. The overall between group difference was not
significant (F(2,25) = 2.6887, p = .0876), however, when the rates o f the partners in the
control group were contrasted with the rates of the partners in the two clinical groups

73
combined, the difference was significant (T(25) = 2.304, p = .030). There was no
significant difference between the rates of the partners in the two clinical groups (T(25) =
-.265, p = .793). When the rate o f irony of the clinical subjects was compared to that of
the NHD partners in the control group, there again was no significant difference in the
overall between group variance. When the clinical groups were combined and contrasted
with the NHD control subjects, there was no significant difference between them (T(25) =
.698, p = .491) and again no significant difference between the two groups of clinical
subjects (T(25) = .561, p = .579). Thus, it appears that the clinical subjects produce irony
at the same rate as normal subjects, however, their partners, for some reason, produce
irony at a significantly lower rate.
Individual Differences
A scatterplot (see Figure 5) of the rate of spontaneous irony indicated that five
dyads had a rate below the lowest score of the control group. These five dyads (see
Table 15) were examined in more detail to determine whether there was a significant
pattern. Two of the dyads were from the LHD group and the other three were from the
RHD group.
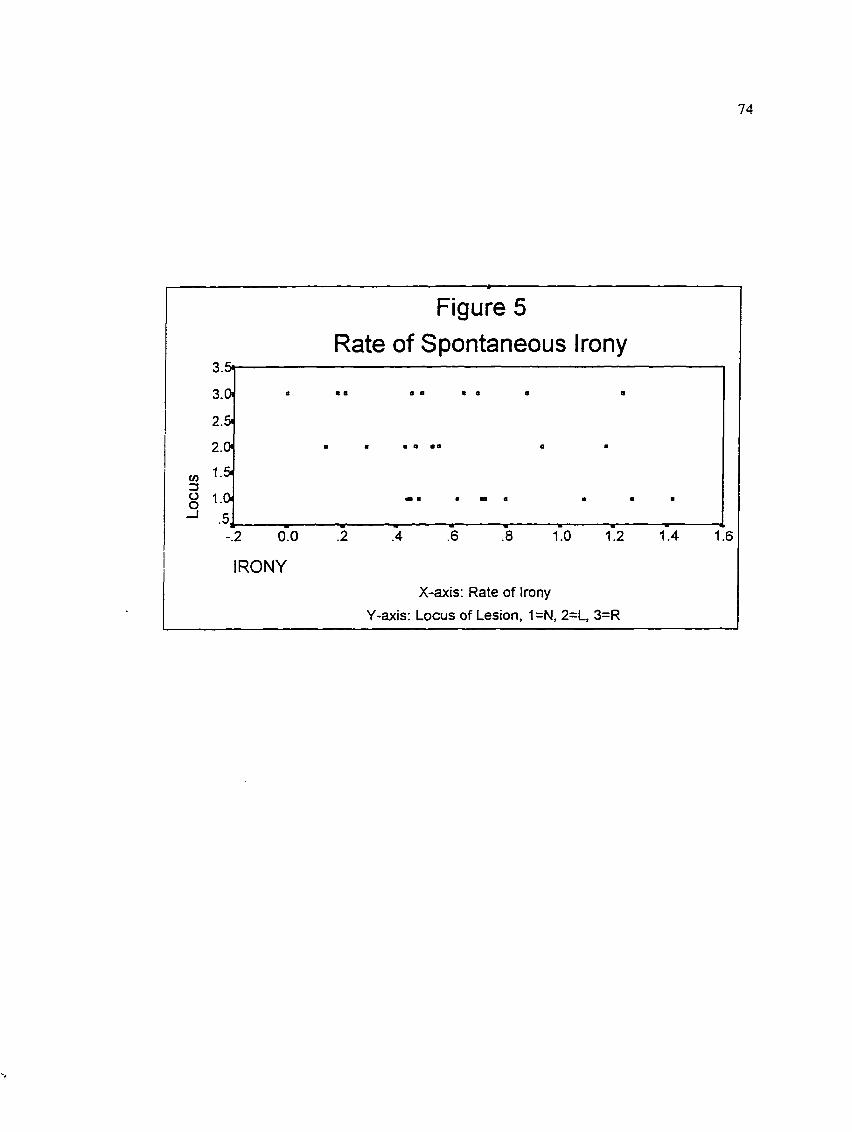
74
Figure 5 Rate of Spontaneous Irony
3.5i
3 .0
2.5.
2.0
U)3OO
—I1.0
2 6 8 1.0 1.4 1.62 0.0 1.24
IRONYX-axis: Rate of Irony
Y-axis: Locus of Lesion, 1=N, 2=L, 3=R
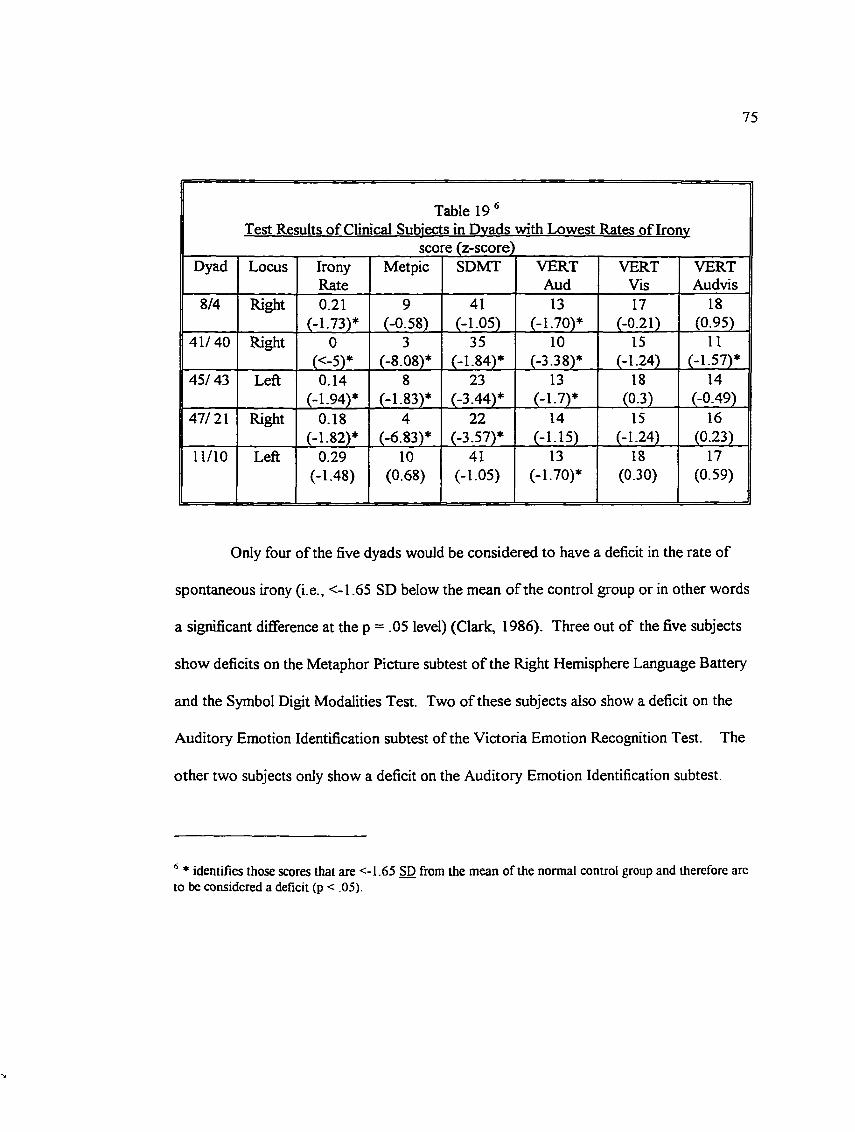
75
Table 19 ®Test Results o f Clinical Subjects in Dvads with Lowest Rates of Ironv
score (z-score)Dyad Locus Irony
RateMetpic SDMT VERT
AudVERT
VisVERTAudvis
8/4 Right 0.21(-1.73)*
9(-0.58)
41(-1.05)
13(-1.70)*
17(-0.21)
18(0.95)
41/40 Right 0(<-5)*
3(-8.08)*
35(-1.84)*
10(-3.38)*
IS(-1.24)
II(-1.57)*
45/ 43 Left 0.14(-1.94)*
8(-1.83)*
23(-3.44)*
13(-1.7)*
18(0 3) _
14(-0.49)
47/21 Right 0.18(-1.82)*
4(-6.83)*
22(-3.57)*
14(-1 15)
15(-1.24)
16(0.23)
11/10 Left 0.29(-1.48)
10(0.68)
41(-1.05)
13(-1.70)*
18(0.30)
17(0.59)
Only four of the five dyads would be considered to have a deficit in the rate of
spontaneous irony (i.e., <-1.65 SD below the mean of the control group or in other words
a significant difference at the p = .05 level) (Clark, 1986). Three out of the five subjects
show deficits on the Metaphor Picture subtest of the Right Hemisphere Language Battery
and the Symbol Digit Modalities Test. Two of these subjects also show a deficit on the
Auditory Emotion Identification subtest of the Victoria Emotion Recognition Test. The
other two subjects only show a deficit on the Auditory Emotion Identification subtest.
* identifies those scores that are <-1.65 SD from the mean of the normal control group and therefore are to be considered a deficit (p < .05).
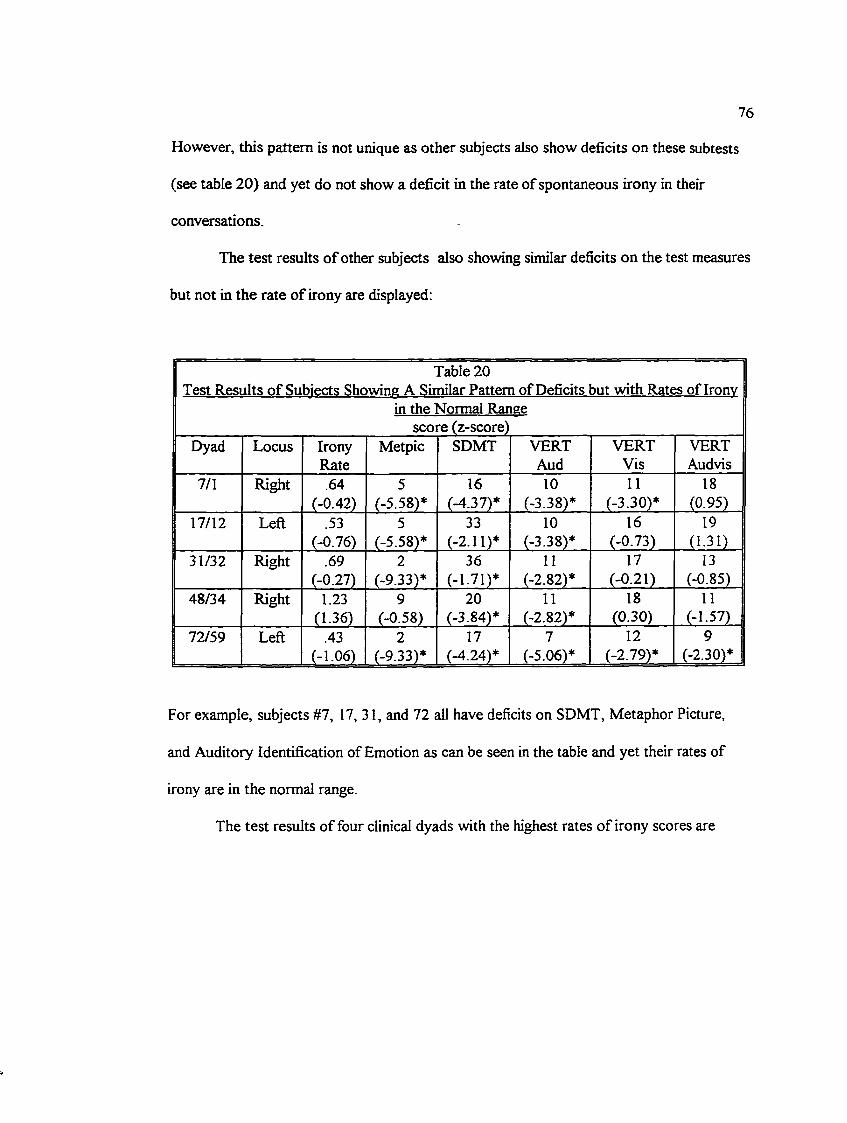
76
However, this pattern is not unique as other subjects also show deficits on these subtests
(see table 20) and yet do not show a deficit in the rate of spontaneous irony in their
conversations.
The test results o f other subjects also showing similar deficits on the test measures
but not in the rate o f irony are displayed:
Table 20Test Results o f Subiects Showine A Similar Pattern of Deficits but with Rates of Ironv
in the Normal Ranee score (z-score)
Dyad Locus IronyRate
Metpic SDMT VERTAud
VERTVis
VERTAudvis
7/1 Right .64(-0.42)
5(-5.58)*
16(-4.37)*
10(-3.38)*
11(-3.30)*
18(0.95)
17/12 Left .53(-0.76)
5(-5.58)*
33(-2.11)*
10(-3.38)*
16(-0.73)
19(1.31)
31/32 Right .69(-0.27)
2(-9.33)*
36(-1.71)*
11(-2.82)*
17(-0.21)
13(-0.85)
48/34 Right 1.23(1.36)
9(-0.58)
20(-3.84)*
11(-2.82)*
18(0.30)
11(-1.57)
72/59 Left .43(-1.06)
2(-9.33)*
17(-4.24)*
7(-5.06)*
12(-2.79)*
9(-2.30)*
For example, subjects #7, 17, 31, and 72 all have deficits on SDMT, Metaphor Picture,
and Auditory Identification of Emotion as can be seen in the table and yet their rates of
irony are in the normal range.
The test results of four clinical dyads with the highest rates o f irony scores are
77
shown in Table 21. As can be seen one of the subjects (#48) performed in the deficit
range on the Symbol Digit Modalities Test and Auditory Emotion Identification subtest
and yet the rate o f spontaneous irony was well within the normal range. Thus, something
other than the fimctions measured by the performance on these tests is contributing to the
reduced rate o f irony in the conversations o f the four lowest dyads.
A question arises regarding whether the gender composition or the age
discrepancy between the partners may be factors. For example, the male-male dyads may
have a tendency to be more “businesslike” and less playful, thus, producing less irony with
each other. When the five lowest dyads in terms of rate of irony are examined, there does
not appear to be a particular pattern in terms of gender. Two of the dyads have two
females, one has two males, and one is made up o f a female and male. The other
possibility is that if the partners have a large discrepancy in age, for example, more than a
10 year age difference, that their interactions may involve less bantering than those closer
in age. Again, this did not appear to be the case when the five dyads with the lowest rates
of irony were examined. In these dyads, the age discrepancy ranged from one to ten
years, with three o f the dyads just differing in one or two years. See appendix 17 for a
description o f the composition o f the dyads in terms of age, gender, and education.
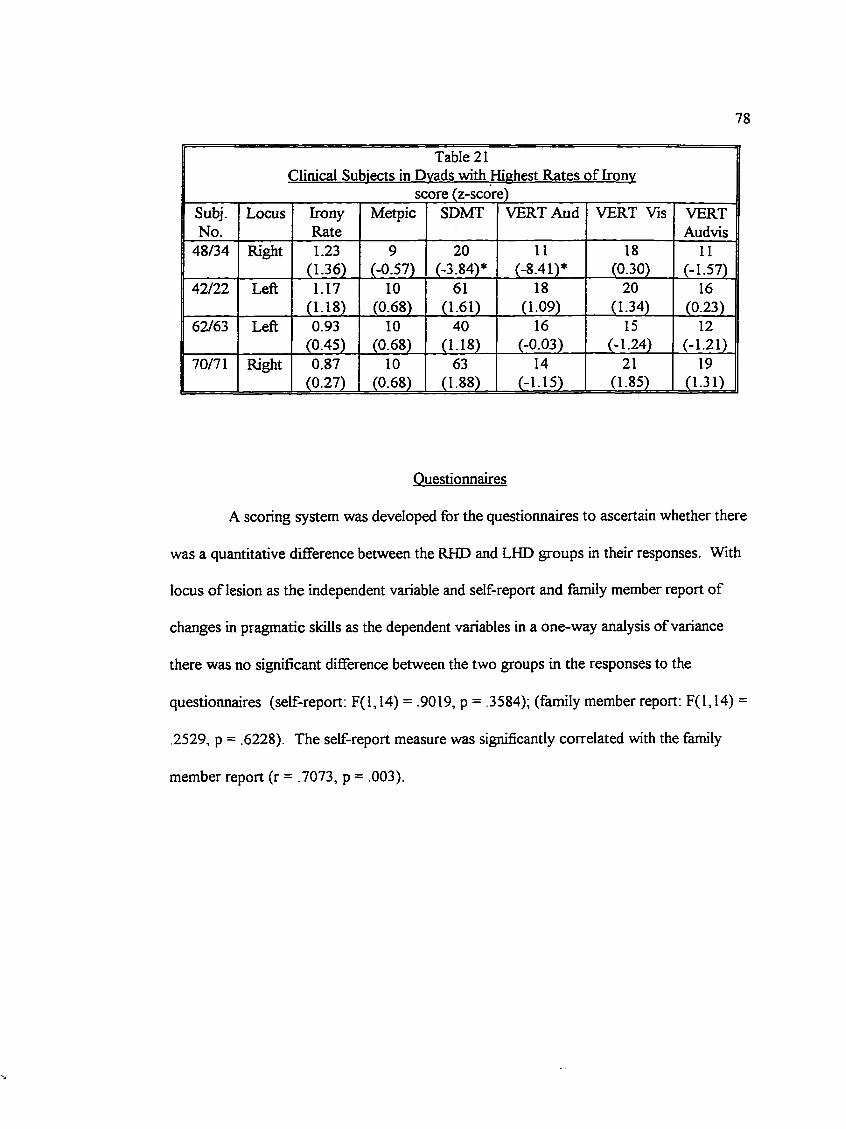
78
Table 21Clinical Subjects in Dvads with Highest Rates of Ironv
score (z-score)Subj.No.
Locus IronyRate
Metpic SDMT VERT Aud VERT Vis VERTAudvis
48/34 Right 1.23(1.36)
9(-0.57)
20(-3.84)*
11(-8.41)*
18(0.30)
11(-1.57)
42/22 Left 1.17(1.18)
10(0.68)
61(1.61)
18(1.09)
20(1.34)
16(0.23)
62/63 Left 0.93(0.45)
10(0.68)
40(1.18)
16(-0.03)
15(-1.24)
12(-1.21)
70/71 Right 0.87(0.27)
10(0.68)
63(1.88)
14(-1.15)
21(1.85)
19(1.31)
Questionnaires
A scoring system was developed for the questionnaires to ascertain whether there
was a quantitative difference between the RHD and LHD groups in their responses. With
locus of lesion as the independent variable and self-report and family member report of
changes in pragmatic skills as the dependent variables in a one-way analysis of variance
there was no significant difference between the two groups in the responses to the
questionnaires (self-report: F(l,14) = .9019, p = .3584); (family member report: F(l,14) =
.2529, p = .6228). The self-report measure was significantly correlated with the family
member report (r = .7073, p = .003).
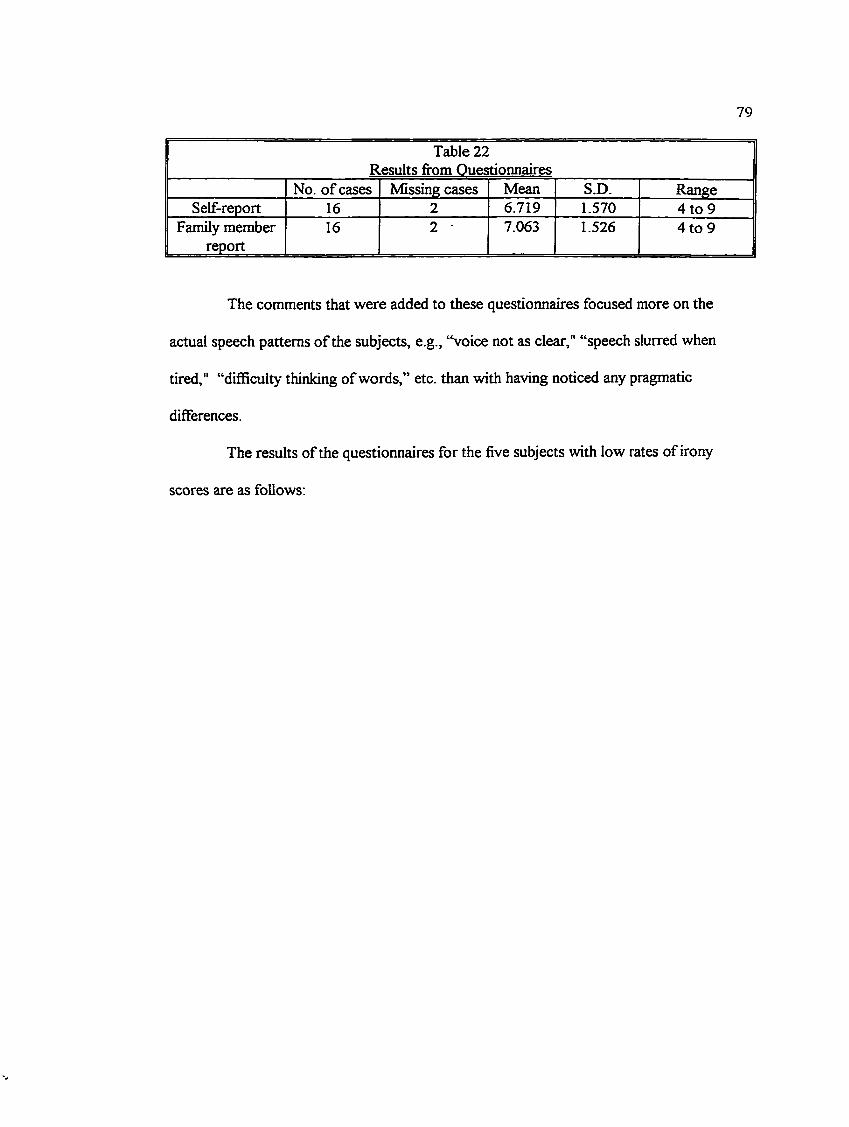
79
Table 22 Results from Questionnaires
No. of cases Missing cases Mean S.D. RangeSelf-report 16 2 6.719 1.570 4 to 9
Family member report
16 2 7.063 1.526 4 to 9
The comments that were added to these questionnaires focused more on the
actual speech patterns o f the subjects, e.g., “voice not as clear," “speech slurred when
tired," “diflBcuity thinking of words,” etc. than with having noticed any pragmatic
differences.
The results of the questionnaires for the five subjects with low rates of irony
scores are as follows:

80
Table 23
Questionnaire Results for Clinical Subiects with Lowest Rates of Ironv
Subj.No.
Locus Self-report Family report
8 Right 7/9 (no change) 8/9 (slurred speech when tired)41 Right 8/9 (smaller capacity to deal
with arguments)7/9 (changes mood quickly)
45 Left No Response No response47 Right 7/9 (voice not as clear) 7/9 (slight change in speech)11 Left 8/9 (vocabulary has improved) 8/9 (initially unable to
communicate verbally, has progressed to 80% full verbal recovery)
As can be seen, the four subjects who responded to the questionnaire are above the mean
in both the self-report and family-report scores .
81
CHAPTER FOUR
Discussion
This study examined the conversations of three groups of subjects: left-
hemisphere-damaged (LHD), right-hemisphere-damaged (RHD), and neurologically intact
individuals all paired with neurologically intact subjects. The clinical subjects had had
cerebral vascular accidents (CVAs) 5 to 29 months prior to the study. The conversational
tasks involved lighthearted, humourous topics that, it was hoped, would encourage ironic
or sarcastic comments from the participants. The subjects were also administered several
neuropsychological measures that were hypothesized to explain any differences amongst
the three groups in the amount of ironic comments produced and the success of their
communication.
The control group produced significantly more ironic statements than the two
clinical groups, however, there was no significant difference between the LHD and RHD
groups in the rate o f spontaneous irony. There was also no difference amongst the three
groups in terms of the success in communication of the ironic statements; all three groups
had a success rate of approximately 90 per cent. When the groups were examined to
determine which of the partners were producing the ironic statements, the results showed
that when NHD subjects were paired with the post-stroke individuals they, as a group,
produced significantly fewer instances than either their brain-damaged partners or the
control subjects who were paired with neurologically-intact partners. When the test
82
results o f the clinical subjects of the five lowest functioning dyads in terms of irony
production were examined, no pattern that was different fi-om other clinical subjects with
higher rates was apparent.
Thus, the results of this study have shown that conversational dyads in which one
of the speakers has sustained a focal lesion produce a reduced rate of ironic instances.
However, the results do not demonstrate that this deficit is more prominent when one of
the partners has had a focal lesion in the right hemisphere. This failure to produce results
as hypothesized may be due to a combination of factors;
1) the number of dyads per group is low and to show the expected relatively large effect
size given the current results, at least 25 dyads per group are required (i.e., 150 subjects as
compared to the 58 in the study)). Even if a lower power level is used (e.g., 0.6 which as
Cohen has explained, increases the level of a Type II error), about 15 dyads would be
required resulting in a need for 36 additional subjects (Cohen, 1988);
2) the clinical subjects that tended to volunteer were likely a select group of post-stroke
individuals. Other subjects had been contacted but were unable to participate either
because they were in poor health or because the trip to the university was too onerous for
them. The ones that did participate may have had relatively mild strokes and thus any
differences would be less likely to be shown;
3) according Hughes et al., 1983 there is a tendency for aprosodia to resolve. They found
clear symptoms of aprosodia only in subjects who were less than 6 months post-onset.
83
The subjects in this study were 5 months and beyond post-onset. Thus, if Hughes et al.’s
contention is true, then any chance o f showing clear differences would be greatly
diminished;
4) the lesions were perhaps too heterogeneous to show clear group differences especially
in groups with a small n. An improved study may specify particular loci of lesions, e.g.,
temporoparietal or frontotemporal.
There did not appear to be a difference amongst the three groups in terms of the
percentage of successfully communicated instances of irony. All three showed
approximately 90 per cent success. Thus, there were not more breakdowns in
communication within the conversations o f the clinical groups when compared to the
control group but rather a diminished rate of overall attempts at being ironic in the dyads
with clinical subjects. This diminished rate appeared to be due to a reduction in
production by the NHD partners of the clinical subjects as compared to those in the
control group. The clinical subjects attempted as much irony as the partners in the control
group.
The best predictor for the dyadic rate of irony as determined from a post hoc
stepwise multiple regression analysis appeared to be age. Age was negatively correlated
with the rate of irony which may mean that as people age they become less flexible and
produce less irony. This would have to be explored further in a future study.
84
When individual dyads were examined there did not appear to be a pattern o f test
results that seemed to contribute to the reduction of rate of irony. In the dyads with the
lowest rates o f irony, the functions that were in the deficit range were speed of processing
(as measured by the Symbol Digit Modalities Test); recognition o f emotion auditorily
(Auditory Emotion Identification subtest), and recognition of metaphors (Metaphor
Picture subtest). However, these deficits were not specific to the dyads with reduced rates
o f irony. Other dyads that also showed these deficits, had rates o f irony within the normal
range. The results o f the other subtests of the Right Hemisphere Language Battery were
also examined (see appendix) to see whether a pattern emerged. They, too, did not
suggest a pattern to be explored further.
The measures that were hypothesized to account for the differences in rate were
all related to the clinical subjects’ ability to comprehend irony, however, it remains unclear
whether the clinical subjects are poorer at comprehending irony. Although the group
results show no overall difference in the success of communication of irony amongst the
three groups, the clinical subjects in the lower functioning dyads were not given the
chance to demonstrate their ability. Instead the pattern that emerged was that the normal
partners’ attempts at irony were much less when one of the partners has had brain damage.
In the five lowest dyads (all of which contained a clinical subject) only one of the NHD
partners attempted an ironic statement. The NHD partners in the other four dyads made
no attempts. There must be something that Is inhibiting the NHD partners from making

85
attempts. It is quite possible that the reduced rate in irony in the two clinical groups is due
to different factors.
Thus, rather than focusing on the variables affecting comprehension o f irony, the
focus should be on what affects the production o f irony. In addition, the focus should be
not on whether the post-stroke subjects can produce irony because these results suggest
that they can, but rather, on the factors in the interaction that are inhibiting the NHD
partner’s production o f irony. This could be done through a more in-depth form of
discourse analysis (i.e., perhaps a micro-analysis o f facial displays and prosodic detail of
both partners). Schober and Clark (1989) report from the literature that speakers
accommodate to their listeners in terms of many factors (e.g., loudness, speed, dialect,
pronunciation). Isaacs and Clark (1987) found that people also accommodated to their
listeners in terms of content. Their study showed that individuals “were able to assess
each other’s level o f expertise almost immediately and to adjust their choice of proper
names, descriptions, and perspectives accordingly.” The task involved having pairs of
subjects, some of whom were experts while others were novices concerning knowledge of
New York, sequence various postcards o f New York City through talking about them.
They found that the directors were able to adjust to their partners very quickly, i.e.,
before they had even arranged four cards. The authors suggest that speakers likely pursue
a basic strategy: (a) Begin assuming only as much expertise as you think might be shared by your partner; and (b) use your partner’s responses to adjust to his or her actual expertise. (Isaacs & Clark, 1987, p. 35)
86
As in the above study, there is likely some sort o f accommodation occurring during the
conversational tasks involving irony.
Elliott, MacNair, Herrick, Yoder, and Byrne (1991) summarized past research
examining interactions between disabled and nondisabled individuals that suggested that
“nondisabled persons display more discomfort, terminate conversations earlier, smile less,
and exhibit more inhibited gross motor behavior when paired with a person with a
disability” (p. 1293). In their study which used confederates who posed as either a
depressed or physically-disabled participant (i.e., wheelchair-bound), they found that when
depressive behaviours (e.g., lethargy, pessimism, tiredness, sadness) were exhibited by the
confederates that the subjects spoke less and gazed less frequently during the interactions.
The reactions of a nondisabled individual appear to be strongly influenced by the behavior o f a person with disability in dyadic interactions. Behaviors that confirm stereotypic notions about persons with physical stigma can trigger cognitive, verbal, and nonverbal expressions of disapproval and discomfort, and negative attitudes may be reinforced. However, when a person with disability behaves in a socially skilled manner, interpersonal acceptance may be fostered. (Elliott et al., 1991, p. 1299)
The NHD conversational partners were not blind to the fact that their video
partner may have had a stroke. This fact was contained in the information and consent
form (see appendix) signed prior to participating in the study. Although the details
concerning the group in which they were to be placed was not given, it was often apparent
87
either from the partner’s physical manifestations o f the stroke (e.g., hemiplegia, obvious
communication difficulties) or from information provided by the partner that the person
had had a stroke. Thus, the dynamics of the conversations may well have exhibited some
of the features of the interactive pattern between nondisabled and disabled participants as
described above by Elliott et al. (1991).
Schaffer (1982) suggested in her dissertation that another maxim she termed
“Principle of Engagement: ‘be interesting’” be added to Grice’s Conversational Maxims
and LakofPs Maxim of Politeness. She proposed that the use of irony is a means of
obtaining the attention and interest o f the listener by forcing that person into a more active
role, “she must carefully follow what I said or risk missing something” (p.22). Other
examples that would fit under this Principle o f Engagement would be joking, teasing,
swearing, and role-playing. It may be that the accommodation made by the NHD
conversational partners was based on a judgement that the clinical subjects were unable to
fulfill this more active role. Thus the NHD partners, in a sense, simplified the listening
task or, at least, did not make it more complex, for the clinical subjects.
When the five lowest dyads in terms o f rate of irony are considered, there
appears to be a different quality in the interactions although not all for the same reasons.
The NHD partner in dyad #45/43 appeared to be nervous and laughed too frequently. The
nervousness may have been due to a combination of factors including the fact that he was
being videotaped. However, the other subjects in the study did not appear unduly affected

8 8
by this fact and seemed to have very natural-sounding conversations. A more salient
factor may have been the initial interaction between subjects #45 and #43 even prior to the
beginning o f the videotaping. The subject who had had a CVA was obviously showing the
effects o f the CVA; his arm was in a sling and he walked with a cane. The NHD partner
offered to help the subject to his seat but this offer was brushed off by the other, thus
presenting the CVA subject as a curmudgeonly, independent man. This encounter
appeared to affect the rest of the interaction. Mills, Belgrave, and Boyer (1984)
demonstrated that discomfort by nondisabled subjects could be reduced by having the
physically disabled person mention the disability along with a request for aid. If this
strategy is not used then the authors speculate that nondisabled people may “avoid social
interaction with the physically disabled (because) they tend to assume disabled persons
may have a strong emotional reaction to their disability which would color the interaction
and make it more difBcult and unpleasant” (p. 2). It appeared that the post-stroke
individual in this dyad not only did not use this strategy but in effect accentuated his
disability and did not put his partner at ease. In addition to the obvious physical disability,
the post-stroke individual was slow in responding to his partner; there were long pauses
affecting the normal back and forth of tumtaking. The NHD partner seemed to feel
obliged to fill the pauses and this may have contributed further to his feeling of discomfort.
NHD; Awful foods. Have you got things that you totally dislike?(Pause)
NHD: (laugh) as far as food (LHD smiles) I like most things.LHD: I never thought o f it. Um
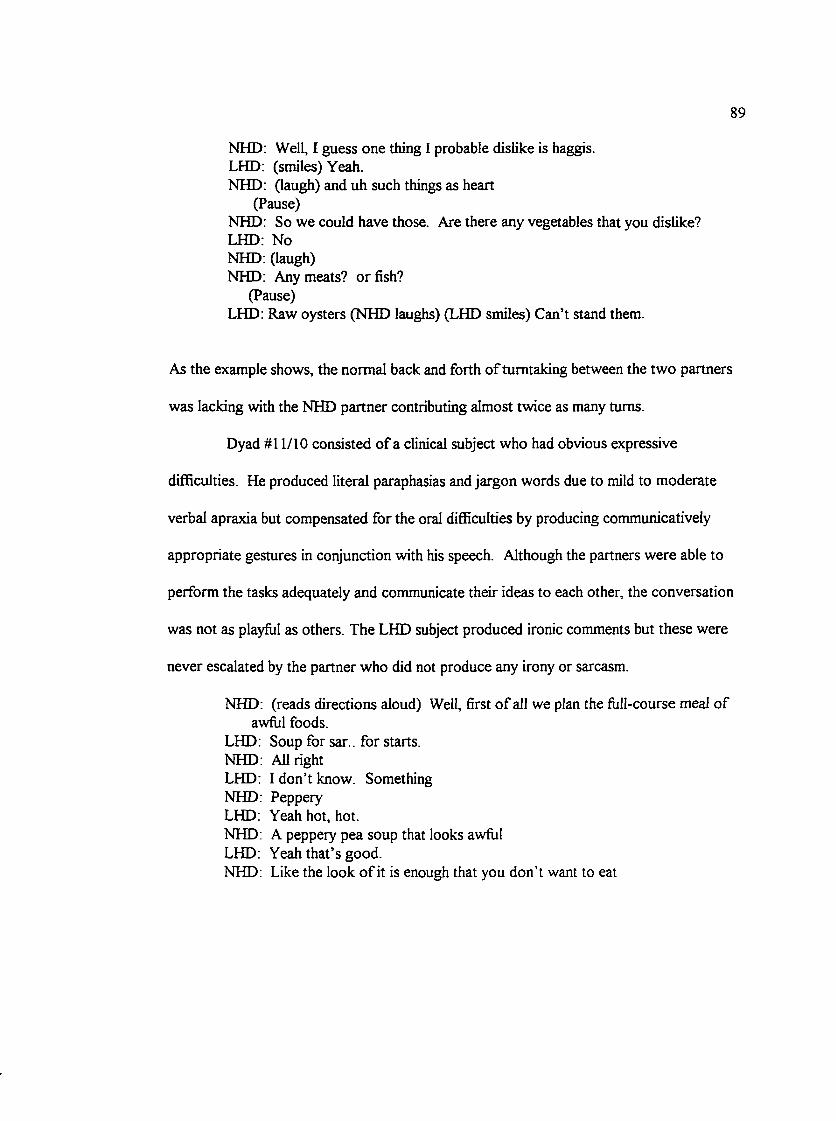
89
NHD; Well, I guess one thing I probable dislike is haggis.LHD: (smiles) Yeah.NHD: (laugh) and uh such things as heart
(Pause)NHD: So we could have those. Are there any vegetables that you dislike? LHD: No NHD: (laugh)NHD: Any meats? or fish?
(Pause)LHD: Raw oysters (NHD laughs) (LHD smiles) Can’t stand them.
As the example shows, the normal back and forth o f tumtaking between the two partners
was lacking with the NHD partner contributing almost twice as many turns.
Dyad #11/10 consisted of a clinical subject who had obvious expressive
difficulties. He produced literal paraphasias and jargon words due to mild to moderate
verbal apraxia but compensated for the oral difiSculties by producing communicatively
appropriate gestures in conjunction with his speech. Although the partners were able to
perform the tasks adequately and communicate their ideas to each other, the conversation
was not as playful as others. The LHD subject produced ironic comments but these were
never escalated by the partner who did not produce any irony or sarcasm.
NHD: (reads directions aloud) Well, first o f all we plan the fijll-course meal of awful foods.
LHD: Soup for sar.. for starts.NHD: All rightLHD: I don’t know. SomethingNHD: PepperyLHD: Yeah hot, hot.NHD: A peppery pea soup that looks awfulLHD: Yeah that’s good.NHD: Like the look o f it is enough that you don’t want to eat
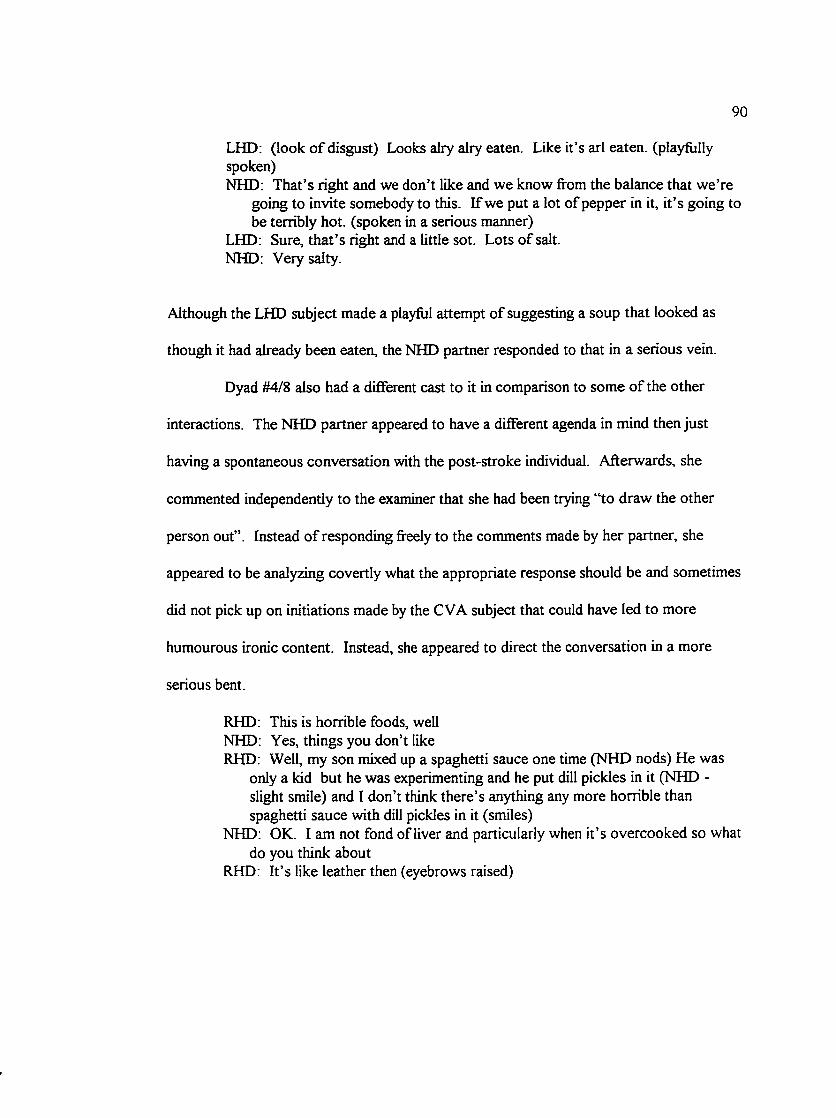
90
LHD: (look o f disgust) Looks airy airy eaten. Like it’s arl eaten, (playfully spoken)NHD: That’s right and we don’t like and we know from the balance that we’re
going to invite somebody to this. If we put a lot of pepper in it, it’s going tobe terribly hot. (spoken in a serious manner)
LHD: Sure, that’s right and a little sot. Lots of salt.NHD: Very salty.
Although the LHD subject made a playful attempt of suggesting a soup that looked as
though it had already been eaten, the NHD partner responded to that in a serious vein.
Dyad #4/8 also had a different cast to it in comparison to some of the other
interactions. The NHD partner appeared to have a different agenda in mind then just
having a spontaneous conversation with the post-stroke individual. Afterwards, she
commented independently to the examiner that she had been trying “to draw the other
person out”. Instead of responding freely to the comments made by her partner, she
appeared to be analyzing covertly what the appropriate response should be and sometimes
did not pick up on initiations made by the CVA subject that could have led to more
humourous ironic content. Instead, she appeared to direct the conversation in a more
serious bent.
RHD: This is horrible foods, well NHD: Yes, things you don’t likeRHD: Well, my son mixed up a spaghetti sauce one time (NHD nods) He was
only a kid but he was experimenting and he put dill pickles in it (NHD - slight smile) and I don’t think there’s anything any more horrible than spaghetti sauce with dill pickles in it (smiles)
NHD: OK. I am not fond of liver and particularly when it’s overcooked so what do you think about
RHD: It’s like leather then (eyebrows raised)
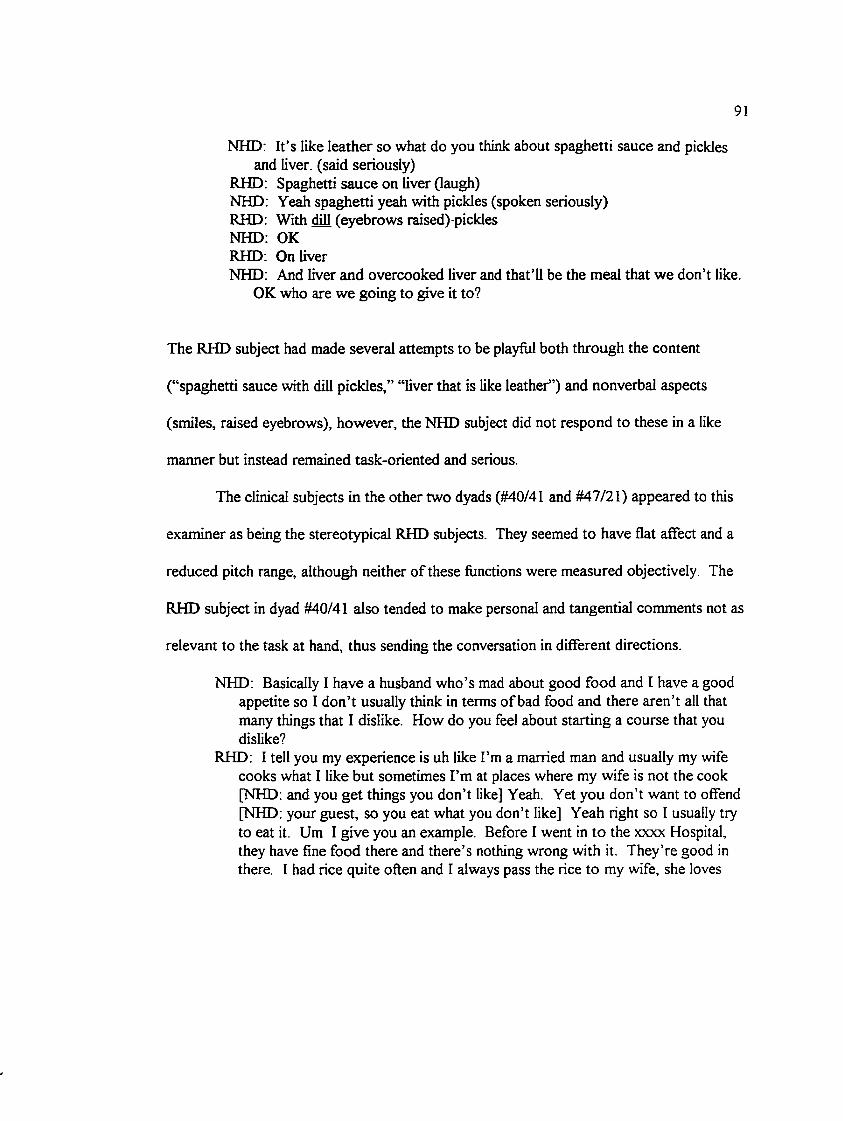
91
NHD: It’s like leather so what do you think about spaghetti sauce and pickles and liver, (said seriously)
RHD: Spaghetti sauce on liver (laugh)NHD: Yeah spaghetti yeah with pickles (spoken seriously)RHD: With dill (eyebrows raised)-pickles NHD: OK RHD: On liverNHD: And liver and overcooked liver and that’ll be the meal that we don’t like.
OK who are we going to give it to?
The RHD subject had made several attempts to be playful both through the content
(“spaghetti sauce with dill pickles,” “liver that is like leather”) and nonverbal aspects
(smiles, raised eyebrows), however, the NHD subject did not respond to these in a like
manner but instead remained task-oriented and serious.
The clinical subjects in the other two dyads (#40/41 and #47/21) appeared to this
examiner as being the stereotypical RHD subjects. They seemed to have flat affect and a
reduced pitch range, although neither of these functions were measured objectively. The
RHD subject in dyad #40/41 also tended to make personal and tangential comments not as
relevant to the task at hand, thus sending the conversation in different directions.
NHD: Basically I have a husband who’s mad about good food and I have a good appetite so I don’t usually think in terms of bad food and there aren’t all that many things that I dislike. How do you feel about starting a course that you dislike?
RHD: I tell you my experience is uh like I’m a married man and usually my wife cooks what I like but sometimes I’m at places where my wife is not the cook [NHD: and you get things you don’t like] Yeah. Yet you don’t want to offend [NHD: your guest, so you eat what you don’t like] Yeah right so I usually try to eat it. Um I give you an example. Before I went in to the xxxx Hospital, they have fine food there and there’s nothing wrong with it. They’re good in there. I had rice quite often and I always pass the rice to my wife, she loves
92
rice. But since this is half of the food I got and I had no choice, I started eating it and it became acceptable and now I can eat rice.
NHD: You grew accustomed to it and now enjoy it.RHD: Yeah I grew accustomed. I bet you have some food that you would rather
not have if you had a choice.(They went ofiF on other tangents and never did accomplish the task of creating a menu o f disliked foods and thinking of a person to invite.)
Subjects #41 and #47 appeared to be reduced in affect when listening to the
partners. They were able to appreciate their partner’s humour when it did occur or at
least respond in kind with a smile. What appeared to be missing from the interactions was
what Chovil (1991/92) has termed “discourse-oriented facial displays”. For example, she
found that eyebrow movements can convey both syntactic and semantic information.
“Among other functions, brow movements provided emphasis, marked questions and
offers, and formed part of the displays that conveyed reactions such as surprise or
disbelief, or indicated listener reaction” (p. 191). If one’s conversational partner is not
conveying this information either when speaking or listening, then it is likely that the
speaker will accommodate his speech pattern to be more like the partner. That is, the lack
of discourse-oriented facial displays of one o f the partners may act to convey that the
conversational topic should be dealt with in a more serious vein, i.e., with less emphasis
and fewer phrases marked by changes in prosody or facial displays and thus the partner
follows suit.
93
On the other hand, two partners in the control group who had produced a variety
o f ironic instances commented that it was easy to complete the tasks because they worked
well together bouncing ideas off each other. Several of the examples o f irony involved
escalations o f the previous ironic instances. This comment of “bouncing ideas off each
other” reinforced the idea of the collaborative nature of irony as hypothesized by Coates
(1991). The normal subjects also appeared to be much more expressive than the RHD
clinical dyads in terms of prosody and facial displays. Again, this was an observation of
the examiner and not objectively measured.
5 & 39: (read instructions together)39: Well certainly mussels, raw mussels on a half-shell.5: Raw oysters on a half-shell.39: Sounds pretty disgusting.5: Frogs’ legs would be for me.39 : Oh yes (look of disgust) yes. Mhm5: How many courses? A full-course meal. So we’re only at the beginning.39: Well, I’ve heard that they serve sheep’s eyeballs in Arabia.5: That would be wonderful (both laugh). I’m sure some of our friends would
love that.39: (laugh)5: Oh well snake. People eat snake [Yes] and things as a main course. So put
all the...What would you put with it? I suppose uh [we need some] We’ve got an entree, we’ve got a dinner and then we need a dessert. So what rotten dessert can you think of? I can’t
39: Ooh. Perhaps something that’s fermented but doesn’t taste very good.5: Mm. 1 can’t think of an awful dessert at all. Nothing. Unless it was39: Perhaps some fhiit, some canned fruit that had gone off, you know, the colour
is terrible and normally you wouldn’t eat it (laugh)5: Oh I know what. That, with let’s say green (look of disgust) jello, like green
jello [Oh yes] and [ooh and brown peaches (look of disgust)] and custard so that it all go into one another and all look gooey along with your [really horrible] tumed-off fruit (both laugh) Sounds great.
39: Yeah sounds really revolting.
94
5; And really burnt coffee at the end of it. 39; Oh wonderful (both laugh).
As can be seen, the two NHD partners contributed equally to the conversation with a back
and forth nature o f tumtaking. Humourous attempts were followed up by the other
partner.
Another difference amongst the groups was that the NHD partners in the clinical
groups seemed to control the metacommunicative function of the tasks, i.e., they guided
their partners through the task by keeping track of what had been decided to that point
and what still needed to be accomplished, asking their partners for their opinions,
summarizing the outcome of the task, etc. On the other hand, the partners in the control
group seemed to share this function more evenly. Again, this would have to be studied
more objectively in a future study.
Another of the RHD subjects (dyad # 70/71) appeared to have reduced discourse-
oriented facial displays. Yet, the rate of irony for the dyad was in the top four of the
clinical dyads and thus not considered to be a deficit. The functions as measured by the
various neuropsychology tests were all within the normal range. When the rates for the
various topics are examined separately, it can be seen that the rate increases with each
topic (meal: 0.18. outfits: 0.75, holiday: 1.77). It may be that despite the reduced facial
displays and rather monotone pitch range, that the appropriate responses of the RHD
subject to the attempted irony acted to dispel the normal partner’s original
95
accommodation to the RHD subject. Thus, future research may find that there is an
interaction between such functions as recognition of intonational patterns, speed of
processing, and the ability to produce appropriate discourse-oriented facial displays and
prosody that act together to have an effect on the quality of conversations and rate of
spontaneous irony.
The questionnaires did not yield information that helped to explain the deficits in
the rate o f irony found in the five lowest dyads or suggest that the subjects or their family
members were aware of pragmatic difficulties. Rather than commenting on pragmatic
deficits, the subjects and their family members focused on the more salient features o f the
subject’s communication such as slurred speech, vocal hoarseness, and reduced
vocabulary. The conclusion cannot yet be made that pragmatic deficits do not occur in
these subjects. The accommodation that speakers make occurs rapidly and seemingly
without conscious awareness on the part of the speakers. Thus, family members may not
be aware that there has been a change in the quality of conversations. It may also be that
the pattern observed in dyad #70/71, in which the rate of irony increased once the partners
became further acquainted, may also be happening in the interactions between the subjects
and their family members. Families would have had a longer time to accommodate to the
CVA subject’s communicative abilities. In addition, the validity of the questionnaire needs
to be reviewed. The families may have observed the subject with much worse
communicative abilities and may be making comparisons not so much with how the
96
subject performed premorbidly but rather to how they were functioning earlier in the
recovery phase. Thus, this particular questionnaire needs to be adjusted to better tease
out the parameters that are relevant to the individual differences.
In summary, dyads in which one of the members is brain-damaged produce less
irony. There are not more breakdowns in communication, but rather a diminished rate of
attempts by the neurologically-intact partners. The functions hypothesized to affect the
clinical subjects’ ability to comprehend irony did not fit into a clear pattern. It is
suggested that future research should examine tumtaking, facial displays (especially the
discourse-oriented ones proposed by Chovil), and prosodic features of the clinical subjects
to determine whether these factors have an effect on the accommodation of the NHD
speakers to their partners. The biases and perceptions of the NHD partners and whether
they feel compelled to perform the metacommunicative functions of the conversational
tasks may change the quality of the conversations and should be examined in more depth.
In addition, a more finely tuned questionnaire should be developed to determine whether
the observations made in the lab are also apparent in everyday situations. Not only should
the opinion of family members be solicited but also a debriefing questionnaire should be
given to the conversational partners of the clinical subjects to determine their perception
of what occurred during the conversation.
Although the outcome o f this study is tentative, further research in this area may
lead to results that have therapeutic relevance. If it is aspects of the interaction that are
97
contributing to the changes in communication then this is the level that should be focused
on in therapy. Videotaping conversations between post-stroke individuals and family
members, friends, and strangers may lead to. a better understanding of the difficulties the
individual is having. For example, in the case of LHD patients, it may be that lengthy
pauses are affecting tumtaking and that if the NHD partners are trained to slow down
their expected timing of tumtaking, then the interaction will be more satisfying to both
partners. Perhaps a nonverbal cue from the post-stroke individual would help fill the
pauses so that the partner does not become uncomfortable waiting for a response. If the
problem appears to be a lack of discourse-oriented facial displays on the part of the post
stroke RHD individual, then this may be an appropriate focus for therapy. Just as
exercises to stimulate speech and language have been developed, perhaps stimulation of
facial displays could be initiated. At the very least an improved understanding by both the
post-stroke individuals and their family members would be of benefit. Finally, it may help
to teach the post-stroke individual strategies such as that suggested by the research of
Mills et al. (e.g., mention the disability and request aid) as a means of reducing the
discomfort of potential conversational partners. Role-playing and videotaped feedback
may assist in teaching the strategies.

98
REFERENCES
Bavelas, J.B., Chovil, N., Lawrie, D.A., & Wade, A. (1992). Interactive gestures. Discourse Processes. 15. 469-489.
Bavelas, J.B. (1978). Personalitv: Current theorv and research. Monterey; Brooks/Cole.
Benowitz, L.I., Bear, D M., Rosenthal. R., Mesulam, M.M., Zaidel, E., & Sperry, R.W. (1983). Hemispheric specialization in nonverbal communication. Cortex. 19. 5-11.
Benton, A. (1968). Differential behavioral effects in frontal lobe disease. Neuropsvchologia. 6. 53-60.
Bihrle, AM., Brownell, H.H., Powelson, J.A., & Gardner, H. (1986). Comprehension of humorous and nonhumorous materials by left and right brain-damaged patients. Brain and Cognition. 5. 399-411.
Black, A. (1988). The syntax o f conversational coherence. Discourse Processes. i i , 433-455.
Blonder, L.X., Bowers, D., & Heilman, K.M. (1991, Feb.). Logical inference following right hemisphere damage. Poster session presented at the annual meeting of the International Neuropsychological Society, San Antonio, Texas.
Blumstein, S. & Cooper, W.E. (1974). Hemispheric processing o f intonation contours. Cortex. 10. 391-404.
Borod, J.C. & Koff, E. (1990). Lateralization for facial emotional behavior: A methodological perspective. International Journal of Psvchologv. 25. 157-177.
Brownell, H.H., Michel, D., Powelson, J., & Gardner, H. (1983). Surprise but not coherence: Sensitivity to verbal humor in right-hemisphere patients. Brain and Language. 18, 20-27.
Brownell, H.H., Potter, H., Bihrle, AM., & Gardner, H. (1986). Inference deficits in right brain-damaged patients. Brain and Language. 27. 310-321.
99
Brownell, H.H., Simpson, T., Bihrle, A.M., Potter, H.H., & Gardner, H. (1990). Appreciation of metaphoric alternative word meanings by left and right brain-damaged patients. Neuropsvchologia. 28. 375-383.
Bryan, K.L. (1989). Right Hemisphere Language Batterv. Kibworth, England.
Campbell, R. (1986). The latéralisation of lipread sounds; a first look. Brain and Cognition. 5. 1-21.
Campbell, R., Landis, T., & Regard, M. (1986). Face recognition and lipreading;A neurological dissociation. Brain. 109. 509-521.
Chovil, N. (1991/2). Discourse-oriented facial displays in conversation. Research on Language and Social Interaction. 25. 163-194.
Clark, C M. (1986). Statistical methods and their application in clinical neuropsychological research and practice. In S B. Filskov & T.J. Boll (Eds ), Handbook o f clinical neuropsvchologv. Vol.2 (pp. 577-605). New York; John Wiley & Sons, Inc.
Clark, H.H. & Gerrig, R. (1984). On the pretense theory of irony. Journal of Experimental Psvchologv: General. 113. 121-126.
Clark, H.H. & Wilkes-Gibbs, D. (1986). Referring as a collaborative process. Cognition. 22. 1-39.
Coates, L.J. (under revision). Just kidding; Spontaneous ironv in face-to-face dialogue.
Coates, L.J. (1991). A collaborative theorv of inversion; ironv in dialogue. Unpublished master’s thesis. University of Victoria.
Cohen, J. (1988). Statistical Power Analvsis for the Behavioral Sciences. Hillsdale, NJ; Lawrence Erlbaum Associates, Inc.
Critchley, E.M.R. (1991). Speech and the right hemisphere. Behavioural Neurologv. 4. 143-151.
Demorest, A., Meyer, C., & Phelps, E. (1984). Words speak louder than actions: Understanding deliberately false remarks. Child Development. 5. 1527-1534.

100
Elliott, T. MacNair, R., Herrick, S., Yoder, B., & Byrne, C. (1991). Interpersonal reactions to depression and phsyical disability in dyadic interactions. Journal of Applied Social Psychology. 21. 1293-1302.
Emmorey, K.D. (1987). The neurological substrates for prosodic aspects of speech. Brain and Language. 30. 305-320.
Gardner, H., Brownell, H.H., Wapner, W., Diane Michelow, D. (1983). Missing the point: The role o f the right hemisphere in the processing of complex linguistic materials. In E. Perecman (Ed.) Cognitive Processing in the Right Hemisphere. New York: Academic Press.
Gibbs, R.W. (Jr.) (1986). On the psycholinguistics of sarcasm. Journal of experimental psvchologv: General. 115. 3-15.
Goldstein, K. (1948). Language and language disturbances. New York; Grune& Stratton.
Grice, H P. (1978). Svntax and Semantics 9: Pragmatics (pp. 113-128). New York: Academic Press.
Heilman, K.M., Scholes, R., & Watson, R.T. (1975). Auditory affective agnosia - Disturbed comprehension of affective speech. Journal o f Neurology. Neurosurgery. & Psychiatry. 38. 69-72.
Heilman, K.M., Bowers, D., Speedie, L., & Coslett, H.B. (1984). Comprehension of affective and nonaffective prosody. Neurology. 34. 917-921.
Hier, D.B. & Kaplan, J. (1980). Verbal comprehension deficits after right hemisphere damage. Applied Psvcholinguisitics. 1:3. 279-294.
Hirst, W., LeDoux, J., &Stein, S. (1984). Constraints on the processing of indirect speech acts: Evidence from aphasiology. Brain and Language. 23. 26-33.
Horowitz, L.M. & Manelis, L. (1973). Recognition and cued recall of idioms and phrases. Journal o f Experimental Psychology. 100. 291-296.
Hughes, C P , Chan, J.L., Su, M.S. (1983). Aprosodia in Chinese patients with right cerebral lesions. Archives of Neurology. 40. 732-736.
101
Isaacs, E.A. & Clark, H.H. (1987). References in conversation between experts and novices. Journal of Experimental Psvchologv: General. 116. 26-37.
Jorgensen, J., Miller, G., & Sperber, D. (1984). Test of the mention theory of irony. Journal o f Experimental Psvchologv: General. 118. 374-386.
Kaplan, J.A., Brownell, H.H., Jacobs, J R., and Gardner, H. (1990). The effects of right hemisphere damage on the pragmatic interpretation o f conversational remarks. Brain and Language. 38. 315-333.
Kertesz, A. (1982). Western Aphasia Batterv. San Antonio, TX; Psychological Corporation.
Kreuz, R.J. & Glucksberg, S. (1989). How to be sarcastic; The echoic reminder theory of verbal irony. Journal of Experimental Psvchologv: General. 118. 374-386.
Ley, R.G., & Bryden, M.P. (1982). A dissociation of right and left hemisphere effects for recognizing emotional tone and verbal content. Brain and Cognition. 1. 3-9.
May, R.B., Masson, M.E.J., Hunter, M.A (1990). Application of statistics in behavioral research. New York: Harper & Row, Publishers.
McGurk, H. & MacDonald, J. (1976). Hearing lips and seeing voices. Nature.264. 746-748.
Merewether, F.C. & Alpert, M. (1990). The components and neuroanatomic bases of prosody. Journal of Communication Disorders. 23. 325-336.
Mills, J., Belgrave, P., & Boyer, K. (1984). Reducing avoidance of social inteaction with a physically disabled person by mentioning the disability following a request for aid. Journal o f Applied Social Psvchologv. 14. 1-11.
Monrad-Krohn, G.H. (1947). Dysprosody or altered "melody of language."Brain. 70. 405-415.
Mountain, M (1993). Victoria Emotion Recognition Test. Unpublished doctoral dissertation. University o f Victoria, Victoria, B.C.
102
Myers, P. & Linebaugh, C. (1981). Comprehension of idiomatic expressions by right hemisphere damaged adults. Clinical aphasioloev - Proceedings o f the conference. Minneapolis: BRK.
Newman, I.E., Lovett, M.W., & Dennis, M. (1986). The use of discourse analysis in neurolinguistics: some findings firom the narratives of hemidecorticate adolescents. Topics in Language Disorders. 7. 31-44.
Pagano R.R. (1986). Understanding statistics in the behavioral sciences. St. Paul, MN: West Publishing Company.
Payne, R. & Jones, H. (1957). Statistics for the investigation of individual cases. Journal o f Clinical Psvchologv. 13. 115-121.
Ponsford, J. & Kinsella, G. (1992). Attentional deficits following closed-head injury. Journal of Clinical and Experimental Neuropsvchologv. 14. 822-838.
Potter, J. & Wetherell, M. (1987). Discourse in Social Psvchologv. London: Sage.
Raven, J.C. (1947). The Coloured Progressive Matrices TCPM). San Antonio, TX: Psychological Corporation.
Roman, M., Brownell, H.H., Potter, H., Seibold, M, & Gardner, H. (1987). Script knowledge in right hemisphere-damaged and in normal elderly adults. Brain and Language. 31. 151-170.
Rosenthal, R , Hall, J., DiMatteo, M., Rogers, P., & Archer, D. (1979).Sensitivity to nonverbal communication: The PONS Test. Baltimore, MD: Johns Hopkins University Press.
Ross, E D. (1981). The aprosodias: Functional-anatomic organization of the affective components of language in the right hemisphere. Archives of Neurologv. 38. 561-569.
Ross, E D. (1984). Right hemisphere's role in language, affective behavior, and emotion. Trends in Neuroscience. 7. 342-346.
Ross, E D., Harney, J.H., deLacoste-Utamsing, C , & Purdy, P.D. (1981). How the brain integrates affective and prepositional language into a unified behavioral function Archives o f Neurologv. 38. 745-748.

103
Ross, E d., Edmondson, J.A., Seibert, G.B., Homan, R.W. (1988). Acoustic analysis o f affective prosody during right-sided Wada test; A within subjects verification of the right hemisphere’s role in language. Brain and language. 33. 128-145.
Ryalls, J. (1986). What constitutes a primary disturbance of speech prosody?: A reply to Shapiro and Danly. Brain and Language. 29. 183-187.
Ryalls, J., Joanette, Y., & Feldman, L. (1987). An acoustic comparison of normal and right-hemisphere-damaged speech prosody. Cortex. 23. 685-694.
Schaffer, R.R. (1982). Vocal cues for irony in English. Unpublished Ph.D. dissertation, Ohio State University.
Schober, M.F. & Clark, H.H. (1989). Understanding by addressees and overhearers. Cognitive Psychology. 2 1 .211-232.
Searleman, A. (1983). Language capabilities of the right hemisphere. In AW. Young (Ed.) Functions of the right cerebral hemisphere. London: Academic Press Inc.
Shapiro, B E. & Danly, M. (1985). The role of the right hemisphere in the control of speech prosody in propositional and affective contexts. Brain and Language. 25. 19-36.
Shewan, C. (1979). Auditory Comprehension Test for Sentences. Chicago: Linguistics Clinical Institute.
Shipley-Brown, F., Dingwall, W.O., Berlin, C.I., Yeni-Komshian, G., & Gordon- Salant, S. (1988). Hemispheric processing of affective and linguistic intonation contours in normal subjects. Brain and Language. 33. 16-26.
Smith, A. (1973). Symbol Digit Modalities Test. Los Angeles: Western Psychological Services.
Sohlberg, M.M. & Mateer, C.A. (1989). Introduction to cognitive rehabilitation: Theorv and Practice. New York: The Guilford Press.
Springer, S.P. & Deutsch, G. (1989). Left brain, right brain. New York: W H Freeman and Company.
104
Strauss, E. & Moscovitch, M. (1981). Perception o f facial expressions. Brain and Language. 13. 308-332.
Summerfield, Q. & McGrath, M. (1984). Detection and resolution of audiovisual incompatibility in the perception of vowels. -Quarterly Journal of Experimental Psvchologv. 36A. 51-74.
Swinney, D.A. & Cutler, A. (1979). The access and processing of idiomatic expressions. Journal of Verbal Learning and Verbal Behavior. 18. 523-534.
Thatcher, V.S. & McQueen, A (1984). The new Webster encyclopedic dictionary o f the English language. New York: Avenel Books.
Thompson, J.K. (1985). Right brain, left brain: left face, right face: hemisphericity and the expression o f facial emotion. Cortex, 21. 28—299.
Tucker, D M., Watson, R.T., & Heilman, K.M. (1977). Discrimination and evocation of affectively intoned speech in patients with right parietal disease. Neurologv. 27, 947-950.
Van Lancker, D R. & Kempler, D. (1987). Comprehension of familiar phrases by left- but not right-hemisphere-damaged patients. Brain and Language. 32. 265-277.
Waltzlawick, P., Beavin, J., & Jackson, D. (1967). Pragmatics of Human Communication. New York: W.W. Norton.
Wapner, W., Hamby, S., & Gardner, H. (1981). The role of the right hemisphere in the appreciation o f complex linguistic materials. Brain and Language. 14, 15-33.
Weintraub, S., Mesulam, M., & Kramer, L. (1981). Disturbances in prosody: A right-hemisphere contribution to language. Archives of Neurologv. 38. 742-744.
Winner, E. & Gardner, H. (1977). The comprehension of metaphor in braindamaged patients. Brain. 100. 717-729.
Ylvisaker, M. (1992, October). Cognitive, communicative, and psvchosocial outcome following traumatic brain injurv. Workshop notes from the annual conference of British Columbia Speech/Language Pathologists and Audiologists.

105
Appendix
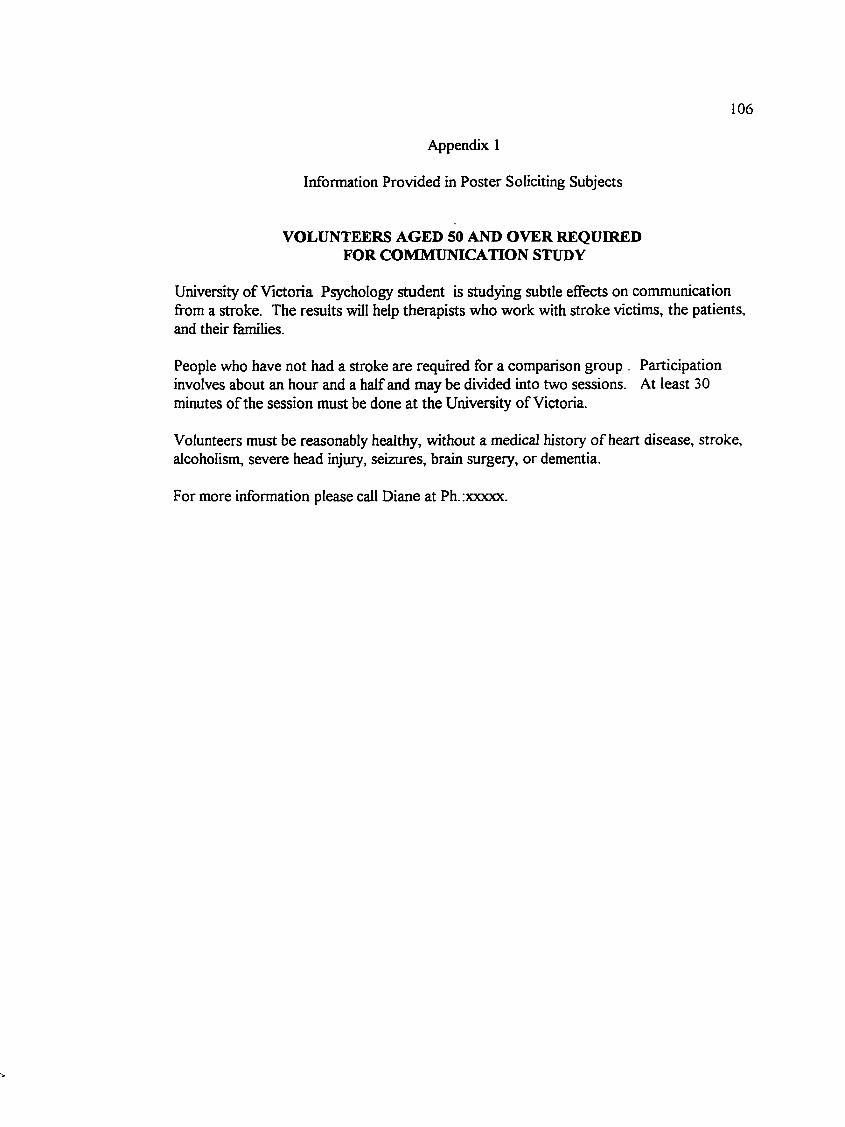
106
Appendix 1
Information Provided in Poster Soliciting Subjects
VOLUNTEERS AGED 50 AND OVER REQUIRED FOR COMMUNICATION STUDY
University of Victoria Psychology student is studying subtle effects on communication from a stroke. The results will help therapists who work with stroke victims, the patients, and their families.
People who have not had a stroke are required for a comparison group . Participation involves about an hour and a half and may be divided into two sessions. At least 30 minutes o f the session must be done at the University of Victoria.
Volunteers must be reasonably healthy, without a medical history o f heart disease, stroke, alcoholism, severe head injury, seizures, brain surgery, or dementia.
For more information please call Diane at Ph.;xxxxx.
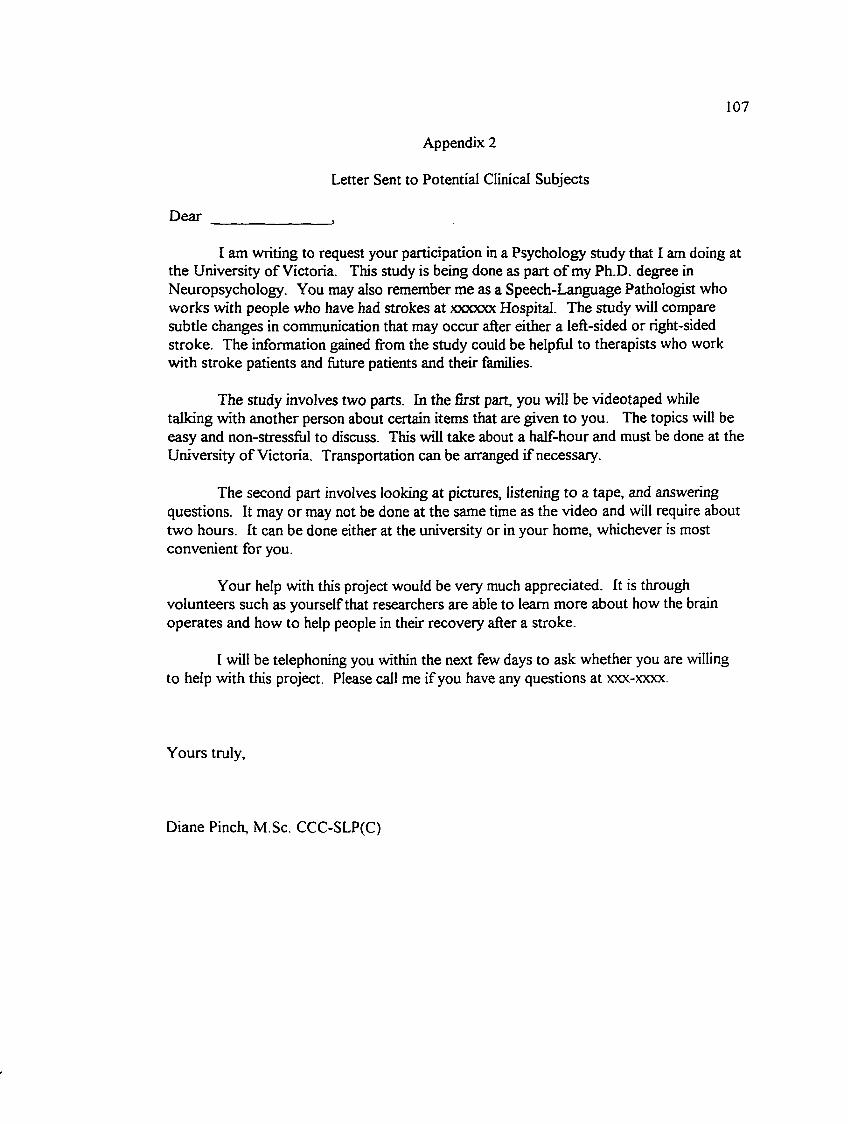
107
Appendix 2
Letter Sent to Potential Clinical Subjects
Dear _______________ ,
I am writing to request your participation in a Psychology study that I am doing at the University of Victoria. This study is being done as part o f my Ph.D. degree in Neuropsychology. You may also remember me as a Speech-Language Pathologist who works with people who have had strokes at xxxxxx Hospital. The study will compare subtle changes in communication that may occur after either a left-sided or right-sided stroke. The information gained from the study could be helpful to therapists who work with stroke patients and future patients and their families.
The study involves two parts. In the first part, you will be videotaped while talking with another person about certain items that are given to you. The topics will be easy and non-stressful to discuss. This will take about a half-hour and must be done at the University o f Victoria. Transportation can be arranged if necessary.
The second part involves looking at pictures, listening to a tape, and answering questions. It may or may not be done at the same time as the video and will require about two hours. It can be done either at the university or in your home, whichever is most convenient for you.
Your help with this project would be very much appreciated. It is through volunteers such as yourself that researchers are able to learn more about how the brain operates and how to help people in their recovery after a stroke.
I will be telephoning you within the next few days to ask whether you are willing to help with this project. Please call me if you have any questions at xxx-xxxx.
Yours truly.
Diane Pinch, M.Sc. CCC-SLP(C)
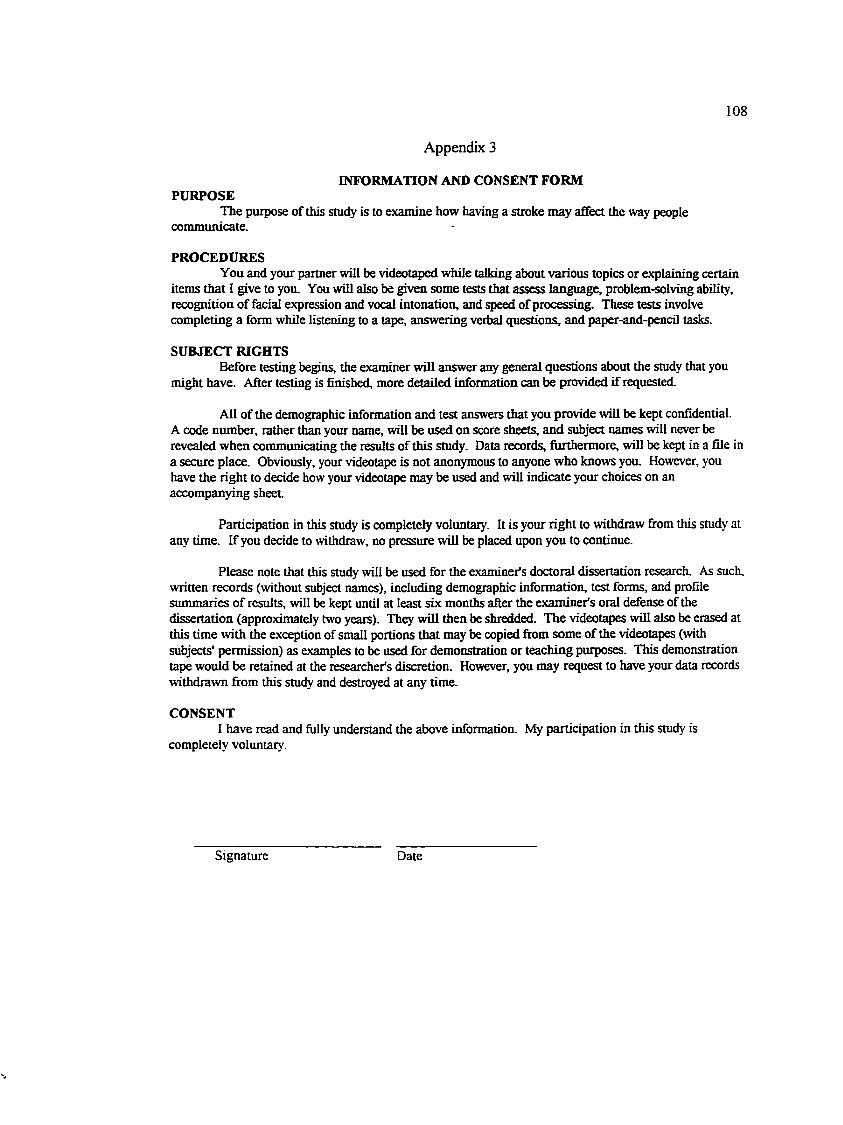
108
Appendix 3
INFORMATION AND CONSENT FORMPURPOSE
The purpose of this study is to examine how having a stroke may aSect the way people conununicate.
PROCEDURESYou and your partner will be videotaped while talking about various topics or explaining certain
items that 1 give to you. You will also be given some tests that assess language, problem-solving ability, recognition of facial expression and vocal intonation, and speed of processing. These tests involve completing a form while listening to a tape, answering verbal questions, and paper-and-pencil tasks.
SUBJECT RIGHTSBefore testing begins, the examiner will answer any general questions about the study that you
might have. After testing is finished, more detailed information can be provided if requested.
All of the demographic information and test answers that you provide will be kept confidential.A code niunber, rather than your nam e, will be used on score sheets, and subject names will never be revealed when communicating the results of this study. Data records, furthermore, will be kept in a file in a setmre place. Obviously, your videotape is not anonymous to anyone who knows you. However, you have the right to decide how yom videotape may be used and will indicate your choices on an accompanying sheet.
Participation in this study is completely volimtary. It is your right to withdraw from this study at any time. If you decide to withdraw, no pressure will be placed upon you to continue.
Please note that this study will be used for the examiner’s doctoral dissertation research. As such, written records (without subject names), including demographic information, test forms, and profile sununaries o f results, will be kept until at least six months after the examiner's oral defense of the dissertation (approximately two years). They will then be shredded. The videotapes will also be erased at this time with the exception of small portions that may be copied from some of the videotapes (with subjects' permission) as examples to be used for demonstration or teaching purposes. This demonstration tape would be retained at the researcher's discretioiL However, you may request to have your data records withdrawn from this study and destroyed at any time.
CONSENT1 have read and fully understand the above information. My participation in this study is
completely voluntary.
Signature Date

109
Appendix 4
PERMISSION FORM SPECIFYING VIDEOTAPE USAGE
Project: Communication of Spontaneous Irony
Diane Pinch
Please indicate below the way(s) in which we may use the videotape made during this experiment. You may select some and not others — or none at all. Your experimenter will answer any questions you may have about these options.
Your tape would be identified only by subject number. The sheet that connects your name with this subject number will be kept separate in a secure place. Obviously, however, videotapes are not anonymous to anyone who knows you.
________analysis by the examiner andcoworkers on this project (e.g., Diane Pinch, Esther Strauss, other members o f dissertation committee, and possibly a research assistant)
________portions played as an examplefor professional audiences (e.g., at a professional presentation at another university)
_portions played as an examplefor classes at University of Victoria
________still photographs in journal articles or books
________none of the above; please erase the tape
Signature ____________________________ Date _
Project ____________________________Subject or Group Number
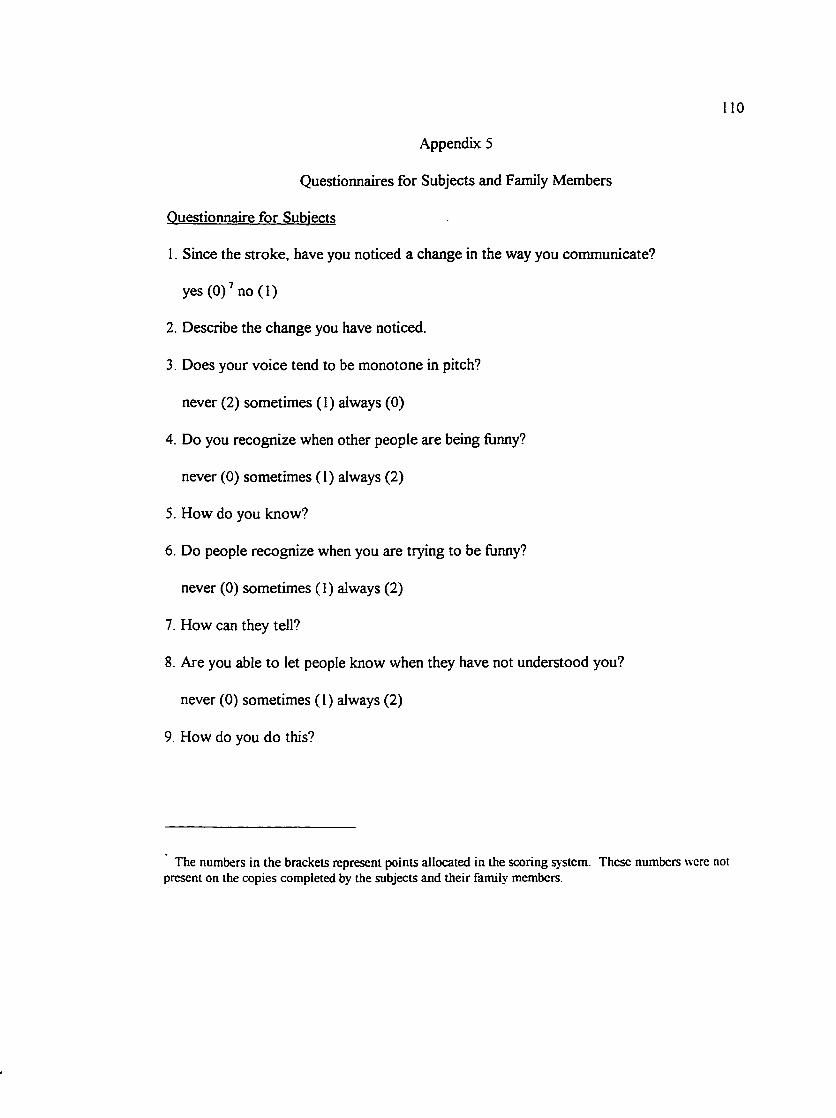
110
Appendix 5
Questionnaires for Subjects and Family Members
Questionnaire for Subjects
1. Since the stroke, have you noticed a change in the way you communicate?
yes (0)’ no (1)
2. Describe the change you have noticed.
3. Does your voice tend to be monotone in pitch?
never (2) sometimes (1) always (0)
4. Do you recognize when other people are being fiinny?
never (0) sometimes (1) always (2)
5. How do you know?
6. Do people recognize when you are trying to be funny?
never (0) sometimes ( 1 ) always (2)
7. How can they tell?
8. Are you able to let people know when they have not understood you?
never (0) sometimes ( 1 ) always (2)
9. How do you do this?
The numbers in the brackets represent points allocated in the scoring system. These numbers were not present on the copies completed by the subjects and their family members.
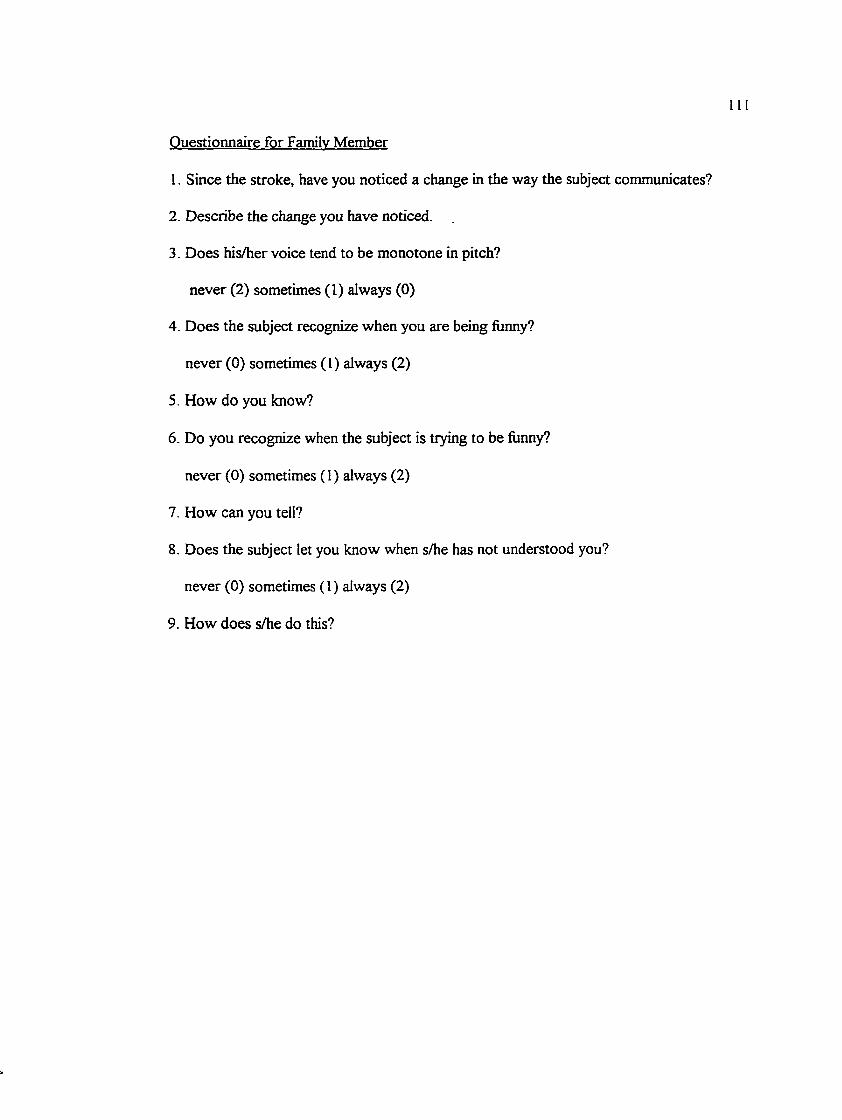
II
Questionnaire for Family Member
1. Since the stroke, have you noticed a change in the way the subject communicates?
2. Describe the change you have noticed.
3. Does his/her voice tend to be monotone in pitch?
never (2) sometimes (1) always (0)
4. Does the subject recognize when you are being funny?
never (0) sometimes (I) always (2)
5. How do you know?
6. Do you recognize when the subject is trying to be flinny?
never (0) sometimes (I) always (2)
7. How can you tell?
8. Does the subject let you know when s/he has not understood you?
never (0) sometimes ( I ) always (2)
9. How does s/he do this?
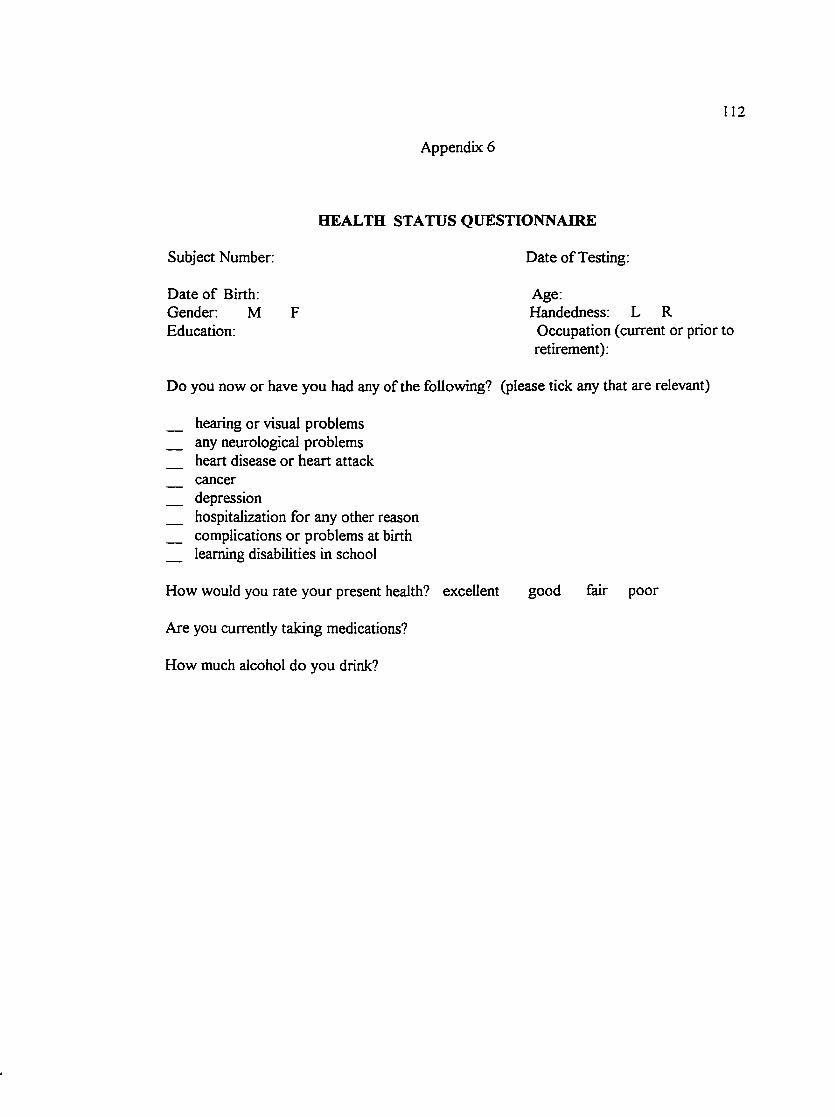
12
Appendix 6
Subject Number:
Date of Birth: Gender: MEducation:
HEALTH STATUS QUESTIONNAIRE
Date of Testing:
Age:Handedness: L R
Occupation (current or prior to retirement):
Do you now or have you had any of the following? (please tick any that are relevant)
hearing or visual problems any neurological problems heart disease or heart attack cancer depression hospitalization for any other reason complications or problems at birth learning disabilities in school
How would you rate your present health? excellent
Are you currently taking medications?
How much alcohol do you drink?
good fair poor
113
Appendix 7
INSTRUCTIONS FOR IDENTIFYING INSTANCES OF SPONTANEOUS IRONY*
An instance of spontaneous irony is a discourse event in which people convey a
message which is not meant to be interpreted literally. In many cases it is approximately
the opposite o f the literal meaning of the words actually said. In general, spontaneous
irony has three identifying features: (a) a discrepancy between the literal and intended
meaning, (b) a contradictory (and often humourous) twist to the utterance, and (c)
spontaneity that is arising from the immediate moment. Examples are provided below.
The irony is often accomplished through the addition of certain paralinguistic activities
such as a change in intonation pattern and/or visible activities such as facial displays. In
other words, the intended meaning of the utterance is not necessarily contained in the
literal meaning of the words but rather the audible and visible activities must be used to
interpret the utterance adequately. It is important to note, however, that paralinguistic
features are not a necessary feature and that in some cases, instances o f spontaneous irony
may only be obvious through shared knowledge of the context or background
conversation. It must also be noted that spontaneous irony does not include instances of
other nonliteral speech because they do not fit the humour or spontaneity criteria just
described. Examples that are not included are:
*indirect or polite requests (e.g., “Can you pass the salt?”)
*cliches (e.g., “I am addicted to ice cream”)
* slang (e.g., “you are the cat’s meow”)
^metaphors (e.g., “he has a heavy heart”)
* equivocation (e.g., if given a gift you do not like and you comment that it is
“interesting” to be polite)
Expansion/adaptation of rules from Linda Cof rules from Linda Coates’ study
114
*jokes (these are scripted and not considered spontaneous)
Also not to be included in this study are more subtle types o f spontaneous irony such as:
* minimizations (presents point as if unimportant or barely adequate; an
understatement) e.g., “Let’s have crackers with pig brain dip” “OK that’ll do”
*hyperbole (extreme embellishment or overstatement o f a feature) e.g., “He has a
million suits in his closet” (i.e., he has many but not literally a million suits)
TYPES OF SPONTANEOUS IRONY:
Reversal or use o f antonvms: the paraphrased or intended meaning is approximately
opposite the literal meaning of the words.
e.g. huge for small, “What a huge doe” describing a chihuahua
“You’re such a slug” for someone who is energetic
“What a nice dress” for “What a bizarre dress”
Impossibilitv: presents as possible or true that which is not; is counterfactual
e.g. when asked to choose someone to send on a rotten holiday, “VanderZalm and
Harcourt to share a single room” (They are political rivals and would not want to
share a room)
“I’ll iust wave mv magic wand and the work will be done” for impossible work
load
115
when asked where she would wear one o f the ugly outfits, ‘T o bed” (This is
counterfactual or not literally true; instead she is indicating how much she dislikes
the thought o f wearing one of the outfits)
Sarcasm: includes cutting or cruelly humourous remarks. These may not show the
“opposite” meaning between literal and paraphrased meanings to the same extent as
described in some of the other types o f spontaneous irony but instead perhaps a stretching
of the point or caricature of the intended meaning. These remarks may be accompanied by
a change in intonation or facial displays, e.g., rolling of the eyes, to indicate to the listener
that the remark is sarcastic.
e.g., Mulroney should be sent on a holiday to Russia “to learn how to invest even more
of his money”
Another speaker, when deciding who should be sent on a holiday suggested
“Saddam Hussein, Tanya Harding, and “Charlie Brown” (a pseudonym for an
acquaintance of one of the them). The partner responded “particularly Charlie
Brown” with lower pitch and rolling of the eyes.
Personal insults (relatively uncommon with strangers): overt criticism of the other person
or self
e.g., “You’re a nerd” and meaning “you’re hip/cool”
Plav on words (puns) e.g., “mavbe their marriage will have a lot of ups and downs” when
discussing a wedding having taken place on a roller coaster
116
Escalations: multiple spontaneous ironies (often increasingly subtle)
e.g., “Where would I wear it? I would wear it down to Goodwill and give it to them”,
talking about a bizarre dress she would never wear in public (spontaneous irony
by first speaker, she would not literally wear the outfit to Goodwill but is instead
indicating how much she dislikes the dress and that she would not want to wear
it)
“They might turn you out.” (escalation by second speaker; Goodwill would not
literally send her out o f the store. Instead the listener is agreeing that the dress
looks atrocious)
TASKS USED TO ELICIT EXAMPLES
a) "Plan a full course meal made of really awful foods that both of you (and probably
others) dislike. Discuss what this meal should consist of. Then both of you should decide
who you would serve this meal to. How you would issue the invitation?"
b) Pictures of seven bizarre-looking outfits from a National Enquirer feature of the 10
worst dresses were given along with the instructions, "Both of you are to look at these
pictures, (a) Agree upon the three worst-looking outfits and discuss why you think so
(b) If female: Decide which of these three outfits you would wear if you had to and where
117
you would wear it. (c) If male: Decide which of these three worst outfits you would give
as a present and who you would give it to.”
c) Each person looks at three pictures. "Look at these pictures together. Talk about what
you see in the pictures and give your opinion about the situations." One is of a wedding
taking place on a roller coaster (again fi’om the National Enquirer), the second is of a
woman impersonating the Queen doing her ironing, and the third is an ad picturing
ridiculously-dressed people at a pre-Christmas sale.
d) "Think o f a holiday plan made up o f places and activities that both of you (and probably
others) agree would be awful. Talk about what this holiday would be. Then think of who
you would like to send on this holiday. How would you encourage that person to go?"
Remember the task itself is often ironic, e.g., people do not usually plan a meal of
disliked foods. Therefore it is not an instance of irony if the participant is merely
conforming to the task and listing disliked foods (e.g., “Let’s have tripe and spinach with
chocolate sauce” V They may say utterances that are merely clarifications of the task (e.g.,
“So we should invite someone we do not like”) or roleplay or carry out the pretense or
fantasy of the task (e.g., “Let’s invite Mike Harcourt:” “Let’s sav we are Cordon Bleu
Chefs and want to demonstrate our culinary ability:” “I would phone Brian Muronev to
invite him”! These should not be included as examples of spontaneous irony. On the
other hand, the following would be considered spontaneous irony: if the person says that
tripe and spinach with chocolate sauce would be wonderful (not literally true); if the
person says “I’m sure Mike Harcourt would love to come to this meal,” again not true; or
if the person says, “I would contact Brian Mulroney by ESP,” an impossibility.
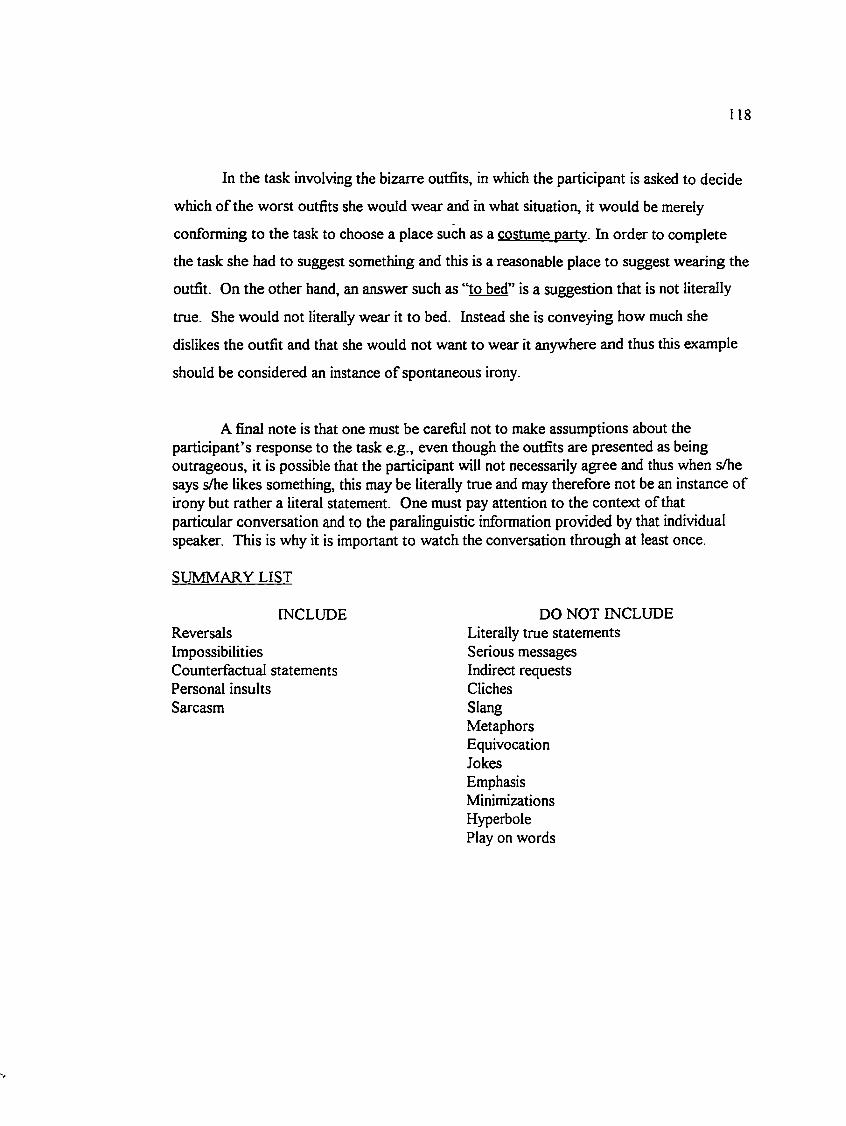
118
In the task involving the bizarre outfits, in which the participant is asked to decide
which of the worst outfits she would wear and in what situation, it would be merely
conforming to the task to choose a place such as a costume partv. In order to complete
the task she had to suggest something and this is a reasonable place to suggest wearing the
outfit. On the other hand, an answer such as “to bed” is a suggestion that is not literally
true. She would not literally wear it to bed. Instead she is conveying how much she
dislikes the outfit and that she would not want to wear it anywhere and thus this example
should be considered an instance o f spontaneous irony.
A final note is that one must be careful not to make assumptions about the participant’s response to the task e.g., even though the outfits are presented as being outrageous, it is possible that the participant will not necessarily agree and thus when s/he says s/he likes something, this may be literally true and may therefore not be an instance of irony but rather a literal statement. One must pay attention to the context of that particular conversation and to the paralinguistic information provided by that individual speaker. This is why it is important to watch the conversation through at least once.
SUMMARY LIST
INCLUDE DO NOT INCLUDEReversals Literally true statementsImpossibilities Serious messagesCounterfactual statements Indirect requestsPersonal insults ClichesSarcasm Slang
MetaphorsEquivocationJokesEmphasisMinimizationsHyperbolePlay on words
119
IDENTIFYING INSTANCES OF IRONY
Watch the dyad all the way through to get used to the communicative styles of the
interactants, e.g., one interlocutor may have a particularly melodious voice and may thus
trigger more instances o f possible spontaneous irony than are really present and vice versa,
an interactant may have a particularly dry sense of wit and his/her productions may be very
subtle. Follow the content o f the conversations closely. Usually, you will have to be
aware of what has been previously said in order to identify the instances. Frequently,
segments in the tape that seem playful or humourous will be instances. Out of the
ordinary intonation (e.g., singsong quality, too flat, too stressed, etc.), smiling, and
laughter will often serve as good cues to identify an instance. Remember, spontaneous
irony in conversation is often subtle.
1. Consider every utterance. Does the person literally mean what s/he is saying, bearing
in mind that the task may dictate that they talk about a hypothetical situation or
fantasy (e.g., the task is to construct a menu of disliked foods which one normally
does not do) e.g., “Let’s have tripe” said in a serious tone o f voice would not be an
instance whereas “Tripe would be a wonderful dish to serve” would be an example of
a reversal and thus an instance of irony.
2. When you find something on the tape that might be an instance of spontaneous irony,
rewind the tape so that you can listen again. Write the words and the paralinguistic
features down on the form, along with any background information needed to
understand the context.

120
3. Examine the transcribed words. Being as explicit as you can, write down the literal
(i.e., dictionary) meaning of the words. Be careful that you are examining the words
in isolation (i.e., do not look at intonation, facial displays, etc.)
4. Then write out a paraphrased meaning, i.e., what the person was intending to mean.
Use the paralinguistic features and visible attributes o f the utterance along with the
context, to decipher the meaning. Because of the subtle nature, it may be possible for
you to interpret more than one plausible intended meaning. If so, write out each one.
5.
If the intended and literal meanings mean essentially the same (i.e., are congruent), then it is not an instance.
If the intended and literal meanings are definitely incongruent, consider whether they are examples of any of the following:
1. Indirect or polite requests e.g. Can you pass the salt?
2. cliches e.g.. I’ll eat anything (said in “regular” tone of voice with no paralinguistic features used to indicate mockery, minimization, or exaggeration)
3. slang (e.g., “he is the cat’s meow”)
4. metaphors (e.g., “he has a heavy heart”)
5. humor (a joke is funny and may cause laughter
If there is more than one plausible intended meaning, consider the following:
1. If all intended meanings are congruent with the literal, then it is not an instance.
2. If all intended meanings are incongruent with the literal, then it is one.
3. If some are congruent and some are not and all are equally plausible, then do not consider it as an instance (too ambiguous).
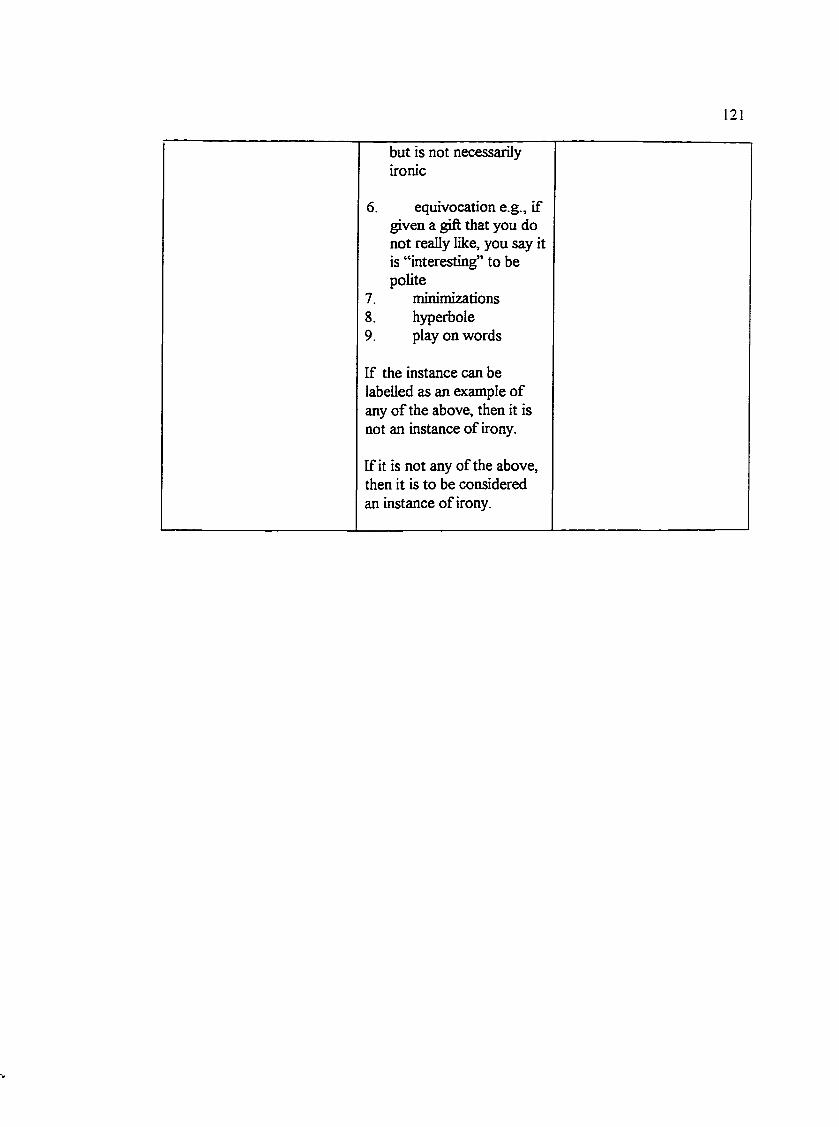
121
but is not necessarily ironic
6. equivocation e.g., if given a gift that you do not really like, you say it is “interesting” to be polite
7. minimizations8. hyperbole9. play on words
If the instance can be labelled as an example of any of the above, then it is not an instance of irony.
If it is not any of the above, then it is to be considered an instance of irony.
122
Appendix 8
Procedure to Judge Success or Failure o f Spontaneous Irony;
1. Set the VCR counter to 0.
2. Watch the video through once without stopping while glancing at the transcription
sheet. Note: These transcriptions are just a method to help you locate the instances. They
do not contain all the nonverbal features that you may need to judge success or failure of
the instances.
3. Rewind the video to 0 and play it again stopping at the starred sections. You may
want to write down the counter number, so you can find the item again.
4. The starred items are instances of irony. An ironic instance is a set of words that is
intended to mean approximately the opposite of its literal meaning and can include irony,
sarcasm, punning, etc. (Note: This is Linda Coates’ definition from her thesis). Common
types of irony are reversals, presenting something as possible or true when not, etc. I have
given you a paraphrased and literal interpretation for each instance along with a
categorization of the instance. If at any point you disagree with the paraphrased or literal
interpretation, the type of irony listed, or the identification of the starred section as irony,
please note that on the transcription sheet along with your reasoning.
5. Your job is to decide whether the irony was successful or not. An instance of irony
can be broken down into four stages:
a. Calibration - the two participants establish a common ground or shared viewpoint
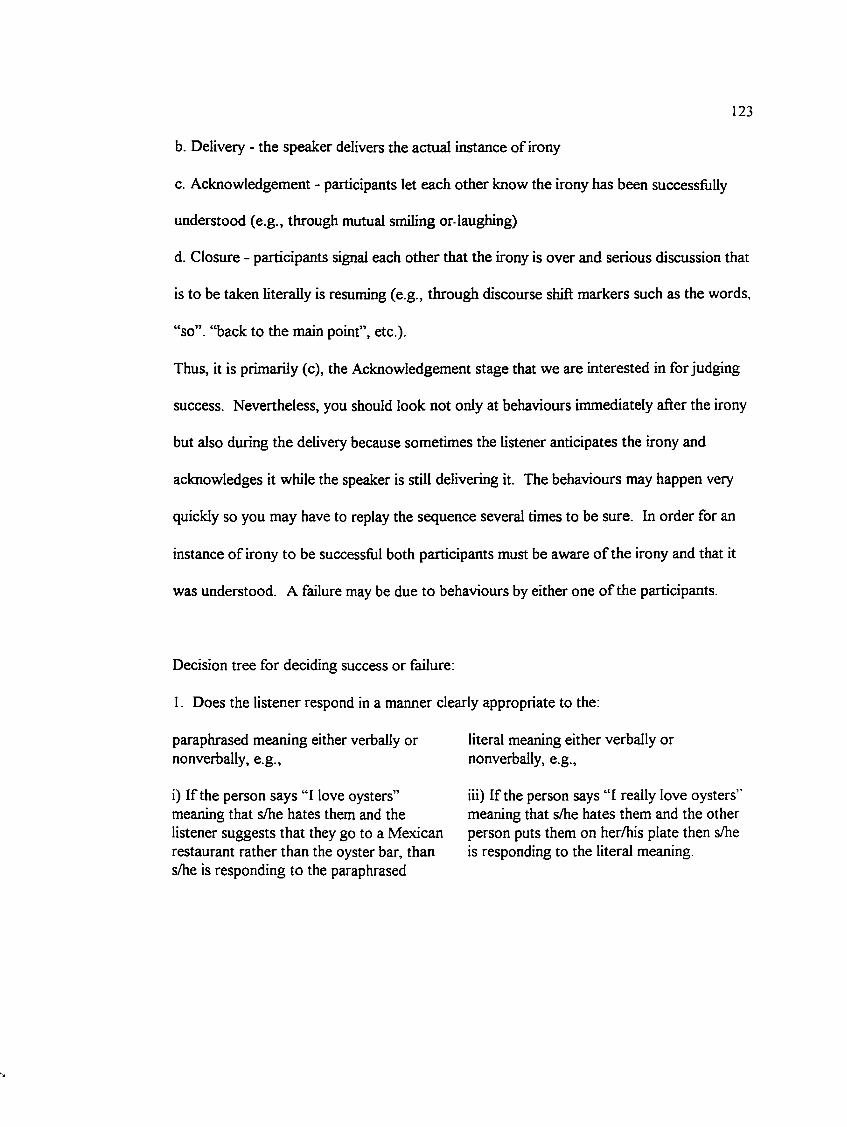
123
b. Delivery - the speaker delivers the actual instance of irony
c. Acknowledgement - participants let each other know the irony has been successfully
understood (e.g., through mutual smiling or laughing)
d. Closure - participants signal each other that the irony is over and serious discussion that
is to be taken literally is resuming (e.g., through discourse shift markers such as the words,
“so”, “back to the main point”, etc.).
Thus, it is primarily (c), the Acknowledgement stage that we are interested in forjudging
success. Nevertheless, you should look not only at behaviours immediately after the irony
but also during the delivery because sometimes the listener anticipates the irony and
acknowledges it while the speaker is still delivering it. The behaviours may happen very
quickly so you may have to replay the sequence several times to be sure. In order for an
instance of irony to be successful both participants must be aware of the irony and that it
was understood. A failure may be due to behaviours by either one o f the participants.
Decision tree for deciding success or failure;
1. Does the listener respond in a manner clearly appropriate to the:
paraphrased meaning either verbally or literal meaning either verbally ornonverbally, e.g., nonverbally, e.g.,
i) If the person says “I love oysters” iii) If the person says “I really love oysters”meaning that s/he hates them and the meaning that s/he hates them and the otherlistener suggests that they go to a Mexican person puts them on her/his plate then s/herestaurant rather than the oyster bar, than is responding to the literal meaning,s/he is responding to the paraphrased
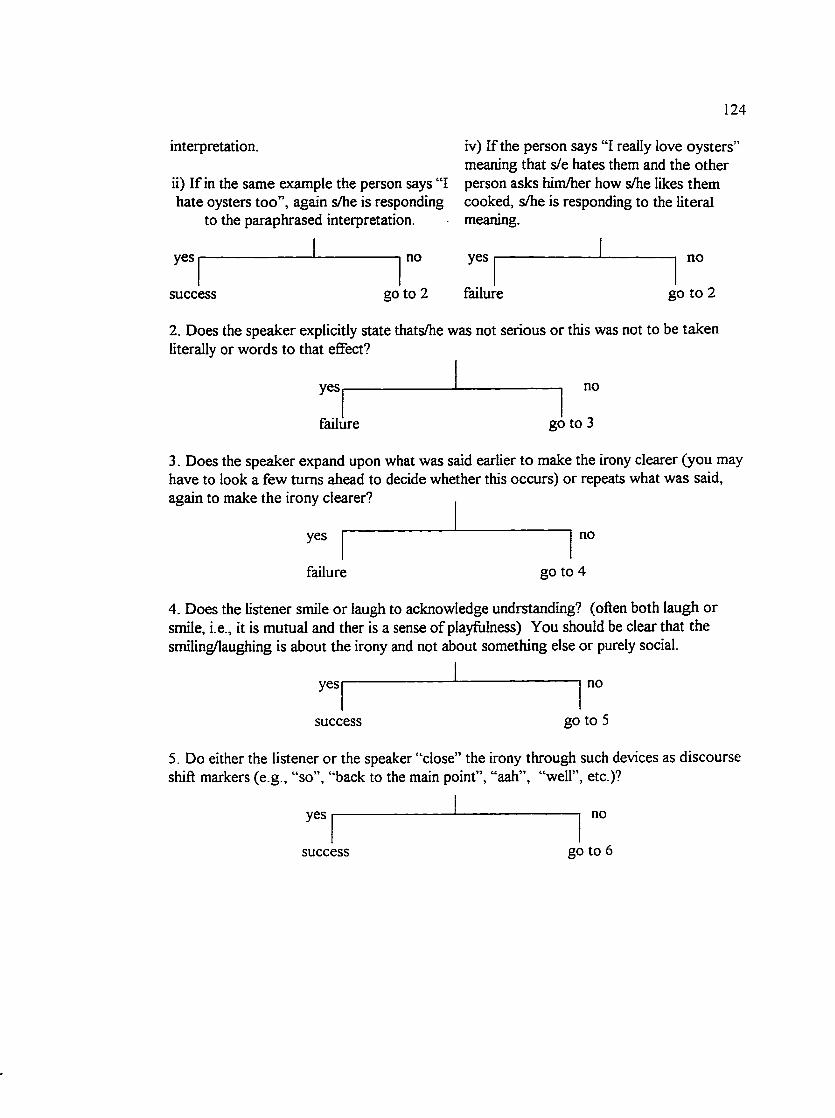
124
interpretation.
ii) If in the same example the person says “I hate oysters too”, again s/he is responding
to the paraphrased interpretation.
iv) If the person says “I really love oysters' meaning that s/e hates them and the other person asks him/her how s/he likes them cooked, s/he is responding to the literal meaning.
yes
success
no yes
go to 2 failure
no
go to 2
2. Does the speaker explicitly state thats/he was not serious or this was not to be taken literally or words to that effect?
yes
failure
no
go to 3
3. Does the speaker expand upon what was said earlier to make the irony clearer (you may have to look a few turns ahead to decide whether this occurs) or repeats what was said, again to make the irony clearer?
yes
failure
no
go to 4
4. Does the listener smile or laugh to acknowledge undrstanding? (often both laugh or smile, i.e., it is mutual and ther is a sense of playfitlness) You should be clear that the smiling/laughing is about the irony and not about something else or purely social.
yes —
success
no
go to 5
5. Do either the listener or the speaker “close” the irony through such devices as discourse shift markers (e.g., “so”, “back to the main point”, “aah”, “well”, etc.)?
yes no
success go to 6
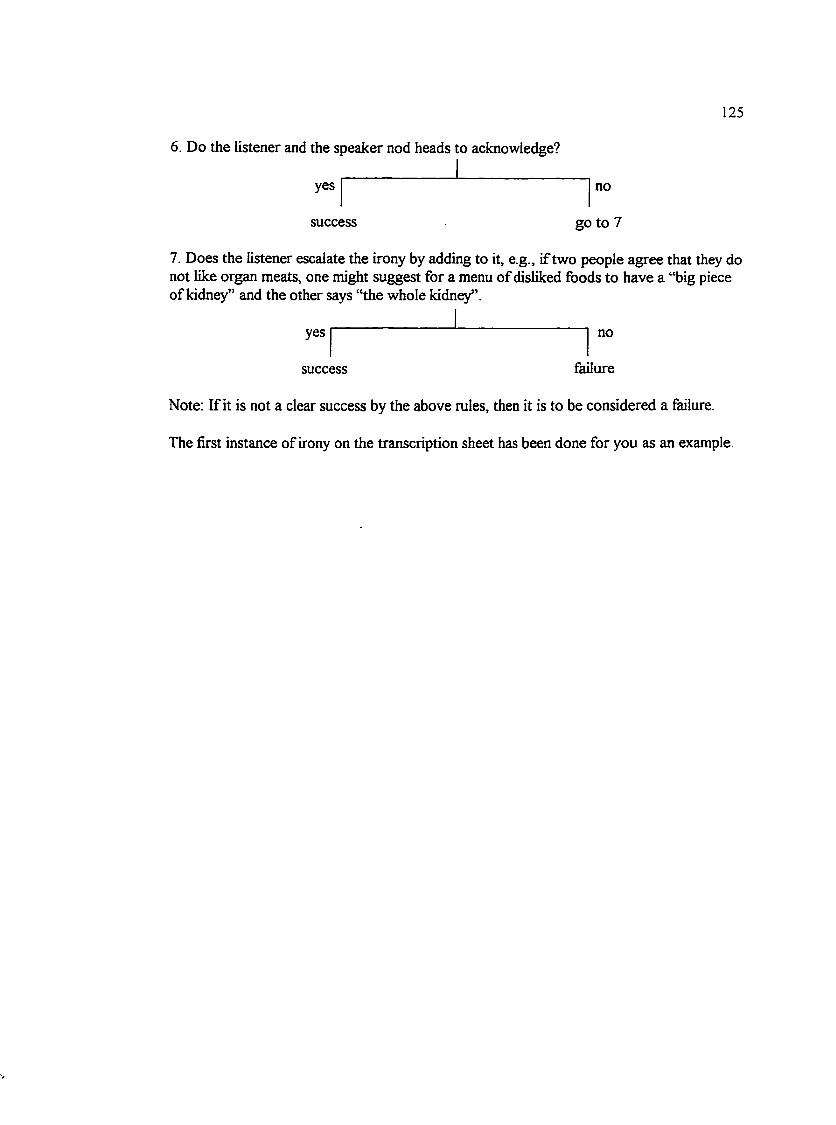
125
6. Do the listener and the speaker nod heads to acknowledge?
yes
success
no
go to 7
7. Does the listener escalate the irony by adding to it, e.g., if two people agree that they do not like organ meats, one might suggest for a menu of disliked foods to have a “big piece of kidney” and the other says “the whole kidney”.
yes
success
no
failure
Note: If it is not a clear success by the above rules, then it is to be considered a failure.
The first instance of irony on the transcription sheet has been done for you as an example.
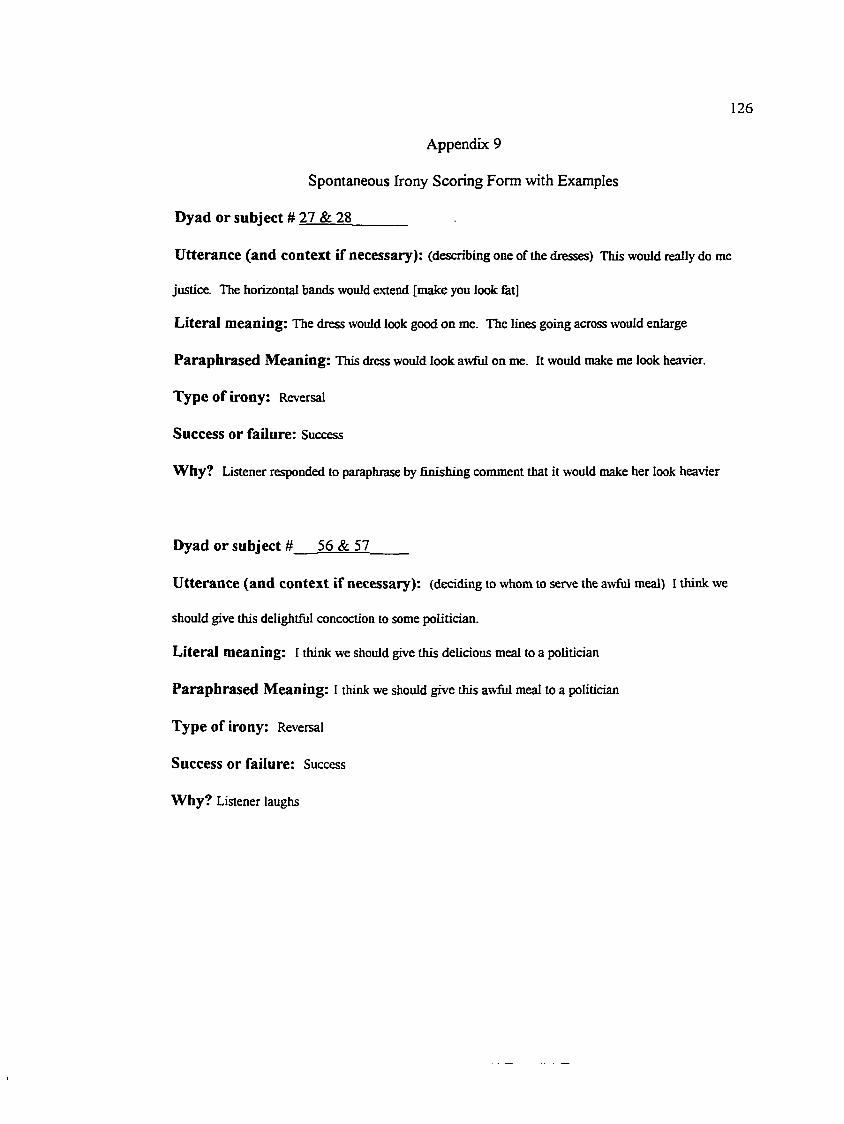
126
Appendix 9
Spontaneous Irony Scoring Form with Examples
Dyad or subject # 27 & 28_______
Utterance (and context if necessary): (describing one of the dresses) This would really do me
justice. The horizontal bands would extend [make you look fat]
Literal meaning: The dress would look good on me. The lines going across would enlarge
Paraphrased Meaning: This dress would look awful on me. It would make me look heavier.
Type of irony: Reversal
Success or failure: Success
Why? Listener responded to paraphrase by finishing comment that it would make her look heavier
Dyad or subject # 56 & 57_____
Utterance (and context if necessary): (deciding to whom to serve the awful meal) I think we
should give this delightful concoction to some politician.
Literal meaning: I think we should give this delicious meal to a politician
Paraphrased Meaning: I think we should give this awful meal to a politician
Type of irony: Reversal
Success or failure: Success
Why? Listener laughs
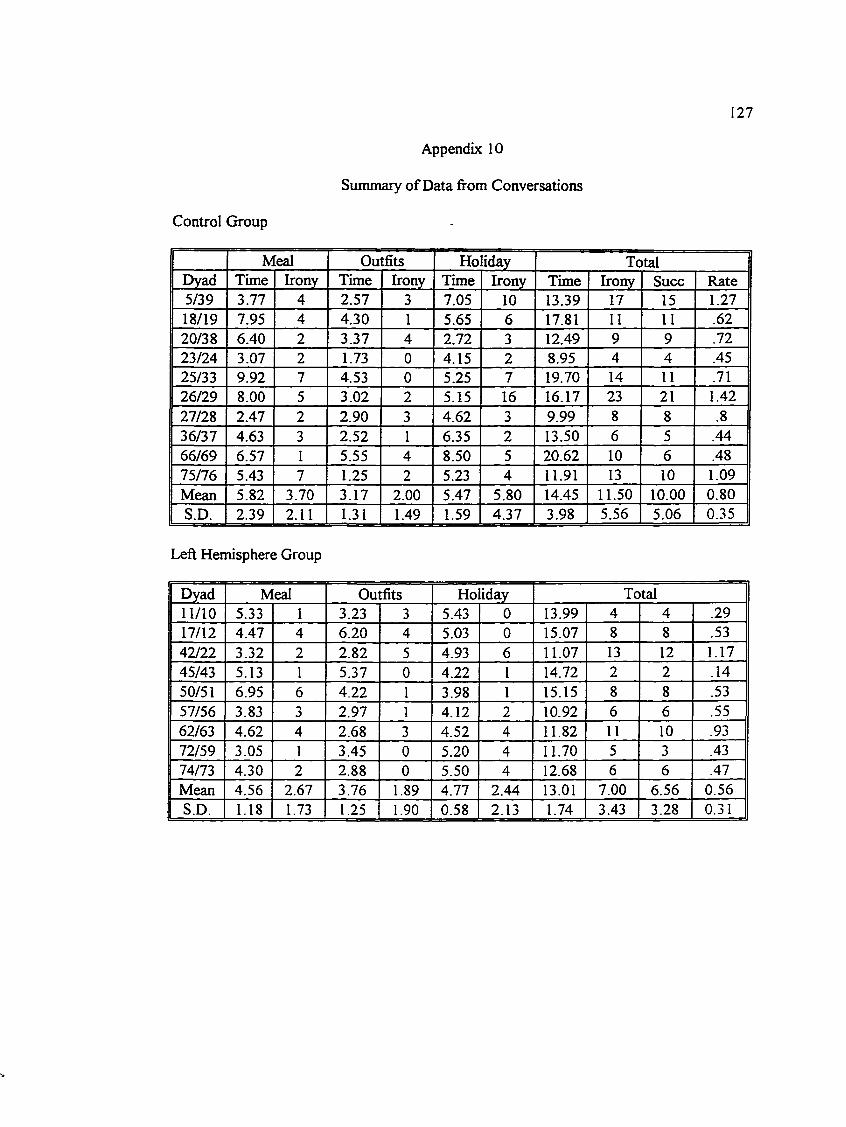
127
Appendix 10
Summary of Data from Conversations
Control Group
M[eal Outfits Ho iday TotalDyad Time Irony Time Irony Time Irony Time Irony Succ Rate5/39 3.77 4 2.57 3 7.05 10 13.39 17 15 1.2718/19 7.95 4 4.30 1 5.65 6 17.81 11 11 .6220/38 6.40 2 3.37 4 2.72 3 12.49 9 9 .7223/24 3.07 2 1.73 0 4.15 2 8.95 4 4 .4525/33 9.92 7 4.53 0 5.25 7 19.70 14 11 .7126/29 8.00 5 3.02 2 5.15 16 16.17 23 21 1.4227/28 2.47 2 2.90 3 4.62 3 9.99 8 8 .836/37 4.63 3 2.52 1 6.35 2 13.50 6 5 .4466/69 6.57 1 5.55 4 8.50 5 20.62 10 6 .4875/76 5.43 7 1.25 2 5.23 4 11.91 13 10 1.09Mean 5.82 3.70 3.17 2.00 5.47 5.80 14.45 11.50 10.00 0.80S.D. 2.39 2.11 1.31 1.49 1.59 4.37 3.98 5.56 5.06 0.35
Left Hemisphere Group
Dyad Meal Outfits Ho iday Total11/10 5.33 1 3.23 3 5.43 0 13.99 4 4 .2917/12 4.47 4 6.20 4 5.03 0 15.07 8 8 .5342/22 3.32 2 2.82 5 4.93 6 11.07 13 12 1.1745/43 5.13 1 5.37 0 4.22 1 14.72 2 2 .1450/51 6.95 6 4.22 1 3.98 1 15.15 8 8 .5357/56 3.83 3 2.97 1 4.12 2 10.92 6 6 .5562/63 4.62 4 2.68 3 4.52 4 11.82 11 10 .9372/59 3.05 1 3.45 0 5.20 4 11.70 5 3 .4374/73 4.30 2 2.88 0 5.50 4 12.68 6 6 .47Mean 4.56 2.67 3.76 1.89 4.77 2.44 13.01 7.00 6.56 0.56S.D. 1.18 1.73 1.25 1.90 0.58 2.13 1.74 3.43 3.28 0.31
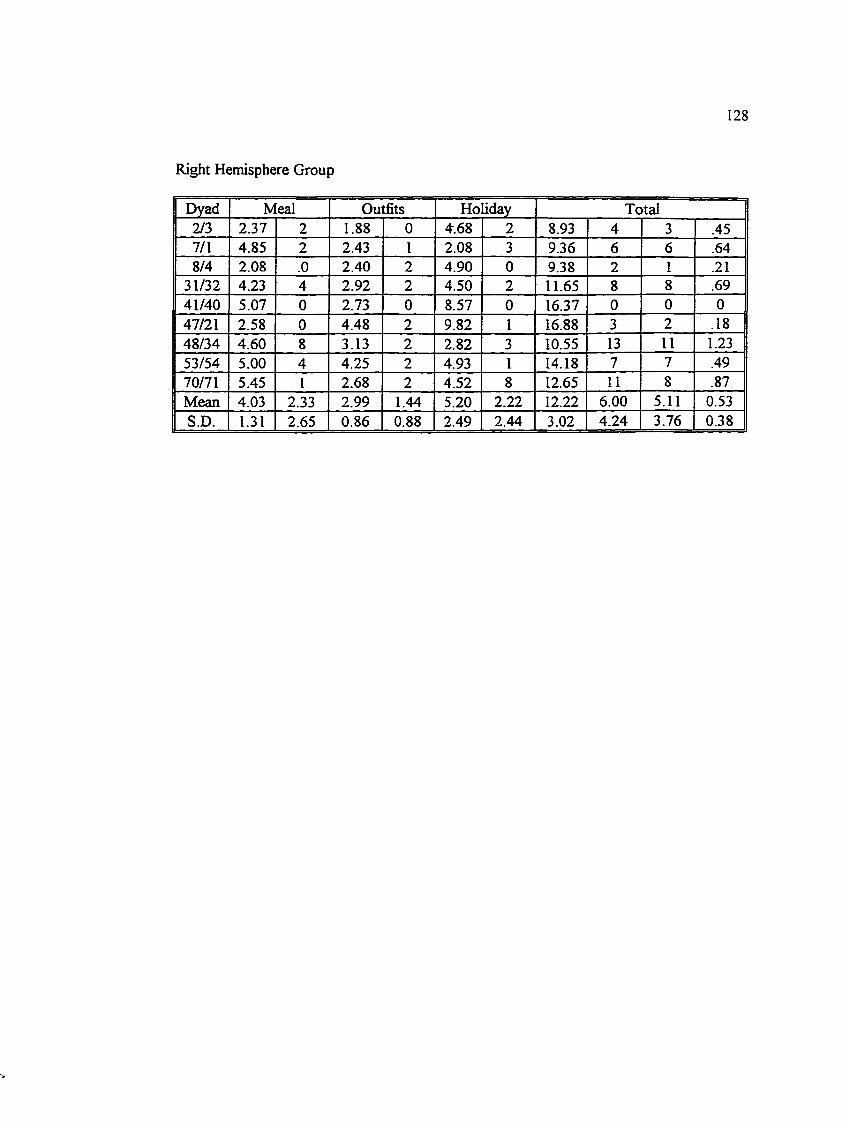
Right Hemisphere Group
128
Dyad Meal Outfits Ho liday Total2/3 2.37 2 1.88 0 4.68 2 8.93 4 3 .457/1 4.85 2 2.43 1 2.08 3 9.36 6 6 .648/4 2.08 .0 2.40 2 4.90 0 9.38 2 1 .21
31/32 4.23 4 2.92 2 4.50 2 11.65 8 8 .6941/40 5.07 0 2.73 0 8.57 0 16.37 0 0 047/21 2.58 0 4.48 2 9.82 1 16.88 3 2 .1848/34 4.60 8 3.13 2 2.82 3 10.55 13 11 1.2353/54 5.00 4 4.25 2 4.93 1 14.18 7 7 .4970/71 5.45 1 2.68 2 4.52 8 12.65 11 8 .87Mean 4.03 2.33 2.99 1.44 5.20 2.22 12.22 6.00 5.11 0.53S.D. 1.31 2.65 0.86 0.88 2.49 2.44 3.02 4.24 3.76 0.38
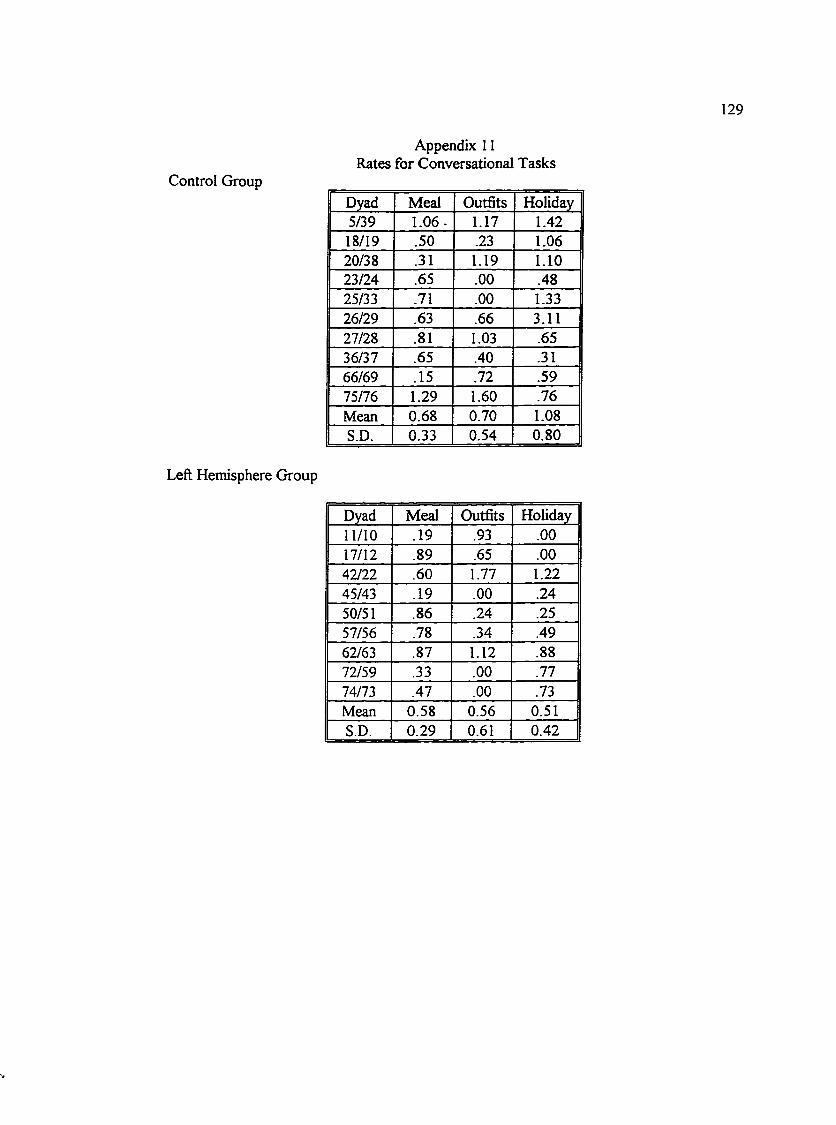
129
Control Group
Appendix 11 Rates for Conversational Tasks
Dyad Meal Outfits Holiday5/39 1.06- 1.17 1.4218/19 .50 .23 1.0620/38 .31 1.19 1.1023/24 .65 .00 .4825/33 .71 .00 1.3326/29 .63 .66 3.1127/28 .81 1.03 .6536/37 .65 .40 .3166/69 .15 .72 .5975/76 1.29 1.60 .76Mean 0.68 0.70 1.08S.D. 0.33 0.54 0.80
Left Hemisphere Group
Dyad Meal Outfits Holiday11/10 .19 .93 .0017/12 .89 .65 .0042/22 .60 1.77 1.2245/43 .19 .00 .2450/51 .86 .24 .2557/56 .78 .34 .4962/63 .87 1.12 .8872/59 .33 .00 .7774/73 .47 .00 .73Mean 0.58 0.56 0.51S.D. 0.29 0.61 0.42
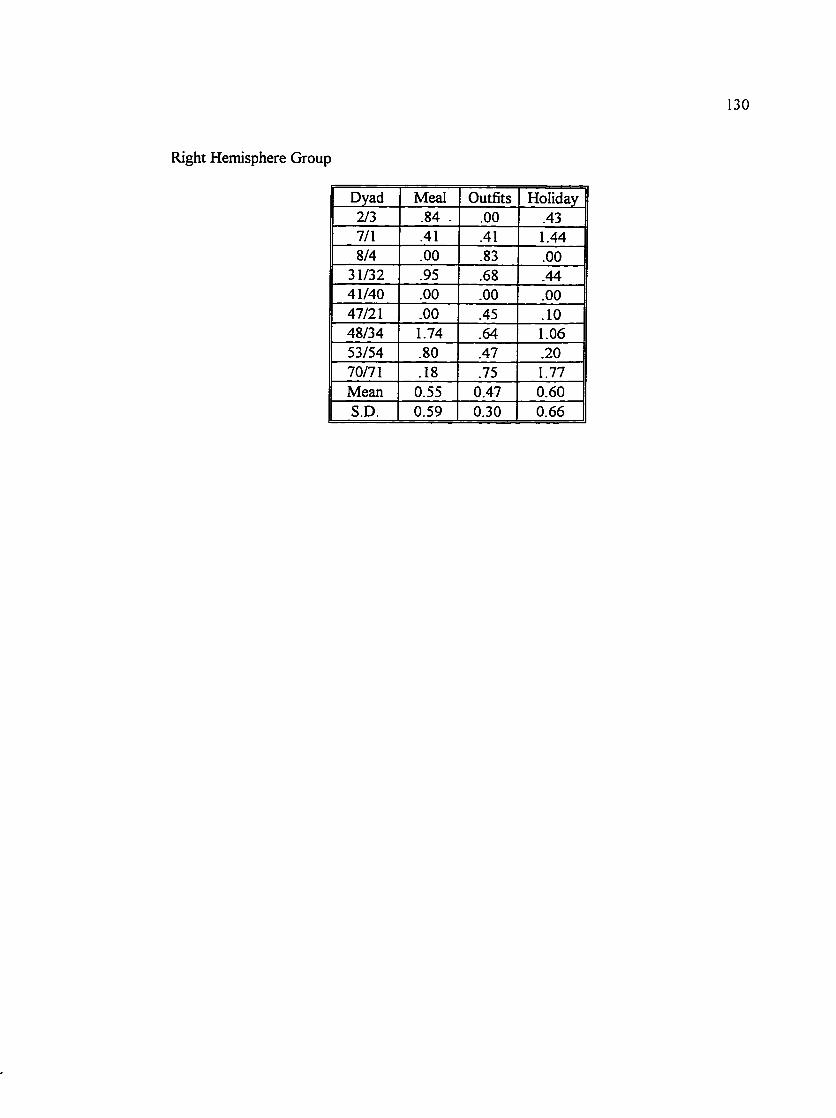
Right Hemisphere Group
130
Dyad Meal Outfits Holiday2/3 .84 - .00 .437/1 .41 .41 1.448/4 .00 .83 .00
31/32 .95 .68 .4441/40 .00 .00 .0047/21 .00 .45 .1048/34 1.74 .64 1.0653/54 .80 .47 .2070/71 .18 .75 1.77Mean 0.55 0.47 0.60S.D. 0.59 0.30 0.66
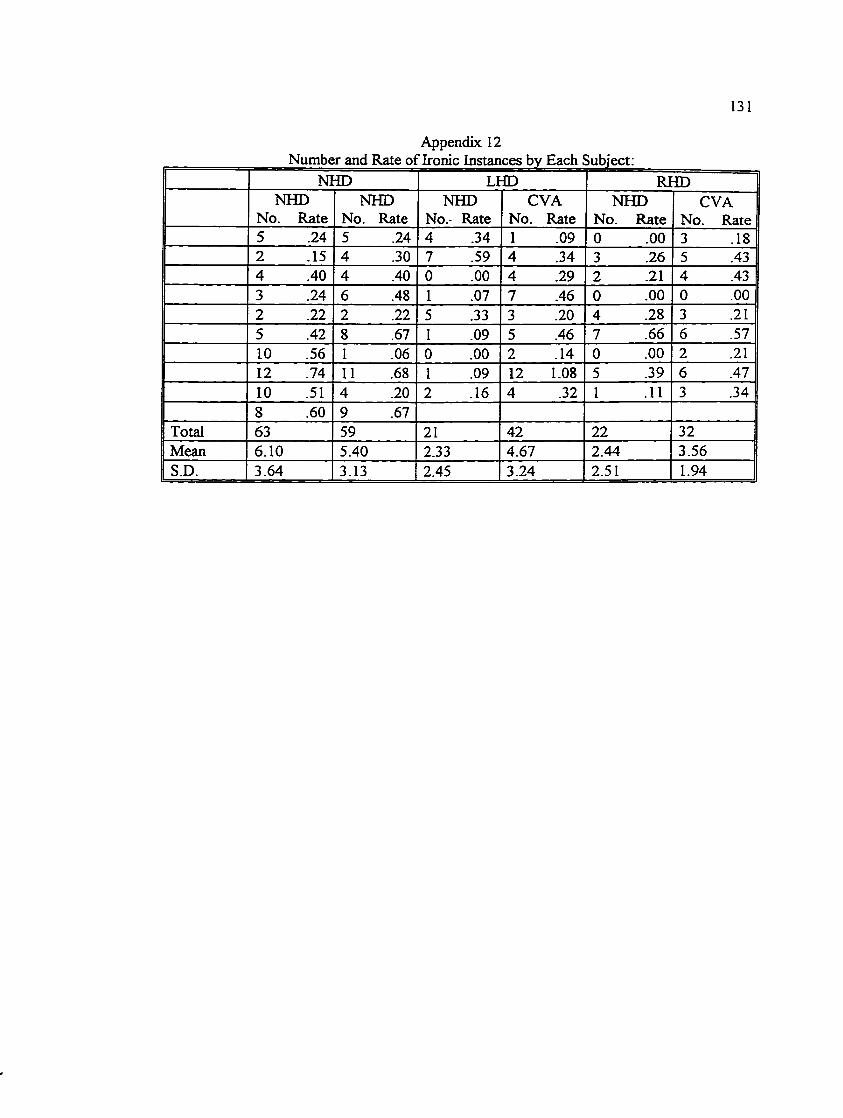
131
Appendix 12
NHD LHD RHDNHD NHD NHD CVA NHD CVA
No. Rate No. Rate No. Rate No. Rate No. Rate No. Rate5 .24 5 .24 4 .34 1 .09 0 .00 3 .182 .15 4 .30 7 .59 4 .34 3 .26 5 .434 .40 4 .40 0 .00 4 .29 2 .21 4 .433 .24 6 .48 1 .07 7 .46 0 .00 0 .002 .22 2 .22 5 .33 3 .20 4 .28 3 .215 .42 8 .67 I .09 5 .46 7 .66 6 .5710 .56 1 .06 0 .00 2 .14 0 .00 2 .2112 .74 11 .68 1 .09 12 1.08 5 .39 6 .4710 .51 4 .20 2 .16 4 .32 1 .11 3 .348 .60 9 .67
Total 63 59 21 42 22 32Mean 6.10 5.40 2.33 4.67 2.44 3.56S.D. 3.64 3.13 2.45 3.24 2.51 1.94
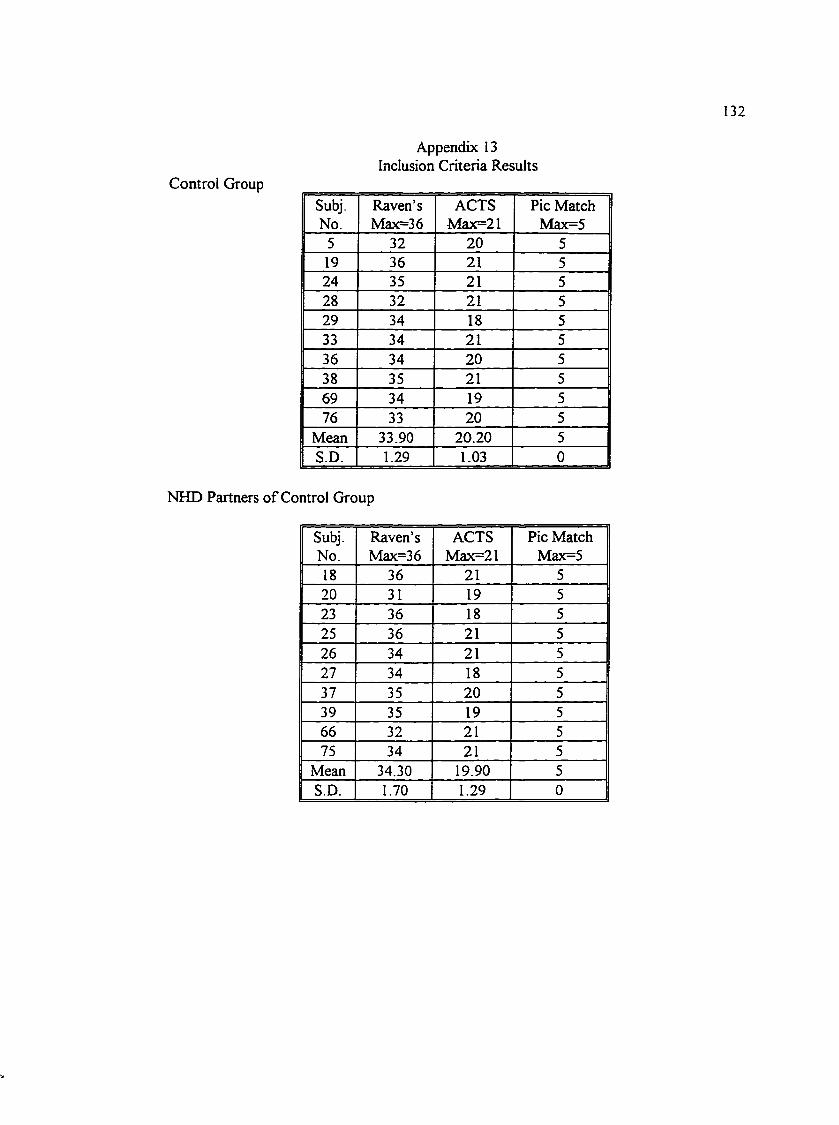
132
Control Group
Appendix 13 Inclusion Criteria Results
Subj. Raven’s ACTS Pic MatchNo. Max=36 Max=21 Max=5
5 32 20 519 36 21 524 35 21 528 32 21 529 34 18 533 34 21 536 34 20 538 35 21 569 34 19 576 33 20 5
Mean 33.90 20.20 5S.D. 1.29 1.03 0
NHD Partners o f Control Group
Subj. Raven’s ACTS Pic MatchNo. Max=36 Max=21 Max=518 36 21 520 31 19 523 36 18 525 36 21 526 34 21 527 34 18 537 35 20 539 35 19 566 32 21 575 34 21 5
Mean 34.30 19.90 5S.D. 1.70 1.29 0
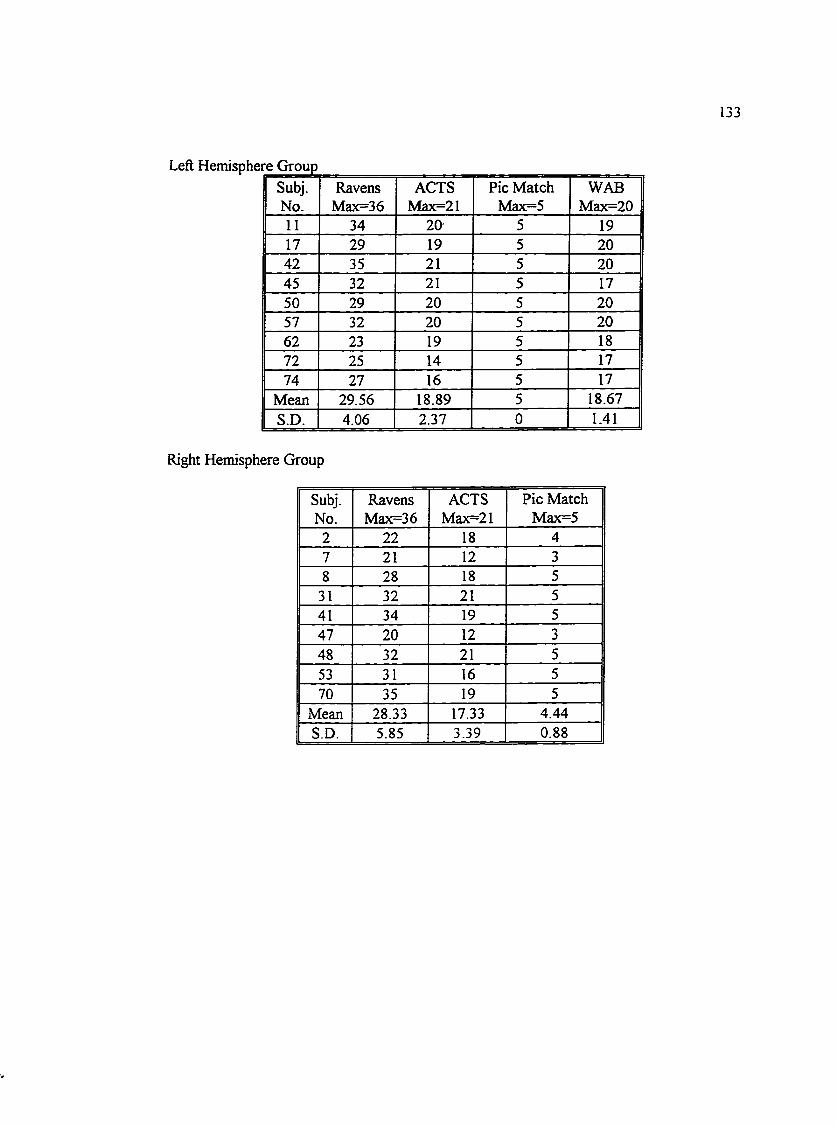
133
Left Hemisphere GroupSubj.No.
RavensMax=36
ACTSMax=21
Pic Match Max=5
WABMax=20
11 34 20- 5 1917 29 19 5 2042 35 21 5 2045 32 21 5 1750 29 20 5 2057 32 20 5 2062 23 19 5 1872 25 14 5 1774 27 16 5 17
Mean 29.56 18.89 5 18.67S.D. 4.06 2.37 0 1.41
Right Hemisphere Group
Subj.No.
RavensMax=36
ACTSMax=21
Pic Match Max=5
2 22 18 47 21 12 38 28 18 5
31 32 21 541 34 19 547 20 12 348 32 21 553 31 16 570 35 19 5
Mean 28.33 17.33 4.44S.D. 5.85 3.39 0.88
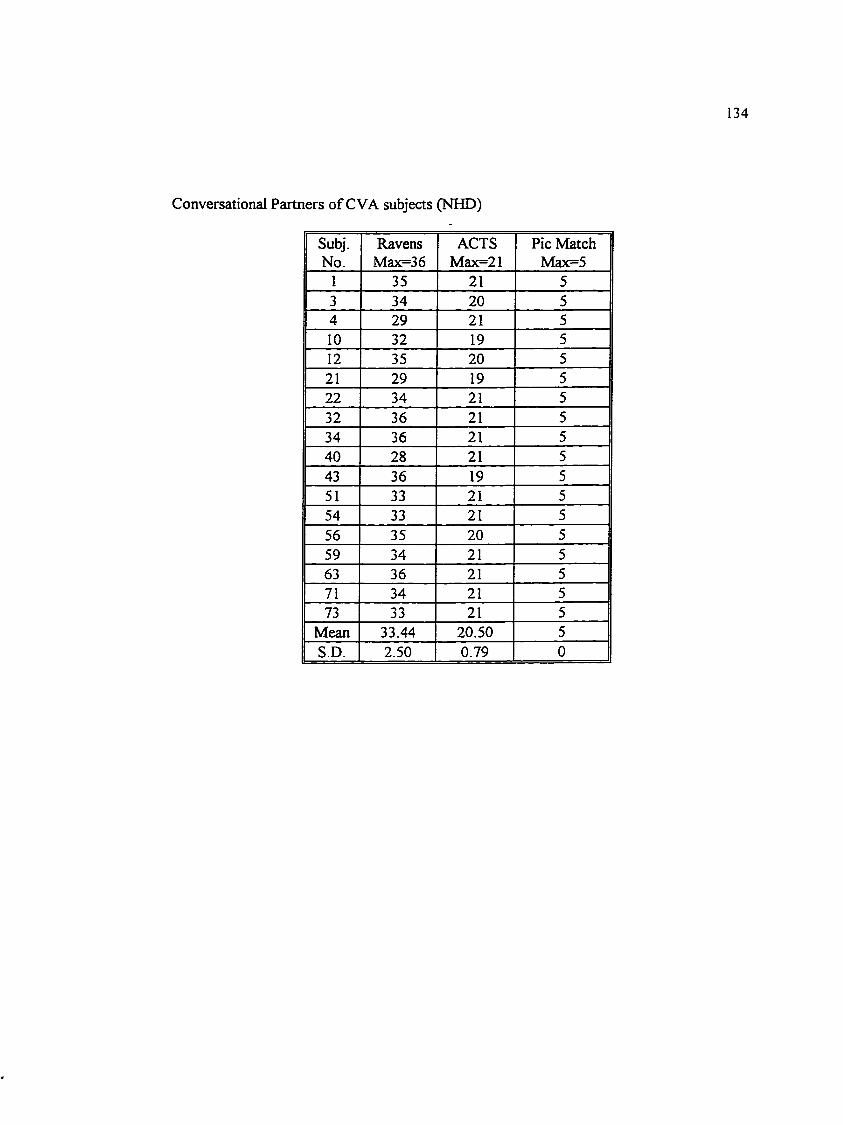
Conversational Partners of CVA subjects (NHD)
134
Subj. Ravens ACTS Pic MatchNo. Max=36 Max=21 Max=5
1 35 21 53 34 20 54 29 21 510 32 19 512 35 20 521 29 19 522 34 21 532 36 21 534 36 21 540 28 21 543 36 19 551 33 21 554 33 21 556 35 20 559 34 21 563 36 21 571 34 21 573 33 21 5
Mean 33.44 20.50 5S.D. 2.50 0.79 0
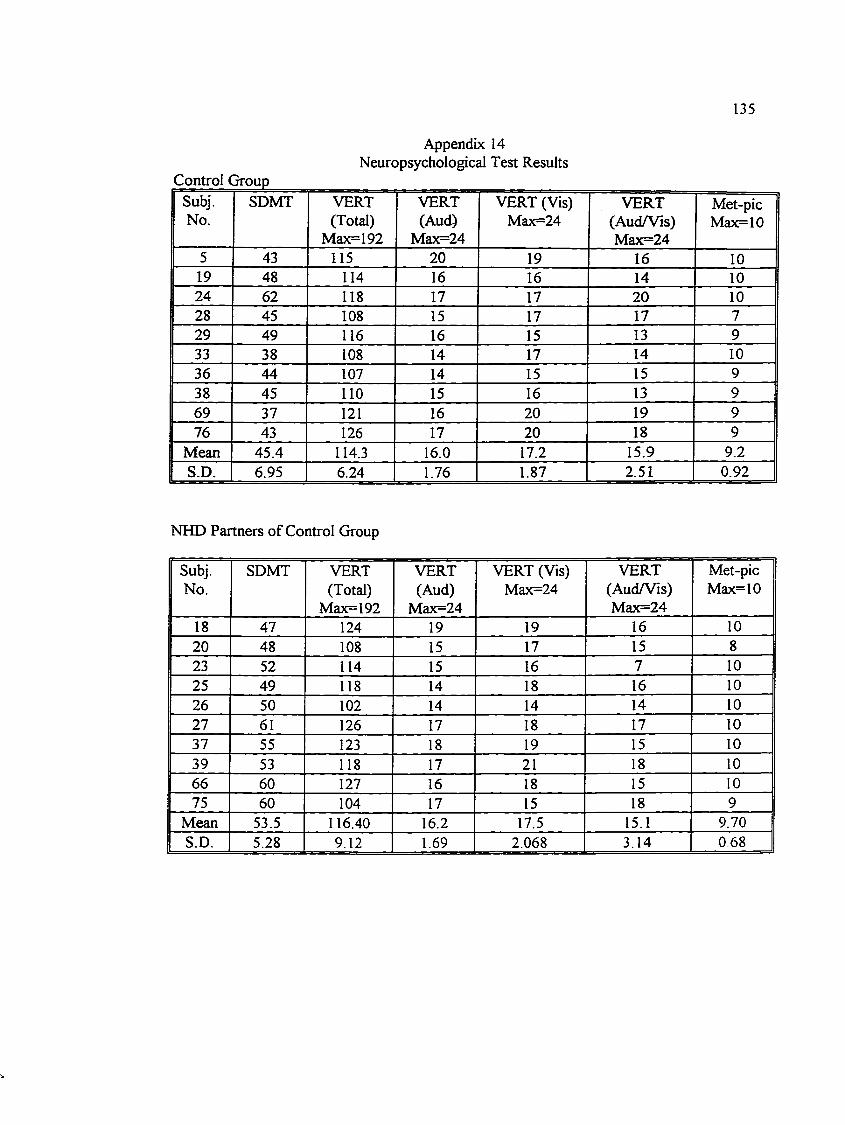
135
Control Group
Appendix 14 Neuropsychological Test Results
Subj.No.
SDMT VERT(Total)
Max=192
VERT(Aud)
Max=24
VERT (Vis) Max=24
VERT(Aud/Vis)Max=24
Met-picMax=10
5 43 115 20 19 16 1019 48 114 16 16 14 1024 62 118 17 17 20 1028 45 108 15 17 17 729 49 116 16 15 13 933 38 108 14 17 14 1036 44 107 14 15 15 938 45 110 15 16 13 969 37 121 16 20 19 976 43 126 17 20 18 9
Mean 45.4 114.3 16.0 17.2 15.9 9.2S.D. 6.95 6.24 1.76 1.87 2.51 0.92
NHD Partners of Control Group
Subj.No.
SDMT VERT(Total)
Max=192
VERT(Aud)
Max=24
VERT (Vis) Max=24
VERT(Aud/Vis)Max=24
Met-picMax=10
18 47 124 19 19 16 1020 48 108 15 17 15 823 52 114 15 16 7 1025 49 118 14 18 16 1026 50 102 14 14 14 1027 61 126 17 18 17 1037 55 123 18 19 15 1039 53 118 17 21 18 1066 60 127 16 18 15 1075 60 104 17 15 18 9
Mean 53.5 116.40 16.2 17.5 15.1 9.70S.D. 5.28 9.12 1.69 2.068 3.14 0.68
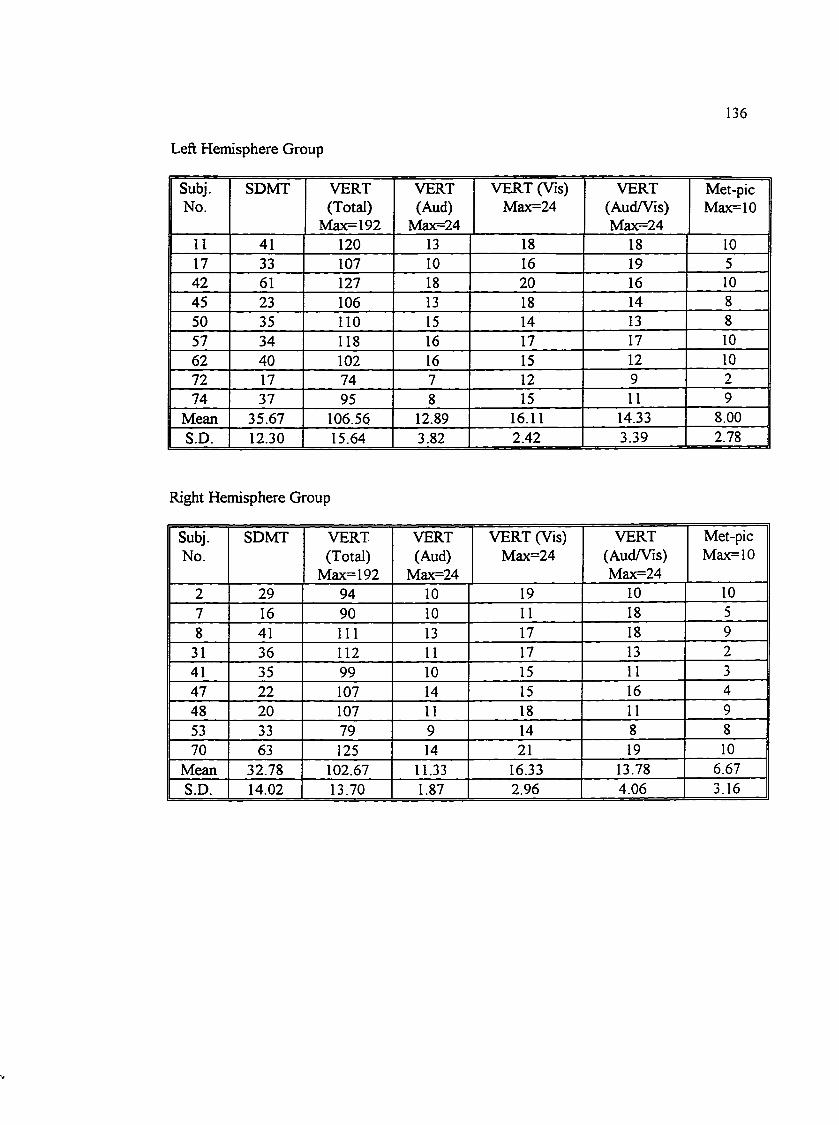
Left Hemisphere Group
136
Subj.No.
SDMT VERT(Total)
Max=192
VERT(Aud)
Max=24
VERT (Vis) Max=24
VERT(Aud/Vis)Max=24
Met-picMax=10
11 41 120 13 18 18 1017 33 107 10 16 19 542 61 127 18 20 16 1045 23 106 13 18 14 850 35 110 15 14 13 857 34 118 16 17 17 1062 40 102 16 15 12 1072 17 74 7 12 9 274 37 95 8 15 11 9
Mean 35.67 106.56 12.89 16.11 14.33 8.00S.D. 12.30 15.64 3.82 2.42 3.39 2.78
Right Hemisphere Group
Subj.No.
SDMT VERT(Total)
Max=I92
VERT(Aud)
Max=24
VERT (Vis) Max=24
VERT(Aud/Vis)Max=24
Met-picMax=10
2 29 94 10 19 10 107 16 90 10 11 18 58 41 111 13 17 18 9
31 36 112 11 17 13 241 35 99 10 15 11 347 22 107 14 15 16 448 20 107 11 18 11 953 33 79 9 14 8 870 63 125 14 21 19 10
Mean 32.78 102.67 11.33 16.33 13.78 6.67S.D. 14.02 13.70 1.87 2.96 4.06 3.16
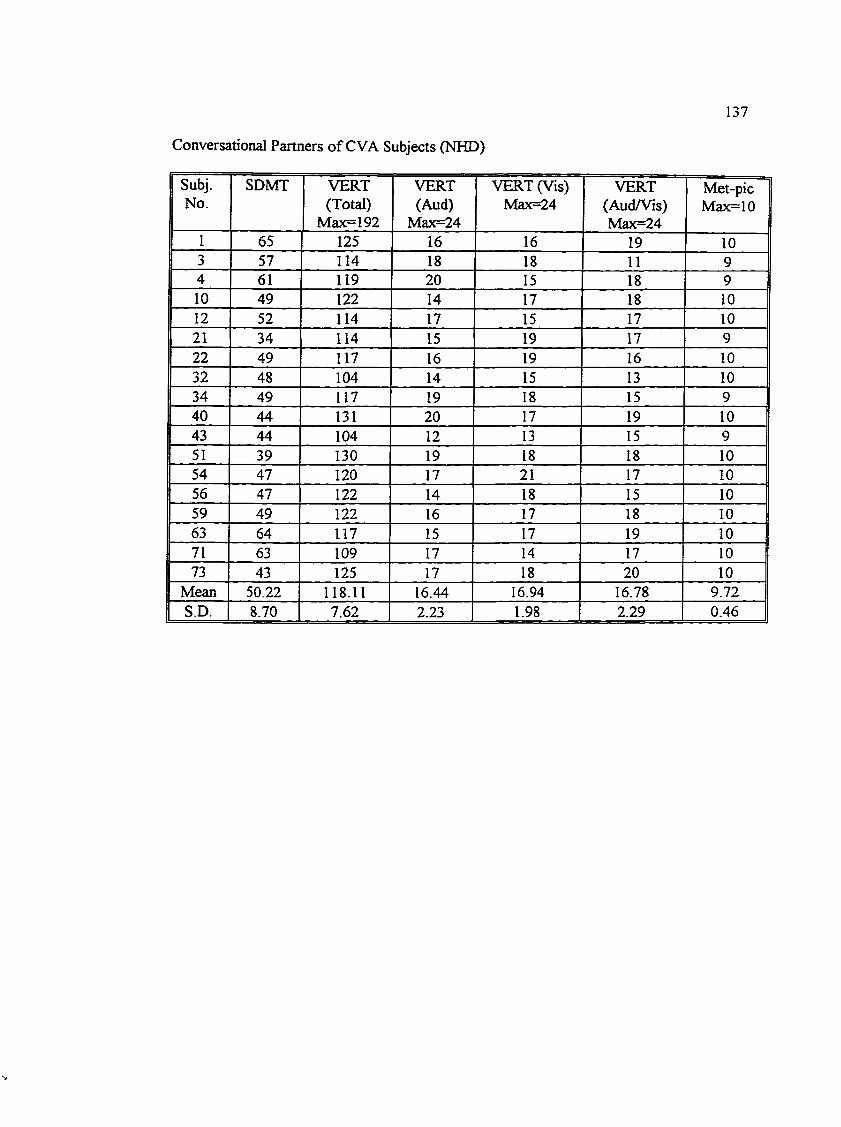
Conversational Partners o f CVA Subjects (NHD)
137
Subj.No.
SDMT VERT(Total)
Max=192
VERT(Aud)
Max=24
VERT (Vis) Max=24
VERT(Aud/Vis)Max=24
Met-picMax=10
1 65 125 16 16 19 103 57 114 18 18 11 94 61 119 20 15 18 910 49 122 14 17 18 1012 52 114 17 15 17 1021 34 114 15 19 17 922 49 117 16 19 16 1032 48 104 14 15 13 1034 49 117 19 18 15 940 44 131 20 17 19 1043 44 104 12 13 15 951 39 130 19 18 18 1054 47 120 17 21 17 1056 47 122 14 18 15 1059 49 122 16 17 18 1063 64 117 15 17 19 1071 63 109 17 14 17 1073 43 125 17 18 20 10
Mean 50.22 118.11 16.44 16.94 16.78 9.72S.D. 8.70 7.62 2.23 1.98 2.29 0.46
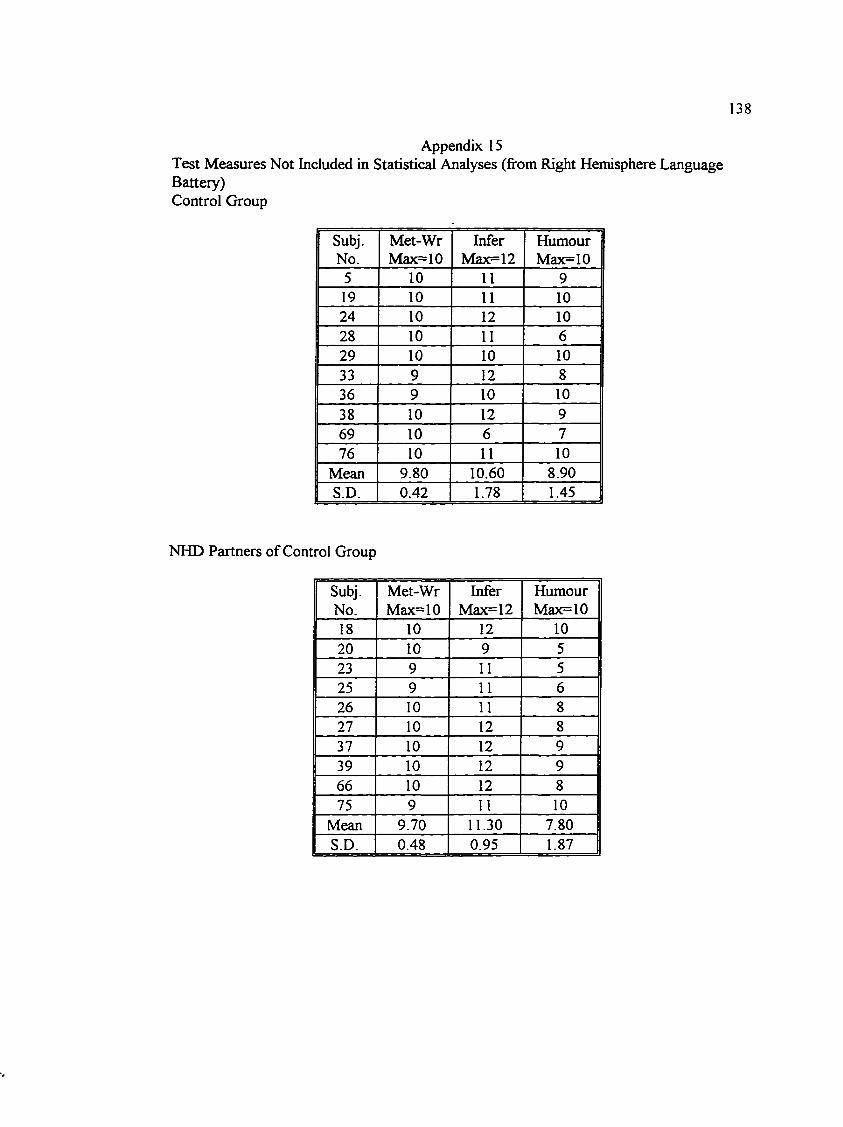
138
Appendix 15Test Measures Not Included in Statistical Analyses (from Right Hemisphere Language Battery)Control Group
Subj.No.
Met-WrMax=10
InferMax=12
HumourMax=10
5 10 11 919 10 11 1024 10 12 1028 10 11 629 10 10 1033 9 12 836 9 10 1038 10 12 969 10 6 776 10 11 10
Mean 9.80 10.60 8.90S.D. 0.42 1.78 1.45
NHD Partners of Control Group
Subj. Met-Wr Infer HumourNo. Max=10 Max=12 Max=1018 10 12 1020 10 9 523 9 11 525 9 11 626 10 11 827 10 12 837 10 12 939 10 12 966 10 12 875 9 11 10
Mean 9.70 11.30 7.80S.D. 0.48 0.95 1.87
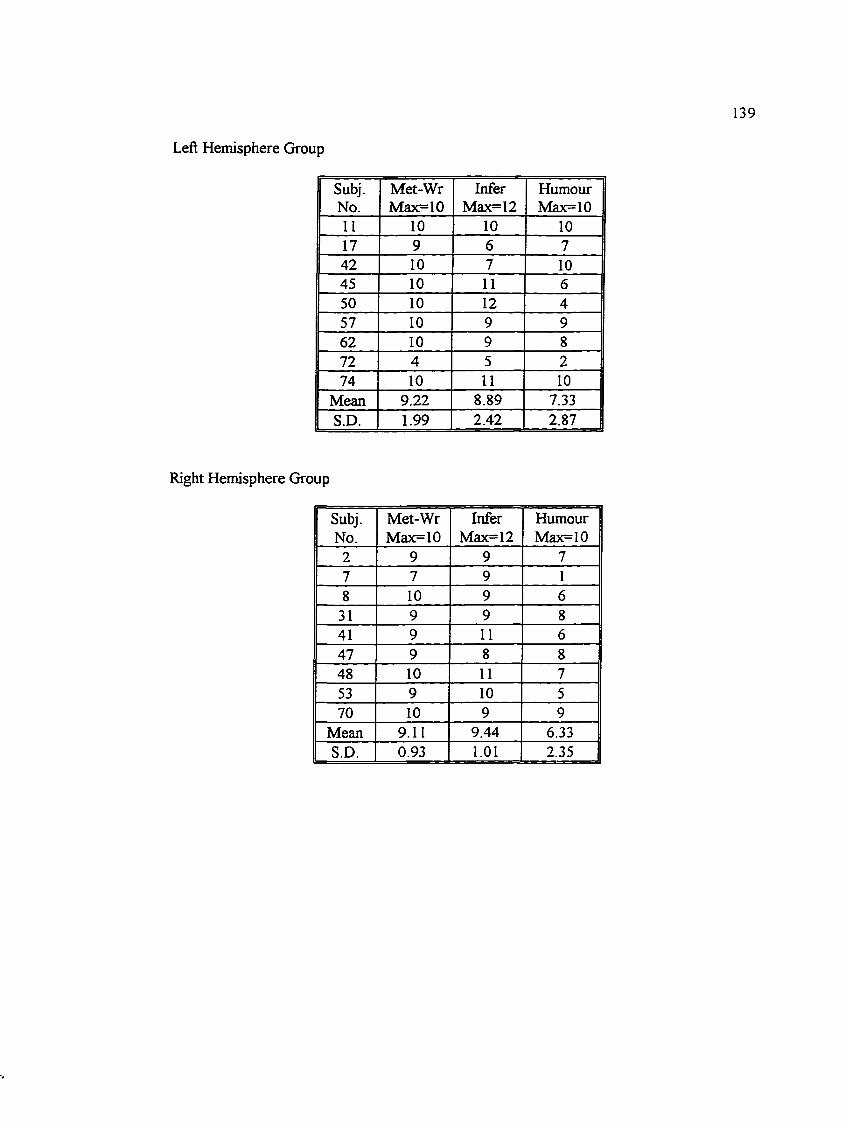
Left Hemisphere Group
139
Subj. Met-Wr Infer HumourNo. Max=10 Max=12 Max=1011 10 10 1017 9 6 742 10 7 1045 10 11 650 10 12 457 10 9 962 10 9 872 4 5 274 10 11 10
Mean 9.22 8.89 7.33S.D. 1.99 2.42 2.87
Right Hemisphere Group
Subj.No.
Met-WrMax=10
InferMax=12
HumourMax=10
2 9 9 77 7 9 18 10 9 6
31 9 9 841 9 11 647 9 8 848 10 11 753 9 10 570 10 9 9
Mean 9.11 9.44 6.33S.D. 0.93 1.01 2.35
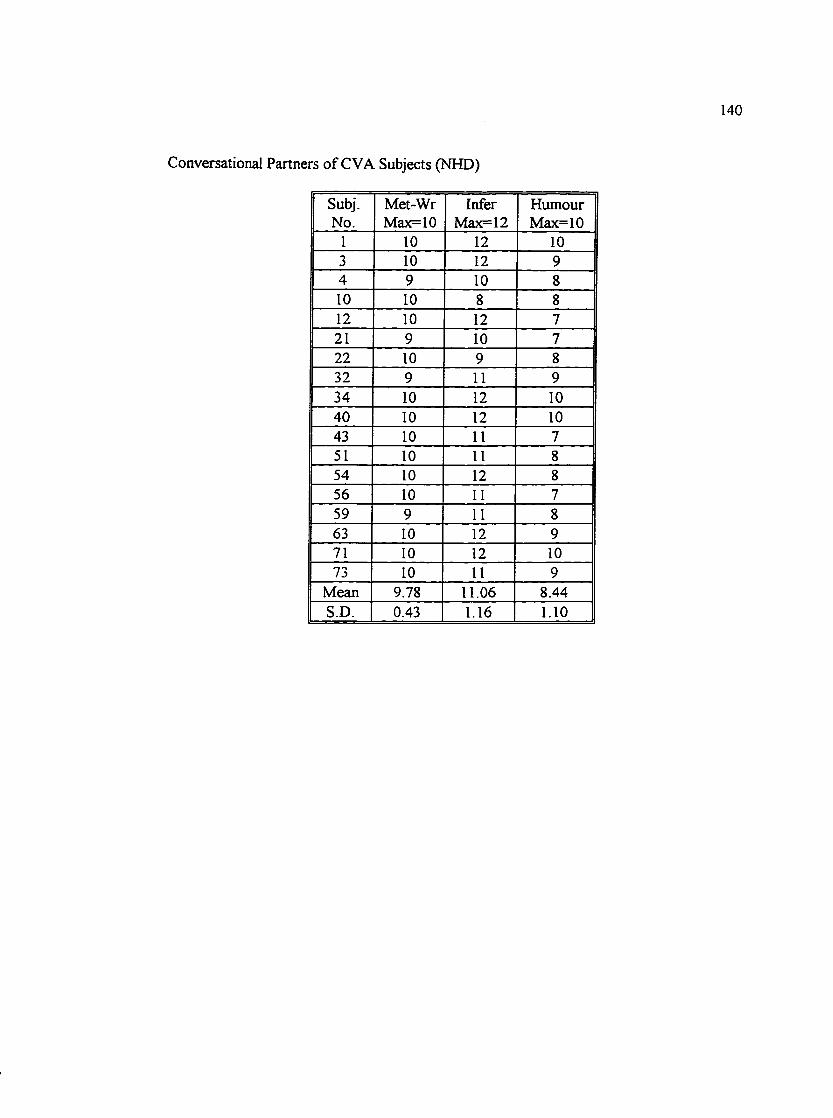
Conversational Partners of CVA Subjects (NHD)
140
Subj. Met-Wr Infer HumourNo. Max=10 Max=12 Max=10
1 10 12 103 10 12 94 9 10 810 10 8 812 10 12 721 9 10 722 10 9 832 9 11 934 10 12 1040 10 12 1043 10 11 751 10 11 854 10 12 856 10 11 759 9 11 863 10 12 971 10 12 1073 10 11 9
Mean 9.78 11.06 8.44S.D. 0.43 1.16 1.10

141
Appendix 16
Correlation Matrix of Demographic and Test Scores for NHD, LHD, and RHD Subjects(n = 28)
CORRELATION MATRIX CORRELATION (PROBABILITY LEVEL)
AGE EDUC RCPM ACTS SDMT VERTTOT
VERTAUD
VERTVIS
VERTA/V
METPIC
IRN\-
AGE 1.000 0.0081(0.967)
-0.250(0.200)
-0.174(0.375)
-0.472(0.011)
-0.366(0.055)
-0.431(0.022)
-0.169(0.390)
0.0940(0.634)
-0.321(0.095)
-0.392(0.039)
EDUC 0.0081(0.967)
1.000 0.5018(0.007)
0.4693(0.012)
0.5343(0.003)
0.4767(0.010)
0.4368(0.020)
0.4084(0.031)
-0.415(0.028)
0.5517(0.002)
0.2332(0.232)
RCPM -0.250(0.200)
0.5018(0.007)
I.OOO 0.7673(0.000)
0.6466(0.000)
0.5899(0.001)
0.4388(0.020)
0.4834(0.009)
-0.206(0.294)
0.3665(0.055)
0.2406(0.218)
Acrrs -0.174(0.375)
0.4693(0.012)
0.7673(0.000)
1.000 0.5406(0.003)
0.6103(0.001)
0.5082(0.006)
0.5977(0.001)
-0.228(0.244)
0.4707(0.011)
0.2734(0.159)
SDMT -0.472 (0.011)
0.5343(0.003)
0.6466(0.000)
0.5406(0.003)
1.000 0.6659(0.000)
0.6200(0.000)
0.5003(0.007)
-0.179(0.363)
0.5395(0.003)
0.3412(0.076)
VERTTOT
-0.366(0.055)
0.4767(0.010)
0.5899(0.001)
0.6103(0.001)
0.6659(0.000)
1.000 0.7808(0.000)
0.7322(0.000)
-0.264(0.175)
0.4866(0.009)
0.3531(0.065)
VERTAUD
-0.431(0.022)
0.4368(0.020)
0.4388(0.020)
0.5082(0.006)
0.6200(0.000)
0.7808(0.000)
1.000 0.4986(0.007)
-0.291(0.132)
0.5736(0.001)
0.4719(0.011)
VERTVIS
-0.169(0.390)
0.4084(0.031)
0.4834(0.009)
0.5977(0.001)
0.5003(0.007)
0.7322(0.000)
0.4986(0.007)
1.000 -0.265(0.173)
0.5211 (0.004)
0.2865(0.139)
VERTA/V
0.0940(0.634)
-0.415(0.028)
-0.206(0.294)
-0.228(0.244)
-0.179(0.363)
-0.264(0.175)
-0.291(0.132)
-0.265(0.173)
1.000 -0.324(0.093)
-0.254(0.191)
METPIC
-0.321(0.095)
0.5517(0.002)
0.3665(0.055)
0.4707 (0.011)
0.5395(0.003)
0.4866(0.009)
0.5736(0.001)
0.5211(0.004)
-0.324(0.093)
1.000 0.3580(0.061)
IRNY -0.391(0.039)
0.2332(0.232)
0.2406(0.218)
0.2734(0.159)
0.3412(0.076)
0.3531(0.065)
0.4719(0.011)
0.2865(0.139)
-0.254(0.191)
0.3580(0.061)
1.000
Educ = Education level; RCPM = Raven’s Coloured Progressive Matrices; ACTS = Auditory Comprehension Test for Sentences; SDMT = Symbol Digit Modalities Test; VERT TOT = Victoria Emotion Recognition Test (Total Score); VERT AUD = Vert (Auditory Emotion subtest); VERT VIS = VERT (Visual Emotion Subtest); VERT AfV = VERT (Auditory/Visual Emotion subtest); MetPic = Metaphor Picture subtest from Right Hemisphere Language Battery; IRNY= Rate of Irony
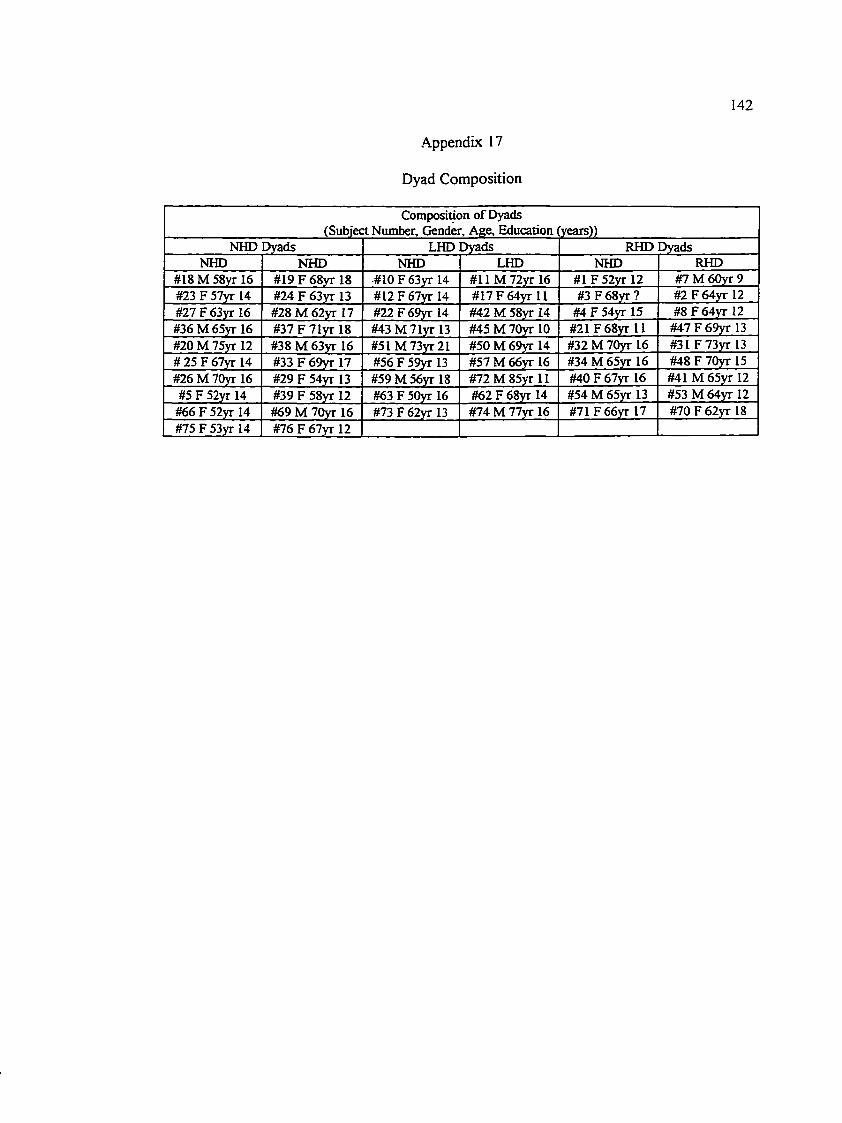
142
Appendix 17
Dyad Composition
Composition o f Dyads (Subject Number, Gender, Age, Education (years))
NHD Dyads LHD Dyads RHD DyadsNHD NHD NHD LHD NHD RHD
#18 M 58yr 16 #19 F 68yr 18 #10 F 63yr 14 #11 M72yr 16 #1 F 52yr 12 #7 M 60yr 9#23 F 57yr 14 #24 F 63yr 13 #12 F 67yr 14 #17F64yr 11 #3 F68yr? #2 F 64yr 12#27F63yr 16 #28 M 62yr 17 #22F69yr 14 #42 M 58yr 14 #4 F 54yr 15 #8F64yr 12#36M 65yr 16 #37F71yr 18 #43M 71yr 13 #45 M 70yr 10 #21 F68yr 11 #47F69yr 13#20 M 75yr 12 #38 M 63vr 16 #51M 73yr21 #50 M 69yr 14 #32 M 70yr 16 #31 F73yr 13# 25 F 67yr 14 #33 F 69yr 17 #56 F 59yr 13 #57 M 66yr 16 #34 M 65yr 16 #48 F 70yr 15#26 M 70yr 16 #29 F 54yr 13 #59 M 56yr 18 #72M 85yr 11 #40 F 67yr 16 #41 M 65yr 12#5 F 52yr 14 #39 F 58yr 12 #63 F 50yr 16 #62 F 68yr 14 #54 M 65yr 13 #53 M 64yr 12
#66 F 52yr 14 #69 M 70yr 16 #73F62yr 13 #74 M 77yr 16 #71F66yr 17 #70F62yr 18#75 F 53yr 14 #76 F 67yr 12
Recommended