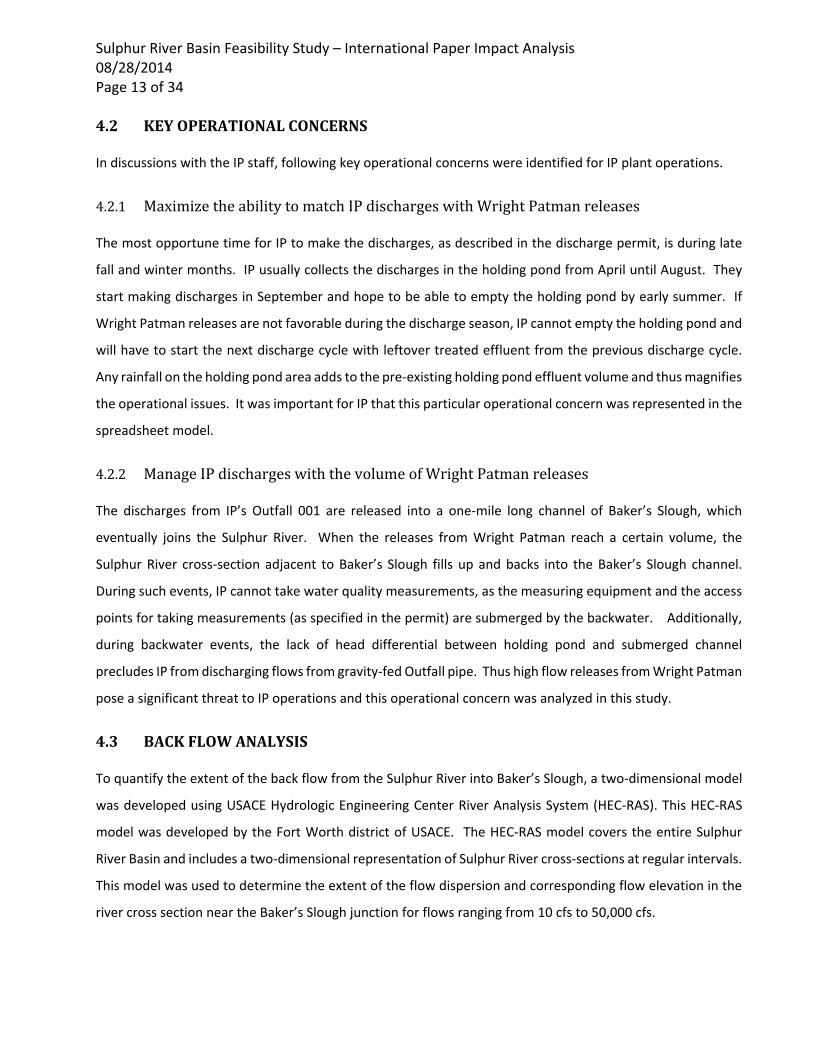
5930 Summerhill Rd Texarkana, Texas 75503 903‐838‐8533 fax 903‐832‐4700
TECHNICALMEMORANDUM
DRAFT
THIS DOCUMENT IS RELEASED FOR THE PURPOSE OF INTERIM REVIEW UNDER THE AUTHORITY OF ENGINEER, P.E., TEXAS NO. 12345 ON DATE. IT IS NOT TO BE USED FOR CONSTRUCTION, BIDDING OR PERMIT PURPOSES. FREESE AND NICHOLS, INC. TEXAS REGISTERED ENGINEERING FIRM F‐ 2144
TO: Becky Griffith, Jon Jarvis
FROM Spandana Tummuri
SUBJECT: Technical Memorandum on IP Analysis
PROJECT: Sulphur River Basin Feasibility Study
DATE: 08/28/2014
CC: Tom Gooch, Jon Albright, Robert Murray
Sulphur River Basin Feasibility Study – International Paper Impact Analysis 08/28/2014 Page 2 of 34
TABLEOFCONTENTS
1.0 INTRODUCTION............................................................................................................................................4
2.0 INTERNATIONALPAPEROPERATIONS.............................................................................................4
2.1 IPPlantOperations..................................................................................................................................4 2.2 IPDischargePermit.................................................................................................................................5
3.0 WRIGHTPATMANOPERATIONS..........................................................................................................7
3.1 OperatingRuleCurves...........................................................................................................................8 3.2 ReallocationScenarios...........................................................................................................................9
4.0 MODELINGAPPROACH..........................................................................................................................10
4.1 ImpactAnalysis......................................................................................................................................12 4.2 KeyOperationalConcerns.................................................................................................................13 4.3 BackFlowAnalysis...............................................................................................................................13
5.0 RESULTSANDCONCLUSIONS.............................................................................................................15
5.1 AverageConditions..............................................................................................................................15 5.2 Seasonality...............................................................................................................................................18 5.3 SimulatedHoldingPondOperations............................................................................................27 5.4 HoldingPondRemainingVolume..................................................................................................31 5.5 Conclusions..............................................................................................................................................32
6.0 RECOMMENDATIONS..............................................................................................................................34
APPENDICES
AppendixA–InternationalPaperDischargePermitAppendixB–Figures
Sulphur River Basin Feasibility Study – International Paper Impact Analysis 08/28/2014 Page 3 of 34 LISTOFFIGURESFigure 1 Illustration of the Monthly Percent Match of IP Discharges to the Sulphur River Flows 6 Figure 2 Illustration of a Typical Dam and Various Pools 8 Figure 3 Interim and Ultimate Operating Rule Curves for Wright Patman Lake 9 Figure 4 Various Operating Rule Curves and Reallocation Scenarios for Wright Patman Lake 10 Figure 5 Summary of Demands on Wright Patman Lake for Various Operating Curve Scenarios 11 Figure 6 Flow Chart Depicting the Modeling Methodology 12 Figure 7 Sulphur River Elevations at IP Discharge Location for Various Wright Patman Releases 14 Figure 8 Plot showing Sulphur River Elevation for Various Wright Patman Releases 15 Figure 9 Flow Frequency Chart of Wright Patman Releases for Interim Curve Operations 16 Figure 10 Flow Frequency Chart of Wright Patman Releases for Ultimate Rule Curve Operations 17 Figure 11 Flow Frequency Chart of Wright Patman Releases for Various Reallocation Scenarios 18 Figure 12 Frequency of Period of Record Wright Patman Outflows in Fall Season 20 Figure 13 Frequency of Period of Record Wright Patman Outflows in Winter Season 21 Figure 14 Frequency of Period of Record Wright Patman Outflows in Spring Season 22 Figure 15 Frequency of Period of Record Wright Patman Outflows in Summer Season 23 Figure 16 Comparison of January Count for Various Operational Scenarios (1938‐1958) 25 Figure 17 Comparison of January Count for Various Operational Scenarios (1959‐1978) 25 Figure 18 Comparison of January Count for Various Operational Scenarios (1979‐2007) 26 Figure 19 Comparison of January Count for Various Operational Scenarios in Wet Hydrologic Years 26 Figure 20 Holding Pond Simulations for Interim Curve Operations 28 Figure 21 Holding Pond Simulations for Ultimate Rule Curve Operations 29 Figure 22 Holding Pond Simulations for Reallocation Scenario 1 – 232.5 Feet 30 Figure 23 Holding Pond Simulations for Reallocation Scenario 2 – 242.5 Feet 30 Figure 24 Holding Pond Simulations for Reallocation Scenario 3 – 252.5 Feet 31 Figure 25 Cumulative Trace of Remaining Volume of Effluent in the Holding Pond 32
LISTOFTABLES
Table 1 Summary IP Permit Requirements for Outfall Conditions A and B 7 Table 2 Table showing the Number of Times Favorable Flows had occurred in a given month (Count) 24
Sulphur River Basin Feasibility Study – International Paper Impact Analysis 08/28/2014 Page 4 of 34
1.0 INTRODUCTION
The purpose of this technical memorandum is to summarize the impacts of strategies to develop additional
water supply in the Sulphur River Basin by reallocating storage in Wright Patman Lake on the operations of
the International Paper Company’s Texarkana Mill (IP). IP is located near Texarkana, Texas in the lower portion
of the Sulphur River Basin near the Texas/Arkansas state line. The Texarkana Plant draws its water supply from
Wright Patman Lake and discharges its plant effluent into the Sulphur River immediately downstream of the
Wright Patman Dam. Because of this proximity and other dependencies, modifications to Wright Patman
operating parameters have the potential to impact plant operations. The purpose of this analysis is to develop
an understanding of the relationship between the releases from Wright Patman and IP operations and the
potential impact changes in Wright Patman releases could have on IP operations.
2.0 INTERNATIONALPAPEROPERATIONS
The International Paper Company is a leading firm in paper and packaging industry with manufacturing
operations spread across several continents. IP’s Texarkana Mill is located in Queen City, Texas near the
junction of Texas, Arkansas, and Louisiana. The Texarkana Mill primarily produces bleach board for packaging,
drinking cups, and folding cartons. The Mill has been in operation since the late 70s and has been a significant
water user in the Sulphur Basin.
2.1 IPPLANTOPERATIONS
The Texarkana Mill operations are dependent on Wright Patman Lake both as a water source for plant
operations and to augment river flows to enhance effluent discharge activities. Texarkana Water Utilities
(TWU) holds a right to divert water from Wright Patman Lake for municipal (up to 45,000 ac‐ft.) and industrial
(up to 135,000 ac‐ft) uses on an annual basis. IP and TWU entered into a contract which allows IP to use
approximately 67,600 ac‐ft (60.3 MGD) of TWU’s water annually. IP diverts raw water from an intake structure
on the south side Wright Patman Lake and delivers it to a treatment plant operated by IP under contract with
TWU. Currently, IP treats and delivers about 2‐3 MGD of water for municipal use by Domino, Queen City, and
Atlanta.
IP uses treated water for all the plant operations and generates about 28‐30 MGD of effluent from the plant
operations. The plant operations maximize the use of available water and recycle most of it through the
manufacturing process. The effluent from various process cycles is collected in the aerated stabilization
Sulphur River Basin Feasibility Study – International Paper Impact Analysis 08/28/2014 Page 5 of 34 basins. There are two aerated stabilization basins each covering an area of approximately 72 acres. After
retaining the effluent in the each one of the aerated stabilization basin for two to three days, IP diverts the
treated effluent to the holding pond where the effluent is held until it is released in the Sulphur River. The
holding pond capacity is about 26,300 ac‐ft. The pond is about 20‐ft deep and it covers approximately 1,315
acres of the property.
2.2 IPDISCHARGEPERMIT
The Texas Commission on Environmental Quality (TCEQ) has issued a water quality permit to IP, which governs
discharges of effluent from the holding pond into the Sulphur River. Discharges are made to a remnant channel
of Baker’s slough, which joins the Sulphur River below Wright Patman in segment no. 0301 of the Sulphur
River Basin. IP makes discharges from a rectangular structure called Outfall 001, which contains the two
pipelines used for making discharges. The capacity of each one of the pipes is approximately 323.15 MGD,
thus restricting the daily maximum discharges from the Outfall 001 to 646.3 MGD. IP’s discharge permit
includes both water quantity and water quality requirements. The discharge permit is included in Appendix
A of this memorandum.
Of the water quantity parameters, the most important one is the criterion restricting IP’s ability to release
flows. IP cannot make discharges from their holding pond if the flow in Sulphur River, as measured at the
Wright Patman dam, is below 50 cfs. In addition to that, IP has a restriction on the daily average percentage
that plant effluent may comprise of the total river flow. This percentage varies from month to month and is
defined by means of the Outfall discharge conditions specified in the permit. IP has two different outfall
discharge conditions permitted in the discharge permit: Outfall Condition A and Outfall Condition B. Each
outfall condition consists of a variable monthly trend of percentage match of IP discharges to the Wright
Patman releases. The monthly patterns for Outfall Conditions A and B are illustrated in Figure 1 below.
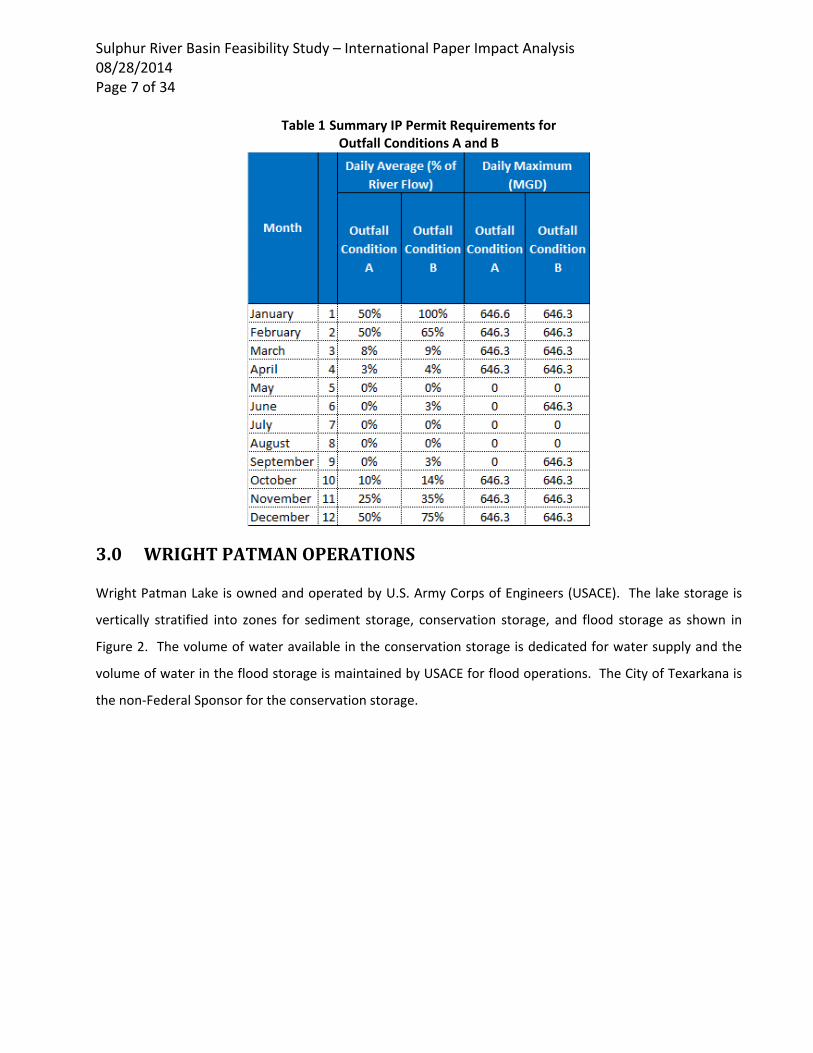
Outfall Condition A is the more restrictive of the two discharge conditions. IP has been operating under Outfall
Condition B requirements in the recent years. The daily maximum and daily average flow of effluent shall not
exceed the value listed in the Table 1 shown below for each month for each outfall discharge condition. The
USGS gage used for permit compliance is located just downstream of Wright Patman dam. It can be assumed
that there are no additional drainage areas contributing to the Sulphur River between Wright Patman dam
and IP’s discharge location.
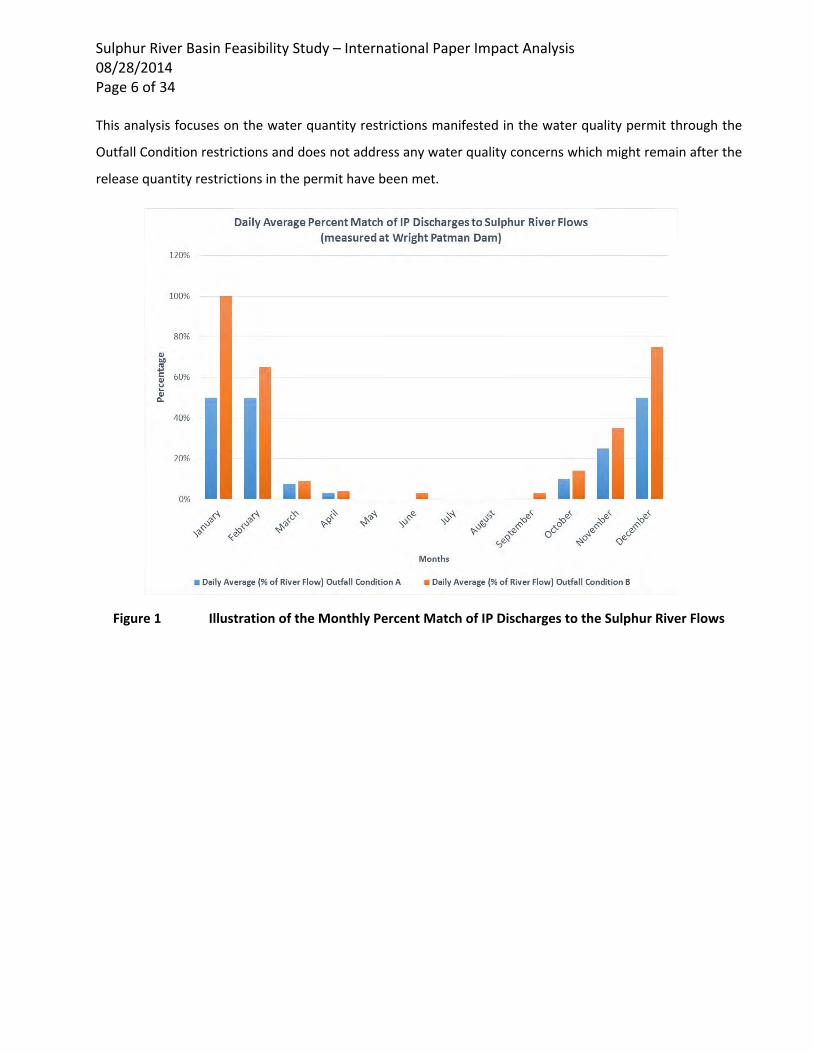
Sulphur River Basin Feasibility Study – International Paper Impact Analysis 08/28/2014 Page 6 of 34 This analysis focuses on the water quantity restrictions manifested in the water quality permit through the
Outfall Condition restrictions and does not address any water quality concerns which might remain after the
release quantity restrictions in the permit have been met.
Figure 1 Illustration of the Monthly Percent Match of IP Discharges to the Sulphur River Flows
Sulphur River Basin Feasibility Study – International Paper Impact Analysis 08/28/2014 Page 7 of 34
Table 1 Summary IP Permit Requirements for Outfall Conditions A and B
3.0 WRIGHTPATMANOPERATIONS
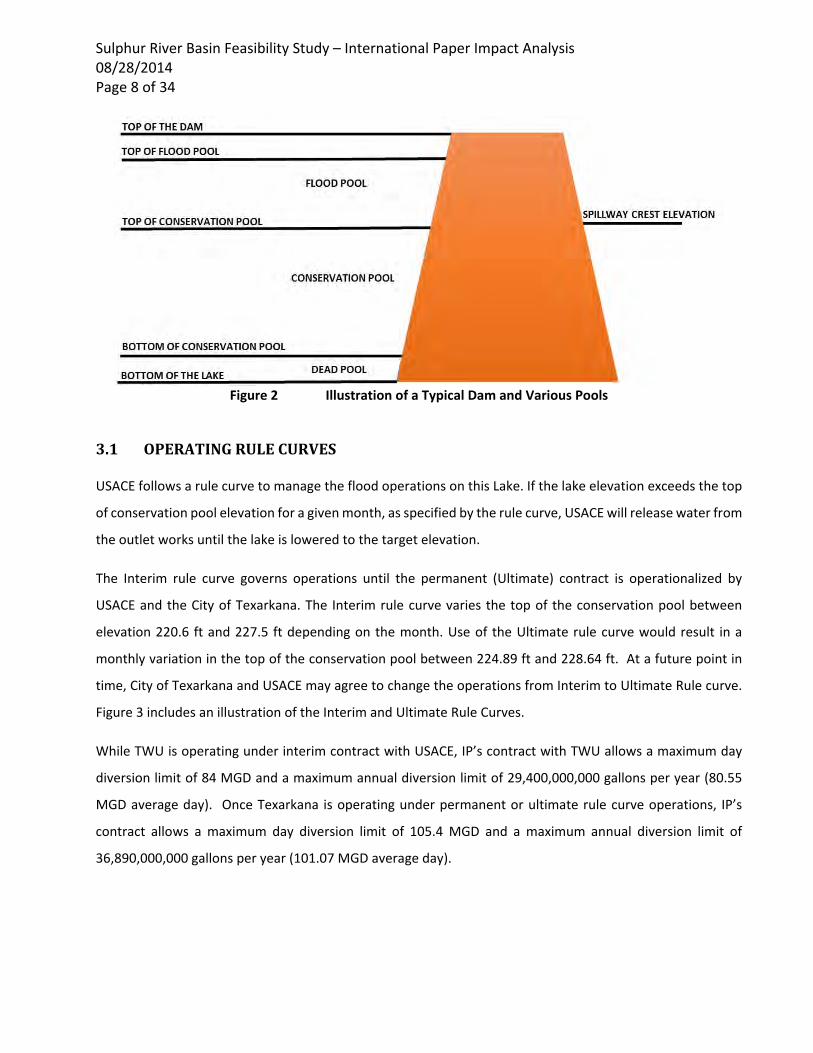
Wright Patman Lake is owned and operated by U.S. Army Corps of Engineers (USACE). The lake storage is
vertically stratified into zones for sediment storage, conservation storage, and flood storage as shown in
Figure 2. The volume of water available in the conservation storage is dedicated for water supply and the
volume of water in the flood storage is maintained by USACE for flood operations. The City of Texarkana is
the non‐Federal Sponsor for the conservation storage.
Sulphur River Basin Feasibility Study – International Paper Impact Analysis 08/28/2014 Page 8 of 34
Figure 2 Illustration of a Typical Dam and Various Pools
3.1 OPERATINGRULECURVES
USACE follows a rule curve to manage the flood operations on this Lake. If the lake elevation exceeds the top
of conservation pool elevation for a given month, as specified by the rule curve, USACE will release water from
the outlet works until the lake is lowered to the target elevation.
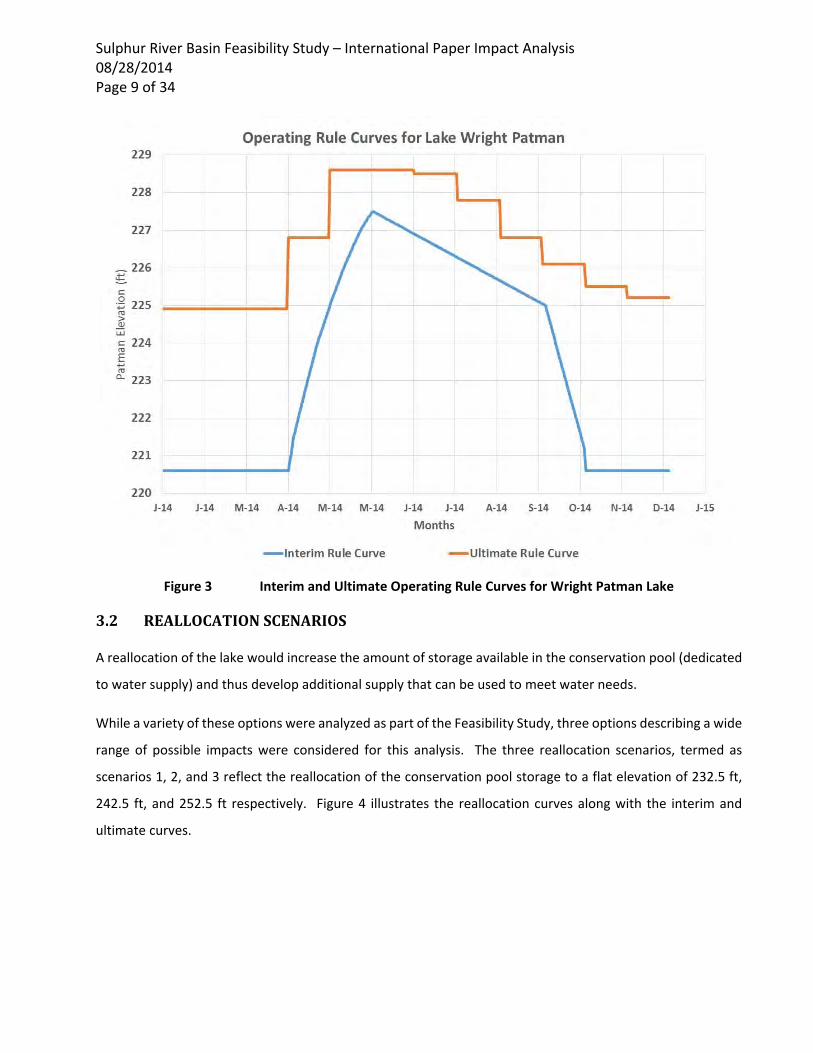
The Interim rule curve governs operations until the permanent (Ultimate) contract is operationalized by
USACE and the City of Texarkana. The Interim rule curve varies the top of the conservation pool between
elevation 220.6 ft and 227.5 ft depending on the month. Use of the Ultimate rule curve would result in a
monthly variation in the top of the conservation pool between 224.89 ft and 228.64 ft. At a future point in
time, City of Texarkana and USACE may agree to change the operations from Interim to Ultimate Rule curve.
Figure 3 includes an illustration of the Interim and Ultimate Rule Curves.
While TWU is operating under interim contract with USACE, IP’s contract with TWU allows a maximum day
diversion limit of 84 MGD and a maximum annual diversion limit of 29,400,000,000 gallons per year (80.55
MGD average day). Once Texarkana is operating under permanent or ultimate rule curve operations, IP’s
contract allows a maximum day diversion limit of 105.4 MGD and a maximum annual diversion limit of
36,890,000,000 gallons per year (101.07 MGD average day).
Sulphur River Basin Feasibility Study – International Paper Impact Analysis 08/28/2014 Page 9 of 34
Figure 3 Interim and Ultimate Operating Rule Curves for Wright Patman Lake
3.2 REALLOCATIONSCENARIOS
A reallocation of the lake would increase the amount of storage available in the conservation pool (dedicated
to water supply) and thus develop additional supply that can be used to meet water needs.
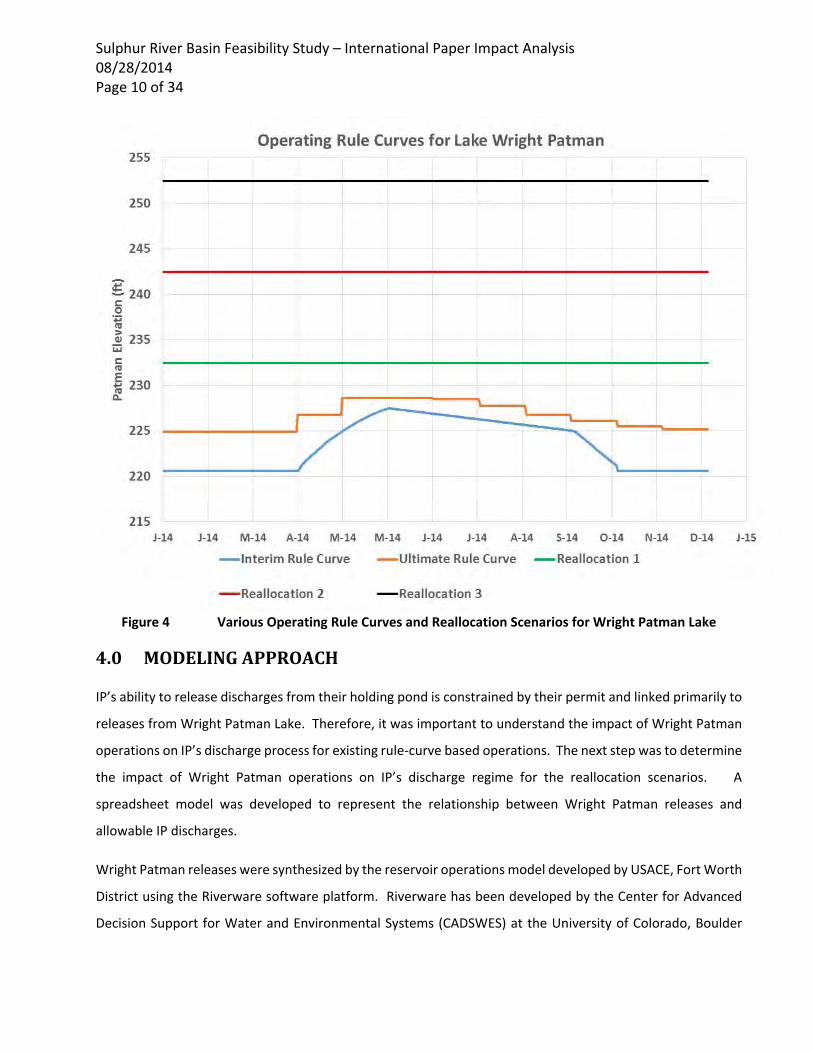
While a variety of these options were analyzed as part of the Feasibility Study, three options describing a wide
range of possible impacts were considered for this analysis. The three reallocation scenarios, termed as
scenarios 1, 2, and 3 reflect the reallocation of the conservation pool storage to a flat elevation of 232.5 ft,
242.5 ft, and 252.5 ft respectively. Figure 4 illustrates the reallocation curves along with the interim and
ultimate curves.
Sulphur River Basin Feasibility Study – International Paper Impact Analysis 08/28/2014 Page 10 of 34
Figure 4 Various Operating Rule Curves and Reallocation Scenarios for Wright Patman Lake
4.0 MODELINGAPPROACH
IP’s ability to release discharges from their holding pond is constrained by their permit and linked primarily to
releases from Wright Patman Lake. Therefore, it was important to understand the impact of Wright Patman
operations on IP’s discharge process for existing rule‐curve based operations. The next step was to determine
the impact of Wright Patman operations on IP’s discharge regime for the reallocation scenarios. A
spreadsheet model was developed to represent the relationship between Wright Patman releases and
allowable IP discharges.
Wright Patman releases were synthesized by the reservoir operations model developed by USACE, Fort Worth
District using the Riverware software platform. Riverware has been developed by the Center for Advanced
Decision Support for Water and Environmental Systems (CADSWES) at the University of Colorado, Boulder
Sulphur River Basin Feasibility Study – International Paper Impact Analysis 08/28/2014 Page 11 of 34 and is the standard model for reservoir operations within the Fort Worth District. The Sulphur Basin model is
based on a larger model of the Red River Basin developed by USACE to simulate flood operations. The
Riverware model is a daily time‐step model and it includes historical reservoir operations for a period of record
of 1938‐2007.
A common approach for conducting studies of this type is to use the entire hydrologic period of record data
as a proxy for the full range of possible hydrologic conditions under evaluation. In this case, the daily releases
from the Wright Patman Lake for the entire period of record were considered to represent all the possible
hydrologic conditions (critical drought, dry, normal, and wet) impacting IP’s ability to make discharges.
Effluent discharges from Outfall 1 were provided by IP for the period 2007 to 2013. Release data for the
period 1938 to 2007 (to match the period of record in the Wright Patman Riverware model) were synthesized
by the spreadsheet model based on operating parameters supplied by IP staff, as well as rainfall and
evaporation data. Separate models were created for Wright Patman Lake operations representing the interim,
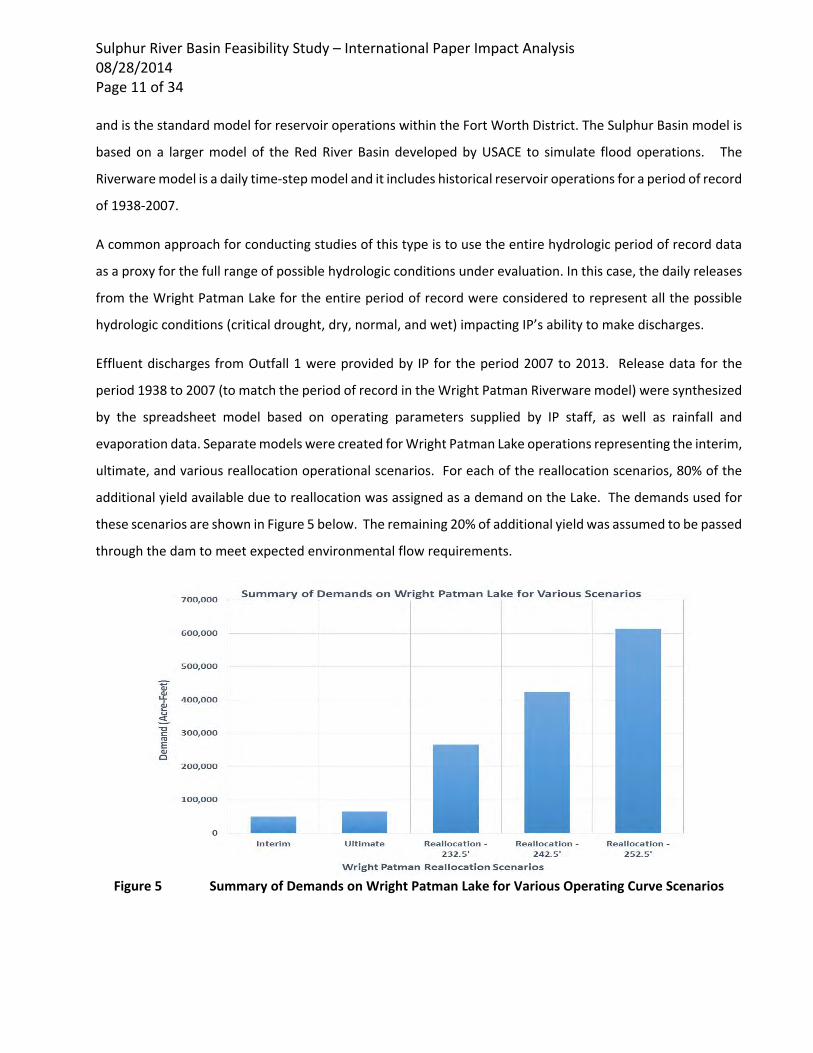
ultimate, and various reallocation operational scenarios. For each of the reallocation scenarios, 80% of the
additional yield available due to reallocation was assigned as a demand on the Lake. The demands used for
these scenarios are shown in Figure 5 below. The remaining 20% of additional yield was assumed to be passed
through the dam to meet expected environmental flow requirements.
Figure 5 Summary of Demands on Wright Patman Lake for Various Operating Curve Scenarios
Sulphur River Basin Feasibility Study – International Paper Impact Analysis 08/28/2014 Page 12 of 34 4.1 IMPACTANALYSIS
The impact analysis was conducted using historical Wright Patman releases from 1938‐2007 for the Interim,
Ultimate, and three reallocation scenarios (232.5 ft, 242.5 ft, and 252.5 ft respectively). The analysis was
based on the following assumptions:
The operations of holding pond are based on Outfall Condition B.
Lake Ralph Hall is considered to be in place. (Lake Ralph Hall is a proposed reservoir upstream of
Wright Patman Lake that is included in the Riverware model as if it were already constructed.
Preliminary analyses performed as part of this effort indicate that Lake Ralph Hall has no discernable
effect on Wright Patman releases. Accordingly, the Riverware model was not modified to remove it.)
Releases from Wright Patman Lake were limited to a maximum of 10,000 cfs per the criteria
established by the Corps in the Wright Patman operating manual.
No inflows into the Sulphur River section between the Wright Patman dam and the IP discharge
location were included.
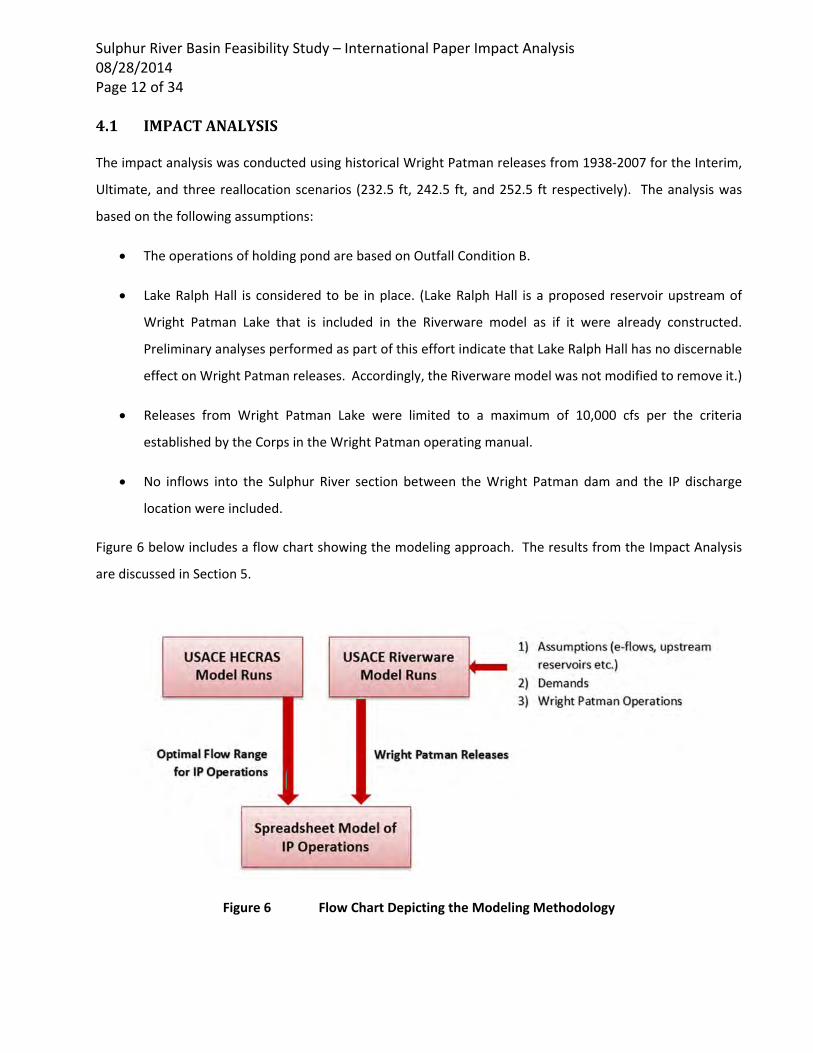
Figure 6 below includes a flow chart showing the modeling approach. The results from the Impact Analysis
are discussed in Section 5.
Figure 6 Flow Chart Depicting the Modeling Methodology
Sulphur River Basin Feasibility Study – International Paper Impact Analysis 08/28/2014 Page 13 of 34 4.2 KEYOPERATIONALCONCERNS
In discussions with the IP staff, following key operational concerns were identified for IP plant operations.
4.2.1 MaximizetheabilitytomatchIPdischargeswithWrightPatmanreleases
The most opportune time for IP to make the discharges, as described in the discharge permit, is during late
fall and winter months. IP usually collects the discharges in the holding pond from April until August. They
start making discharges in September and hope to be able to empty the holding pond by early summer. If
Wright Patman releases are not favorable during the discharge season, IP cannot empty the holding pond and
will have to start the next discharge cycle with leftover treated effluent from the previous discharge cycle.
Any rainfall on the holding pond area adds to the pre‐existing holding pond effluent volume and thus magnifies
the operational issues. It was important for IP that this particular operational concern was represented in the
spreadsheet model.
4.2.2 ManageIPdischargeswiththevolumeofWrightPatmanreleases
The discharges from IP’s Outfall 001 are released into a one‐mile long channel of Baker’s Slough, which
eventually joins the Sulphur River. When the releases from Wright Patman reach a certain volume, the
Sulphur River cross‐section adjacent to Baker’s Slough fills up and backs into the Baker’s Slough channel.
During such events, IP cannot take water quality measurements, as the measuring equipment and the access
points for taking measurements (as specified in the permit) are submerged by the backwater. Additionally,
during backwater events, the lack of head differential between holding pond and submerged channel
precludes IP from discharging flows from gravity‐fed Outfall pipe. Thus high flow releases from Wright Patman
pose a significant threat to IP operations and this operational concern was analyzed in this study.
4.3 BACKFLOWANALYSIS
To quantify the extent of the back flow from the Sulphur River into Baker’s Slough, a two‐dimensional model
was developed using USACE Hydrologic Engineering Center River Analysis System (HEC‐RAS). This HEC‐RAS
model was developed by the Fort Worth district of USACE. The HEC‐RAS model covers the entire Sulphur
River Basin and includes a two‐dimensional representation of Sulphur River cross‐sections at regular intervals.
This model was used to determine the extent of the flow dispersion and corresponding flow elevation in the
river cross section near the Baker’s Slough junction for flows ranging from 10 cfs to 50,000 cfs.
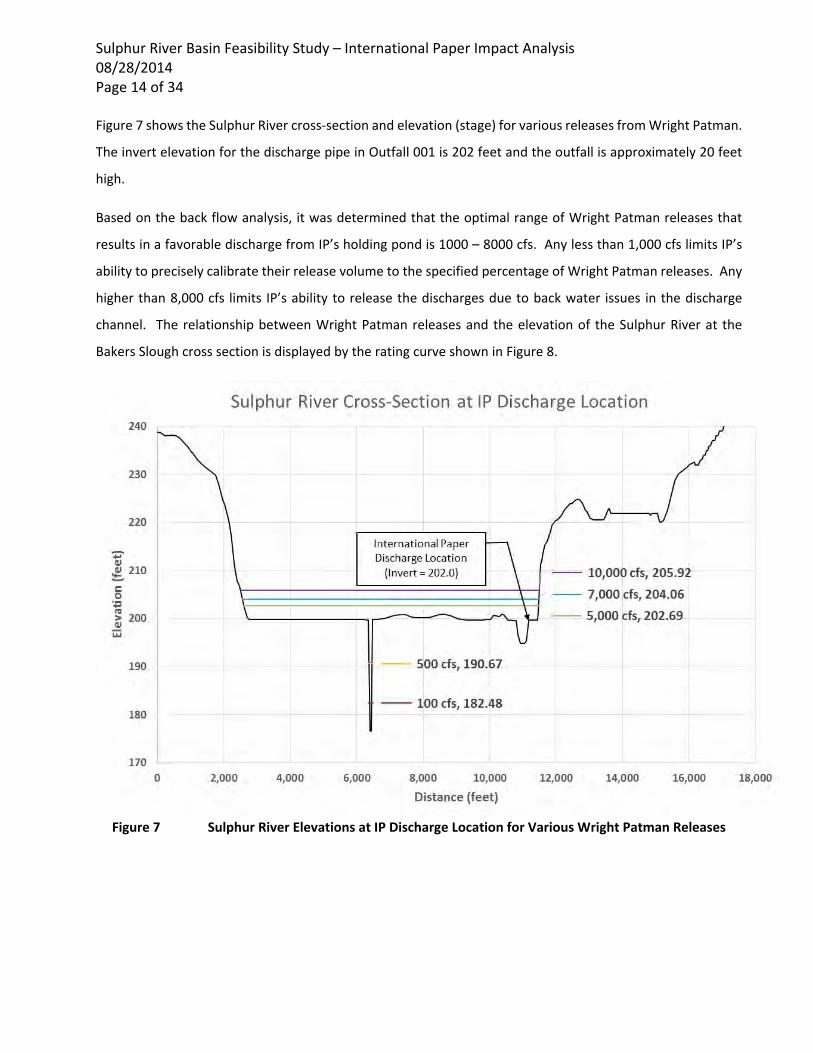
Sulphur River Basin Feasibility Study – International Paper Impact Analysis 08/28/2014 Page 14 of 34 Figure 7 shows the Sulphur River cross‐section and elevation (stage) for various releases from Wright Patman.
The invert elevation for the discharge pipe in Outfall 001 is 202 feet and the outfall is approximately 20 feet
high.
Based on the back flow analysis, it was determined that the optimal range of Wright Patman releases that
results in a favorable discharge from IP’s holding pond is 1000 – 8000 cfs. Any less than 1,000 cfs limits IP’s
ability to precisely calibrate their release volume to the specified percentage of Wright Patman releases. Any
higher than 8,000 cfs limits IP’s ability to release the discharges due to back water issues in the discharge
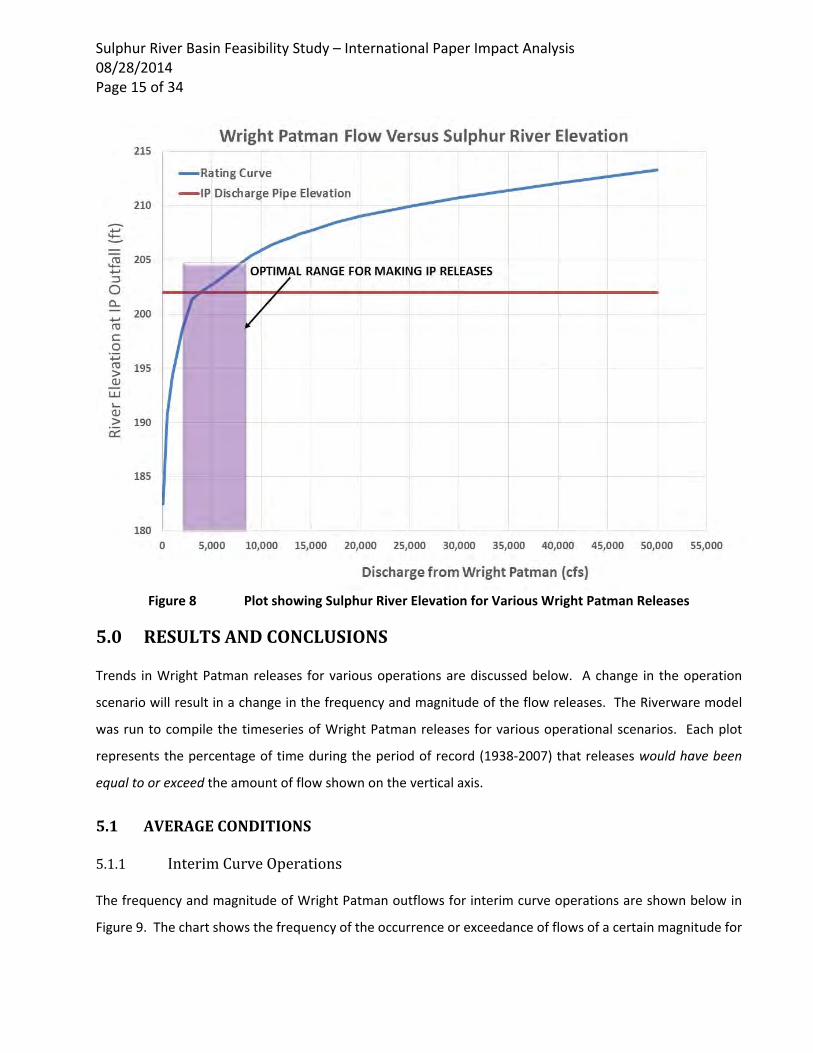
channel. The relationship between Wright Patman releases and the elevation of the Sulphur River at the
Bakers Slough cross section is displayed by the rating curve shown in Figure 8.
Figure 7 Sulphur River Elevations at IP Discharge Location for Various Wright Patman Releases
Sulphur River Basin Feasibility Study – International Paper Impact Analysis 08/28/2014 Page 15 of 34
Figure 8 Plot showing Sulphur River Elevation for Various Wright Patman Releases
5.0 RESULTSANDCONCLUSIONS
Trends in Wright Patman releases for various operations are discussed below. A change in the operation
scenario will result in a change in the frequency and magnitude of the flow releases. The Riverware model
was run to compile the timeseries of Wright Patman releases for various operational scenarios. Each plot
represents the percentage of time during the period of record (1938‐2007) that releases would have been
equal to or exceed the amount of flow shown on the vertical axis.
5.1 AVERAGECONDITIONS
5.1.1 InterimCurveOperations
The frequency and magnitude of Wright Patman outflows for interim curve operations are shown below in
Figure 9. The chart shows the frequency of the occurrence or exceedance of flows of a certain magnitude for
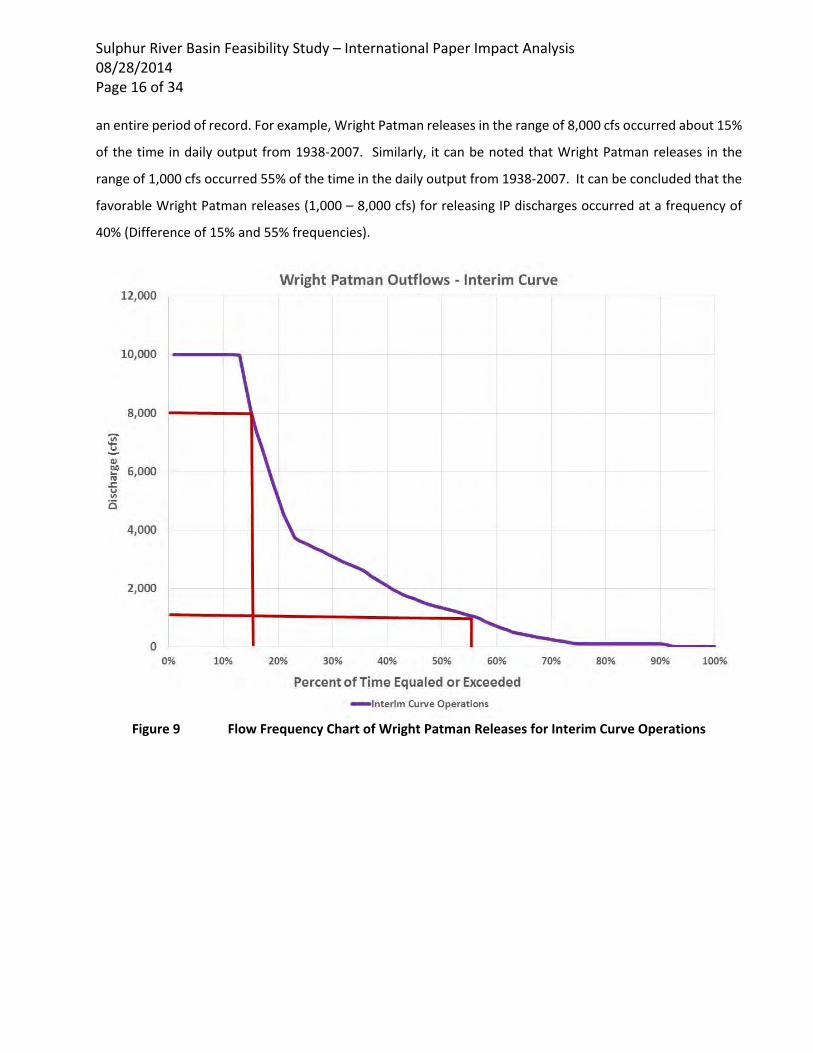
Sulphur River Basin Feasibility Study – International Paper Impact Analysis 08/28/2014 Page 16 of 34 an entire period of record. For example, Wright Patman releases in the range of 8,000 cfs occurred about 15%
of the time in daily output from 1938‐2007. Similarly, it can be noted that Wright Patman releases in the
range of 1,000 cfs occurred 55% of the time in the daily output from 1938‐2007. It can be concluded that the
favorable Wright Patman releases (1,000 – 8,000 cfs) for releasing IP discharges occurred at a frequency of
40% (Difference of 15% and 55% frequencies).
Figure 9 Flow Frequency Chart of Wright Patman Releases for Interim Curve Operations
Sulphur River Basin Feasibility Study – International Paper Impact Analysis 08/28/2014 Page 17 of 34
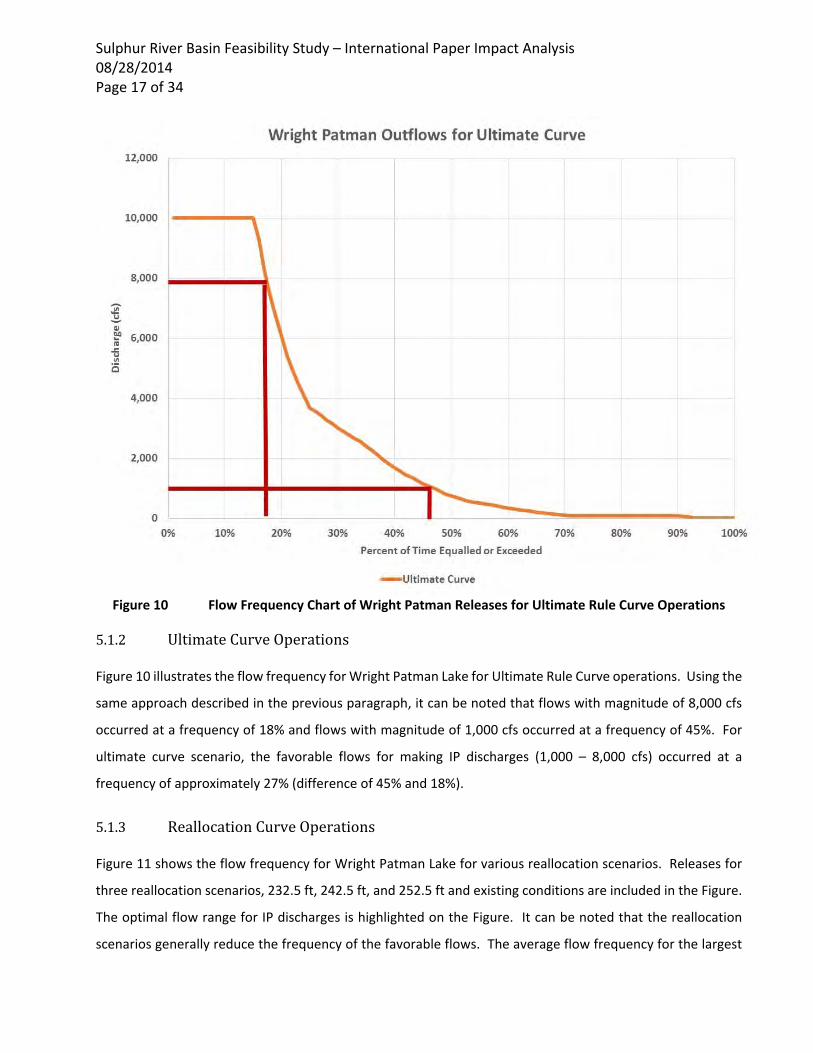
Figure 10 Flow Frequency Chart of Wright Patman Releases for Ultimate Rule Curve Operations
5.1.2 UltimateCurveOperations
Figure 10 illustrates the flow frequency for Wright Patman Lake for Ultimate Rule Curve operations. Using the
same approach described in the previous paragraph, it can be noted that flows with magnitude of 8,000 cfs
occurred at a frequency of 18% and flows with magnitude of 1,000 cfs occurred at a frequency of 45%. For
ultimate curve scenario, the favorable flows for making IP discharges (1,000 – 8,000 cfs) occurred at a
frequency of approximately 27% (difference of 45% and 18%).
5.1.3 ReallocationCurveOperations
Figure 11 shows the flow frequency for Wright Patman Lake for various reallocation scenarios. Releases for
three reallocation scenarios, 232.5 ft, 242.5 ft, and 252.5 ft and existing conditions are included in the Figure.
The optimal flow range for IP discharges is highlighted on the Figure. It can be noted that the reallocation
scenarios generally reduce the frequency of the favorable flows. The average flow frequency for the largest
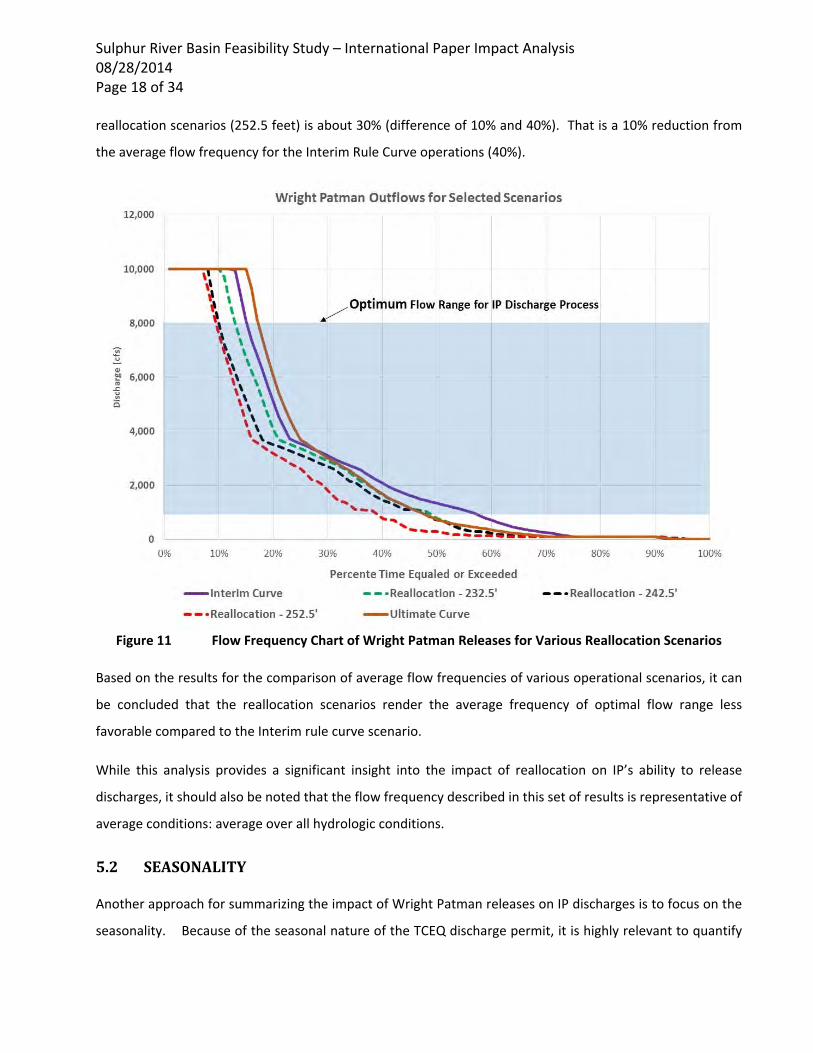
Sulphur River Basin Feasibility Study – International Paper Impact Analysis 08/28/2014 Page 18 of 34 reallocation scenarios (252.5 feet) is about 30% (difference of 10% and 40%). That is a 10% reduction from
the average flow frequency for the Interim Rule Curve operations (40%).
Figure 11 Flow Frequency Chart of Wright Patman Releases for Various Reallocation Scenarios
Based on the results for the comparison of average flow frequencies of various operational scenarios, it can
be concluded that the reallocation scenarios render the average frequency of optimal flow range less
favorable compared to the Interim rule curve scenario.
While this analysis provides a significant insight into the impact of reallocation on IP’s ability to release
discharges, it should also be noted that the flow frequency described in this set of results is representative of
average conditions: average over all hydrologic conditions.
5.2 SEASONALITY
Another approach for summarizing the impact of Wright Patman releases on IP discharges is to focus on the
seasonality. Because of the seasonal nature of the TCEQ discharge permit, it is highly relevant to quantify
Sulphur River Basin Feasibility Study – International Paper Impact Analysis 08/28/2014 Page 19 of 34 the seasonal nature of the impact of Wright Patman operations on IP discharges. When revising the Wright
Patman operations from Interim to one of the reallocation scenarios, the seasonal pattern of the operational
curve in Interim scenario will be replaced by a flat curve in the reallocation scenarios. While the flattening of
the curve is beneficial in certain months, it can be disadvantageous in other months. Special attention should
be paid to the active discharge season in IP operations (Late Fall through Early Spring).
To analyze and summarize the seasonal nature of the impacts, two different sets of results were prepared.
The two sets of the results are described below.
5.2.1 SeasonalFlowFrequencies
Wright Patman releases were sorted by season to identify a seasonal pattern associated with the optimal
range of flows released for various Wright Patman operations. Flows were sorted by four seasons: fall
(September – November), winter (December – February), spring (March – May), and summer (June – August).
Plots for each one of the seasons for the period of record are included below along with the discussion of the
results. Plots include a comparison of Interim Rule Curve (baseline operations) with the reallocation scenarios
(proposed operations).
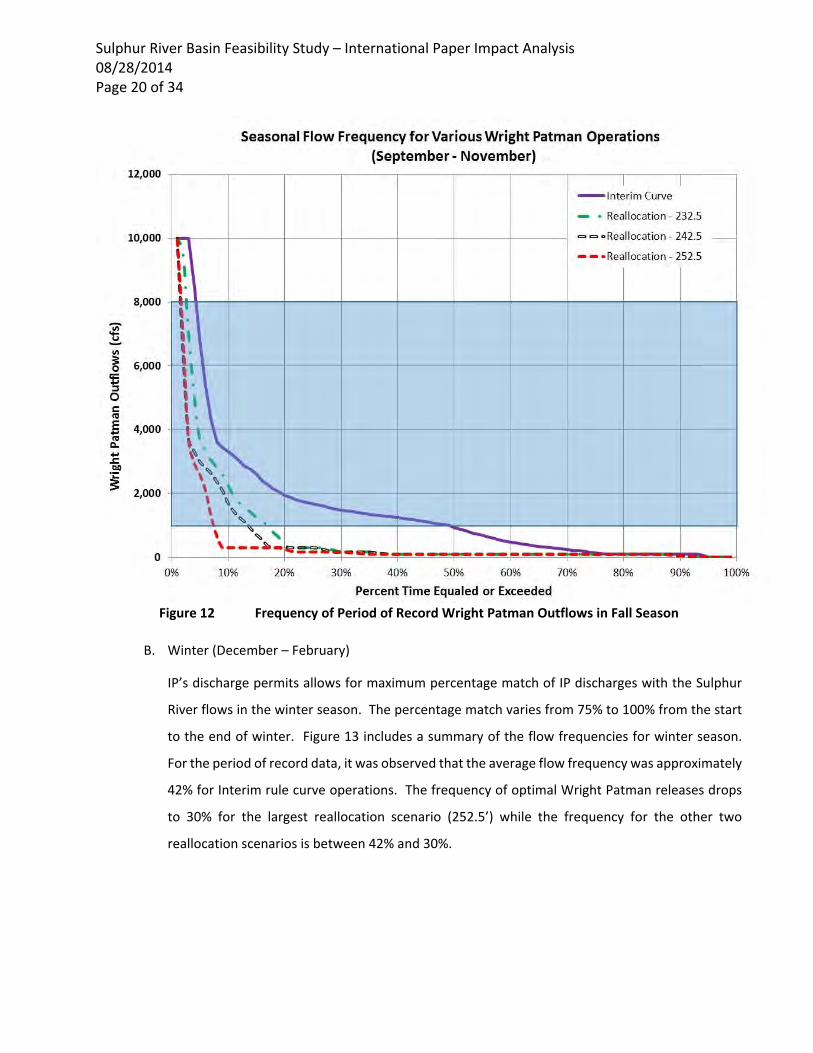
A. Fall (September – November)
Referring to the percentage match allowed by permit in Figure 1, it can be noted that IP’s ability
to release discharges starts ramping up in Fall, with the percentage match increasing from 3% in
September to 35% in November. It can be noted from Figure 12 that the average frequency of
Wright Patman releases in optimal range (for making IP discharges) using Interim rule curve is
about 27%. The frequency of favorable releases reduces significantly when the operations on
Wright Patman are changed to the reallocation scenarios. The average frequency of flows drops
to 5% for the largest reallocation scenarios (252.5’), 8% for reallocation to 242.5 ft, and 9% for
reallocation to 232.5 ft.
Sulphur River Basin Feasibility Study – International Paper Impact Analysis 08/28/2014 Page 20 of 34
Figure 12 Frequency of Period of Record Wright Patman Outflows in Fall Season
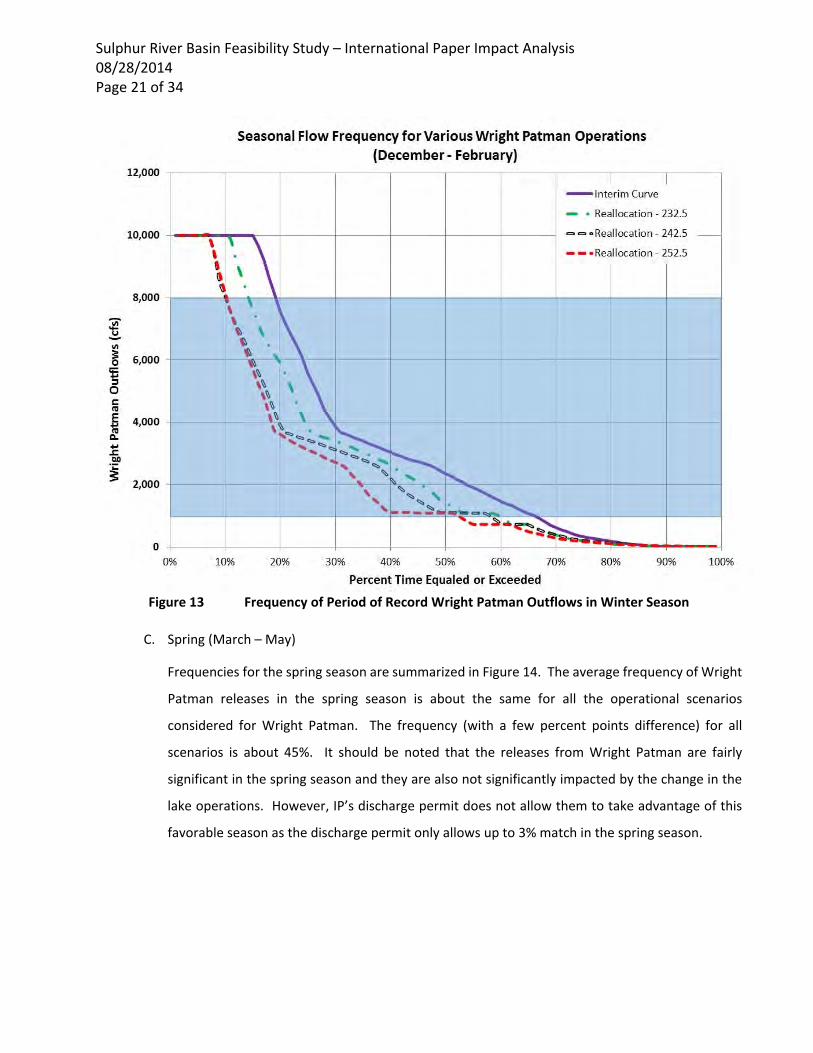
B. Winter (December – February)
IP’s discharge permits allows for maximum percentage match of IP discharges with the Sulphur
River flows in the winter season. The percentage match varies from 75% to 100% from the start
to the end of winter. Figure 13 includes a summary of the flow frequencies for winter season.
For the period of record data, it was observed that the average flow frequency was approximately
42% for Interim rule curve operations. The frequency of optimal Wright Patman releases drops
to 30% for the largest reallocation scenario (252.5’) while the frequency for the other two
reallocation scenarios is between 42% and 30%.
Sulphur River Basin Feasibility Study – International Paper Impact Analysis 08/28/2014 Page 21 of 34
Figure 13 Frequency of Period of Record Wright Patman Outflows in Winter Season
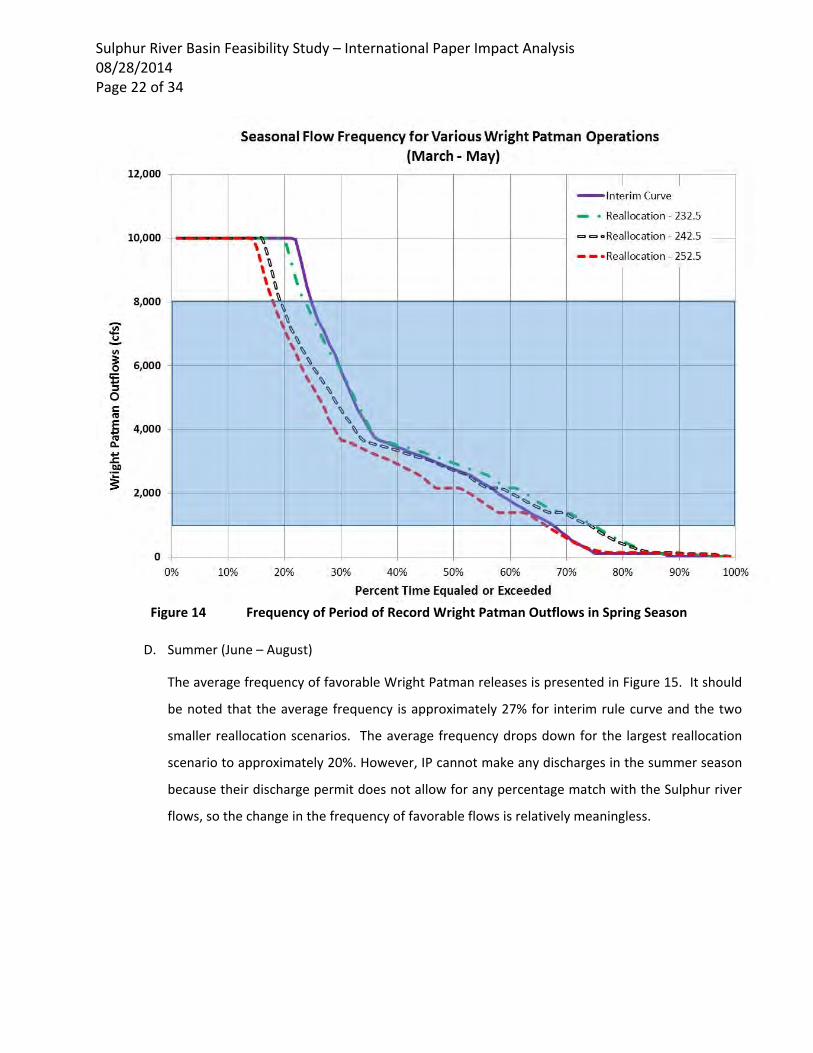
C. Spring (March – May)
Frequencies for the spring season are summarized in Figure 14. The average frequency of Wright
Patman releases in the spring season is about the same for all the operational scenarios
considered for Wright Patman. The frequency (with a few percent points difference) for all
scenarios is about 45%. It should be noted that the releases from Wright Patman are fairly
significant in the spring season and they are also not significantly impacted by the change in the
lake operations. However, IP’s discharge permit does not allow them to take advantage of this
favorable season as the discharge permit only allows up to 3% match in the spring season.
Sulphur River Basin Feasibility Study – International Paper Impact Analysis 08/28/2014 Page 22 of 34
Figure 14 Frequency of Period of Record Wright Patman Outflows in Spring Season
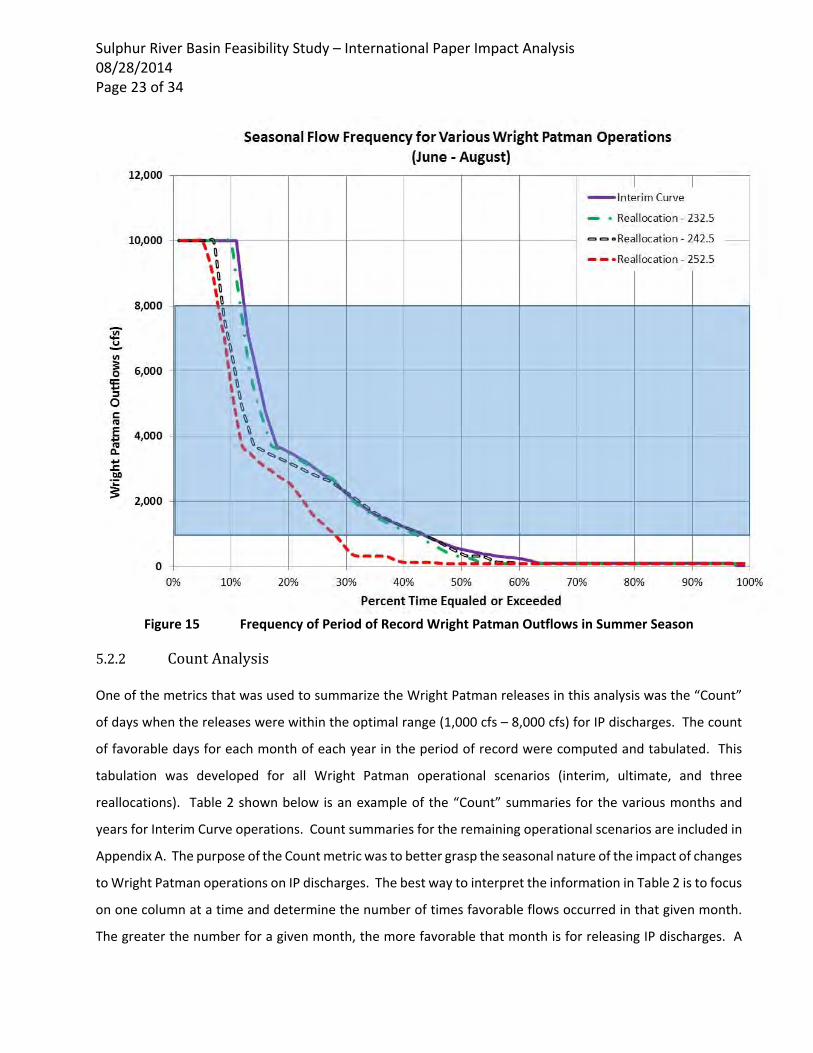
D. Summer (June – August)
The average frequency of favorable Wright Patman releases is presented in Figure 15. It should
be noted that the average frequency is approximately 27% for interim rule curve and the two
smaller reallocation scenarios. The average frequency drops down for the largest reallocation
scenario to approximately 20%. However, IP cannot make any discharges in the summer season
because their discharge permit does not allow for any percentage match with the Sulphur river
flows, so the change in the frequency of favorable flows is relatively meaningless.
Sulphur River Basin Feasibility Study – International Paper Impact Analysis 08/28/2014 Page 23 of 34
Figure 15 Frequency of Period of Record Wright Patman Outflows in Summer Season
5.2.2 CountAnalysis
One of the metrics that was used to summarize the Wright Patman releases in this analysis was the “Count”
of days when the releases were within the optimal range (1,000 cfs – 8,000 cfs) for IP discharges. The count
of favorable days for each month of each year in the period of record were computed and tabulated. This
tabulation was developed for all Wright Patman operational scenarios (interim, ultimate, and three
reallocations). Table 2 shown below is an example of the “Count” summaries for the various months and
years for Interim Curve operations. Count summaries for the remaining operational scenarios are included in
Appendix A. The purpose of the Count metric was to better grasp the seasonal nature of the impact of changes
to Wright Patman operations on IP discharges. The best way to interpret the information in Table 2 is to focus
on one column at a time and determine the number of times favorable flows occurred in that given month.
The greater the number for a given month, the more favorable that month is for releasing IP discharges. A
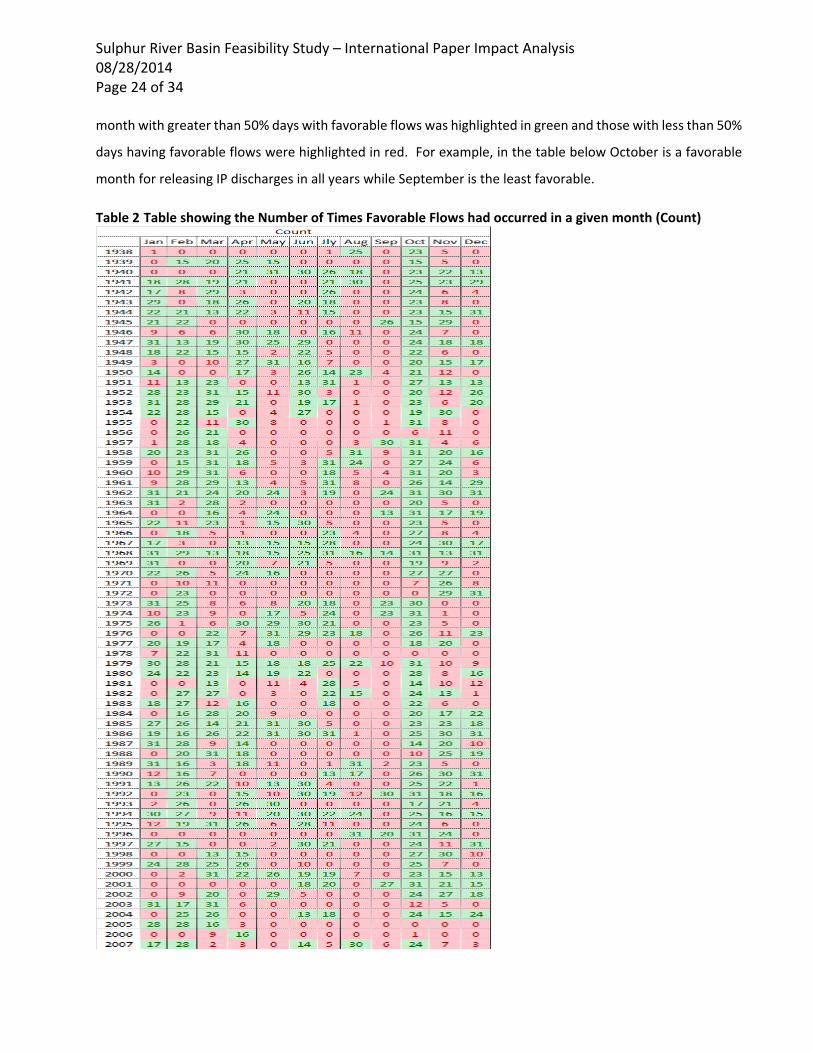
Sulphur River Basin Feasibility Study – International Paper Impact Analysis 08/28/2014 Page 24 of 34 month with greater than 50% days with favorable flows was highlighted in green and those with less than 50%
days having favorable flows were highlighted in red. For example, in the table below October is a favorable
month for releasing IP discharges in all years while September is the least favorable.
Table 2 Table showing the Number of Times Favorable Flows had occurred in a given month (Count)
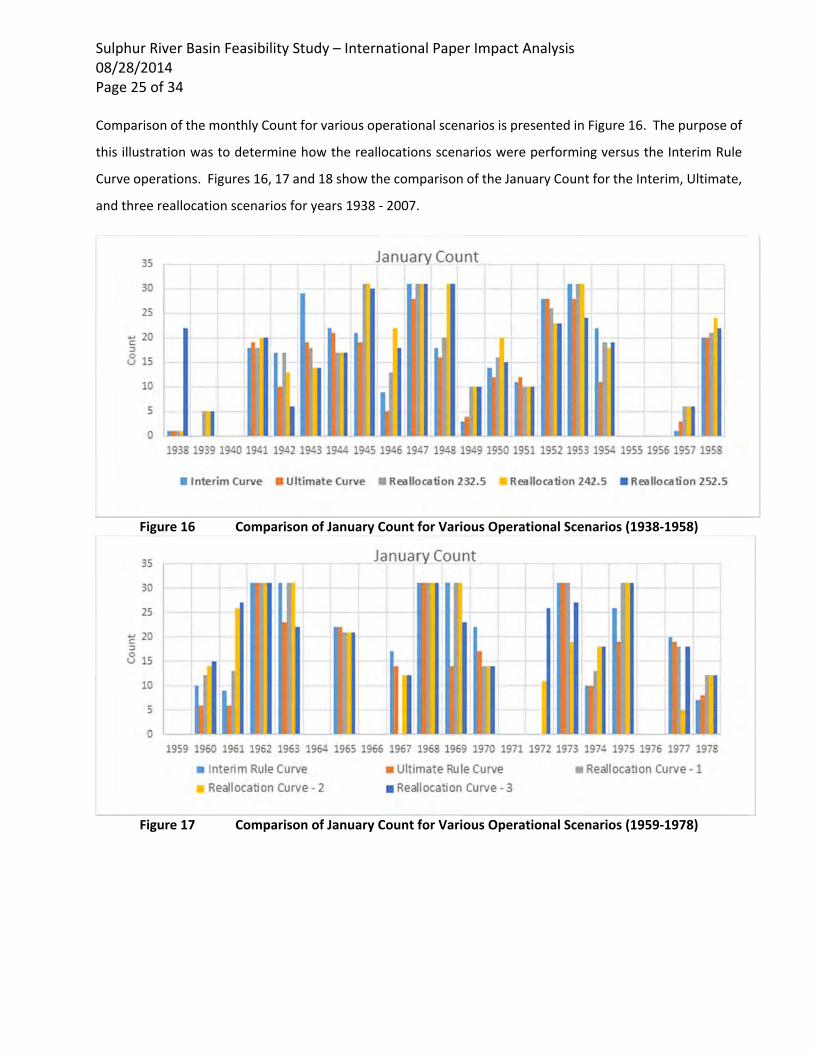
Sulphur River Basin Feasibility Study – International Paper Impact Analysis 08/28/2014 Page 25 of 34 Comparison of the monthly Count for various operational scenarios is presented in Figure 16. The purpose of
this illustration was to determine how the reallocations scenarios were performing versus the Interim Rule
Curve operations. Figures 16, 17 and 18 show the comparison of the January Count for the Interim, Ultimate,
and three reallocation scenarios for years 1938 ‐ 2007.
Figure 16 Comparison of January Count for Various Operational Scenarios (1938‐1958)
Figure 17 Comparison of January Count for Various Operational Scenarios (1959‐1978)
Sulphur River Basin Feasibility Study – International Paper Impact Analysis 08/28/2014 Page 26 of 34
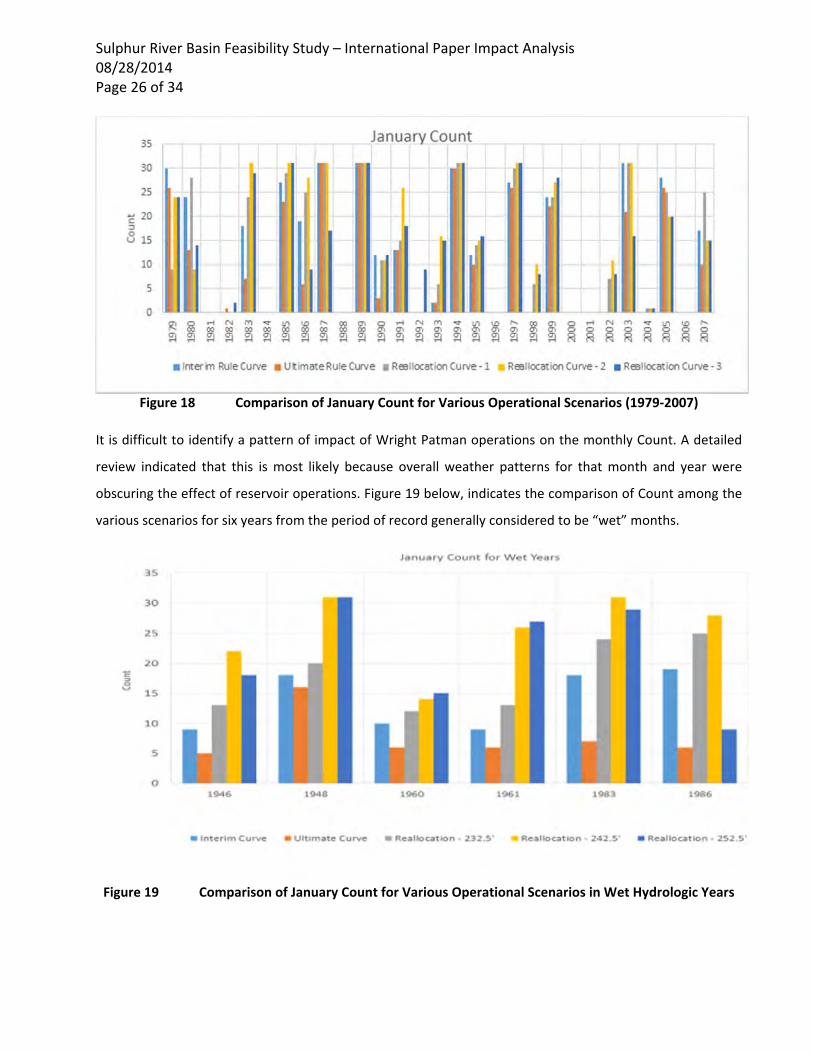
Figure 18 Comparison of January Count for Various Operational Scenarios (1979‐2007)
It is difficult to identify a pattern of impact of Wright Patman operations on the monthly Count. A detailed
review indicated that this is most likely because overall weather patterns for that month and year were
obscuring the effect of reservoir operations. Figure 19 below, indicates the comparison of Count among the
various scenarios for six years from the period of record generally considered to be “wet” months.
Figure 19 Comparison of January Count for Various Operational Scenarios in Wet Hydrologic Years
Sulphur River Basin Feasibility Study – International Paper Impact Analysis 08/28/2014 Page 27 of 34 Figure 19 shows that there is indeed a reasonable pattern to the impact of Wright Patman operations on the
monthly Count. Count is higher for the reallocation scenarios when compared to the interim curve operations
indicating that in wet Januaries, IP’s ability to make discharges is enhanced by the reallocation scenarios as
compared to the baseline conditions.
Wright Patman releases are closely related to the weather conditions because in wet years, reallocation
scenarios allow for greater volumes of water to be held in the Lake (because of the increase in conservation
storage), thus releasing less flows downstream of the Sulphur River towards IP’s discharge location. This
reduction of frequency of high flow releases in turn results in an increase in the number of days Wright Patman
releases are in the optimal range for IP discharges.
A review of the seasonal analyses demonstrates that seasonality in flow availability is a critical concept for IP
operations. It is critical that optimal range of Wright Patman releases occur in the appropriate season so that
IP can take maximum advantage of the discharge permit to make discharges. In that sense, the impact of
Wright Patman operations on the Count metric for months between October – March (active months with
significant match with Wright Patman releases) is much more significant than the impact in other months
where the discharge permit does not allow significant match.
5.3 SIMULATEDHOLDINGPONDOPERATIONS
An alternative way of examining the impact to IP discharges of changes to Wright Patman releases is to track
the holding pond operations for the period of record. IP’s holding pond was simulated in the spreadsheet
model as if it was operational for the entire period of record, based on the information provided by the IP
staff. The holding pond has a capacity of 26,300 ac‐ft, a surface area of 1,315 acres and depth of 20 feet.
Inflows into the holding pond from the IP plant are based on the average of 2007‐2014 historical inflows
provided by IP staff. Rainfall and evaporation at the Wright Patman gage were used as a proxy for the rainfall
and evaporation over the holding pond. The holding pond was emptied by means of the guidelines provided
in the discharge permit. The daily volumes in the holding pond volume for the entire period of record, as
driven by various Wright Patman operational scenarios are discussed in this section.
5.3.1 InterimCurveOperations
Figure 20 is a summary of the historical trend in the Holding Pond volume for Interim Curve operations at
Wright Patman Lake. The blue line tracks the daily volume of the holding pond for the period of record (1938‐
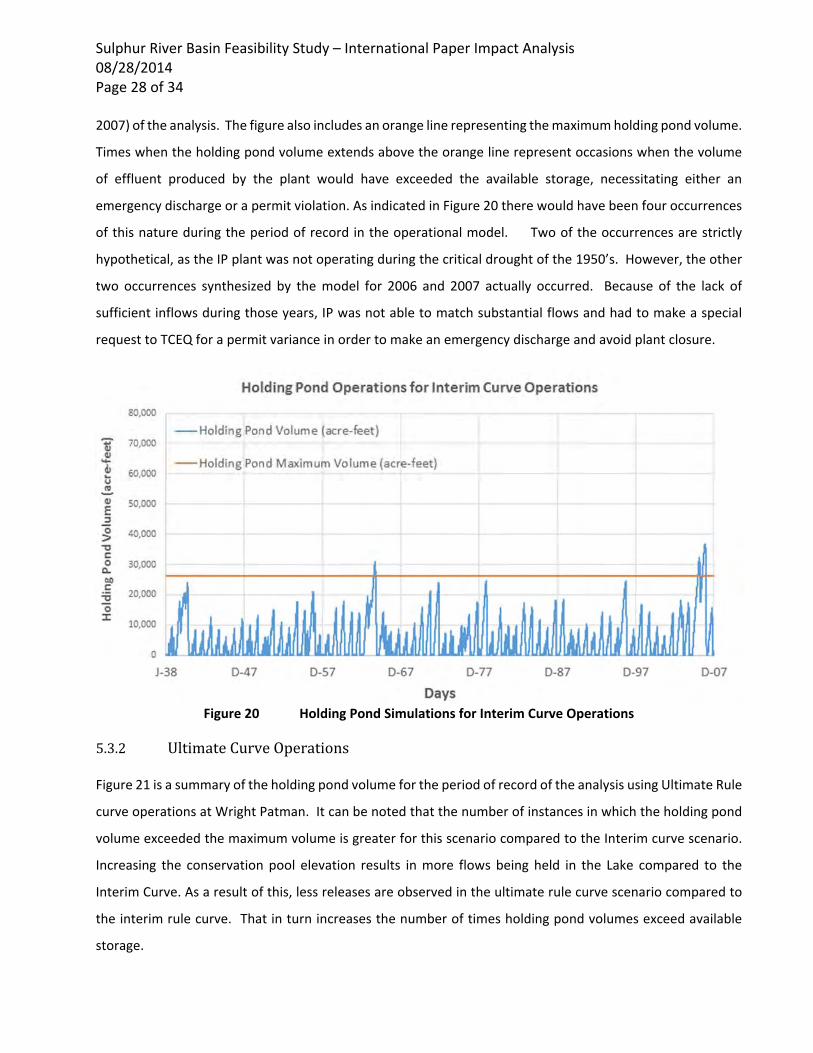
Sulphur River Basin Feasibility Study – International Paper Impact Analysis 08/28/2014 Page 28 of 34 2007) of the analysis. The figure also includes an orange line representing the maximum holding pond volume.
Times when the holding pond volume extends above the orange line represent occasions when the volume
of effluent produced by the plant would have exceeded the available storage, necessitating either an
emergency discharge or a permit violation. As indicated in Figure 20 there would have been four occurrences
of this nature during the period of record in the operational model. Two of the occurrences are strictly
hypothetical, as the IP plant was not operating during the critical drought of the 1950’s. However, the other
two occurrences synthesized by the model for 2006 and 2007 actually occurred. Because of the lack of
sufficient inflows during those years, IP was not able to match substantial flows and had to make a special
request to TCEQ for a permit variance in order to make an emergency discharge and avoid plant closure.
Figure 20 Holding Pond Simulations for Interim Curve Operations
5.3.2 UltimateCurveOperations
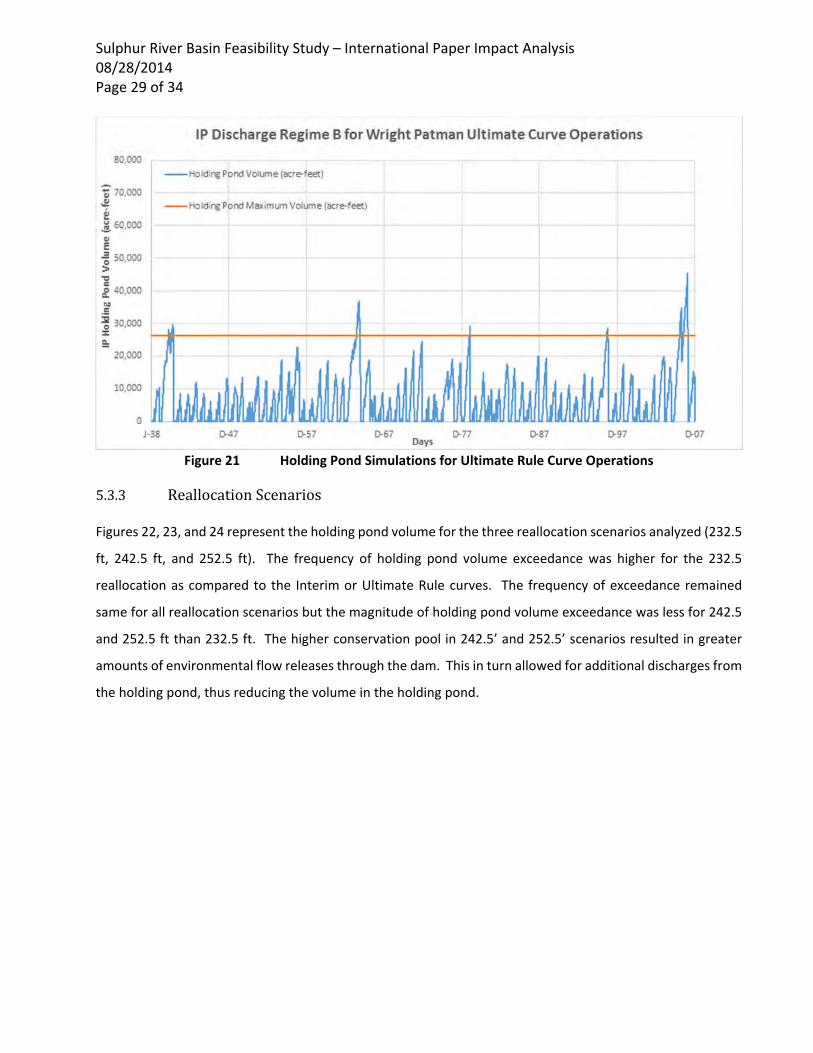
Figure 21 is a summary of the holding pond volume for the period of record of the analysis using Ultimate Rule
curve operations at Wright Patman. It can be noted that the number of instances in which the holding pond
volume exceeded the maximum volume is greater for this scenario compared to the Interim curve scenario.
Increasing the conservation pool elevation results in more flows being held in the Lake compared to the
Interim Curve. As a result of this, less releases are observed in the ultimate rule curve scenario compared to
the interim rule curve. That in turn increases the number of times holding pond volumes exceed available
storage.
Sulphur River Basin Feasibility Study – International Paper Impact Analysis 08/28/2014 Page 29 of 34
Figure 21 Holding Pond Simulations for Ultimate Rule Curve Operations
5.3.3 ReallocationScenarios
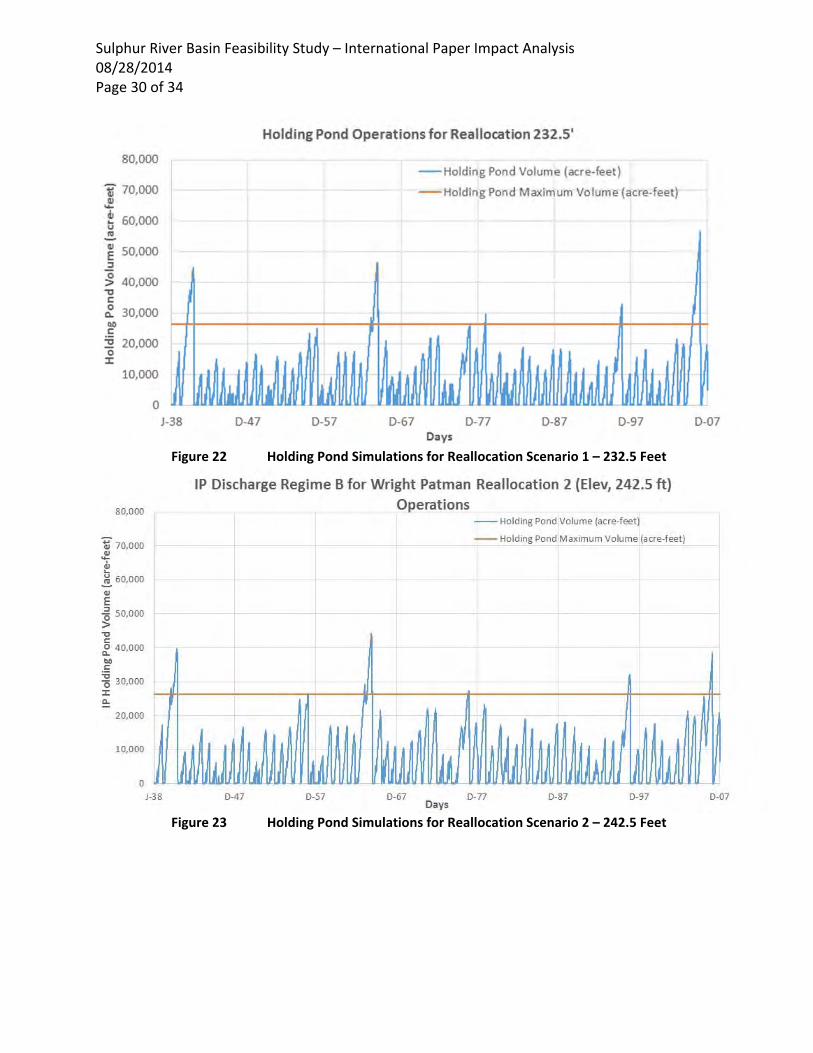
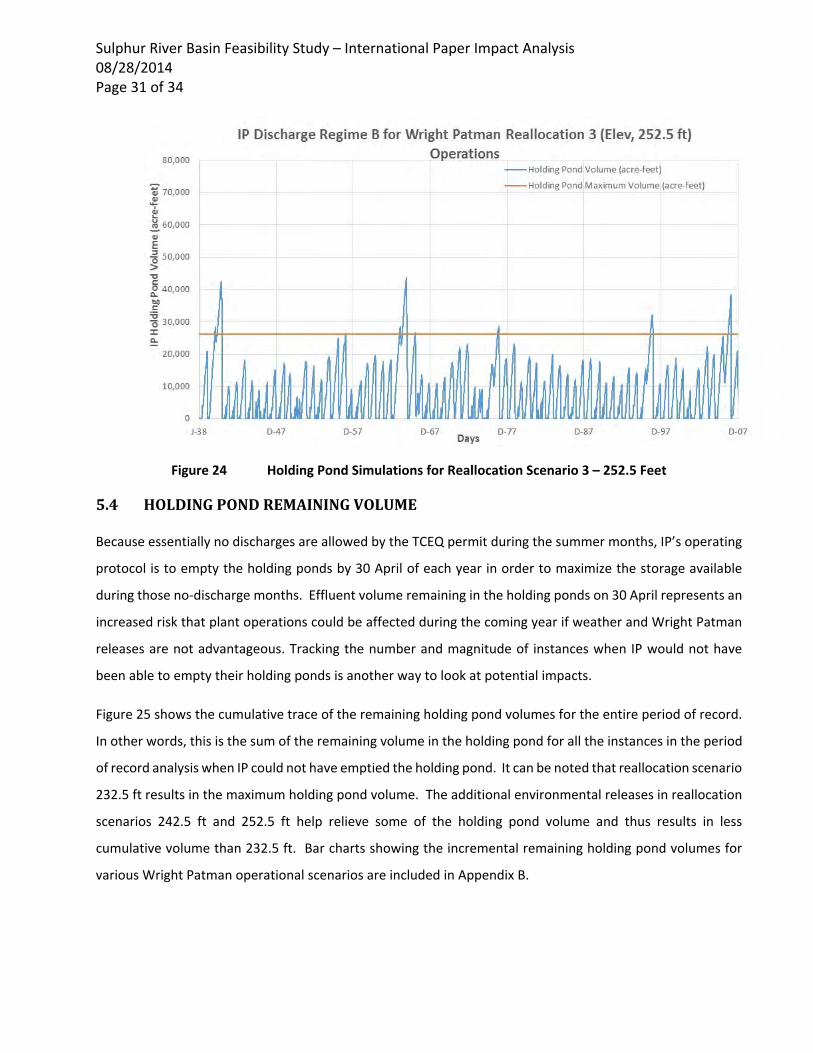
Figures 22, 23, and 24 represent the holding pond volume for the three reallocation scenarios analyzed (232.5
ft, 242.5 ft, and 252.5 ft). The frequency of holding pond volume exceedance was higher for the 232.5
reallocation as compared to the Interim or Ultimate Rule curves. The frequency of exceedance remained
same for all reallocation scenarios but the magnitude of holding pond volume exceedance was less for 242.5
and 252.5 ft than 232.5 ft. The higher conservation pool in 242.5’ and 252.5’ scenarios resulted in greater
amounts of environmental flow releases through the dam. This in turn allowed for additional discharges from
the holding pond, thus reducing the volume in the holding pond.
Sulphur River Basin Feasibility Study – International Paper Impact Analysis 08/28/2014 Page 30 of 34
Figure 22 Holding Pond Simulations for Reallocation Scenario 1 – 232.5 Feet
Figure 23 Holding Pond Simulations for Reallocation Scenario 2 – 242.5 Feet
Sulphur River Basin Feasibility Study – International Paper Impact Analysis 08/28/2014 Page 31 of 34
Figure 24 Holding Pond Simulations for Reallocation Scenario 3 – 252.5 Feet
5.4 HOLDINGPONDREMAININGVOLUME
Because essentially no discharges are allowed by the TCEQ permit during the summer months, IP’s operating
protocol is to empty the holding ponds by 30 April of each year in order to maximize the storage available
during those no‐discharge months. Effluent volume remaining in the holding ponds on 30 April represents an
increased risk that plant operations could be affected during the coming year if weather and Wright Patman
releases are not advantageous. Tracking the number and magnitude of instances when IP would not have
been able to empty their holding ponds is another way to look at potential impacts.
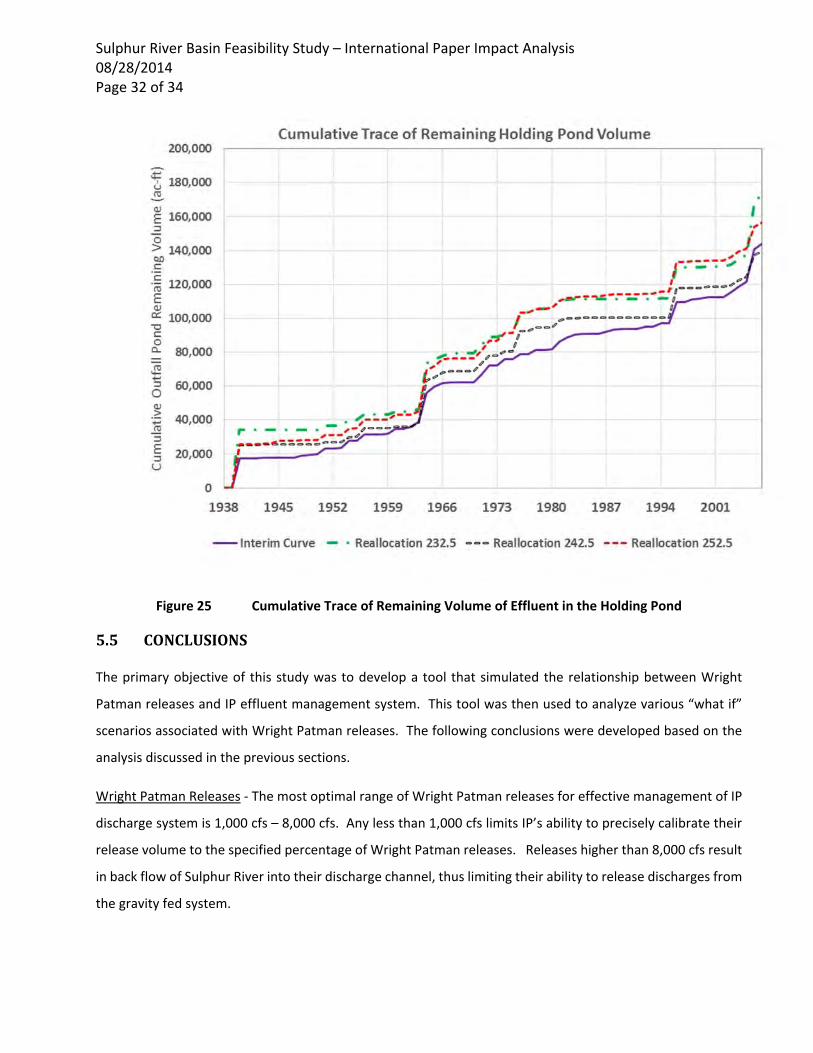
Figure 25 shows the cumulative trace of the remaining holding pond volumes for the entire period of record.
In other words, this is the sum of the remaining volume in the holding pond for all the instances in the period
of record analysis when IP could not have emptied the holding pond. It can be noted that reallocation scenario
232.5 ft results in the maximum holding pond volume. The additional environmental releases in reallocation
scenarios 242.5 ft and 252.5 ft help relieve some of the holding pond volume and thus results in less
cumulative volume than 232.5 ft. Bar charts showing the incremental remaining holding pond volumes for
various Wright Patman operational scenarios are included in Appendix B.
Sulphur River Basin Feasibility Study – International Paper Impact Analysis 08/28/2014 Page 32 of 34
Figure 25 Cumulative Trace of Remaining Volume of Effluent in the Holding Pond
5.5 CONCLUSIONS
The primary objective of this study was to develop a tool that simulated the relationship between Wright
Patman releases and IP effluent management system. This tool was then used to analyze various “what if”
scenarios associated with Wright Patman releases. The following conclusions were developed based on the
analysis discussed in the previous sections.
Wright Patman Releases ‐ The most optimal range of Wright Patman releases for effective management of IP
discharge system is 1,000 cfs – 8,000 cfs. Any less than 1,000 cfs limits IP’s ability to precisely calibrate their
release volume to the specified percentage of Wright Patman releases. Releases higher than 8,000 cfs result
in back flow of Sulphur River into their discharge channel, thus limiting their ability to release discharges from
the gravity fed system.
Sulphur River Basin Feasibility Study – International Paper Impact Analysis 08/28/2014 Page 33 of 34 Average Conditions – A review of average conditions over the period of record revealed that reallocation
scenarios render the average frequency of optimal Wright Patman releases less favorable compared to the
baseline conditions. While this analysis provides a significant insight into the impact of reallocation on IP’s
ability to make discharges, it should also be noted that the flow frequency described in this set of results is
representative of average conditions.
Seasonality – Seasonality analyses appear to provide a better metric for tracking the impact of Wright Patman
operations on IP discharges. IP’s discharge permit allows for a higher percentage match in October – March
compared to the remaining months. A detailed review of the seasonal nature of the Wright Patman releases
depicted that the reallocation scenarios reduced IP’s ability to make discharges in the favorable months
(October – March). It would be advantageous for IP to explore the flow regime for spring season further and
identify potential opportunities for optimizing the flows available in the season.
Count – Another important metric developed to summarize effects to IP was the “count” of days when flows
were within the optimal range of 1,000‐8,000 cfs. The count of favorable days was computed for each month
of each year and analyzed in detail. It was difficult to discern a pattern from the results summarized for various
months and year. The “Count” metric is influenced not just by the changes in the Wright Patman operations
but also by the hydrologic conditions for that month and year. A review of the “Count” metric for wet
hydrologic conditions indicated that the “Count” is higher under the reallocation scenarios than under existing
conditions, i.e., in certain months, reallocation tends to favor IP discharges as compared to the existing
condition. The reallocation scenarios provide opportunity to hold back greater amounts of water in wet years
(because of the increase in conservation storage) thus releasing less water through the outlet works. This in
turn results in greater number of days with releases in optimal range for making IP discharges. Converse of
this was noticed in the dry years, thus making the overall assessment of Count metric for the period of record
problematic.
Holding Pond Volume – Holding pond volumes were simulated over the period of record for baseline and
reallocation scenarios. This analysis identifies instances when the holding pond volume would have exceeded
the available storage due to lack of favorable discharge conditions in the preceding portion of the discharge
cycle. The frequency and magnitude of this type occurrence appears to be s impacted by reallocation of
storage at Wright Patman. Cumulatively, the “remaining” holding pond volume is increased under reallocation
scenarios.
Sulphur River Basin Feasibility Study – International Paper Impact Analysis 08/28/2014 Page 34 of 34 Based on the analysis, it can be generally concluded that reallocation would have a discernable impact on the
IP effluent management system. This screening level analysis should be refined to understand and quantify
this impact better.
6.0 RECOMMENDATIONS
It was noted that the results from the analysis were significantly varied with the changes in the assumptions.
Therefore, it is important to refine the assumptions that reflect the most probable operating conditions for
Wright Patman. A detailed analysis to refine the assumptions and the approach is recommended as a follow‐
up to this study. The next level of analysis should also look at the impact of Wright Patman in association with
other upstream reservoirs. After a detailed study of the impacts, the future studies should include an
assessment of the strategies to mitigate the potential impact on the IP plant operations.
Following assumptions can be analyzed and refined in the next phase of studies:
1. Timing of diversions for water supply
2. Environmental Flow simulations
3. Alternative mechanisms to reduce/mitigate impacts
Increased releases using existing water right under low flow conditions
Modified discharge structure to increase the range of flows under which discharges
could occur
4. Impacts of potential upstream reservoirs on WP operations/discharges and IP system
Recommended