1
Substrates for the sustainable production of mannosylerythritol lipids: biological oils vs nanofiltrated
lignocellulosic hydrolysates
Aldo Robles Arévalo
Thesis to obtain the Master of Science Degree in
Biotechnology
Supervisors: Prof. Dr. Frederico Castelo Alves Ferreira.
Prof. Dr. César Simões da Fonseca.
Examination Committee
Chairperson: Prof. Dr. Leonilde de Fátima Morais Moreira.
Supervisor: Prof. Dr. Frederico Castelo Alves Ferreira
Members of the Committee: Prof. Dr. Pedro Carlos de Barros Fernandes.
October 2015

i
Acknowledgments On first place, I would like to thank to my advisor Prof. Frederico Ferreira for the continuous
support during my research work, for his patience, motivation, enthusiasm, and immense knowledge.
His assistance helped me to perform my lab work and writing of this thesis.
Besides my advisor, I would like to thank my co-advisor Prof. César Fonseca, for their insightful
and accurate comments. Adding to that, for the opportunity to collaborate at LNEG and for introducing
me to lignocellulose biomass.
I would like to thank for the funding which allowed the development of the work. This work was
co-funded by Fundação para Ciência e Tecnologiaby National with the Exploratory Project "TAKE-OFF"
through FEDER funds “Programa Operacional Factores de Competitividade” – COMPETE (FCOMP-
01-0124-FEDER-041191) and national (FCT) funds (EXPL/AAG-TEC/0610/2013).
My sincere gratitude also goes to Dr. Nuno Faria for his invaluable guidance. Also for the hard
questions which incepted me to widen my research from various perspectives.
Additionally, I am grateful to Marisa Santos who gave access to the laboratory and research
facilities at IBB. Also to Dr. Teresa Esteves for her support and enlightening comments.
This project couldn’t have been completed without the collaboration of Dr. Cristina Oliveira for
her assistance to acquire the oils and their characterisation. Also to Dr. Cristina Matos for providing the
environmental analysis of my samples and for her invaluable guidance in this topic.
I thank my fellow lab mates for their support and comprehensiveness, and for all the fun we
have had in the last two years. Specially to Sara Matias and Clara Lopes. Also I thank my class mates
who welcomed me and made me feel at home.
I take this chance to express my gratitude to all of the IBB members for their help and support.
I also recognize my parents for the unceasing encouragement. Specially to my Portuguese parents
Florindo Santos and Leticia Santos who opened the doors of their home and gave me his invaluable
support to conclude this dream. I am also grateful to my Portuguese and Mexican friends who supported
me through out this venture.

ii
Abstract This work aims the sustainable production of biosurfactants, mannosylerythritol lipids (MEL),
exploring the use of different carbon sources by non-conventional yeasts, Pseudozyma spp. Two main
sources were assessed: 1) biological oils (poultry oil, waste frying oil, crude soybean oil, and crude
rapeseed oil) and 2) lignocellulosic biomass (wheat straw). This thesis demonstrates the capacity of
Pseudozyma spp. in producing MEL from biological oils and from sugars in the presence hemicellulosic
hydrolysates, inhere evaluated for the first time. The highest MEL titres were achieved with oils as
substrate after 14 days of bioconversion: refined soybean oil (18.3 gMEL/l), crude soybean oil (13.7
gMEL/l), poultry oil (12.9 gMEL/l), crude rapeseed oil (11.5 gMEL/l), and waste frying oils (8.3 gMEL/l).
The best MEL titre using hemicellulosic hydrolysates supplemented with glucose (1.47 gMEL/l) was
achieved, after detoxification by nanofiltration. The nanofiltration with a polyamide membrane (NF-PA2)
removed 80% of 2-furfuraldehyde, 56% of formic acid, and 43% of acetic acid were removed with a low
monosaccharides loss, (e.g. 17% of D-xylose). Formic and acetic acids revealed inhibitory effect on
biomass yield and MEL titres, which is reduced up to approx. 50% when formic acid is present at 2 g/l.
MEL recovery was achieved by, liquid-liquid extraction with ethyl acetate attaining nearly 80% purity
and 82% yield.
KEYWORDS: Biosurfactants, Mannosylerythritol Lipids, Nanofiltration technologies,
Lignocellulosic biomass, Detoxification.

iii
Resumo Este trabalho visa à produção sustentável de biossurfatantes, manosileritritolípidos (MEL), pela
levedura não convencional Pseudozyma sp. estudando o uso de diferentes fontes de carbono. Duas
principais fontes de carbono foram avaliadas: 1) óleos biológicos (óleo de galinha, óleo residual de
frituras, óleo de soja e óleo de colza não refinados) e 2) biomassa lignocelulósica (palha de trigo). Esta
tese demonstra a capacidade de produção de MEL pela levedura Pseudozyma sp. a partir de óleos
biológicos e de açúcares na presença de hidrolisados de hemicelulose. As concentrações de MEL mais
elevadas foram atingidas após 14 dias de bioconversão usando óleos como substrato: óleo de soja
refinado (18.3 gMEL/l), óleo de soja não refinado (13.7 gMEL/l), óleo de galinha (12.9 gMEL/l), óleo de
colza não refinado (11.5 gMEL/l), e óleos residuais alimentares (8.3 gMEL/l). A melhor concentração
de MEL atingida a partir de hidrolisados de hemicelulose, suplementados com glucose (1.47 gMEL/l),
foi obtida após destoxificação por nanofiltração. A nanofiltração com uma membrana de poliamida (NF-
PA2) removeu 80% de 2-Furfuraldeido, 56% de ácido fórmico e 42% de ácido acético com baixas
perdas de monossacáridos (ex. 17% de D-Xilose). Os ácidos fórmico e acético demostraram ter um
efeito inibitório no rendimento de biomassa e de MEL, efeito que reduz em aproximadamente 50%
quando o ácido fórmico está presente em 2 g/l. O MEL foi recuperado por extração líquido – líquido
com acetato de etilo atingindo cerca de 80% de pureza e 82% de rendimento.
PALAVRAS CHAVE: Biossurfatantes, manosileritritolípidos, nanofiltração, biomassa
lignocelulósica, destoxificação.

iv
Table of Contents
Acknowledgments .................................................................................................................................... i
Abstract ................................................................................................................................................... ii
Resumo .................................................................................................................................................. iii
Table index ............................................................................................................................................ vii
Figure index ........................................................................................................................................... vii
Abbreviations .......................................................................................................................................... x
Chapter 1 -‐ Introduction .......................................................................................................................... 1
1.1 – Overview ................................................................................................................................. 1
1.2 – Objectives and challenges ...................................................................................................... 1
1.3 – Research questions ................................................................................................................ 2
1.4 – Research strategy ................................................................................................................... 2
Chapter 2 – Theoretical background and State-‐of-‐the-‐art ........................................................................ 4
2.1 - Biosurfactants .......................................................................................................................... 4
2.1.1 – Characteristics .................................................................................................................. 4
2.1.2 – Surfactants Market ........................................................................................................... 7
2.1.3 – Industrial Perspectives ................................................................................................... 10
2.1.4 – Production ...................................................................................................................... 11
2.1.5 – New generation of biosurfactants ................................................................................... 12
2.2 – Process Intensification .......................................................................................................... 15
2.2.1 – Principles ........................................................................................................................ 15
2.2.2 – Process design trends: Process intensification (PI) ....................................................... 17
2.3 - Mannosylerythritol Lipids ....................................................................................................... 19
2.3.1 – Properties and differentiation among other molecules ................................................... 19
2.3.2 – Significance of MEL and applications ............................................................................. 19
2.3.3 – Production ...................................................................................................................... 20
2.3.3.1 – Using vegetable oils as substrates .......................................................................... 21
2.3.3.2 – Alternative substrates .............................................................................................. 22
2.3.3.2.a – Lignocellulosic materials as substrate for MEL production ............................... 24
2.3.3.3 – Potential new substrate candidates ......................................................................... 25
2.3.4 – Downstream processing ................................................................................................. 27
2.4 – Sustainable assessment ....................................................................................................... 28
2.4.1 – Life-Cycle Assessment (LCA) for microbial biosurfactants ............................................ 28
2.4.2 – Life-Cycle Assessment (LCA) for vegetable oils. ........................................................... 29
Chapter 3 – Materials and methods ....................................................................................................... 30
3.1 – Upstream processing of lignocellulosic’s derivatives ............................................................ 30
3.1.1 – Selection of nanofiltration (NF) membrane ..................................................................... 30

v
3.1.2 – Diafiltration modelling ..................................................................................................... 31
3.1.3 – Selection of conditions to perform NF ............................................................................ 32
3.1.4 – Lignocellulosic hydrolysates ........................................................................................... 33
3.1.5 – Hydrolysate detoxification: diafiltration aided by NF membranes. .................................. 33
3.1.6 – Concentration quantification of nanofiltrated solutions ................................................... 34
3.2 – MEL production ..................................................................................................................... 34
3.2.1 – Yeast strain, maintenance and standard cultivation ....................................................... 34
3.2.2 – Growth media and bioconversion ................................................................................... 34
3.2.2.1 – MEL production from biological oils ......................................................................... 34
3.2.2.1.1 – Characterization of oils used as substrates. ..................................................... 35
3.2.2.2 – Assessment of the effect of organic acids on MEL production ................................ 35
3.2.2.3 – Assessment of the effect of inorganic acids on MEL production ............................. 36
3.2.2.4 – MEL production from lignocellulosic’s materials ...................................................... 36
3.2.2.5 – Environmental assessment ...................................................................................... 39
3.2.3 – Analytical methods ......................................................................................................... 39
3.2.3.1 – Yeast growth and viability ........................................................................................ 39
3.2.3.2 – Sugar profile ............................................................................................................ 40
3.2.3.3 – Oligosaccharides ..................................................................................................... 40
3.2.3.4 – MEL and fatty acid profile ........................................................................................ 40
3.2.3.5 – Glycerides quantification .......................................................................................... 41
3.2.3.6 – Lipolytic activity ........................................................................................................ 41
3.3 – MEL isolation ........................................................................................................................ 42
Chapter 4 – Results and discussion ........................................................................................................ 45
4.1 – MEL production from biological oils ...................................................................................... 45
4.1.1 – Oils characterisation ....................................................................................................... 45
4.1.2 –Screening of different refined SBO concentrations for optimal MEL production by
Pseudozyma antarctica PYCC 5048T ............................................................................................... 46
4.1.3 – Assessment of MEL production using different sustainable oil sources as carbon sources
.......................................................................................................................................................... 49
4.1.3.1 – Biomass and nitrate consumption ............................................................................ 49
4.1.3.2 – MEL titres ................................................................................................................. 51
4.1.3.3 –Lipase activity and oil consumption .......................................................................... 52
4.1.4 – Environmental assessment ............................................................................................ 54
4.1.5 – Remarks ......................................................................................................................... 55
4.2 – MEL production from lignocellulosic biomass: detoxification and bioconversion .................. 56
4.2.1 – Membrane selection ....................................................................................................... 56
4.2.2 – Diafiltration and detoxification ........................................................................................ 60
4.2.3 – Effects of organic acids on MEL production ................................................................... 62
4.2.4 – Assessment of the effect of inorganic ions on MEL production. ..................................... 66
4.2.5 - Bioconversion of wheat straw hemicellulose hydrolysate for MEL production ................ 67

vi
4.3 – Downstream processing ....................................................................................................... 74
Chapter 5 – Conclusions ......................................................................................................................... 76
Chapter 6 – Future opportunities ........................................................................................................... 78
References ................................................................................................................................................ I
Appendices ............................................................................................................................................... i
Poultry oil (Animal fats) CoA .............................................................................................................. i
Soybean oil CoA ............................................................................................................................... ii
Rapeseed oil CoA ............................................................................................................................ iii
Waste frying oil CoA ........................................................................................................................ iv

vii
Table index Page Table 1 - Description of the five different interfaces and applied examples ………………………………… 4 Table 2 – Environmental and health concerns due to extensive use of surfactants ……………………...... 5 Table 3 – Examples of the more common biosurfactants and their origin …………………………………... 9 Table 4 – Biosurfactant producing companies around the globe …………………………………………...... 12 Table 5 – Waste materials that has been used as feedstock for biosurfactant synthesis …………………. 14 Table 6 – Most common UO used in biological processes ……………………………………………………. 16 Table 7 – Selected microorganisms reported on literature as MEL producers and their chemical diversity 22 Table 8 – Different conditions reported for the production of MEL …………..………………………………. 25 Table 9 - Description of membranes that were assessed. Information taken from suppliers ...…………… 30 Table 10 -Parameters included in the CoA of the non-mineral oils used as carbon source towards MEL production ………………………………………………………………………………………………………….
37
Table 11 - Description of the experimental conditions to assess the effect of organic acids on MEL production ………………………………………………………………………………………………………….
39
Table 12 - Chemical compounds used to test membranes’ rejection ………………………………………... 44 Table 13 - Parameters analyzed in the biological oils that were assessed .…………………………………. 46 Table 14 - Data obtained of at day 10 of bioconversion of refined SBO. It includes MEL titres, volumetric productivity, and yield (27 ºC, 250 rpm) (Mean ± SD, n = 2) ……………………………………………….....
49
Table 15 - Data obtained of at day 10 of bioconversion of the different biological oils that were assessed. It includes nitrate consumption, substrate consumption, MEL titres, volumetric productivity, and yield (27 ºC, 250 rpm) (Mean ± SD, n = 2)…………………………………………………………………………….
52
Table 16 - Substrate consumption, MEL titre, volumetric productivity, and yield obtained from the bioconversion from the acids assays at 10TH day (27 ºC, 250 rpm) (Mean ± SD, n = 2)………………….
65
Figure 17 - Concentrations of D-(+)-glucose, D-(+)-xylose, formic acid, acetic acid, and 2-furfuraldehyde in wheat straw hemicellulosic hydrolysate after detoxification (3 D) (20 bar, pH = 2) either with NF-PA1 or NF-PA2 for MEL production. (Mean ± SD, n = 2;; n = 1 (detoxified, NF-PA1)) …………………………. 68 Figure 18 – Substrate consumption (CF/ Ci), MEL titre, volumetric productivity, and yield obtained from the bioconversion using wheat straw hemicellulosic hydrolysate from NF-PA1 (18TH day) and NF-PA2 (14th day) membrane (27 ºC, 250 rpm). Some data from Table 16 (purple shaded) was added for comparison purposes (Mean ± SD, n = 2;; n = 1 acids assay)………………………………………………..
69
Table 19 - MEL recovery using two different procedures on two different carbon sources (oils and sugars) used in the medium. The reported parameters are purity/concentration, yield of operation (Y) and solvent intensity (litres of solvent per gram of produced MEL). (Mean ± SD, n = 2 (SBO);; n = 3 (glucose))…………………………………………………………………………………………………………..
75
Table 20 - Advantages and disadvantages of the two main groups of carbon sources studied for this thesis work………………………………………………………………………………………………………….
77
Figure index Page
Figure 1 – Surfactants demand in each industrial sector …………..………………………………………… 4 Figure 2 – Construction and screening of metagenomic libraries from different ecosystems A and B addressed to find out novel biosurfactant-producing microorganisms ………………………………………. 6 Figure 3 – Selected chemical structures of some biosurfactants (adapted) …………...……………………. 7 Figure 4 – Consumption of Surfactants by Major Region (adapted) ……………...………………………….. 8 Figure 5 – Key opportunities in surfactants market …………………………………………………………….. 9 Figure 6 - World Supplies of Exported Organic Surface-Active Agents in 2013 …………………………….. 10 Figure 7 - Chemical structures of MEL molecules families (adapted) ………………………………………… 20 Figure 8 – Fluorescence microscopic examination with Nile red staining (right panels). Differential interference contrast (DIC, left panels) …………………………………………………………………………... 23 Figure 9 – Process diagram representing the main stages in biomass feedstock transformation. It is integrated the alternative detoxification procedure that is suggested to perform (“NF membrane” technologies) with the other stages occurring during upstream, bioconversion and downstream processing.………………………………………………………………………………………………………….. 40 Figure 10 – Schematic illustration of the HPLC method used for mono-, di-, triglyceride estimation. Taken from Gueiros, I. …………………………………………………………………………………………………….. 41 Figure 11 – Process flow sheet representing MEL downstream processing using successive liquid-liquid extractions with ethyl acetate. Operational conditions for centrifugation and vacuum drying are detailed 43 Figure 12 – Process flow sheet for two-stage liquid-liquid extractions ………………………………………. 43 Figure 13 - Glycerides biotransformation by P. antarctica PYCC 5048T in two different concentrations of SBO (72 g/l and 21.1 g/l);; and two different mixing patterns. Bars comprises the mmol of triglycerides (pale blue), diglycerides (green), and monoglycerides (dark blue) at day 0 and 10 (27 ºC, 250 rpm) (n=1) 47

viii
Figure 14 – MEL titres produced by P. antarctica PYCC 5048T in two different concentrations of SBO (72 g/l and 21.1 g/l);; and two different mixing patterns at 10th day (27 ºC, 250 rpm) (Mean ± SD, n = 2)… 48 Figure 15 – Cell dry weight on different growth media during 10 days of bioconversion (27ºC, 250 rpm). Carbon substrates: Glucose (dark dashed blue line), orange dashed line), crude rapeseed oil (pale blue dash line), poultry oil (purple dashed line), and crude SBO (green dashed line) (Mean ± SD, n = 2)……. 50 Figure 16 - Nitrates concentration during 10 days of bioconversion on different media by P. antarctica PYCC 5048T (27ºC, 250 rpm). Carbon substrates: Glucose (dark dashed blue line), orange dashed line), crude rapeseed oil (pale blue dash line), poultry oil (purple dashed line), and crude SBO (green dashed line) (Mean ± SD, n = 2)……………………………………………………………………………………………. 50 Figure 17 - MEL titres obtained during 10 days of bioconversion on different carbon sources by P. antarctica PYCC 5048T. Glucose 72 g/l (red dashed line), crude SBO 72 g/l (green dashed line), poultry oil 72 g/l (purple line), crude rapeseed oil 72 g/l (blue line), and WFO g/l (orange dashed line) (27ºC, 250 rpm) (Mean ± SD, n = 2)………………………............................................................................................. 52 Figure 18 - Lipase activity (U/ml) on different growth media during 10 days of bioconversion under conditions specified before. Glucose 72 g/l (red dashed line), crude SBO 72 g/l (green dashed line), poultry oil (purple line), crude rapeseed oil (blue line), and WFO (orange dashed line) (37ºC, 700 rpm) (Mean ± SD, n = 2)………………………………………………………………………………………………… 53 Figure 19 - Specific activity (U/g of protein) vs oil content (total glycerides – g/l) during 10 days of bioconversion under the conditions specified before. A) Poultry oil, B) crude SBO, C) crude rapeseed oil, and D) WFO. The red dashed lines show the total concentration of glycerides in each medium, The blue dashed line shows the data regarding enzymatic activity (37ºC, 700 rpm) (Mean ± SD, n = 2)…………… 53 Figure 20 - Chemical changes in the mono-, di-, and triglycerides on different oil sources during 10 days of bioconversion (27ºC, 250 rpm). A) Poultry oil, B) crude SBO, C) crude rapeseed oil, and D) WFO. The red dashed lines show the total glyceride concentration in each medium, Bars express TAG content (pale blue), DAG content (green), and MAG (dark blue) (Mean ± SD, n = 2)……………………………………… 54 Figure 21 – Environmental impact on the use of resources, on ecosystems, and human health of WFO (used cooking oils), poultry oil (Fats), crude rapeseed oil (Rapeseed), and crude SBO (Soybean). Databases: ECOINVENT (Switzerland) and Agri-footprint gouda © (The Netherlands)…………………… 55 Figure 22 – Rejection profile (Eq. (3)) of all tested membranes. NF-PA1 (blue line), NF-PA2 (red line), NF-PES1 (purple line), and NF-PES2 (green line) (20 bar, pH = 2) (Mean ± SD, n = 2)….……………….. 56 Figure 23 – Rejection profile (Eq. (3)) of Polyamide’s membranes. Standard deviation is represented with black vertical bars for each point. Rejection profile of NF-PA1 was obtained at pH=2 (blue continuous line) and at pH=7 (blue dashed line). Also, rejection profile of NF-PA2 was obtained at pH=2 (20 bar) (red continuous line) and at pH=7 (red dashed line)…………………………………………………………………. 57 Figure 24 – Chemical pattern for polyamide membranes proposed by Fernández, J. F., et.al. [192]. Black points represent “available” bonds, green points are positive charges (R-NH3+), and hydrophobic potentials are shaded in yellow. Brown point are the negative charges (R-COO-), red points are H donors, blue points are H receptors, and charge transfer areas due to π bonding are shaded in purple………….. 58 Figure 25 – Plots representing rejection profile of some toxic compounds (left column) and sugars (right column) at different pH values (2, 3.9, 4.7, and 7) for NF-PA2 membrane at different pressures: 10 bar (blue lines), 20 bar (red lines), and 30 bar (green line). A = formic acid, B = acetic acid, C = 2-furfuraldehyde, D = D-(+)-xylose, E = D-(+)-glucose, F = D-(+)-cellobiose ……………………………..….. 59 Figure 26 – Diafiltration model for NF-PA1 membrane. Continuous lines represent theoretical values (modelling) and dashed lines are experimental data for: D-(+)-glucose (pale blue), D-(+)-xylose (red) (overlapped theoretical values) substrate losses and furfural (orange), formic acid (olive green), and acetic acid (purple) removal. Red dashed lines denotes either 20 % of permeation or 90 % of permeation (20 bar, pH = 2) (Mean ± SD, n = 2)……………………………………………………………………………..
60
Figure 27 - Theoretical and experimental permeation of sugars and toxic compounds on NF-PA2 membrane (20 bar, pH = 2). Continuous lines represent theoretical values (modelling) and dashed lines are experimental data for: D-(+)-glucose (indigo), D-(+)-xylose (red) (theoretical values overlapped) substrate losses and furfural (orange), formic acid (green), and acetic acid (purple) removal. Horizontal red dashed lines denotes either 20 % of permeation of substrates or 90 % of permeation of toxic compounds (Mean ± SD, n = 2)…………………………………………………………………………………… 61 Figure 28 - Biomass concentrations during 10 days of bioconversion on different ratios of organic acids (upper graph: day 0 and 4;; below graph: day 7 and 10). Samples with higher formic acid concentration are coloured in dark orange or in dark green. The control (40 g/l D-(+)-Glucose) is shown in the blue bars. The samples containing H2SO4 are presented in the green bars. The samples formulated without sulphuric acid are grouped in the orange bars. The bars are presented in the following order from left to right: 1) [1.92 g/l acetic acid : 3.04 g/l formic acid];; 2) [1.23 g/l acetic acid : 1.04 g/l formic acid];; 3) [0.54 g/l acetic acid : 0.44 g/l formic acid];; 4) [0.29 g/l acetic acid : 0.19 g/l formic acid];; 5) [0.12 g/l acetic acid : 0.05 g/l formic acid];; 6) [1.74 g/l formic acid];; 7) [0.11 g/l acetic acid : 0.86 g/l formic acid];; 8) [0.27 g/l acetic acid : 0.79 g/l formic acid];; 9) [1.22 g/l acetic acid : 0.24 g/l formic acid];; 10) [1.02 g/l acetic acid : 0.03 g/l formic acid];; 11) [2.01 g/l acetic acid];; 12) Control (40 g/l D-(+)-glucose);; 13) [1.07 g/l acetic acid : 0.84 g/l formic acid + H2SO4];; 14) [0.11 g/l acetic acid : 0.80 g/l formic acid + H2SO4];; 15) [1.09 g/l acetic acid : 0.84 g/l formic acid + H2SO4] (27ºC, 250 rpm) (n = 1)……………………………………………......... 63 Figure 29 – Residual glucose concentrations at 4th (Orange bars), 7th (blue bars), and 10th (purple bars) day of bioconversion (27ºC, 250 rpm) ( n = 1) …………………………………………………………………. 64
ix
Figure 30 –MEL titres achieved at day 10 of bioconversion by P. antarctica (27 ºC, 250 rpm) (n = 1)........... 65 Figure 31 - MEL titres achieved at 10th day of bioconversion by P. antarctica. The control (40 g/l D-(+)-Glucose) is presented as a white bar. On the left of control are grouped the samples formulated without sulphuric acid. The bars placed on the right side of the control show the data for those formulas supplemented with sulphuric acid. Values on the top of these bars display the MEL titre for these samples. Bars are ordered in the following order: 1) [1.23 g/l acetic acid: 1.04 g/l formic acid];; 2) [0.11 g/l acetic acid : 0.86 g/l formic acid];; 3) [0.12 g/l acetic acid : 0.05 g/l formic acid];; 4) Control;; 5) [1.07 g/l acetic acid : 0.84 g/l formic acid + H2SO4];; 6) [0.11 g/l acetic acid : 0.80 g/l formic acid + H2SO4];; 7) [1.09 g/l acetic acid : 0.84 g/l formic acid + H2SO4] (27 ºC, 250 rpm) (n = 1)……………………………………..…………… 65 Figure 32 - Biomass formation during 14 days of bioconversion (27ºC, 250 rpm). The control medium is presented as the navy blue line. The medium containing [D-(+)-glucose + sulphuric acid + sodium hydroxide] is presented as a red line. The medium containing [D-(+)-glucose + sulphuric acid + potassium hydroxide] is presented as a green line. The medium containing [D-(+)-glucose + phosphoric acid + potassium hydroxide] is presented as a purple line. The medium containing [D-(+)-glucose + nitric acid + potassium hydroxide] is presented as a pale blue line (n = 1)…… ………………………………………….. 67 Figure 33 – MEL titres achieved at 7th, 10th, and 14th day of bioconversion under influence of different inorganic ions (27ºC, 250 rpm). The control values are shown in the navy blue bars. The medium containing [D-(+)-glucose + sulphuric acid + sodium hydroxide] is presented as a red bar. The medium containing [D-(+)-glucose + sulphuric acid + potassium hydroxide] is presented as a green bar. The medium containing [D-(+)-glucose + phosphoric acid + potassium hydroxide] is presented as a purple bar. The medium containing [D-(+)-glucose + nitric acid + potassium hydroxide] is presented as a pale blue bar (n = 1).…………………………………………………………………………………………………….. 67 Figure 34 - MEL titres achieved at day 18 of bioconversion (27 ºC, 250 rpm). The bars are displayed in the following order from left to right: 40 g/l Glucose (blue bar), 40 g/l glucose supplemented with 2.4 g/l H2SO4 and neutralised with NaOH (red bar), 80 % v/v of non-detoxified hydrolysate (gap), 40 % v/v detoxified hydrolysate (gap), 20 % v/v detoxified hydrolysate (pale blue bar), 0.6 g/l 2-furfuraldehyde (orange bar), 5 g/l acetic acid (blue navy bar), 5.4 g/l of formic acid (vermilion bar), and 80 % v/v detoxified hydrolysate (gap) (Mean ± SD, n = 2).)………………………………………………………………………….. 70 Figure 35 - MEL titres at day 14. Numbers inside bars denotes MEL titres’ values on different media: 40 g/l Glucose (blue bar), 40 g/l glucose supplemented with 2.4 g/l H2SO4 (red bar), 80 % v/v of non-detoxified hydrolysate (gap), and 80 % v/v detoxified hydrolysate (purple bar) (Mean ± SD, n = 2).……… 70 Figure 36 – Biomass values during 18 days of bioconversion on different media: 40 g/l Glucose (blue dashed line), 40 g/l glucose supplemented with 2.4 g/l H2SO4 and neutralised with NaOH (red line), 80 % v/v of non-detoxified hydrolysate (green dashed line), 40 % v/v detoxified hydrolysate from NF-PA1 (purple dotted line), 20 % v/v detoxified hydrolysate (pale blue dashed line), 0.6 g/l 2-furfuraldehyde (orange continuous line), 5 g/l acetic acid (indigo continuous line), 5.4 g/l of formic acid (pink continuous line), and 80 % v/v detoxified hydrolysate (pale green continuous line) (27 ºC, 250 rpm) (Mean ± SD, n = 2)…………………………………………………………………………………………………………………… 71 Figure 37 – Biomass concentrations during 14 days of bioconversion on different media: 40 g/l Glucose (blue dashed line), 40 g/l glucose supplemented with 2.4 g/l H2SO4 (red line), 80 % v/v of non-detoxified hydrolysate (green dashed line), and 80 % v/v detoxified hydrolysate (purple dotted line) (Mean ± SD, n = 2).………………………………………………………………………………………………………………….. 71 Figure 38 – Glucose concentrations during 18 days of bioconversion on different media: 40 g/l Glucose (blue dashed line), 40 g/l glucose supplemented with 2.4 g/l H2SO4 and neutralised with NaOH (red line), 80 % v/v of non-detoxified hydrolysate (green dashed line), 40 % v/v detoxified hydrolysate from NF-PA1 (purple dotted line), 20 % v/v detoxified hydrolysate (pale blue dashed line), 0.6 g/l 2-furfuraldehyde (orange continuous line), 5 g/l acetic acid (indigo continuous line), 5.4 g/l of formic acid (pink continuous line), and 80 % v/v detoxified hydrolysate (pale green continuous line) (27 ºC, 250 rpm) (Mean ± SD, n = 2)…………………………………………………………………………………………………………………… 72 Figure 39 – Glucose concentrations during 14 days of bioconversion on different media: 40 g/l Glucose (blue dashed line), 40 g/l glucose supplemented with 2.4 g/l H2SO4 (red line), 80 % v/v of non-detoxified hydrolysate (green dashed line), and 80 % v/v detoxified hydrolysate (purple dotted line) (Mean ± SD, n = 2)…………………………………………………………………………………………………………………… 72 Figure 40 – Detoxified wheat straw hydrolysate. Plot summarizes the changes of glucose (purple dashed line), xylose (red dashed line), formic acid (green dashed line), acetic acid (pale blue dashed line), furfural (dark blue line), XOS (indigo continuous line), and biomass (orange line) in the detoxified wheat straw hydrolysate. It begins with the upstream processing. This includes its reception (crude) and detoxification trough NF membrane. Day 0 of bioconversion shows the values after supplementation with glucose (40 g/l) and autoclaving (Mean ± SD, n = 2)…………………………………………………………………………. 73 Figure 41 – Bioconversion of wheat straw hemicellulose hydrolysate (80% v/v) supplemented with 40 g/l of glucose. Plot summarizes the changes of glucose (purple dashed line), xylose (red dashed line), formic acid (green dashed line), acetic acid (pale blue dashed line), XOS (indigo continuous line), and 2-furfuraldehyde (dark blue line) in the non-detoxified wheat straw hydrolysate. It begins with the reception (crude). Day 0 of bioconversion shows the values after supplementation with glucose (40 g/l) and autoclaving (Mean ± SD, n = 2)…………………………………………………………………………………… 74

x
Abbreviations
€ Euros Ac Acyl group APG Alkyl polyglucoside ATPS Aqueous two-phase system CAL-A Candida antarctica lipase A CAL-B Candida antarctica lipase B CF Concentration in the feed CMC Critical Micelle Concentration CP Concentration in the permeate CR Concentration in the retentate DAG Diglycerides EC European Commission ELCD European reference Life Cycle Database EOR Enhanced oil recovery EPLCA European Platform on Life Cycle Assessment EU European Union GHG Greenhouse gases HMF Hydroxy-methyl Furfural HTP High throughput ILCD International reference Life Cycle Data System ISO International Organization for Standardization Ka Dissociation constant of acids kTon Kilo Tonne LCA Life-cycle analysis (assessment) LCDN Life Cycle Data Network LP Permeability Mac1 Mac 2 Mannose acyltransferases
MAG Monoglycerides MEL Mannosylerythritol Lipids MES Methyl Ester Ketone MM Molecular mass MTBE Methyl-tert-butyl ether MWCO Molecular Weight Cut Off n.a. Not assessed n.d. Not detected NA Non available
OOME Olive oil mill effluent PI Process Intensification
PostFFA Post-refining fatty acids PostRW Post-refining waste PTS1 Type 1 peroxisomal targeting signal RDH Red dwarf honey bees (Apis Florea) REACH Registration, Evaluation, Authorization and Restrictions of Chemicals ROS Reactive oxygen species RX Rejection SBO Soy Bean Oil SHF Separate hydrolysis and fermentation SSF Simultaneous saccharification and fermentation TAG Triacylglycerol TAG Triglycerides TDS Technical Data Sheet TLC Thin Layer Chromatography Tmax Maximum temperature UO Unit operation(s) US The United States USA The United States of America

xi
USD American Dollars v/v Volume of solute per volume of solvent VF Volume in the feed VR Volume in the retentate w/v Weight of solute per volume of solvent w/w Weight of solute per weight of solvent WFO Waste frying oil XOS Xylooligosaccharides α Dissociation degree of a weak acid λ Wavelength

1
Chapter 1 - Introduction
1.1 – Overview History clearly shows that humans trough the study of biological systems, have used
biotechnology processes to generate food products over thousands of years, such as bread, yogurt,
beer, wine, sour cream, sauerkraut, among others [1–3]. Even nowadays, industrially useful enzymes
and living cells such as “bakers” and “brewers” yeast are important commercial products [1].
Biotechnology has also contributed to produce energy from renewable sources (i.e.: bioethanol or
biodiesel), but further development of sustainable processes still faces several challenges that need to
be tackled through technological development during this century [4–6]. Adding to that, nowadays there
is an increasing interest in the production of “clean” renewable energies and chemicals supporting a
sustainable economy. In fact, the European Union (EU) invest approximately €50 billion annually
(around 34 % of the total EU budget) to reach a more sustainable economy. Then, the use of bio-based
strategies may contribute to this desired long-term sustainability, either in environmental, economic and
social aspects [7].
Among the chemicals that society consumes, there are surfactants. They are widely used in the
production of household and industrial cleaners, plastics, paints and coatings, just to mention some
examples. Nonetheless, these compounds are usually synthesized chemically from oil [8]. Then,
microbial biosurfactants come up as a promising substitute to those synthetic surfactants. They are
relatively nontoxic and have a higher biodegradability.
Microbial surfactants are surface-active agents, as food emulsifiers are, produced by living cells
from renewable sources. Examples are many;; for instance rhamnolipids, sophorolipids, and
mannosylerythritol Lipids (MEL). In 2013, Europe consumed about 31% of global biosurfactant
production. The global microbial surfactants market was worth nearly USD$12.7 million in 2012 with
forecasts expecting to worth USD$17.1 million by 2020.
One biosurfactant that has raised interest are the MEL, a biological product studied in this project.
Adding to that, researchers have demonstrated their innumerable applications on different fields.
Nonetheless, intensive MEL production has been limited due to their high production costs, either
because of costly raw materials or of inefficient downstream processing.
1.2 – Objectives and challenges The global aim of this project was to study and propose improvements to the bioprocess towards
MEL production using Pseudozyma antarctica as biological catalyst to carry out this bioconversion. As
described in the literature, the sustainable biological production of MEL faces different challenges. First,
it is produced more frequently from edible vegetable oils, namely soybean oil (SBO) [8, 9], which
compete their use as a feedstock. Secondly, downstream processing becomes compelling and costly
since oils are not consumed completely and separating MEL from fermentation medium becomes a hard
task due to the fact that both oils and MEL have similar solubility properties [9, 10].
As an attempt to decrease downstream processing costs, the use of hydrophilic substrates has
been suggested. Among these alternative substrates are glucose, glycerol, and lignocellulosic
substrates [9, 11]. However, low MEL yields and titres from these substrates compare to the use of oils
are drawbacks in the implementation of a bioprocess at a larger scale. In the case of lignocellulosic

2
substrates, the bioconversion is not straightforward and faces other challenges, like the efficient use of
pentose sugars and the presence of toxic compounds generated during biomass pre-treatment [11–14].
The concept developed in this thesis is based on the three main stages of MEL production following
the usual stages of a bioprocess:
1. Substrate sustainability. Biological oils (including used oils) and lignocellulosic substrates were
assessed as carbon sources for MEL production towards a more sustainable biotechnological
process.
2. Upstream processing. . Acknowledging the inhibitory effect of hemicellulosic hydrolysates on
biological catalysts (e.g. yeasts), a novel upstream detoxification technique was developed
using nanofiltration technology.
3. Downstream processing. There is evidence that techniques used until now to isolate MEL
Acknowledging that liquid-liquid extraction with organic solvents used in MEL recovery from
fermentation broth are not efficient and have a high impact on the environment. Such
approaches were quantitatively assessed in this thesis and alternative strategies are proposed.
Based on these stages, the experimental strategy was designed to uncover the possible
answers to the research questions.
1.3 – Research questions This thesis intends to address the following queries:
• Which carbon source provides higher MEL titre, yield and productivity, considering the different
stages of the bioprocesses: lignocellulosic substrates or biological oils?
• In the case of biological oils, which one can be used to provide a more sustainable
bioconversion process and downstream processing?
• What is the impact of the potential inhibitory compounds found in hemicellulosic hydrolysates
on Pseudozyma antarctica and MEL production?
• Is Nanofiltration (NF) an efficient process to remove inhibitory compounds from hemicellulosic
hydrolysates and what are the best operational conditions for this purpose?
• Which are the advantages and/or disadvantages of using biological oils or lignocellulosic
substrates for MEL production?
1.4 – Research strategy
• To achieve the objectives exposed and address the research questions, the following
approaches were employed in the current thesis:
• Microorganism: Pseudozyma antarctica strain was employed in all experiments as it was
identified as the best MEL producer from xylose and pentoses [11].
• Substrates as carbon sources:
i. The yeast was first characterized for its MEL production capacity using oils and glucose
as carbon sources. Selected oils were soybean oil, rapeseed oil, poultry oil and waste
frying oils, and the effect of source, composition and sustainability impact was evaluated.
Biological oil characterization and sustainable assessment were performed through
existing collaborations.

3
ii. Hydrothermally pre-treated wheat straw was chosen to assess the use of a
lignocellulosic substrate. Wheat is the third most produced cereal worldwide after maize
and rice with a world production of nearly 716 million ton in 2013 [15]. According to
statistics, annual straw yield is over 2.9 billion tons worldwide [12], representing one of
the most abundant lignocellulosic material. Hydrothermal pretreatment generates a
cellulosic-rich solid fraction and a liquid fraction designated as hemicellulosic
hydrolysate, which contains potential yeast inhibitory compounds. Previous studies have
establish strategies to produce MEL from the solid fraction[16].
• Developing a detoxification process for the hemicellulosic hydrolysate based on NF
technologies:
i. First, the right membrane was selected from the existing commercially available NF
membranes, in other to effectively separate the small inhibitory compounds, expect to
permeate through the selected membrane, from the larger sugars and oligosaccharides,
expected to be retained by the membrane. To achieve this aim, the rejection profile and
molecular weight cut-off (MWCO) of several membranes was estimated using standards
of compounds of different molecular weights, usually found in hemicellulosic
hydrolysates:_cellobiose, glucose, xylose, formic acid, acetic acid and furfural.
Moreover, the effect of operation conditions, such as pressure and pH (considering pKa
of acidic species) was assessed. Experiments were performed in a dead end stir cell
allowing operations at small volumes.
ii. Detoxification of the liquid fraction resulting from the hydrothermally pre-treated wheat
straw were plan using the rejection data collected and a mathematical model to calculate
the level of detoxification achieved by diafiltration. Experimental diafiltration was then
performed after selecting the membrane with a low rejection to toxic compounds and
high rejection to saccharides present in the liquid fraction. Furthermore, some
operational details were defined in this stage since this operation was performed not
only in a dead-end stirrer cell, but also in in tangential flux for process scale-up.

4
Chapter 2 – Theoretical background and State-of-the-art
2.1 - Biosurfactants
2.1.1 – Characteristics The term surfactant refers to those compounds that are able to reduce surface and interfacial
tension [8, 9, 17]. They tend to adsorb at interfaces and forms tightly packed structures: monolayers at
the air–water and the oil–water interface, and monolayers and aggregates at the solid–water interface
[18]. There are five different interfaces described in Table 1. However, surfactants have higher
importance where one liquid phase is in the system. Although these compounds have variable
composition, they have in common their amphiphilic or amphipathic nature conferred by different
chemical groups within the same molecule. This chemical groups makes them soluble either in aqueous
or in organic solvents. Furthermore these characteristics makes surfactants useful to decrease surface
tensions, increase solubility, their detergency power, wetting ability, and foaming capacity [8, 9].
Table 1 Description of the five different interfaces and applied examples [17, 19, 20].
Interface Type of system Product examples
Solid – liquid Suspension, sol, slurry Solvent-borne paints, colloidal silica, cement slurries.
Liquid – liquid Emulsion Bitumen emulsions, milk, cream Liquid – vapour Foam, aerosol Shaving cream, fire fighting foams, clouds Solid – vapour Gas adsorbents Silica gel, activated charcoals, alumina, zeolites
Solid – solid Metal – metal interfaces Ceramic – metal interfaces
Contacts for electronic circuits, anti-corrosion protection coating, multilayered magnetic devices.
Figure 1
Surfactants demand in each industrial sector in 2008 [8]
To illustrate the wide range of surfactants’ applications can be mentioned the production of

5
household and industrial cleaners, plastics, paints and coatings, among others (see
Figure 1) [8, 9, 21]. Surfactant market size can be seen in section 2.1.2 – Surfactants Market. It is
important to highlight that synthetic surfactants are synthesized chemically from oil (petroleum based)
[8]. In consequence, additional pressure has put on already depleting stocks of petroleum products.
Moreover, environmental safety concerns have arisen since extensive use of surfactants has
been made over the last decades. In addition to that human health effects have called attention of
regulators (see Table 2). In fact, surfactants and detergents industries have been under intensive
environmental scrutiny since the 1960s al over the world. In the case of the European Union (EU), in
2006 was created the most complex and strictest legislation to date regulating chemical substances,
including surfactants: Registration, Evaluation, Authorization and Restriction of Chemicals (REACH).
Table 2 Environmental and health concerns due to extensive use of surfactants [8, 17, 22]
Safety concern Effects and damages Aquatic toxicity Toxic to aquatic organisms even at low concentrations. Poor biodegradability Poor degradation of surfactants either in aerobic conditions and/or in
anaerobic conditions turning them persistent. Branched chain fatty acids cannot be degraded by majority of microbes
Bioaccumulation Very lipophilic amphiphiles, such as fluorinated surfactants, accumulate in lipid compartments in organisms and break down very slowly The initial degradation may lead to intermediates with very limited water solubility, such as ethoxylates. In consequence, biodegradation will occur at low rates and tend to accumulate in adipose tissues.
Dermatological aspects Skin and eyes irritation, allergic reactions.
As a result of these ecological and health issues, recently extensive research is being carried
out to obtain safer surface-active molecules by biotechnological processes to avoid the depletion of
petrochemical sources [8, 9, 23].
The term biosurfactant refers to different biodegradable surface active compounds produced by living cells [9, 24]. Biodegradability relates with the materials property of their structure being break down to innocuous molecules under natural conditions [24]. This is a key characteristic of biosurfactants
that makes different from nonbiodegradable surfactants. The three principal categories of biosurfactants
can be classified according with backbones structure as lipids, carbohydrates, or proteins coming from
renewable resources [9, 24, 25].
Some authors make a special distinction to the chemically synthesized surfactants from renewable sources which are those produced from non-petroleum based raw materials, such as plants and animal fats [24]. Despite claims that consider them as biosurfactants, in this thesis those are not
considered biosurfactant. In here, when is used the term biosurfactant, this will refer to microbial
biosurfactants produced by bacteria, yeast, or fungi.
Different chemical structures of microbial biosurfactants are produced by different
microorganisms and they play different roles during the life cycle of them (Figure 3). Some authors have
suggested that these biosurfactants allow adhesion of microorganisms to hydrophobic surfaces,
increase the bioavailability of insoluble nutrients, are essential for the motility (swarming and gliding),
quorum sensing, and often display antimicrobial activity [11, 26, 27]. Therefore, these characteristics
may give to these organisms an advantageous competition during colonization.

6
The structures that can be found among biosurfactants are, for instance, glycolypids,
lipopeptides, fatty acids and neutral lipids, siderophore-lipids, and polymeric (Table 3). Their chemical
structures are complex and chemically synthetize these molecules will be extremely challenging (Figure
3). Moreover, biosurfactants seem to display important biological activities, including antibiotic,
antifungal, insecticidal, antiviral, immunomodulator, and antitumoral activities [9]. These activities are
the basis for growing interest in a number of specialty applications such as pesticides in agriculture,
cancer treatment and wound healing [9, 28].
Figure 2 Construction and screening of metagenomic libraries from different ecosystems A and B addressed to find out novel biosurfactant-producing microorganisms [29].
Rhamnolipids and surfactin are the biosurfactants that have been studied in greater detail [9].
The former is produced by Pseudomonas aeruginosa [30] and different Burkholderia species [31]. The
latter is a lipopeptide synthesized by Bacillus subtilis [23].
Regarding the natural environment where biosurfactant producers are located, there are few
reports that have addressed the frequency and distribution of these microorganisms. These studies
suggest that only a small fraction of the microbial community is capable to synthesize biosurfactants
unless a selective pressure exists [9];; for example the presence of xenotoxics. However these
screenings have been done biased to the presence of one genus or to culturable strains. One option to
overcome this is through a wide-genome approach, for instance, functional metagenomics [29, 32].
Metagenomics involves the genomic analysis of unculturable microorganisms by direct extraction and

7
subsequent cloning of DNA from an assemblage of microorganisms from a particular environment (see
Figure 2) [33]. The metagenomic analysis initially use PCR amplification to increase the sensitivity of
the method [34]. The most preferred target gene is the 16S rRNA gene because it comprises both
variable and conserved regions [34]. This permits the use of primers to conserved regions and more
specific primers to amplify 16S rRNA genes from any source to discriminate between strains [34].
However, to delete PCR biases, PCR can be ruled out of this analysis [29]. Gonzalez, et. al.
demonstrated that the structure of microbial communities from PCR-based surveys is clearly biased
against low abundant taxa which are required to decipher the complete extent of microbial diversity in
nature [35]. That's why this tool is helpful to find out operons or genes encoding pathways that are
responsible of biosurfactant synthesis [29].
There are high throughput (HTP) screening methods which could be used to detect
biosurfactant producing microorganisms from metagenomic libraries [36]. Morikawa, et. al. [37]
described a method to isolate surfactin producers based in an agar plate overlay approach using oil-
coated agar plates. Biosurfactant producers were identified by the appearance of an emulsified halo
around growing colonies. Burch, et. al [38] developed an HTP screening method called the atomized oil
assay, where a fine mist of oil droplets is applied to the surface of agar plates by an airbrush.
Biosurfactant production can be observed as halos around biosurfactant-producing colonies
(metagenomic clones).
2.1.2 – Surfactants Market In general, the surfactants industry is complex because of factors such as the fact that there are
more than 500 suppliers around the world;; more than 3,500 different compounds;; a wide range of
functions, markets, and customers [21]. Surfactants market worth USD$30 390 million and produced
near 17 200 kTon in 2014 [39].
The most relevant surfactant-consuming geographic region is Europe (see Figure 4) The
highest consumption growth rates are expected for China and Africa. Growth rates in other regions vary
from low (Japan) to above-average (Latin America and the Middle East). Poor growth in Japan and
Western Europe is a reflection of stagnant economies, low population growth (–0.2% and 0.3% per year,
Figure 3 Selected chemical structures of some biosurfactants (adapted) [8, 9]
Emulsan

8
respectively, during the forecast period), and to some extent a lower surfactant concentration in a wide
range of products;; such as softeners, detergents, and other washing and cleaning products. This is
attributed to either for cost reasons or as a consequence of the improved efficiency of the washing
systems [21].
Key opportunities for use of biosurfactants can be envisaged in food processing applications,
industrial cleaners, and personal care products (see Figure 5). Since, such applications have high
growth rates and lower penetration comparing to household detergents, household detergents most
probably will lead (bio)surfactant sales [40].
Nevertheless, an increase in volume in the major world areas is expected to average only 2.6%
annually between 2012 and 2017. Regarding exportations of these chemicals, North America, Western
Europe, and Japan are the leaders in this field (see Figure 6) [21, 41].
The global biosurfactants market accounted 344 kTon in 2013 and is expected to reach 462
kTon by 2020, an increase around 34 % [40]. Moreover, the global microbial biosurfactants market was
worth nearly USD$12.7 million in 2012. It is foreseen a CAGR of 4% between 2014 and 2020.
Furthermore, this market is expected to reach USD$17.1 million by 2020 [42].
Despite good claims that support biosurfactants production, there are some reasons that explain
why these chemicals haven’t been used extensively. First, it is not expected that "Green surfactants"
make an important change in the consumption patterns in a short term. Nowadays, products focus more
in consumer value than the benefits of product sustainability [21]. Furthermore it is not well understood
how far green product labelling could change clients’ behaviour [21]. In addition to these factors, cost
competitiveness with respect to conventional surfactants remains a major restraint for biosurfactants
expansion [40].
Figure 4 Consumption of Surfactants by Major Region (adapted) in 2013 [21]

9
Table 3 Examples of the more common biosurfactants and their origin [8, 9, 43]
Head group Biosurfactant Microorganisms Fatty acids Neutral lipids
Corynomycolic acids Corynebacterium lepus Neutral lipids N. erythropolis
Phospholipids Phosphatidylethanolamine Rhodococcus sp., Acinetobacter sp. Phospholipids Thiobacillus thiooxidans
Lipopeptides Lipoproteins
Surfactin Bacillus subtilis;; Bacillus pumilus A Viscosin Pseudomonas fluorescens, P. libanensis Serrawettin Serratia marcescens Lichenysin B. licheniformis Iturin Bacillus subtilis Fengycin Bacillus subtilis
Glycolipids
Mannosylerythritol lipids (MEL)
Genus Pseudozyma (yeast) Candida antartica, Ustilago maydis
Sophorolipids C. batistae, T. bombicola C. lypolytica, C. bombicola T.apicola, T.petrophilum, C. bogoriensis
Rhamnolipids Pseudomonas sp., P. aeruginosa Trehaloselipids Rhodococcus sp., Arthrobacter sp., R.
erythropolis, N. erythropolis, Mycobacteria Cellobiolipids Ustilago zeae, Ustilago maydis,
Pseudozyma flocculosa
Polymeric
Emulsan Acinetobacter calcoaceticus Biodispersan A. calcoaceticus Mannan–lipid–protein C. tropicalis Alasan A. radioresistens Liposan C. lypolytica
Siderophore-lipids Flavolipids Flavobacterium sp.
Figure 5
Key opportunities in surfactants market [40].
It is predicted that the global market for all types of biosurfactants would top USD$2,308.8 million
by 2020. In addition to that, more stringent regulatory policies are further expected since demand is
going to grow in the next years. As occurs with synthetic surfactants, Europe was the largest regional
market for biosurfactants in 2013 (178.9 kTon consumed) driven by consumer awareness regarding

10
benefits of bio-based products [40]. Nevertheless, Asia Pacific region is expected to increase its share
between 2014 and 2020. This is owed to the presence of large manufacturing facilities [40].
In 2013, household detergent was the segment that extensively consumed 153.5 kTon of
biosurfactants. Therefore, growing demand for biosurfactants in cleaning products is anticipated to boost
the demand for biosurfactants from 2014 to 2020 [40]. However, not only is expected the growing
demand of biosurfactants for cleaning applications, but also for personal care applications, which are
expected to gain higher market share mainly in Asia Pacific region in the same period [40]. The demand
for biosurfactants in personal care is expected to reach 50.7 kTon by 2020 growing at a rate of 4.5 %
on annual basis between 2014 and 2020 [40].
Figure 6
World Supplies of Exported Organic Surface-Active Agents in 2013 [41]
2.1.3 – Industrial Perspectives
A reason for Europe to be the largest consumer of surfactants is that detergents in Western
Europe tends to have higher concentrations of these components in their formulas than in Latin America
and Asia [21]. Although industrialized countries lead exportations (as referred on section 2.1.2 –
Surfactants Market), new productions facilities are being built in emerging or import-oriented regions.
Concurrently, China and India are net exporters when few years ago they were import-oriented [21].
Additionally the Middle East is becoming more important as raw materials supplier for surfactant
production [21]. This is because it is one of the largest oil exploiters, essential for obtaining
petrochemicals. Therefore, additional investment on this region is expected in near future.
Despite the fact that most of world’s surfactants market is focused on synthetic ones, there is
an increasing interest in microbial biosurfactants [9, 26]. The first reason is due to their environmental
“friendly” status since they are nontoxic and biodegradable [26]. Secondly, biosurfactant have unique

11
structures that are just starting to be appreciated for their potential applications to many different facets
of industry, ranging from biotechnology to environmental clean-up [9].
Although, Rhamnolipids was a relatively small market in 2013, is expected to boost due to
improvements on biotech processing [40]. Low glycerol (rhamnolipids feedstock) prices are expected in
the next years due to an oversupply of glycerol, mainly due to an increasing biodiesel production [44].
In addition to that, until now there has been registered 42 patents related to rhamnolipids [44]. Where
the patent US 20140148588 A1 attributed to Evonik Industries AG in 2014 provides a new isolating
procedure that requires lower amount of solvent and decreased operation times. According to the patent
claims, this procedure could achieve 10-fold concentration with a purification factor of 1.6 for an overall
95% yield [45].
2.1.4 – Production
Since they are products obtained from microorganisms, many researchers have been using a
wide range of carbon sources, such as pyruvate, alkanes, simple sugars, succinate, citrate, glycerol,
mannitol, n - paraffin, and hexadecane supplemented with different nitrogen sources (either organic and
inorganic salts) [8, 9, 46]. The feasibility to use specific substrates for biosurfactant production depends
on strain and pursued biosurfactant.
Most of the information available shows that biosurfactant production has mainly tried only at
lab scale [9]. As other bio-products, downstream processing uses common unit operations (UO) well
implemented on other bio-products (see section 2.2.1 – Principles). Regarding substrate, researchers
have mostly used a variety of vegetable oils from canola, corn, sunflower, safflower, olive, rapeseed,
grape seed, palm, coconut, and soybean oil (SBO). The use of these substrates as carbon source have
resulted in higher yields [9, 46–48]. Also it is important to consider that the world production of oils and
fats is about 2.5-3 millions tons, 75% of which are derived from plants and oil seeds [46]. Though they
have higher yields, the use of this feedstock competes with substrates that are used for human and
animal feeding.
Although it is true that biosurfactants have promising applications, there are some challenges
that need to be overcome. The first limitation, with higher impact, on the commercial use of
biosurfactants is the complexity and high cost of their production. Consequently, the implementation on
a large scale has been limited. Nevertheless, the only available commercial microbial biosurfactants are
rhamnolipids and surfactin;; and more recently MEL. A detailed list of biosurfactant producing companies
can be consulted in Table 4.It is important to mention that only rhamnolipids have been approved in the
USA for use in food products, cosmetics and pharmaceuticals [9], this has pushed companies to produce
it. Nonetheless the leading biosurfactant produced nowadays is a non-microbial one: Methyl Ester
Ketone (MES). It is a compound derived from palm and coconut oil that was widely consumed worldwide
accounting 33 % of the biosurfactants market in 2013 [40]. Actually, according to some market studies,
the biosurfactants market worldwide is concentrated in five companies, which serve over 80% of global
demand. Major players in the market are: BASF Cognis, Ecover, Urumqui Unite, Saraya and MG Intobio
[40, 49]. Being BASF Cognis the largest manufacturer of biosurfactants in 2013 with a market share of
over 20% [40]. Therefore, biosurfactant market is greatly concentrated in comparison to synthetic
surfactant market (see section 2.1.2 – Surfactants Market).
12
2.1.5 – New generation of biosurfactants Biosurfactants’ economic competitiveness is negatively affected by their higher production costs.
Moreover, most of the biodegradable substrates assessed until now for biosurfactant production are
also used for food production (see section 2.1.4 – Production).
The first approach addressed to reduce production costs involves the assessment of the
substrate and product output [46, 50]. This includes the appropriate organism selection, nutritional
balance and the use of cheap substrates. It is estimated that raw materials can account for 10-30% of
the final product cost [46, 50]. Then, using abundant and cheaper raw materials with negligible or no
value may reduce production costs. The synthesis of biosurfactants usually requires a hydrophobic and
hydrophilic carbon source in the cultivation medium. Production of biosurfactants in the medium
supplemented or based on the waste products could render the process economically and
environmentally attractive without concerns about food security [51]. Adding to that, legal guidelines and
constitutional directives promoted in developed countries. In the EU the Waste Framework Directive
(2008/98/EC) sets the basic waste management concepts in the 28 State Members. This directive seeks
to reduce waste generation and promote waste recovery, encourage reuse, recycling and energy
recovery from waste. The counterpart in the USA is the Resource Conservation and Recovery Act
(RCRA) with similar objectives.
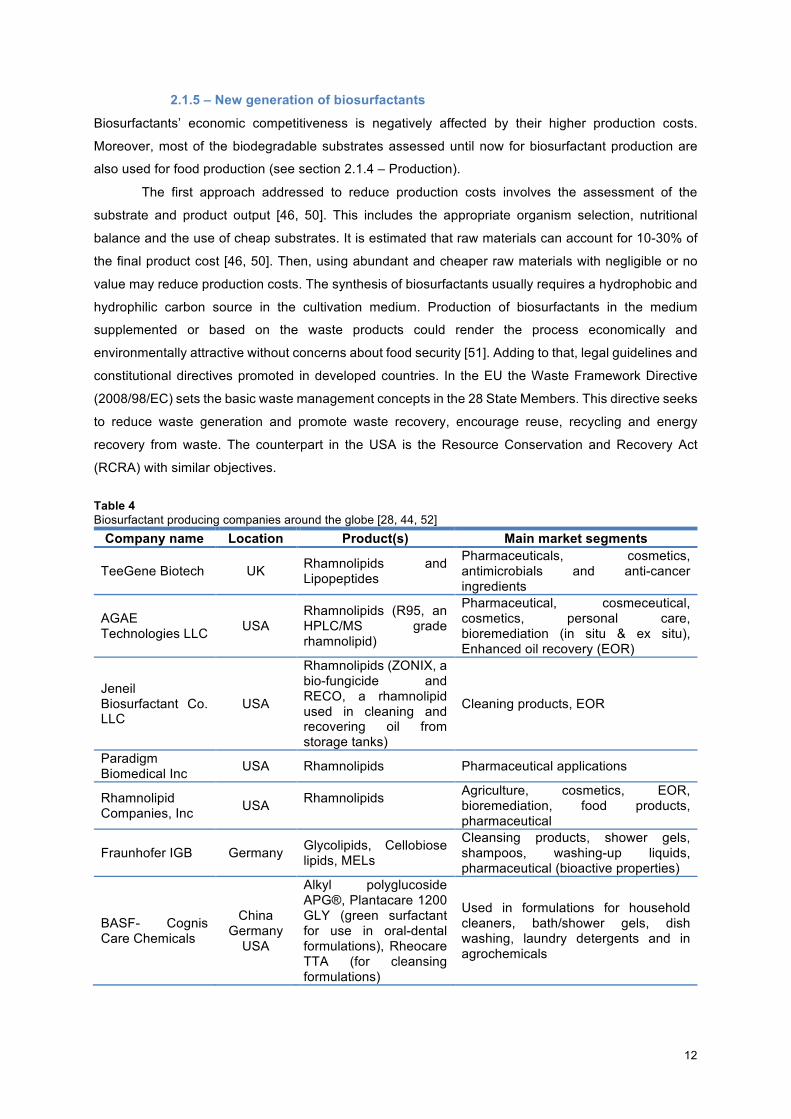
Table 4 Biosurfactant producing companies around the globe [28, 44, 52] Company name Location Product(s) Main market segments
TeeGene Biotech UK Rhamnolipids and Lipopeptides
Pharmaceuticals, cosmetics, antimicrobials and anti-cancer ingredients
AGAE Technologies LLC USA
Rhamnolipids (R95, an HPLC/MS grade rhamnolipid)
Pharmaceutical, cosmeceutical, cosmetics, personal care, bioremediation (in situ & ex situ), Enhanced oil recovery (EOR)
Jeneil Biosurfactant Co. LLC
USA
Rhamnolipids (ZONIX, a bio-fungicide and RECO, a rhamnolipid used in cleaning and recovering oil from storage tanks)
Cleaning products, EOR
Paradigm Biomedical Inc USA Rhamnolipids Pharmaceutical applications
Rhamnolipid Companies, Inc USA Rhamnolipids
Agriculture, cosmetics, EOR, bioremediation, food products, pharmaceutical
Fraunhofer IGB Germany Glycolipids, Cellobiose lipids, MELs
Cleansing products, shower gels, shampoos, washing-up liquids, pharmaceutical (bioactive properties)
BASF- Cognis Care Chemicals
China Germany USA
Alkyl polyglucoside APG®, Plantacare 1200 GLY (green surfactant for use in oral-dental formulations), Rheocare TTA (for cleansing formulations)
Used in formulations for household cleaners, bath/shower gels, dish washing, laundry detergents and in agrochemicals

13
(Cont…)
Company name Location Product(s) Main market segments
Saraya Co. Ltd. Japan Sophorolipids (Sophoron, a low-foam dishwasher detergent)
Cleaning products, hygiene products
Ecover Belgium Belgium Sophorolipids Cleaning products, cosmetics, bioremediation, pest control, pharmaceuticals
Groupe Soliance France Sophorolipids Cosmetics
MG Intobio Co. Ltd.
South Korea
Sophorolipids (Sopholine—functional soap with Sophorolipids secreted by yeasts)
Beauty and personal care, bath supplies e.g., soaps with new functions
Synthezyme LLC USA Sophorolipids Cleaning products, cosmetics, food products, fungicides, crude oil emulsification
Allied Carbon Solutions (ACS) Ltd
Japan
Sophorolipids (ACS-Sophor—first bio-based surfactant from Indian mahua oil)
Agricultural products, ecological research
Henkel Germany Sophorolipids, Rhamnolipids, Mammoslyerthritol lipids
Glass cleaning products, laundry, beauty products
Lion Corporation Japan Methyl ester sulfonates (MES)
Detergents formulations, cleaning products
Lipo Chemicals USA Lipomulse Luxe (high-temperature resistance emulsifier)
Skin care, sun-lotions hair care formulations, thickening polymers, rheological modifiers, natural gums
Sigma-Aldrich GmbH Germany Surfactin (98% purity)
Scientific research purposes (flux across lipid bilayer membranes, antitumor activity, antiviral activity and antibiotic activity).
Kaneka Co. Japan Sophorose lipids Cosmetics and toiletry products
Although there are many wastes that might be used as substrates, the central problem of this
approach is the correct selection of waste materials that have the right nutrient balance that allow cell
growth and production of biosurfactants with the correct chemical and physical properties [46]. These
inexpensive agro-industrial waste substrates include olive oil mill effluent (OOME), plant oil waste,
distillery and whey wastes, potato process effluent, and cassava wastewater, among others (Table 5)
[46, 53, 54].
Other substrates that have become attractive for economical biosurfactant production are
lignocellulosic materials. Moreover, the use of non-edible cheap plant biomass could be one solution to
decrease dependence on fossil fuels for transportation, avoid using food products and to replace the
use of petrochemicals [55, 56]. Hence the consumption of lignocellulosic sources, some authors denoted
to as second generation feedstock [55], is strongly supported. In Table 5 are listed some renewable or waste products that has been used towards biosurfactants production.
The second approach involves the development of efficient bioprocesses, including
improvements of culture conditions and cost-effective management of downstream processing [36, 50,
57]. This is because today biosurfactant purity depends on several complex extraction and isolation
steps (see section 3.4 – Downstream processing) [46, 58]. Hence, if simple substrates were used, with

14
chemical–physical properties that facilitate biosurfactant downstream isolation, they would give
significant economic advantages. According to this approach, it would mean that the consumption of
agro-based substrates has the potential to represents a positive attempt towards achieving that goal
[46].
Table 5 Waste materials that have been used as feedstock for biosurfactant synthesis.
Industrial sector
Substrate Description
Vegetable oil industries
Plant oil extracts and waste like: • OOME [59] • Peanut oil cake [60] • Groundnut oil refinery residue [61–63] • Soy bean oil refinery residue [64]
Wastewater and other derived wastes with high organic and fat content. They may contain harmful chemicals that may be toxic for living organisms.
Soap stock [65–70] The main co-product during the oil neutralization process from the seed-oil refining industry. Contains a high content of fats, oils and nutrients.
Soy molasses [71, 72] Byproduct of soybean oil processing which contains high fermentable carbohydrate (30% w/v) and is about 60% of solids carbohydrate
Glycerol [68, 73–75] Byproduct obtained during trans esterification of vegetable oils and animal fats and animal fats.
Biodiesel production Glycerol [73, 74, 76] Byproduct generated during trans esterification. It will
increase as biodiesel production is growing.
Other agro-industrial wastes
Potatoes peels and other solid potatoes waste [70, 77, 78]
Starch rich material that could be suitable for microbial growth.
Potato process effluent [77, 79–81] Cassava wastewater [82–85]
Wastewater rich in starch material, metallic ions, nitrogen and others that make nutritional supplementation unnecessary
Distilled grape marc [86–88]
Grape marc is produced after pressing the crushing grapes during wine making. This material contains a huge amount of hemicelluloses and organic acids
Vine-shoot trimmings [89]
Abundant by product from wine industry that consists of complex lignocellulosic material.
Orange fruit peeling [90] Byproduct of orange juice industry.
Date molasses [91] Accidental byproduct from Date palm (Phoenix dactylifera L.) in the storage of bagged humid dates.
Soy bean curd residue (Okara) [92, 93]
Residue left from ground soy beans after extraction of the water extractable fraction used to produce soy milk and tofu
Brewery spent grain [70]
Major by-product of the brewing industry. It is a lignocellulosic material containing about 17% cellulose, 28% non-cellulosic polysaccharides, chiefly arabinoxylans, and 28% lignin [94].
Cashew apples [95, 96] Substrate rich in reducing sugar, vitamins and minerals salts.
Food industry
Waste Frying oils (WFO) from industrial production and restaurants [82, 97–103]
Nutrient rich substrates produce in large quantities worldwide. It has been estimated that on average100 billion L oil waste/week is produced only in United States.
Animal fats [104] Fish oil [68, 105]
Fats and oils obtained from meat, poultry and fishery processing that most of the times are not reused.

15
(Cont…)
Industrial sector Substrate Description
Dairy and Sugar industry
Whey wastes [51, 70, 106–111]
Liquid by-product of cheese production, constituted mainly by lactose (75% of dry matter) and other organic water-soluble components (12-14% protein). Only 50% of the cheese whey produced annually is recycled into useful products such as food ingredients and animal feed and the rest is regarded as a waste.
Cane molasses [75, 106, 111–116]
Co-product of sugar production, both from sugar cane and sugar beet industry as runoff syrup from the final crystallization steps. It contains sugars (sucrose 48-56%), non-sugar organic matter (9-12%), proteins, inorganic components and vitamins.
Automotive industry
Motor lubricant oil [60]
Lubricating oil that results from the extensive use of cars. Tough it can be cleaned and reused.
Distillery wastes Spent wash [107, 108, 117]
Waste generated in high amounts from alcohol distilleries. It is expected to increase since there is a growing demand of alcohol and bioethanol.
Another interesting approach is the co-production of biosurfactants and other important
metabolites, such as polyhydroxyalkanotes (PHA), lactic acid and other metabolites [46, 82, 118–120].
For instance, Füchtenbusch, et. al.[45] attempted the co-production of PHA using the remaining oil from
rhamnolipids production by Ralstonia eutropha H16 and Pseudomonas oleovorans. Hori, et. al. [119]
achieved the simultaneous production of PHAs and rhamnolipids using decanoate as carbon source
with Pseudomonas aeruginosa IFO3924. Then Costa, et. al. [82] improved rhamnolipids production
using cassava waste with frying oil as substrate with different Pseudomonas aeruginosa strains.
Ramnani, et. al. [120] showed the concomitant production of protease and biosurfactant using corn-
starch and soy flour as carbon an nitrogen sources respectively using Bacillus licheniformis RG1.
The last approach recommends considering the possibility to use recombinant technologies to
get mutant hyper-producer microbial strains [44, 46, 50, 54, 121]. Besides the natural biosurfactant
producer strains, a few mutant and recombinant strains with enhanced biosurfactant synthesis are cited
in the literature. For instance, Sekhon, et. al. [121] observed a twofold increase in the biosurfactant and
esterase activities after the successful cloning into E. coli the B. subtilis SK320 genes. After doing
multiple sequences alignment, the researchers were able to identify similar and conserved regions
between biosurfactant and esterase genes. Thus, confirming the symbiotic correlation between both
gene sequences. However, no more attempts have been done until now.
2.2 – Process Intensification
2.2.1 – Principles A bioprocess is any process that uses complete living cells (microbial, animal and plant cells)
or their components (e.g. enzymes, chloroplasts, secondary metabolites, etc.) to obtain desired
products. Bioprocess engineering, which is considered a subset of process engineering, deals with the design and development of equipment and processes for the production of bio-products such as
food, feed, pharmaceuticals, nutraceuticals, chemicals, polymers and paper from biological materials [1,
2].
History clearly shows that humans manipulated microorganism to obtain biological products

16
from thousands of years ago, such as bread, yogurt, beer, wine, sour cream, sauerkraut, among others
[1–3]. Even nowadays industrially useful enzymes and living cells such as “bakers” and “brewers” yeast
are important commercial products [1]. However, in recent years the developments in genomics and
stem cell engineering have increased attention of whole society in recent years.
The findings in gene manipulation opened the way to genomics era, which began in 1995 with
the complete sequencing of a bacterial genome (Haemophilus influenzae) [122, 123]. After that, over
60700 genomes have been sequenced including the Homo sapiens genome in 2001 [123, 124]. Along
with the development of sophisticated, high-throughput sequencing technologies, genomics has
established the basis of modern biology [122]. Furthermore, genomics helped to increase our
understanding of the basis of diseases, providing new tools for disease diagnosis, and might open the
way to the development of new drugs and treatments [123]. In the case of stem cells, is envisioned to
become the next medical revolution because it could bring to reality new treatments such as cell therapy,
immune modulation, secretion of trophic factors, drug delivery, and organ replacement [125].
Taking modern biotechnology to industrial production requires the assessment at lab scale to
design a process. It is important to consider that biological systems are complex and difficult to control;;
nevertheless they obey the same laws of chemistry and physics [2].
Table 6
Most common UO used in biological processes [126]
Downstream stage and objectives UO Primary isolation Aim: to remove solids, to reduce volume and to release target product
Filtration Cell disruption or cell lysis
Centrifugation Microfiltration
Intermediate purification Aim: to remove impurities and to reduce volume
Liquid – liquid extraction Precipitation by acids, salts or solvents
Foam fractionation Ultrafiltration Diafiltration Adsorption
Final purification Aim: to remove remaining impurities and liquids
Lyophilisation Crystallization Drying Chromatography
The manufacturing of biological products normally involves 5 main steps: 1) raw material
reception, 2) Upstream processing, 3) Bioconversion or biotransformation processes, 4) Downstream
processing, and 5) Fill and finish [126, 127]. During upstream processing, sometimes called pre-
fermentation stage, is prepared the culture medium. In addition to that, both culture medium and working
equipment are sterilized and the inoculum is prepared. The biotransformation step involves the
fermentation or synthesis of the target product. Then downstream processing implies to perform the
primary isolation, intermediate purification and final purification to obtain the bulk product until the pre-
specified purity/biological activity is met [127]. The selection of operations to be performed depends on
the type of product and desired purity [126].
The most common unit operations (UO) performed during the downstream of biological
processes are summarized in Table 6. There is no standard procedure with specific steps adequate to
be used on purification of all the biological products. In fact, each separation and purification step should
be optimized for the target product [126]. The cost of downstream processes is incorporated in the sale

17
price and in many cases represents a substantial part of it. This is the case of microbial biosurfactants
(70 – 80 % of production costs) [44] or therapeutic proteins (60 – 80 % of price) [126].
2.2.2 – Process design trends: Process intensification (PI)
Engineers are working on innovative equipment and techniques that potentially could improve
chemical or biological plants and lead to smaller, safe, and sustainable processes [128]. Recently
engineers have focus on Process intensification (PI), which was defined as “…engineering development
that leads to a substantially smaller, cleaner, safer and more energy efficient technology is process
intensification” Moreover, PI has emerged as a study subject of process engineering and biotechnology
[129–131].
The advantages of implementing PI in any manufacturing process are: capital cost reduction,
as less equipment is used to attain the same targeted;; building safer plants since PI search for reduction
plant volumes and sizes which leads to decreases in toxic and dangerous substances inventories;;
building environment friendly plants, since less emission effluents would be produced as consequence
of volume diminution and performance improvement;; improvement of energy efficiency, because PI is
aimed to dramatically increase the intensity of the fluid dynamic environment, so as to hasten the heat
transfer, mass and momentum within a process or operation [129].
This subject generally can be divided into two main areas [128]:
• Process-intensifying equipment. It denotes to new reactors and intensive mixing, heat-
transfer and mass-transfer devices.
• Process-intensifying methods. Refers to the integration of reaction and separation, heat
exchange, or phase transition in a multifunctional reactor. Also to novel or combined
separations techniques, processes using alternative energy sources (i.e. light,
ultrasound, etc.), and new process-control methods.
The application of process intensification in biotechnology is therefore seemingly catching up
with the trend already observed in the chemical engineering area [131]. Bioprocess intensification has
focused on optimizing fermentation yields via media composition and feed strategies, dynamic control
of physical conditions, induction, genetics, immobilization, and bioreactor engineering [132].
One of the trends in PI applied to biotechnology is the use of microfluidic devices, and some
have already been upgraded to production scale [131]. On account of miniaturization micro channel
reactors, where biochemical transformations occur, have been assembled thanks to the advances in
micro and nanotechnology [131]. One example of this approach is the miniaturization towards
biocatalysis.
One example of miniaturization is the packed-bed micro reactors. In this micro reactors enzymes
are immobilized in different carriers or on supports, so they can be packed in a column to perform their
enzymatic activity [131–133]. Their advantages are many and could be highlighted its improved mass
transfer, advantageous partitioning effects and integration with downstream processing;; characteristics
that are important for PI [131, 132]. Another different approach of microfluidic devices is their use for
downstream processing, such as extraction biomolecules, as an attempt to integrate bioconversion and
extraction in a single step [131].
Another interesting trend is the creation of immobilized cell systems. One example of this

18
technology implemented at industrial scale is beer maturation and alcohol-free beer production.
Commercial-scale immobilized yeast reactors conceive them, because production of yeast biomass is
not required. The key factors to create this were the fusion of knowledge in carrier material,
immobilization technology and bioreactor design. However, for the future the task would be to immobilize
cells to control and adjustment of the flavour compounds formation during beer production or any other
long-term fermentation [134].
As mentioned above, the use of alternative energy sources and the design of a sustainable
process are pursued in PI. One exciting case of electrically enhanced reactions is the conversion of
lignocellulosic material into fermentable sugars using ultrasounds (ultrasonic agitation) [135]. Subhedar,
et. al. [135] wanted to decipher the effect of ultrasounds on enzymatic hydrolysis of newspaper since it
represents a potential feedstock for cellulosic bioethanol production due to its high cellulosic content.
The authors found out that the release of reducing sugars were considerably higher applying the
ultrasound-assisted enzymatic hydrolysis. Based on the results the authors indicate that there is a
synergistic effect between ultrasound and enzymes. Further explain that the increase in reaction rate is
owed to a lower diffusion-limiting barrier to enzyme/substrate binding [135]. Reay, et. al. [129]
suggested that there is a high potential for using electric fields for heat induction or to enhance droplet
motion of fermentation broths. However, no one has explored its potential on biological process.
Considering PI approaches in separation techniques, phase separation in solutions containing
polymer mixtures in an aqueous two-phase system (ATPS) is a good example [127, 136]. The bulk of
both phases consist of water containing different hydrophilic polymers instead of organic solvents. ATPS
creates an appropriate environment for biomaterials (plant and animal cells, microorganisms, viruses,
plasmids, proteins and nucleic acids) since it is able to stabilize their biological activities [136]. In ATPS,
concentration and purification in one water phase may occur in the same step because of partitioning of
the desired biomolecule or biomaterial to one phase and contaminant biomolecules to the other phase
[136]. It is advantageous because it is a technique that can be easily scaled-up, it is not so expensive
to perform and is eliminated the use of flammable solvents [127, 136].
One example of PI applied to biosurfactants production is the research project published by
Faria, et. al. [16] where they demonstrated for the first time the MEL production from lignocellulosic
sources performed through separate hydrolysis and fermentation (SHF), simultaneous saccharification
and fermentation (SSF), and Fed-batch SSF. Lignocellulosic materials require a physical-chemical
pretreatment, followed by an enzymatic hydrolysis to release fermentable sugars (saccharification) [12,
16]. However, Enzymatic hydrolysis and fermentation may occur sequentially as SHF or at the same
time, as SSF. The advantage of SSF approach is that product inhibition of cellulolytic enzymes
considerably declines since the fermenting microorganism consumes the sugars released during
hydrolysis simultaneously [16].
Despite the captivating benefits of PI, the fact is that there are barriers for implementation of
such approaches, which have resulted in a relatively slow adoption since its inception around twenty
years ago. Plant and business managers argue that they require full-scale evidence of successful
operation before they are prepared to apply. The idea of “scrap and start again” is quite improbable to
be accepted at industrial scale. Thus many intensified equipment have to prove its complete reliability

19
qualifications for their acceptance [129].
2.3 - Mannosylerythritol Lipids
2.3.1 – Properties and differentiation among other molecules
Mannosylerythritol lipids (MEL) are a family of biosurfactants which contain 4-O-D-
mannopyranosyl-meso-erythritol as the hydrophilic group bonded to one or two fatty acids and/or acetyl
groups as the hydrophobic moiety. They are produced mainly by Pseudozyma genus (Table 7). In
general this family of molecules are able to decrease the surface tension of water to less than 30 mN·m-
2 [9, 27]. Their synthesis is not growth associated, therefore, it can also be produced during stationary
phase of yeast culture [27].
MEL molecules family are classified according on the degree of acetylation at carbon 4 and
carbon 6, and their order of appearance on the thin layer chromatography (TLC). The MELs are named
as MEL-A, -B, -C, and –D (Figure 7). MEL-A is diacetylated while MEL-B and MEL-C are monoacetylated
at position 6 and 4 positions, respectively. The completely deacetylated molecule is known as MEL-D
[25]. In general, MEL-C is more hydrophilic when compared to the other MEL types [137].
Most of the strains produce MEL-A and B. These variants arise due to the following reasons:
1. Quantity and position either of the acetyl-group on mannose or erythritol or both.
2. Number of acylation in mannose carbons, which will depend upon the yeast strain.
3. Fatty acid chain length and their saturation, where can be found chain lengths from two carbon
up to 18 carbon and up to two insaturations (Table 7). This will depend upon carbon source.
These composition variants of MEL mixture will depend on the producer strain. For instance,
MEL molecules isolated from Pseudozyma antarctica strain T34 showed that MEL-A and MEL-B
predominated in the mixture [47, 138]. In contrast, Pseudozyma shaxiensis produces mainly MEL-C
molecules (Table 7).
Furthermore, it is not completely understood why does these strains produce MEL. It is thought
that MEL functions as an energy storage material in the yeast cells similar to triacylglycerol molecules
[26]. Other study demonstrated that MEL molecules help in promoting fungal colonization on solid
surfaces [43]. However, these studies do not elucidate whether MEL affects directly or indirectly such
fungal colonization. Also it has been suggested that the observed morphological conversion of P.
antarctica from single yeast-like to hyphae form may be closely related to their MEL production capacity
[43]. Probably they may play functions mentioned on section 1.1 – Overview. However, further studies
are needed.
2.3.2 – Significance of MEL and applications
The increasing interest on MEL could be credited to the pharmaceutical applications and
versatile biochemical functions. Among them, can be highlighted the application on stem cell research
since it has been attributed antitumor and differentiation-inducing activity against many cancer cell lines
[9]. The potential for the improvement and development of gene therapies also has been reported. Inoh,
et. al. [139] have found out the MEL-A, acetylated at position 4 and/or 6, showed an important increase
in the efficiency of gene transfection facilitated by cationic liposomes. It outstandingly accelerated the
adhesion of positively charged liposome–DNA complex to the cell membrane and its incorporation.

20
Figure 7
Chemical structures of MEL molecules families (adapted) [9]
Other applications include the isolation of glycoproteins. MEL A, B and C exhibit strong affinity
to lectins (immunoglobulin G). In consequence, there is a great potential for the development of a novel
method for purification of lectins [9]. Alternatively, such interaction with lectins could be explored to
improve downstream process of MEL production for high purity applications: cosmetics and
pharmaceuticals.
Adding to previous applications, there has been found that MEL functions as an
antiagglomeration agent on ice-water slurries [140]. This would become a more sustainable and
ecological way for cold-thermal storage of commodities or food since it increases the effectiveness of
secondary refrigerants [141]. Another interesting application is that MEL A and MEL B have shown
antimicrobial activity against gram-positive bacteria and poor activity against gram-negative bacteria.
However, MEL does not have antifungal activity. This finding could be used for the design of new
antibiotics or new food preservatives.
One of the industries that have already incorporated MEL in extensive use is the cosmetic
market. This can be explained due to the fact of high production costs and high selling price of cosmetics.
Some studies suggested that MEL A has ceramide like skin care property [26, 142]. Due to these
properties MEL A easily penetrates into the intercellular spaces easily. Thus, MEL-A has the potential
to be used as skin moisturizer. Actually many skin care companies around the world are incorporating
MEL in their skincare formulas as an active ingredient or as texturizing agent. For example: TOYOBO
U.S.A, Inc.[143], Kanebo Cosmetics Inc.[144], Biotopia Co., Ltd.[145], and Damy Chemical Co. Ltd
[146]. More MEL producers are detailed in Table 5.
2.3.3 – Production
MEL production can be considered as a taxonomic index for the characterization of the
Pseudozyma genus, together with the other biochemical characterization techniques, analysis of
polysaccharides present on the cell wall, and fatty acids profile [9]. Although the molecular mechanisms
of MEL biosynthesis has not been completely elucidated, the level of understanding reached for MEL
production is higher for basidomycetous fungus Ustilago maydis, a genus that produces MEL and other
types of biosurfactants [9].
The first step in MEL biosynthesis would be the production of mannosylerythritol, where it is
thought that mannosylation of erythritol is catalysed by the glycosyltransferase Emt1. This disaccharide
is then acylated with fatty acids in C-2 and C-3 positions of mannose by two acyltransferases (Mac1 and
MEL-A = R1 = R2 = Ac
MEL-B: R1 = Ac, R2 = H
MEL-C: R1 = H, R2 = Ac
n = 6 - 10

21
Mac2). These enzymes harbour C-terminal with PTS1 motifs [147]. Therefore, MEL biosynthesis was
hypothesised to occur in peroxisomes and coupled to peroxisomal fatty acid degradation. Finally it can
be acetylated in C-4 and C-6 positions by the acetyltransferase Mat1. However, this step is not essential
for cell excretion of MEL [9].
MEL and its production by cells can be detected through fluorescence microscopy using Nile
Red as fatty acids’ staining agent (Figure 8). Nile Red is a lipid probe, which emits fluorescence at λ =
582 nm (yellow-gold emission light) and at λ =617 nm (orange-red light) in the presence of neutral lipids
and polar lipids, respectively, when excited at λ = 488 nm [148].
The production of MEL in shake flask is widely reported while scarce attempts have been made
in a larger bioreactors [14, 58, 149–152]. The several media and carbon sources assessed are detailed
in sections 2.3.3.1 – Using vegetable oils as substrates and 2.3.3.2 – Alternative substrates.
Similarly to other bio-products, the sustainable production of microbial compounds is highly
associated with cost-effective bioprocesses and the use of economical and renewable resources. The
different substrates explored for MEL production until now are described below.
2.3.3.1 – Using vegetable oils as substrates
As mentioned above, most scientific studies targeting MEL production by Pseudozyma sp. use
SBO as carbon source, resulting in higher yields of MEL (34 – 165 g/l) at the end of cell culture [151,
153]. Production begins with preparation of seed cultures by inoculating cells grown on slants into flasks
containing the growth medium without SBO [4% glucose, 0.3% NaNO3, 0.03% MgSO4, 0.03% KH2PO4,
0.1% yeast extract (pH 6.0)] between 25 ºC – 30 ºC with rotary shaking (110 – 300 rpm) during 2 days
[9, 27, 47]. The basal medium [8% (w/v) SBO, 0.3% NaNO3, 0.03% MgSO4, 0.03% KH2PO4, 0.1% yeast
extract (pH 6.0)] is inoculated using seed culture (3 – 4 % of basal medium volume). The inoculated
basal medium is then incubated on a rotary shaker (220 - 250 rpm) at 28 °C for 7 days. After yeast
cultivation, downstream is performed to isolate MEL (see 2.3.4 – Downstream processing).
Different types of vegetable oils have been assessed, but overall studies report that SBO
provides the highest MEL yields. In a study performed by Kitamoto, et. al (1990) six vegetable oils were
assessed as substrates for MEL production with P. antarctica T-34 culture. They concluded that the
higher yield (34 g/l) were achieved using SBO as carbon source (Table 8) [47]. Using such study as
reference, most of the studies have been performed mostly with SBO. The highest yield achieved (165
g/l) until date has been reported for Pseudozyma aphidis DSM 14930 using SBO as carbon source
[151]. However, posterior studies demonstrated that other types of edible oils are good candidates as
MEL production also depends on the tested strain (Table 7). Note that MEL production from SBO or
other edible vegetable oils will hardly be sustainable due to the growing prices of these commodities
and the extensive land needed for these crops [11, 154]. Downstream processing with oil-containing
broths is performed by several liquid-liquid extractions using organic solvents, this process is fairly
inefficient since that to achieve high purity level (> 90%) the recovery yield is reduced (around 8%) [11].
Additional drawbacks of using organic solvents are their high cost, air pollution, health-related hazards,
and the risk of fires [8].

22
2.3.3.2 – Alternative substrates
Due to the inconvenience of using vegetable oils as carbon source for MEL production, new
substrates have been assessed for MEL production during the last 5 years. Some examples are honey,
sugarcane juice, and waste oils among others. The Table 8 resumes some of these examples.
The study performed with Pseudozyma antarctica (ATCC 32657) using honey as carbon source
[155] reports lower MEL yields comparing to those achieved using edible oils (Table 8). An advantage
of using honey is that it reduces complexity of downstream processing comparing to water insoluble
substrates. Although honey have some advantages, it is also important to consider that honey is also
consumed as food. In the other side, Morita et. al was able to produce MEL-B from sugarcane juice, but
using Ustilago scitaminea NBRC 32730 as producer [156]. Then, this substrate could be an alternative
to substrates that are used also as human feedstock.
Others studies have used alkanes to produce MEL molecules with high yields [138].
Nevertheless, one disadvantage is that most of these hydrocarbons comes from fossil oil. Therefore,
the sustainability of such approach is questionable since they use same raw materials of synthetic
surfactants.
Table 7 Selected microorganisms reported on literature as MEL producers and their chemical diversity [9, 27]
Strain/Genus Hydrophilic group Fatty acid chains
Type of MEL (major component)
Ustilago nuda PRL-627 [157] 4-O-β-D-
mannopyranosyl-D-erythritoI
C2:0, C12:0, C14:0, C14:1, C16:0,
C16:1, C18:0 and C18:1
---
Candida (Pseudozyma) sp. B7 [158]
4-O-β-D-mannopyranosyl-D-
erythritoI C7 – C14 MEL B7
Pseudozyma antarctica T-34 [47, 138]
4-O-β-D-mannopyranosyl-D-
erythritoI
C8:0 (27.26%), C10:0 (21.28%), C10:1 (27.22%)
MEL A and 4 types of MEL-B
Ustilago maydis DSM 4500 and ATCC 1482 [159]
4-O-β-D-mannopyranosyl-D-
erythritoI
C14:1 (43%), C6:0 (20%) and C16:1
(12%) MEL-A
Kurtzmanomyces sp. I-11 [160]
6-O-β –D-mannopyranosyl- (1à4)-O-meso-
erythritol
C8:0 (36.4%), C12:0 (11.9%), C14:2 (25.9%)
MEL I-11
Candida sp. SY16 [149]
6-O-β –D-mannopyranosyl- (1à4)-O-meso-
erythritol
C6:0, C12:0, C14:0 and C14:1
MEL A
Pseudozyma aphidis DSM 70725 [152]
4-O-β –D-mannopyranosyl- (1à4)-O-meso-
erythritol
C10:0, C10:1, and C8:0
MEL A
P. tsukubaensis JCM 10324T [161, 162]
1- O-β-D-mannopyranosyl- (1à4)-O-meso-
erythritol
C8, C12, C14 MEL B
P. antarctica and P. parantarctica [163]
4-O-β –D-mannopyranosyl- (1à4)-O-meso-
erythritol
C8:0, C10:0, C12:0, C14:0, C14:1
Monoacylated MEL

23
(Cont…)
Strain/Genus Hydrophilic group Fatty acid chains
Type of MEL (major component)
P. antarctica and P. rugulosa [164]
4-O-β –D-mannopyranosyl- (1à4)-O-meso-
erythritol
C18:1, C18:0, C10:0, C10:1, C16:0, and
C8:0 Tryacylated MEL
Pseudozyma shaxiensis [165]
4-O-β –D-mannopyranosyl- (1à4)-O-meso-
erythritol
C16:0, C16:1, C16:2, and C14:1
MEL-C
Waste products such as crude glycerol (by-product of fat splitting and biodiesel production) was
also assessed reaching yields between 16.3 g/l using P. antarctica JCM 10317 [166] and 67.4 g/l using
P. aphidis [51]. Besides they are cheap and environmental sustainable, they have the advantage to be
water-soluble and in consequence facilitates downstream processing.
Oil refinery waste such as soap stock and Post-refining fatty acids (PostFFA) were also
assessed as substrates, for example Bednarski et. al. [67] cultured P. antarctica ATCC 20509 and P.
apicola ATCC 96134 in a medium supplemented with oil refinery waste, either with soap stock (from
5.0% to 12.0% v/v) or post-refinery fatty acids (PostFFA) (from 2.0% to 5.0% v/v). They obtained titres
of 13.24 g MEL/l (soap stock) and near 11 g MEL/l (PostFFA) from P. antarctica. Dzięgielewska et. al
[51], improved MEL titre to 77.7 g/l culturing P. aphidis DSM 70725 in soap stock and to 40 g/l by P.
jadinii DSM 70163 cultured in PostFFA. Furthermore, a successful attempt was performed in a culture
containing post-refining waste (PostRW) with P. antarctica ATCC 28323 reaching a 107.2 g MEL/l titre.
Figure 8
MEL accumulated intracellularly during cultivation. P. rugulosa NBRC 10877 was cultured in a medium containing glucose (upper panels) and soybean oil (lower panels) as the sole carbon source at 25 °C for 5 days. Fluorescence microscopic examination with Nile red staining (right panels). Differential interference contrast (DIC, left panels)[167]

24
Additionally, Dzięgielewska et. al [51] assessed a low-cost medium containing soap stock and
whey permeate or molasses. In such study 90 g of MEL per litre was achieved by P. aphidis DSM 70725.
The use of less expensive raw material, also contributes to reuse food waste that usually are sources
for water pollution.
Waste frying oils (WFO) has also been tested for MEL production using P. jadinii DSM 70163
where 67.3 g/l titre was reached after 7 days of bioconversion [51]. This was done by the submerge-
shaking method in a YPD medium (10 g/l yeast extract, 20 g/l peptone, 20 g/l glucose) supplemented
with WFO (100 g/l). However, Dzięgielewska et. al states that when glucose is absent, the MEL titres
decreases (values not stated by the author). Furthermore, the MEL concentration was determined
gravimetrically, which increases the experimental error since they measured the crude residue.
Nonetheless, WFO have the advantage of being produced in high amounts from restaurants and big
food industries. If it were used extensively for MEL or other bio-products production, it would help to
avoid water pollution. However, downstream processing and homogeneity of WFO, due to their diverse
origins, may result on process complications and results variability.
Another aspect to take into consideration, is the method that is used to measure MEL titres
(Table 8). As all analytical methods, all these methods have some limitations and advantages.
Therefore, the base of comparison among the different MEL titres might not be accurate.
Other substrates assessed for MEL production were free fatty acids, fatty acid residues [51] and
poultry fat [168]. These raw materials are more sustainable and less expensive since they are wastes
of by-products of other industries.
2.3.3.2.a – Lignocellulosic materials as substrate for MEL production
Nowadays, there is an increasing concern of industry and governmental agencies to commit
with to the bioconversion of renewable lignocellulosic biomass into value added products or biofuels
[56]. The origins of lignocellulosic materials are diverse, such as primary crops, paper industry and
municipal residues, forests, etc. The largest quantities of agricultural residues and wastes are driven
from edible crops (i.e. corn Stover, wheat straw, etc.). The US Department of Energy estimates that in
2011, about 111 million and 94 million dry tons of primary crop residues in the USA could be collected
and reused in profitable activities [169].
Lignocellulosic materials represent a lavish sustainable and renewable feedstock. Their main
components are cellulose, hemicellulose and lignin. While cellulose is a homopolymer of D-glucose,
hemicellulose is mainly composed of xylans and arabinoxylans, from which D-xylose and L-arabinose
are the most abundant monosaccharides (up to 35% of the total sugar fraction in lignocellulosic
materials) [12]. The improvement of processes able to use both the cellulose and the hemicellulose
fractions of lignocellulosic materials are essential for the production of viable bio-based products.
The USDA estimated that these residues would increase to 180 million dry ton by 2030, in the
USA alone, under a baseline scenario and 320 million ton under a high yield scenario [169].
Consequently, the use of such agricultural wastes as raw material for bio-products, such as bio-ethanol,
biodiesel or biosurfactants not only would reduce the overall cost of its production but also may reduce
the risk related to waste discharge in the environment, making these residues profitable.

25
The use of Lignocellulosic materials to support bioproduction of added value compounds and
biofuels has not been done extensively, in part because of the harsh pre-treatment that has to be carried
out before fermentation. This up-stream processing has the purpose to release fermentable sugars from
polymers. Nevertheless several toxic by-products for microorganisms are produced during this step, for
instance furfural, acetic acid and hydroxymethylfurfural (HMF) [14, 55, 170]. Today the use of these
materials has been restricted to produce cellulosic ethanol [48, 171].
Few attempts have been done to produce microbial biosurfactants from lignocellulosic
materials. As listed in Table 5 most of the attempts have been addressed to rhamnolipids production
from wine industry wastes [86–89]. Nonetheless, there is one report where MEL production from P.
antarctica was carried out on wheat leaf cuttings [43]. This represents the first attempt towards MEL
production on solid surfaces of lignocellulosic biomass. However, this study only targeted to decipher
the role-play of MEL during spreading of microorganisms on leaves and do not aim at a industrial
production of MEL.
A second report by Faria, et. al [11] demonstrated the production of MEL molecules from D-
glucose and D-xylose as carbon sources. After the results obtained, again Faria, et. al. [16]
demonstrated for the first time that MEL production is possible from lignocellulosic materials applying PI
concepts. Even though these are not lignocellulosic materials, these finding open the possibility to
produce MEL from lignocellulosic hydrolysates. Since these hydrolysates contain D-xylose and D-
glucose mixtures, it would denote a more environmentally friendly solution towards MEL production with
possible applications at industrial levels.
MEL was produced from cellulosic substrates, Avicel® as reference and hydrothermally pre-
treated wheat straw. Hydrolysis was carried out with commercial cellulolytic enzymes (Celluclast 1.5 L®
and Novozyme 188®) and Pseudozyma antarctica PYCC 5048T or Pseudozyma aphidis PYCC 5535 as
MEL producers. Nevertheless, results showed that Pseudozyma antarctica achieved higher MEL titres
of 4.0 and 1.4 g/l by SHF in Avicel® and wheat straw, respectively, using enzymes at low dosage. Low
enzyme dosage is important because if the enzyme amounts increase, it would result in higher
production costs. Thus, it will become a limiting factor to intensive production from lignocellulosic
materials.
2.3.3.3 – Potential new substrate candidates
As an effort to produce biosurfactants following a sustainable and economic approach, many
researchers have been focused on alternative substrates to support biosurfactant production at
laboratory or industrial scale. A collaboration between IST and LNEG support the idea of using agro-
industrial wastes due to their relative unlimited availability for MEL production (see section 2.3.3.2.a –
Lignocellulosic materials as substrate for MEL production). Unfortunately, the titres using either
lignocellulosic materials or the alternative substrates mentioned are not so high as those reached when
edible oils are used. Hence, the search for the ideal substrate continues.
Furthermore, Morita, et. al. [156] from sugarcane juice;; Dzięgielewska, et. al. [51] from PostRW,
soapstock, WFO, and glycerol have demonstrated that MEL production can be accomplished using
industrial wastes as substrates (see section 2.3.3.2 – Alternative substrates).

26
Table 8 Different conditions reported for the production of MEL.
Strain Titre (g MEL/l) Conditions Reference
Pseudozyma sp. B7 30 n-alkane or vegetable oils in batch culture [158]
P. antarctica T-34 47 Soybean oil and resting cells in batch culture 2. [172]
P. antarctica T-34
34 (SBO) 31.2 (Safflower oil) 30.8 (Coconut oil) 29.7 (Cottonseed oil) 24.2 (Corn oil) 22.8 (Palm oil)
Vegetable oils, yeast extract in batch culture 2. [47]
Ustilago maydis ATCC 1482
30 (Mixture of MEL + cellobiose lipids)
Sunflower oil fatty acids in fed batch culture 3. [159]
P. antarctica T-34 140 Octadecane in fed batch culture 2. [138]
Pseudozyma aphidis DSM 14930 165
Glucose:SBO (1:1) with additional substrate-feeding in fed batch
culture 5. [151]
Pseudozyma hubeiensis KM-59 76.3 Soybean oil in fed batch culture 5. [173]
P. antarctica JCM 10317
12.8 (Olive oil)
Glucose or sucrose or olive oil in batch culture 5. [142]
U. scitaminea NBRC 32730
6.40 (Sucrose) 6.20 (Glucose)
P. tsukubaensis JCM 16987 73.1 (olive oil) Vegetable oils in fed batch culture 5. [174]
Usitilago scitaminea NBRC 32730 20.0 (MEL-B) Sugarcane juice in batch culture 5. [156]
P. antarctica ATCC 28323
107.2 (PostRW) 55 (WFO) Glycerol, PostRW, PostFFA, soap
stock, WFO, whey permeate, molasses in batch culture 1.
[51] Pseudozyma aphidis DSM 70725
77.7 (soap stock) 70 (Glycerol) 60 (WFO)
Pseudozyma antarctica ATCC 32657 5.61 (14 % honey) Honey RDH in batch culture 2. [155]
Pseudozyma hubeiensis Y10BS025
115 (75:25 Glucose:Glycerol in
SBO)
Glucose, Glycerol and SBO or olive oil as inducers in batch culture 6. [175]
Pseudozyma aphidis ZJUDM34
Not measured Structural analysis SBO in batch culture. [176]
P. antarctica T-34 Relative amounts Not declared
Rice and wheat leaves in batch culture (solid state) [43]
P. antarctica PYCC 5048T
5.4 (Glucose) 4.8 (Xylose) 4.9 (Glucose + Xylose mixtures)
D-glucose, D-xylose, D-glucose/D-xylose mixtures in fed batch culture
4. [14]
P. antarctica PYCC 5048T
Wheat straw 1.1 ± 0.3 (SSF) 1.4 ± 0.2 (SHF)
Solid fraction of pretreated wheat straw, under SSF and SHF 4. [16]
1 Gravimetric method. 2 Anthrone method (indirect measurement) [47]. 3 Scanning de density of the TLC plates at 580 nm (direct measurement) [159]. 4 Methanolysis of freeze-dried culture broth (indirect measurement) [177]. 5 HPLC on a silica gel column with an evaporative light scattering mass detector (direct measurement) [151]. 6 Normal phase HPLC on a silica gel column coupled to a UV detector (206 nm) [175].

27
In the other side, Maneerat, et. al. [53];; Makkar, et. al. [46] and Kosaric [50] have strongly
suggested the use of industrial by-products addressed to biosurfactant production. For instance sugar
cane molasses, soy molasses, potato process effluent, cassava wastewater, orange fruit peelings, oil
refinery wastes, OOME, peanut oil cake, soap stock, distillery waste, and used motor lubricant oil [8].
OOME [59], soy molasses [113], sugar cane molasses [107, 114, 115], and orange fruit peelings [90]
have been assessed for rhamnolipids production. Their assessment towards MEL production hasn’t
been explored until now. Probably these substrates could be an alternative to those assessed by Morita,
et. al. [156], Dzięgielewska, et. al. [51], and Faria, et. al [16];; such as edible vegetable oils, wheat straw,
sugarcane juice, PostRW, soapstock, WFO, and glycerol (Table 8).
2.3.4 – Downstream processing
As mentioned previously (see section 2.1.4 – Production), one important action to carry on to
decrease MEL production cost is the implementation of efficient bioprocesses, including cost-effective
isolation techniques to attain product purity with significant product recovery yields. The purity
percentage and the choice of downstream operations will depend on the product commercial purpose.
MEL isolation and purification is a struggling task when hydrophobic substrates are used, such
as edible oils. Most of the procedures used actually are based on several complex extraction and
purification steps that achieve high purity with extremely low yields (i.e. 4 ·% wt yield with ethyl acetate
extraction followed by preparative HPLC [149]). The more complex is the MEL extraction procedure, the
higher is the cost of the overall process to obtain pure MEL [8].
Rau, et. al. [58] produced MEL from SBO in a bioreactor and carried out different downstream
processing techniques to isolate MEL from fermentation medium. The authors tested a stepwise liquid-
liquid extraction using different solvents, adsorption on commercial resins (Amberlite ® XAD-16, XAD-
7, and XAD-4), and a heat treatment to the cell suspension. The heat treatment process gave the highest
yield of 93 % w/w at 110 °C during 10 min with a purity of 87 % w/w, whereas the solvent extraction
method gave only 8 % w/w yield with 100 % w/w of purity. In contrast, the resins didn’t show to be able
to isolate MEL.
In-house, at IST, Gueiros [178] reproduced the same procedure as Rau, et. al [58] and was able
to increase MEL yield to 59 %. However, purity sharply decreased to 69 %. In a second attempt where
hexane and methanol were reduced to the half, MEL yield drop to 27 % but purity rose by 10 % more
(79 %). Furthermore, the heat treatment was also reproduced, but no physical separation of phase was
observed.
In the case of the stepwise extraction, some authors have added a centrifugation step before
first extraction to separate cells from suspension [175]. Then the supernatant is extracted with ethyl
acetate (1:1 v/v). The organic phase is then separated from the water phase and concentrated using
vacuum evaporation. A extractions with n-hexane, methanol and water as solvent mixture (1:6:3, v/v)
with posterior threefold extraction with n-hexane is used to remove residual fats, which are solubilized
on the hexane rich phase. The water/methanol phase is submitted to methanol distillation and water
lyophilisation to isolate the purified MEL fraction.
In addition to those methods, there is another separation technique based on liquid-liquid
extraction carried out first with ethyl acetate. Then, the solvent layer is collected and evaporated.

28
Residue is dissolved in chloroform and passes through a preparative chromatography column filled with
silica gel (Wako-gel C-200). Finally, MEL elutes using a gradient composed of chloroform acetone (10:0–
0:10, v/v). Using these operations, the highest yield achieved is 79 % w/w with 100 % of purity [58]. This
technique represents a method to recover with high purity MEL in small quantities;; the loss of product
is significant and uses a solvent with a high environmental impact, chloroform. Therefore, it is not a good
option to reduce downstream process cost when developing a process at large scale.
An attempt to decrease the number of steps required to obtain the pure end product consists
on the use of less complex substrates and development of effective downstream protocols. Following
this stream, there are some authors that have tested more hydrophilic substrates like pentoses [11] and
other sugar sources such as honey [155] and sugarcane juice [156].
2.4 – Sustainable assessment
2.4.1 – Life-Cycle Assessment (LCA) for microbial biosurfactants Among the different surfactant systems, actually there is not yet a well-defined comparison
criteria in terms of greenness degree and sustainable practices [24]. The idea of “green” technologies,
products or services has been characterized by several parameters (green metrics), such as carbon
footprint, biodegradability, toxicity, renewability, and so on. Undoubtedly, these individual metrics alone
cannot provide a full idea of the impact of a surfactant system from “cradle to grave to cradle” approach
[24]. The Life-Cycle Analysis or Assessment (LCA) has shown recently to provide a more descriptive and complete assessment of sustainability.
A LCA is a standardised methodology that considers all resource and energy inputs needed to
produce something, the wastes, and the health and environmental concerns related with the final
product, than means the whole chain of production. It is useful to perform a LCA from preproduction to
consumption because it would help to identify and quantify the total benefits, drawbacks and
opportunities areas in order to improve production processes [56, 154, 179, 180].
Since it is a standardised methodology, LCA guidelines are stated in the ISO 14040 standard
[154, 181]. However, there are also other guides published by the US Environmental Protection Agency
(LCA101) [182] and by the European Commission (EC) [183]. These documents are available to guide
and encourage enterprises to perform a LCA on their businesses. Furthermore, they facilitate
communication and exchanges on life-cycle data. On the other hand, there are many external
certification bodies around the world that carry out this kind of analysis. For instance SGS Group
Management SA (global agency), Certification International (global agency) and Bureau Veritas
Certification (global agency), among other certification bodies.
Especially the Joint Research Centre of the EC, recognizing the LCA as the best tool to measure
the environmental impact, created a more robust framework comparing to the American counterpart.
This framework integrates the European Platform on Life Cycle Assessment (EPLCA), which supports
the European reference Life Cycle Database (ELCD), the International reference Life Cycle Data System
(ILCD) Handbook, and the Life Cycle Data Network (LCDN). All together guide businesses and
governments in the implementation of sustainable policies by providing tools, reference data and
recommended methods for LCA studies [183].
As any analysis, it has some drawbacks. Performing an LCA is time consuming and requires lot

29
of resources, mainly data. Gathering the data can be struggling because having the right information
would strongly affect the output of this assessment. Hence, before doing this analysis, is convenient to
balance the availability of data, the required time and the financial resources against the project benefits
of the LCA [182].
Although there is not yet any widely accepted definition for “green surfactants” either for
academics or industrial players, for practical terms most of the times is accepted that non petroleum-
based material are considered more sustainable or “green” [24]. However, no one has published any
LCA report for biosurfactants. Even though, LCA reports for day-to-day surfactants are scarce.
In this review was only identified one paper published in 2013 by Guilbot [181] which explores
the case of alkyl polyglucoside (APG), a composition of cetearyl glucoside and cetearyl alcohol. These
molecules are widely used in personal care products namely cosmetics. This ingredient is considered
as “green” due to its vegetable origin and to its manufacturing process that complies with the 12 rules
of Green Chemistry [181]. Though it is not related to microbial biosurfactants, it may give a scope of the
key points to consider for a LCA report analysing microbial biosurfactants. Therefore, there is an
opportunity in LCA area that can be explored for the first time ever.
2.4.2 – Life-Cycle Assessment (LCA) for vegetable oils. Previous research on comparative life cycle information on vegetable oils is relatively limited.
Examples are Arvidssona et al.[184] and Schmidt [185, 186]. Nonetheless, a larger number of studies
exist within the field of biodiesel (e.g. Menichetti and Otto [187]) which however are most often limited
to focus only on greenhouse gases (GHG) emissions compared to mineral diesel.
Schmidt [186] compared the environmental impacts of the six largest vegetable oils in the world
in terms of global production volume. In these study was included palm oil, SBO, rapeseed oil, sunflower
oil, and peanut oil.
Schmidt [186] classified the oils in low, medium, and high impact taking into account GHG
emissions, land use, and water use. The oils classified as low impact were rapeseed and sunflower oil.
They are followed by palm oil and SBO (medium impact). Finally, peanut oil showed to posses the
highest impact. In general terms, the hotspots for GHG emissions for all of the oils were identified in the
cultivation stage of oil crops including indirect land use changes (the causal link between the use of land
and deforestation or also called intensification cropland).
Nonetheless, the same author in a previous study concluded that palm oil is environmentally
preferable to rapeseed oil within ozone depletion, acidification, eutrophication, photochemical smog,
and land use [185]. These differences are due to the metrics, methodologies, and databases that are
used to obtain their results. Although both assessments are contradictory, both studies recognize that
the most significant process contributing to global warming is the cultivation of crops.

30
Chapter 3 – Materials and methods
3.1 – Upstream processing of lignocellulosic’s derivatives
3.1.1 – Selection of nanofiltration (NF) membrane
In the present study two Polyethersulfone’s NF membranes were studied (NF-PES 1 and NF-
PES 2) and two polyamide membranes (NF-PA 1 and NF-PA 2) (Table 9). Assessing these membranes
rejection profile using reference molecules is essential to forecast the permeation of different
components of the the wheat straw’s hemicellulosic hydrolysate when this one is filtrated through any
of these nanofiltration membranes.
Table 9 Description of membranes that were assessed. Information taken from suppliers.
NF-PES 1 NF-PES 2 NF-PA 1 and 2
Tmax (ºC) 95 95 40
35 (pH max 10)
Pmax (bar) 40 40 41
pH range 0 – 14 0 – 14 2 – 11
Rejection values (Rx) were estimated at 20 bar using multiple solute aqueous solutions
containing 1 – 2 g/l of each standard compound detailed above. All reagents were analytical grade. A
dead-end stirrer nanofiltration cell (HP4750;; Sterlitech, USA) was used for most of the assays..
Concentration polarization at the membrane surface was minimized by a Teflon-coated magnetic stir
bar mechanism which is centrally positioned in the cell and had a stirring rate of 500 rpm. A Nitrogen
cylinder and a fine-tuning pressure gauge injected the appropriate pressure. A decompression valve
allowed filtration to be stopped. Feed volumes of 50 ml (V0) were used in for establishing the rejection
curves. Filtration was stopped when 40 % of V0 was recovered in the permeate (Vt = 30 ml). Furthermore,
permeates were divided into two fractions: first 10 % of V0, and following 30 % of V0. Duplicate assays
were carried out using the same sheet of membrane to evaluate rejections and the values reported are
averages of the two values obtained. Concentration in feeds (CF,x), permeates (CP,x) and retentates
(CR,x) were determined according to the analytical method stated in 3.1.6 – Concentration quantification
of nanofiltrated solutions.
To prove the membrane was not damaged, a TRITON® X-100 (MW = 646.85 g/mol) aqueous
solution was tested. TRITON® X-100 concentrations used (CR1 = 0.08 mM) were under Critical Micelle
Concentration (CMC). To make sure this compound will not form micelles in the retentate at the end of
each experiment, the final concentration in the retentate (CR2) was estimated assuming total rejection
(σ" = 1). Mathematic calculations were done on the basis of the expressions (1) and (2).
C&'C&(
= CF*+
(1)

31
CF =V-V.
(2)
The membranes were preconditioned through the filtration of 300 ml of distilled water in each
flat sheet (20.43 cm2) until water flux was constant over time.
Rx were always calculated on the basis of the concentrations of compounds measured in
the feed (CF,x) and in the second fraction (15 ml) of permeate (CP,x) or retentate concentrations
(CR,x). Values were also used to close the solute mass balance, established as the amount of each
solute in the permeate (CP,x VP,x) plus retentate (CR,x VR,x) over the amount of a given solute fed
to the diafiltration (CF,x VF,x), which close at an average value of 98%, with values dispersion
between 80% and 133%, indicating that deviations to the theoretical value of 100% result from
analytical random errors.
R0 = 1 −C2C3
(3)
R0 = 1 −C2C&
(4)
3.1.2 – Diafiltration modelling For diafiltration modelling, both substrates and toxic concentrations in the hydrolysate described
above were quantified. This information would allow to estimate the number of diavolumes, i.e
additional volume of water added (VW) during the diafiltration per volume of the hydrolysate
submitted/fed to diafiltration (VF) would be needed for a given level of detoxification considering also
carbon substrate losses. For example, one can establish that the target is to reach 90% permeation
of toxic compounds and up to 20% of carbon substrates loss, and then to back calculate if a certain
membrane can provide such target and in such case what are the diavolumes required. Diavolumes
were reported as:
𝐷 =𝑉6𝑉7
=𝑉8𝑉7
(5)
Where VW is the water fed into the system. Assuming a system operating at constant volume
(100 ml) and without volume changes (V0 = Vt) inside the nanofiltration vessel, the VW equals to the
volume collected in the permeated (VP) for each time period of the diafiltration considered. The
expression reported in the literature [188], was used to calculate the theoretical values reported for
the diafiltration operations, where:
𝐶:,< = 𝐶7,<𝑒>?@ '>:A
?B = 𝐶7,<𝑒 >C '>:A
(6)
The concentrations on the permeate, the carbon substrates losses and toxic compounds
removal were calculated on the basis of the expressions:

32
𝐶8,< = 𝐶:,< 1 − 𝑅<
(7)
𝑆𝑢𝑏𝑠𝑡𝑟𝑎𝑡𝑒 𝑙𝑜𝑠𝑠 = 1 −𝐶:,<𝐶7,<
𝑉: = 𝑉7
(8)
𝑇𝑜𝑥𝑖𝑐 𝑟𝑒𝑚𝑜𝑣𝑎𝑙 =𝐶:,U𝐶7,U
𝑉: = 𝑉7
(9)
For the organic Brønsted acids (AH) used in the model solutions, the dissociation degree (α) of
their conjugate base (A-) was taken into account according to the acid-base equilibria that is reached
when these weak acids are dissolved in water at a given pH. This effect was considered since different
rejections can be observed at the molecular level for the organic acid and the respective conjugate base.
CF,HA represents a given organic solute considering both forms, the acidic and the respective conjugate
base. Furthermore, it was assumed that the pH (pH = 2) and temperature (25 ºC) will not change trough
time. Since they are in low concentration, water produced was depreciated. The work out is shown on
next. The work out is shown on next:
𝐴𝐻(YZ) + 𝐻(𝑂(^) ↔ 𝐴(YZ)> + 𝐻`𝑂(YZ)a (10) Initial 𝐶7,bc --- --- --- Equilibrium 𝐶7,bc 1 − 𝛼 (11) --- 𝐶7,bc 𝛼 𝐶7,bc 𝛼 (12)
To calculate [H3O+], it is used Equation 13:
𝑝𝐻 = − log 𝐻`𝑂a (13)
If pH = 2 and is constant, then:
𝐻`𝑂a = 0.01𝑀
Therefore, α is:
𝛼 = 0.01𝑀𝐶7,bc
(14)
3.1.3 – Selection of conditions to perform NF The variables of pH and pressure were tested in order to select the best conditions to perform
the NF for the selected membrane that possess the appropriate MWCO with the assessed compounds.
Room temperature was chosen since according to the literature the separation performance decrease
when the operating temperature increases from 25 to 40ºC [189].
Rx values were estimated at 10, 20, and 30 bar using multiple solute aqueous solutions
containing between 1 – 4 g/l of D-(+)-Cellobiose, D-(+)-Glucose, D-(+)-Xylose, formic acid, acetic acid
and 2-Furaldehyde (Table 12). Solutions of 0.1M NaOH and 50 mM H2SO4 were used to adjust pH
before diafiltration with the help of a calibrated pH meter (model 691, Metrohm). The assessed pH’s
conditions were set up at 2.0, 3.9, 4.7, 5.7, and 7.0. These values were selected taking into account pKa

33
values of standards used (Table 12), allowing to perform filtrations at different α according with pH
selected and pKa.
3.1.4 – Lignocellulosic hydrolysates
Wheat straw was hydrothermally pretreated and supplied by Laboratório Nacional de Energia e
Geologia (LNEG, Portugal) following the conditions previously established elsewhere [16].
Pre-treated wheat straw resulted into two phases: solid phase and liquid phase. The solid phase,
rich in cellulose, it is usually washed from small molecule toxic components which end-up on the liquid
phase. Therefore, only liquid phase from hydrolysates was further treated to reject coarse particles. First
it was centrifuged (12 000 rpm) at 4ºC during 10 min. Then the supernatant was filtrated trough a flat
paper filter under vacuum. Finally, the filtrate was collected and stored. The solid phase contain on
addition to cellulose, other components such as some hemicellulose and lignin. Cellulose to be
metabolized by yeast is enzymatic hydrolysed in its sugar components. The study of production of MEL
by Pseudozyma spp. has been previously successfully evaluated [16] and therefore is left out of the
scope of this thesis.
3.1.5 – Hydrolysate detoxification: diafiltration aided by NF membranes.
After being obtained the diafiltration model for the selected membrane, the detoxification could
be carried out. The required number of performed diavolumes were selected considering a 90 % of
inhibitors permeation and up to 20 % of substrate loss as initial target. However, these initial target was
also discussed against a set of experiments where different combinations of organic acids were spiked
in the culture media to study inhibitory effects on biomass growth and MEL production (see section
3.2.2.2 – Assessment of the effect of organic acids on MEL production). Diafiltrations were performed
using the same stirrer cell as stated in 3.1.1 – Selection of nanofiltration (NF) membrane, but with a
different configuration to supply sterile water inside the chamber. For that, water is fed through an HPLC
pump during diafiltration. Water feeding rate was maintained equal to QP with the aim to keep constant
the volume inside the chamber (VW = VP).
Samples for time point estimation of solute concentration in permeate (CPi,x) were taken at 0.5,
1.0, 1.5, 2.0, 2.5, and 3.0 diavolumes, allowing to estimate instantaneous apparent. Further samples of
cumulative concentration in permeate (CPA,x) and retentate (CR,x) were taken at 1.0, 2.0, and 3.0
diavolumes allowing to perform mass balances. Duplicate assays were carried out using the same sheet
of membrane to evaluate detoxification performance and the values reported are averages of the two
values obtained. Concentration in feeds (CF,x), permeates (CPA,x;; CPi,x) and retentates (CR,x) were
determined according to the analytical method stated in 3.1.6 – Concentration quantification of
nanofiltrated solutions.
Diafiltration with NF-PA2 was performed at room temperature, at pH = 2, at 20 bar and under
stirring (500 rpm). pH was monitored with the same equipment stated before (3.1.3 – Selection of
conditions to perform NF) along the process using the acquired samples. It is important to mention that
sulfuric acid was used to adjust hydrolysate’s pH to 2. The pH was adjusted back to neutral values
before cell culture using NaOH. However, one has to take into account that an higher concentration of
sodium sulfate is present which can also have an impact in cell culture

34
Diafiltration with NF-PA1 was done with two cells in parallel under tangential flux. Flow rate was
maintained (0.36 l/min) using a tubing pump (BVP-Z, IDEX Health & Science GmbH) and a head pump
(model 170-000, Micropump, Inc.). Pressure was set to 26 bar and pH =2. However, pH was measured
over time on permeates and retentate.
3.1.6 – Concentration quantification of nanofiltrated solutions
Collected permeates and retentates, resulting from nanofiltrations, and feedings used to obtain
membranes MWCO, were diluted with sulfuric acid 0.05 M solution (1:2). Afterwards samples were
analysed for: acetic acid (60.50 g/mol), glycerol (92.09 g/mol), 2-furfuraldehyde (96.08 g/mol), D-(+)-
glucose (180.15 g/mol), D-(+)-xylose (150.13 g/mol), D-(+)-trehalose (342.3 g/mol), and D-(+)-cellobiose
(342.3 g/mol) quantification. Quantifications were performed in high performance liquid chromatography
(HPLC) system (Merck Hitachi, Darmstadt, Germany) equipped with a refractive index detector (L-2490,
Merck Hitachi, Darmstadt, Germany) and an Rezex ROA-organic acid H+ column (300 mm ~ 7.8 mm,
Phenomenex), at 40°C. Sulfuric acid (0.005 M) was used as mobile phase at 0.5 ml/min. In the case of
Xylooligosaccharides (XOS), these compounds were quantified as stated in 3.2.3.3 – Oligosaccharides.
In the case of the hydrolysate, glycerol was not quantified but formic acid was. In the other side,
TRITON® X-100 solutions were quantified directly on a UV spectrophotometer (U-2000, Hitachi HTA,
USA) at λ = 274.5 nm using 10 mm quartz cells (Hellma, Germany).
3.2 – MEL production
3.2.1 – Yeast strain, maintenance and standard cultivation
Pseudozyma antarctica PYCC 5048T was obtained from the Portuguese Yeast Culture Collection
(PYCC), CREM, FCT/UNL, Portugal. Yeasts were cultivated for 3 days at 25°C on Yeast Malt broth
(YM) medium (yeast extract, 3 g/l;; malt extract, 3 g/l;; peptone, 5 g/l;; glucose, 10 g/l)[16]. Then dense
cultures were plated on Yeast Malt agar (YM – agar) (yeast extract, 3 g/l;; malt extract, 3 g/l;; peptone, 5
g/l;; glucose, 10 g/l: agar, 20 g/l) during 48 hours at 28 ºC. Plaques having the characteristic
morphological appearance of P. antarctica were isolated to prepare stock cultures. Stock cultures were
prepared by propagation of yeast cells in liquid medium and stored (in 20% v/v glycerol aliquots) at
−80°C for later use [11, 16]. Inoculum was prepared by incubation of stock cultures of P. antarctica at
28°C, 250 rpm, for 48 h, in liquid medium containing D-glucose (40 g/l), NaNO3 (3 g/l), MgSO4·7H2O
(0.3 g/l), KH2PO4 (0.3 g/l) and yeast extract (1 g/l) [11, 16].
3.2.2 – Growth media and bioconversion
Since one of the aims was to assess different carbon sources, each one had different
formulations. Nonetheless, all 250 ml shaking flasks were inoculated with 10% v/v of inoculum culture
and incubated at 27°C, 250 rpm during all bioconversion time. All media were sterilized in an autoclave
at 121ºC and 1bar for 20min. Furthermore, the ratio between medium volume and flask/vessel volume
was 1/5. All experiments were carried out in duplicate or triplicate.
3.2.2.1 – MEL production from biological oils
The cultivation medium containing D-glucose as carbon source (40 g/l glucose), used as
reference in this experiment, was supplemented with NaNO3 (3 g/l), MgSO4·7H2O (0.3 g/l), KH2PO4

35
(0.3 g/l) and yeast extract (1 g/l) [11, 16]. In order to know which was the best soybean oil (SBO)
concentration in media towards MEL production, two different medium formulas were tested first. One
was prepared with an oil concentration of 80 mlOIL/lMEDIUM plus supplements: NaNO3 (2 g/l), MgSO4 (0.2
g/l), KH2PO4 (0.2 g/l), and yeast extract (1 g/l) [58, 151].
The second medium was prepared with a lower amount of vegetable oil (21.1 g/l) and
supplemented as the previous culture broth containing vegetable oil. This medium has the same carbon
amount of the glucose-based medium. They were incubated during 10 days. Samples were taken at day
0, 4, 7, and 10 of bioconversion to measure biomass, nitrates concentration, glucose concentration,
triacylglycerol concentration (TAG) and MEL titre. Furthermore, to test whether the agitation was
affecting MEL production, shaking flasks containing baffles were used with the formulas detailed
previously.
Then, different oils were assessed selecting the formula containing 80 mlOIL/lMEDIUM. The
selected oils were crude rapeseed oil, crude SBO, waste frying oils (WFO) and poultry oil. Crude oils
were donated by Sociedade Ibérica de Biocombustíveis e Oleaginosas, S.A. (IBEROL, Portugal). WFO
were obtained from a chain of fast food restaurants in Lisbon, Portugal. Finally, poultry oil was obtained
from AVIBOM AVÍCOLA, S.A. (Portugal).
Shaking flasks were also incubated during 10 days. Samples were taken at day 0, 4, 7, and 10
of bioconversion to measure biomass, nitrates concentration, glucose concentration, triacylglycerol
concentration (TAG) and MEL titre.
3.2.2.1.1 – Characterization of oils used as substrates.
The characteristics of these raw materials were obtained from certificates of analysis (CoA)
issued by LNEG (Portugal) presented in Appendices i, ii, iii, and iv. A brief description of the parameters
included in these analyses are summarized in Table 10.
3.2.2.2 – Assessment of the effect of organic acids on MEL production
A set of shaking flasks with different concentrations of acetic acid and formic acid were assessed
to find out which concentrations have a positive or negative effect on MEL production and biomass
formation. The assessed concentrations of organic acids (15 in total) are summarized in Table 11.
The control medium has D-glucose as carbon source (40 g/l) and supplemented with
MgSO4·7H2O (0.3 g/l), KH2PO4 (0.3 g/l) and yeast extract (1 g/l). The rest of shaking flask contains the
same concentrations as the control but with the addition of organic acids as set up in Table 11.
In this experiment, a NaOH 1.0 M solution was used to adjust the final pH between 6 – 7 in each
flask. Furthermore, three flasks were used to test the effect of sulphate (2.4 SO42- g/l), which remains in
the solution as sodium sulphate;; these effect of sulphate in cell culture is considered, as sulphuric acid
would be used to adjust the pH of wheat straw’s hydrolysates promoting permeation through the
nanofiltration membrane of the organic acids in their neutral form. Followed of neutralization with NaOH
before cell culture, it was studied the effect of sodium sulphate in cell culture, in addition to the effect of
organic acids. The adjustment of pH for these 3 flask were done in the same manner (pH=6-7). These
flasks contain the same base medium as the others: D-glucose (40 g/l), MgSO4·7H2O (0.3 g/l), KH2PO4
(0.3 g/l) and yeast extract (1 g/l).

36
Shaking flasks were incubated during 10 days at 27 ºC under 250 rpm. Samples were taken at
day 0, 4, 7, and 10 of bioconversion to measure biomass, and the concentration of glucose, formic acid,
and acetic acid. MEL titres were estimated as well on day 4, 7, and 10.
3.2.2.3 – Assessment of the effect of inorganic acids on MEL production
An additional issue to be studied was to know if cell culture and MEL production could benefit
from the selection of other acid, rather than sulphuric acid, to adjust the pH for diafiltration, and a different
base to neutralise the retentate before to send this solution for cell culture. Then shaking flasks had the
same base medium: D-glucose (40 g/l), MgSO4·7H2O (0.3 g/l), KH2PO4 (0.3 g/l) and yeast extract (1
g/l). Different systems of acids and neutralizing base were tested separately, as 1.56 mmol Sulphuric
acid + sodium hydroxide, 1.56 mmol Sulphuric acid + potassium hydroxide;; 1.04 mmol of Phosphoric
acid + potassium hydroxide, and 3.12 mmol of Nitric acid + Potassium hydroxide. It important to notice
that these concentrations were chosen in order to have the same normality or equivalents of H+ ions per
litre. Biomass were measures at day 0, 4, 7, and 10. MEL titres were measured between day 7 and 10.
3.2.2.4 – MEL production from lignocellulosic’s materials
Detoxified hemicellulosic hydrolysates from both NF-PA1 and NF-PA2 membranes were tested
to assess whether the detoxification using NF membranes is enough towards MEL production. For both
detoxified hydrolysates, media were formulated without addition of nitrate. Since the hydrolysates’ pH
were adjusted using sulphuric acid, it was decided to not supplement the hydrolysate-containing media
with MgSO4·7H2O. Before autoclaving, media’s pH was adjusted between 6 – 7 using a solution of
NaOH 1.0 M.
One aspect to bear in mind is that all media were supplemented with D-glucose to simulate the
addition of sugars coming from the saccharification of the solid phase of pre-treatment biomass (Figure
9) [12, 190, 191].
The following control conditions were set up:
Control medium number 1 had D-glucose as carbon source (40 g/l glucose) and supplemented
with MgSO4·7H2O (0.3 g/l), KH2PO4 (0.3 g/l) and yeast extract (1 g/l).
Control medium number 2 was formulated to assess effects of sulphate ions on yeast’s growth
(2.4 – 2.5 g/l). It had D-glucose as another available carbon source (40 g/l glucose) and supplemented
with KH2PO4 (0.3 g/l) and yeast extract (1 g/l). The medium containing the detoxified hydrolysate coming
from either NF-PA1 or NF-PA2 (800 ml/l) was supplemented with D-glucose (40 g/l), KH2PO4 (0.3 g/l),
and yeast extract (1 g/l).
Control media containing formic acid, acetic acid, and furfural alone to understand how those
species affects MEL production alone at similar concentrations found in the hydrolysates prepared for
these experiments. For that, shaking flasks containing acetic acid (5 g/l), formic acid (5.4 g/l) and 2-
furfuraldehyde (0.6 g/l) supplemented with glucose (40 g/l), MgSO4·7H2O (0.3 g/l), KH2PO4 (0.3 g/l), and
yeast extract (1 g/l) were assessed.
At the centre of this experiment are the conditions at which the media containing the detoxified
hydrolysate coming from either NF-PA1 or NF-PA2 (800 ml/l) was neutralized with 16 mmol NaOH (recall

37
that 8 H2SO4 mmol were added to reach a pH 2, implying a final concentration of 17.6 mM SO4 ions)
and supplemented with D-glucose (40 g/l), KH2PO4 (0.3 g/l), and yeast extract (1 g/l).
Other aspect to decipher is the inhibition concentration of liquid fraction on MEL production. To
target this, different media with different concentration of non-detoxified hydrolysates were prepared.
There were media containing 80 % v/v, 40 % v/v, and 20 % v/v of non-detoxified hydrolysate. The left
volume was complemented with concentrated solutions to reach final concentrations of D-glucose (40
g/l), KH2PO4 (0.3 g/l), and yeast extract (1 g/l).
Shaking flasks were incubated during 14 – 18 days. Samples were taken at day 0, 4, 7, 10, 14
and 18 of bioconversion to measure biomass, and the concentration of glucose, formic acid, acetic acid,
furfural, xylose, and oligosaccharides. MEL titres were estimated as well on days 10, 14, and 18.
Table 10 Parameters included in the CoA of the biological oils used as carbon source towards MEL production [192].
Analysis (units) Description Method
Acid value (mg KOH/g)
Number of milligrams of potassium hydroxide required to neutralize the free fatty acids present in 1 g of fat. It is estimated as:
𝐴𝑐𝑖𝑑 𝑣𝑎𝑙𝑢𝑒 = 56.1 ∗ 𝑁qrc ∗ 𝑉
𝑚
m = mass of sample (g). NKOH = Normality of the standardized KOH solution. V = ml of the standardized KOH solution.
EN ISO 660:1999
Moisture and volatile matter content (% m/m)
Loss in mass undergone by the product on heating at 103 °C ± 2 °C under the conditions specified in this method. It is calculated as:
𝑀𝑜𝑖𝑠𝑡𝑢𝑟𝑒 =100 𝑚 − 𝑚'
𝑚
m = mass of sample (g). m1 = mass of dry sample (g).
EN ISO 662:2000
Insoluble impurity content (% m/m)
Consist of the whole foreign substances which are not dissolved in the specified solvent (hexane, diethyl ether or carbon disulphide). Sample is treated in an excess of solvent, filtration of the solution, washing of the filtering systems with the same solvent, drying at 103 ± 2 °C and weighing of the filtering system and dry residue. It is expressed as:
𝐼𝑛𝑠𝑜𝑙. 𝑖𝑚𝑝𝑢𝑟𝑖𝑡𝑖𝑒𝑠 =100 𝑚( − 𝑚'
𝑚
m = mass of sample (g). m1 = mass of filter paper (g). m2 = mass of the filter paper with the insoluble impurities (g).
EN ISO 663:2001

38
(cont…)
Analysis (units) Description Method
Saponification value (mg KOH/g)
It is the number of mg of potassium hydroxide required to saponify 1 g of fat. It is expressed as:
𝑆𝑎𝑝. 𝑣𝑎𝑙𝑢𝑒 =56.1 ∗ 𝑁cu^ 𝑉r − 𝑉'
𝑚
m = mass of sample (g). Vo = ml of the standardized HCl solution used for the blank test. V1 = ml of the standardized HCl used for the test with the fat. NHCl = Normality of the standardized HCl solution.
ISO 3657:2002
Iodine value (g I2/100g)
It is the number of grams of halogen absorbed by 100 g of the fat, and expressed as the weight of iodine.
𝐼𝑜𝑑𝑖𝑛𝑒 𝑣𝑎𝑙𝑢𝑒 = 12.69 ∗ 𝑁xYyzyr 𝑉' − 𝑉(
𝑚
m = mass of sample (g). V1 = ml of the standardized Na2S2O3 solution used for the blank test. V2 = ml of the standardized Na2S2O3 used for the test with the fat. NNa2S2O3 = Normality of the standardized Na2S2O3 solution.
EN 16300:2012
Unsaponifiable matter (% m/m)
It is the total of products present in the sample which, after saponification thereof with an alkaline hydroxide and extraction by a specified solvent, remains non-volatile components. It may include lipids of natural origin such as sterols, higher aliphatic alcohols, pigments, and hydrocarbons as well as any foreign organic matter non-volatile at 103 ± 2 °C (e.g. mineral oils). It can be expressed as:
𝑈𝑛𝑠𝑎𝑝.𝑚𝑎𝑡𝑡𝑒𝑟 =100 𝑚' − 0.28 ∗ 𝑉 ∗ 𝑁qrc
𝑚
m = mass of sample (g). m1 = mass of the residue (g). NKOH = Normality of the standardized KOH solution. V = ml of the standardized KOH solution
EN ISO 3596:2001
Fatty acid analysis (% m/m)
Gives general guidance for the application of gas-liquid chromatography to determine the qualitative and quantitative composition of a mixture of fatty acid methyl esters.
EN ISO 5509:2000 EN ISO 5508:1995

39
Table 11
Description of the experimental conditions to assess the effect of organic acids on MEL production.
Flask / Description Formic acid (g/l) acetic acid (g/l) Control 0 0
Only acetic acid 0 2.01
Ratios 0.03 1.02
Ratios 0.05 0.12
Ratios 0.19 0.29
Ratios 0.24 1.22
Ratios 0.44 0.54
Ratios 0.79 0.27
Ratios 0.85 0.11
Ratios 1.04 1.23
The highest acids concentrations 3.04 1.92
Only formic acid 1.74 0
Plus H2SO4 0.07 1.09
Plus H2SO4 0.80 0.11
Plus H2SO4 0.84 1.09
3.2.2.5 – Environmental assessment
The experimental data obtained from the production of MEL from biological oils were submitted
to Dr. Cristina Matos (European Commission - Joint Research Centre) to perform a short assessment,,
of the environmental performance of the biological oils used in this study. The environmental impacts
were calculated in the SimaPro software for one kg of each of the used oils using the three endpoint
indicators of ReCiPe LCA methodology: human health, use of resources, and the effect on ecosystems.
Data of waste oil collection (considering the transport for 300km in a truck of municipal waste collection),
soybean oil (produced in Brazil and transported to EU) production and rapeseed oil (produced in EU)
production were collected from ECOINVENT3.1 database (Switzerland), while data from poultry oil
production (rendering of chicken fat produced in the Netherlands) were collected from Agri-footprint
gouda © (The Netherlands). The conversion efficiencies obtained in the experimental trials were used
to obtain environmental scores for the oils used standardised by kg of MEL produced using each
biological oil.
3.2.3 – Analytical methods
3.2.3.1 – Yeast growth and viability
Cell growth was followed by quantification of cell dry weight (CDW). CDW was determined with
1 ml of culture broth. Culture broth without oils was centrifuged at 13000 rpm for 5 min, the pellet was
washed twice in water and dried at 63°C for 72 h. Samples from media with oils were processed in the
same manner, but washed twice with a solution of 1-butanol: ethanol (1:1).
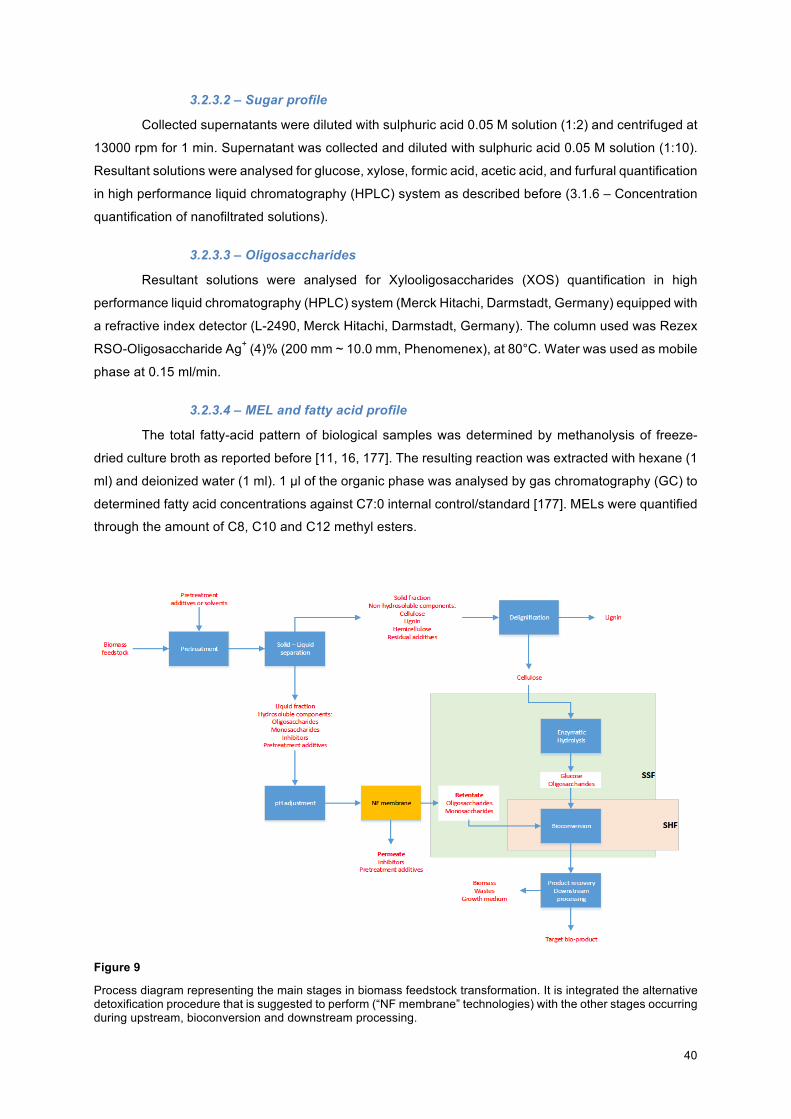
40
3.2.3.2 – Sugar profile
Collected supernatants were diluted with sulphuric acid 0.05 M solution (1:2) and centrifuged at
13000 rpm for 1 min. Supernatant was collected and diluted with sulphuric acid 0.05 M solution (1:10).
Resultant solutions were analysed for glucose, xylose, formic acid, acetic acid, and furfural quantification
in high performance liquid chromatography (HPLC) system as described before (3.1.6 – Concentration
quantification of nanofiltrated solutions).
3.2.3.3 – Oligosaccharides
Resultant solutions were analysed for Xylooligosaccharides (XOS) quantification in high
performance liquid chromatography (HPLC) system (Merck Hitachi, Darmstadt, Germany) equipped with
a refractive index detector (L-2490, Merck Hitachi, Darmstadt, Germany). The column used was Rezex
RSO-Oligosaccharide Ag+ (4)% (200 mm ~ 10.0 mm, Phenomenex), at 80°C. Water was used as mobile
phase at 0.15 ml/min.
3.2.3.4 – MEL and fatty acid profile
The total fatty-acid pattern of biological samples was determined by methanolysis of freeze-
dried culture broth as reported before [11, 16, 177]. The resulting reaction was extracted with hexane (1
ml) and deionized water (1 ml). 1 μl of the organic phase was analysed by gas chromatography (GC) to
determined fatty acid concentrations against C7:0 internal control/standard [177]. MELs were quantified
through the amount of C8, C10 and C12 methyl esters.
Figure 9
Process diagram representing the main stages in biomass feedstock transformation. It is integrated the alternative detoxification procedure that is suggested to perform (“NF membrane” technologies) with the other stages occurring during upstream, bioconversion and downstream processing.

41
3.2.3.5 – Glycerides quantification
A method to estimate monoglycerides (MAG), diglycerides (DAG), and triglycerides (TAG) was
set up in order to know the effective amount of oil consumed by yeast. Moreover, it would indicate us
the chemical structure of residual oil at the end of fermentation. The samples were analysed by HPLC
coupled to a Chromolith Performance RP-18 endcapped (100mm x 4.6mm x 2μm) column. It was used
an HPLC apparatus equipped with an auto sampler (Hitachi LaChrom Elite L-2200), a pump (Hitachi
LaChrom Elite L-2130) and a UV detector (Hitachi LaChrom Elite L-2400) set up at 205nm. The flow
rate was set up at 1ml/min and the injection volume was 20 μl. Three mobile phases were employed:
phase A consisted of 100 % acetonitrile, phase B consisted of water 100% and phase C comprising a
mixture of n-hexane and 2-propanol (4:5, v/v) (Figure 10). It is important to mention that this method
was developed previously by Badenes, S [193]. Quantification was carried out using calibration curves
of Glyceryl trioleate (~65 %, Sigma-Aldrich GmbH) for TAG, 1,3 – Dioelin (≥99% (GC), Sigma-Aldrich
GmbH) for DAG, and 1-oleoyl-rac-glycerol (≥99%, Sigma-Aldrich GmbH) for MAG.
Samples from fermentation broth (50 μl) were extracted adding 1 μl of acetic acid 58.5 mM and 949 μl n-hexane. Mixture was vortexed and centrifuged at 13000 rpm during 2 minutes. Then organic phase was injected into de HPLC system.
Figure 10
Schematic illustration of the HPLC method used for mono-, di-, triglyceride estimation. Taken from Gueiros, [178].
3.2.3.6 – Lipolytic activity
Enzymatic activity rates were estimated by means of a spectrophotometric assay carried out on
a Hitachi U-2000 spectrophotometer [178, 194]. The substrate p – NPB (10 μl) was provided from concentrated stock solutions in acetonitrile (70 mM). Activity assays were performed in 940 - 980 μl of 0.1 M phosphate buffer of pH = 7.2 at 37 ºC, initiated by the addition of enzyme (10 μl) or supernatants samples from fermentation broth (50 – 25 μl). The release of p – nitrophenol was monitored spectrophotometrically at 400 nm (ε400 = 18400 M−1·cm−1). for 2 min reading each 10 seconds. Initial
velocities were calculated as the slope of absorbance over time. p – nitrophenol concentrations (𝑐) were
calculated according to Lambert-Beer equation (Eq. 15) on a 1 cm length cell (𝑙).The assays were
recorded in duplicate varying the sample or enzyme volume.

42
𝐴 = 𝜀 ∗ 𝑙 ∗ 𝑐
(15)
3.3 – MEL isolation
Two different isolation procedures were carried out. The first one was based on liquid-liquid
extractions with ethyl acetate described by Morita, et. al [153]. Typically an equivalent volumes of ethyl
acetate and fermentation broth were added, solutions were mixed for 0.5 min and allowed to settled for
30 minutes. The two phases were separated and an extra equivalent volume of ethyl acetate was added
to the separated aqueous phase to start a second (or third) extraction of the same culture broth. Three
extractions were performed and the solvent-extractant phases collected. Extractions were performed in
separator funnels under manual agitation. The solvent was then evaporated in a rota vapour under
vacuum and the aqueous phase was discarded. The formation of coarse particles in the residue was
observed. Then, an aliquot of the samples of known weight was resuspended in n-hexane for analysis.
Then the samples were filtered through a cellulose acetate membrane (0.45 μm pore size, VWR
International, USA). More operational conditions are detailed in the process flow sheet (Figure 11).
The second procedure is based on two-stage liquid-liquid extractions as described by Rau, et.
al [58]. In the first stage, equivalent volumes of methyl-tert-butyl ether (MTBE) and fermentation broth
were added. Solutions were mixed for 0.5 min and allowed to settled for 30 minutes in separator funnels.
The two phases were separated and an extra equivalent volume of MTBE was added to the separated
aqueous phase to start a second (or third) extraction of the same culture broth. All organic phases were
collected and solvent was then evaporated in a rota vapour under vacuum. The aqueous phase was
discarded. This first stage aims to isolate all lipophilic molecules from the culture broth (aqueous phase).
Then in the second stage, a solution of n-hexane:MeOH:H2O (50 ml: 300 ml: 150 ml) was added
to the residue from the first stage to perform a first extraction. Solutions were mixed in the same manner
as in the first stage. The successive two extractions were done with n-hexane (50 ml) to the aqueous
phase. Organic phases were discarded. MeOH from resultant aqueous phase was evaporated in a rota
vapour under vacuum. Next, samples were lyophilised for 48 hours to remove water. The aim of the
second set of extraction was to pull the SBO to the hexane phase, leaving the MEL isolated in a
methanol:water phase. This procedure was done only for the broths containing oils. In all cases
duplicates were performed. More operational conditions are detailed in the process flow sheet (Figure
12).

43
Figure 11
Process flow sheet representing MEL downstream processing using successive liquid-liquid extractions with ethyl acetate. Operational conditions for centrifugation and vacuum drying are detailed.
Figure 12
Process flow sheet for two-stage liquid-liquid extractions.

44
Table 12 Chemical compounds used to test membranes’ rejection
Name(s) MM (Da) Chemical structure Physical and chemical
properties Formic acid (COOH) Metanoic acid
46.02
pKa = 3.751 (25ºC) [189]
acetic acid (AcOH) Ethanoic acid
60.50
pKa = 4.756 (25ºC) [189]
Glycerol (Gol) 1,2,3-Propanetriol Glycerine
92.09
pKa = 14.14 (25ºC) [189]
Furfural (Fur) 2-Furaldehyde Furan-2-carboxaldehyde
96.08
pKa = NA
D-(+)-Xylose (Xyl) 150.13
pKa = 12.15 (25ºC) [189]
D-(+)-Glucose (Glc) 180.15
pKa = 12.28 (25ºC) [189]
D-(+)-Trehalose (Trh) α-D-Glucopyranosyl-α-D-glucopyranoside
342.296
pKa = NA
D-(+)-Cellobiose (Cel) 4-O-β-D-Glucopyranosyl-D-glucose
342.296
pKa = 12.39 (25ºC) [195]
TRITON® X-100 (TX) 4-(1,1,3,3-Tetramethyl-butyl)phenyl-polyethylene glycol t-Octylphenoxypolyethoxy ethanol Polyethylene glycol tert-octylphenyl ether
646.85
n = 9 - 10
CMC = 0.3 mM (25ºC) [196]

45
Chapter 4 – Results and discussion
4.1 – MEL production from biological oils
4.1.1 – Oils characterisation
The characterization of the raw material of any bioprocess is an important step in order to
maintain under control the whole bioprocess. Moreover, oxidation of unsaturated fatty acids is the main
reaction responsible of the degradation of lipids [197]. into species that can affect cell culture. Therefore,
it is essential to know the their characteristics and determining more precisely their stability during
processing and storage, suitability for applications and possibility to verify their adulteration or quality at
starting of the bioconversion process [198].
The acid value indicates the amount of free fatty acids on oils. As triglycerides are converted
into fatty acids and glycerol, the acid value of fats increases [199]. Then, this quality parameter indicates
how degraded a fat or oil it is. In other terms, the higher the acid value, the more rancid the sample it
becomes. Nonetheless, it also indicates how much an oil has been processed or refined. A refined oil
should have a lower acid value due to the neutralising step during refining [199].
Due to these reasons, poultry oils has the highest acid value (7.44 mg KOH/g) since it is heated
to obtain this material. Then is followed by WFO (4.67 mg KOH/g) that is higher than crude rapeseed oil
(1.87 mg KOH/g) and SBO (1.29 mg KOH/g) (Table 13). This is because WFO has been heated and
been in contact with food. However, WFO didn't overpass poultry oil because commercial oils normally
contain antioxidants such as butylated hydroxytoluene (BHT) or terc-butil-4-hidroxianisol (BHA) [200].
The use of high concentrations of water for processing biological oils is counterproductive
because it promotes oils autoxidation [201]. In the other hand, during deodorisation, volatile components
are removed from the oil by the combination of high temperature, low pressure and stripping action of
steam [199]. Therefore, refined oils should contain lower values of moisture and volatile matter. Among
the assessed oils, there are no significant differences between crude SBO (0.07 % m/m), crude
rapeseed oil (0.08 % m/m), and WFO (0.10 % m/m) (Table 13). However, poultry oil contains the highest
moisture value (0.15 % m/m) due to the fact of the origin of this oil (Table 13). It comes from a category
3 material according to (EC) No 1069/2009. It comprises carcases and parts of animals slaughtered or,
in the case of game, bodies or parts of animals killed, and which are fit for human consumption, but are
not intended for human consumption for commercial reasons [202]. WFO might have a higher moisture
content than crude oils because it has been in contact with food.
Regarding insoluble impurities, poultry oil has the highest value (2.81 % m/m) (Table 13). This
is because of the origin and processing of this oil as mentioned above. Unsaponificable matter was only
analysed in poultry oil (2.71 % m/m) (Table 13). This percentage may comprise sterols (i.e. cholesterol),
pigments (i.e. tocopherols) or any foreign organic matter non-volatile at 103 °C [192].
The saponification value has not considerable variations (189 – 196 mgKOH/g) among the
tested oils (Table 13). The saponification value is linked to the average molecular mass of all fatty acids
[203]. Therefore, the oils that were assessed have similar molecular mass. In contrast to the acid value
that indicates the amount of free fatty acids extracted in 1 g of sample, saponification value indirectly
indicates the amount of KOH that didn’t reacted to saponify the glycerides in 1 g of oil sample [192].

46
In the other side, Iodine value denotes the amount of insaturations on fatty acids chains [192,
203]. Higher Iodine values means more unsaturated fatty acids in the vegetable oil [203]. The crude oils
assessed have the highest values of these parameters: 130 g I2/100g SBO and 110 g I2/100g rapeseed
oil. Furthermore, Iodine values are confirmed in the fatty acid profile. There can be seen that all oils
have more than 68 % of unsaturated fatty acids (Table 13).
The more abundant unsaturated acids in the assessed oils are oleic acid (C18:1) and linoleic
acid (C18:2): WFO (C18:1 = 62.8 %), crude Rapeseed oil (C18:1 = 61.9%), crude SBO (C18:2 = 53.5%),
and poultry oil (C18:1 = 35.9 %) (Table 13). Nonetheless, one thing to highlight is that poultry oil contains
the lowest content of unsaturated acids (68.8 %). This value contrast with the percentages obtained in
the other oils, which are above 80 % of total fatty acids as reported also in the literature [204]. This is
because of the origin. Normally, animal fats have higher amounts of saturated fatty acids [205]. That's
why most of animal fats are solid at 25 ºC.
Table 13 Parameters analyzed in the biological oils that were assessed.
Parameter Poultry oil Crude SBO Crude Rapeseed oil WFO
Acid value (mg KOH/g) 7.44 1.29 1.87 4.67 Moisture and volatile matter content (% m/m) 0.15 0.07 0.08 0.10 Insoluble impurity content (% m/m) 2.81 0.01 0.02 < 0.01 Saponification value (mg KOH/g) 189 195 192 196 Iodine value (g I2/100g) 92 130 110 106 Unsaponifiable matter (% m/m) 2.71 n.a. n.a. n.a. Fatty acid chain --- ---- ---- ----
C14:0 0.5 0.1 0.1 0.1 C16:0 20.4 11.5 5.1 4.9 C16:1 3.5 0.1 0.3 0.1 C18:0 6.2 3.7 1.6 0.1 C18:1 35.9 23.5 61.9 62.8 C18:2 27.1 53.5 19.0 27.9 C18:3 2.3 6.6 9.1 1.5 C20:0 0.1 0.4 0.5 0.4 C22:0 <0.1 n.d. n.d. 0.8 C24:0 0.1 n.d. n.d. n.d. Others 3.9 0.6 2.4 1.4 Saturated 27.3 15.7 7.3 6.3 Unsaturated 68.8 83.7 90.3 92.3
4.1.2 –Screening of different refined SBO concentrations for optimal MEL production by Pseudozyma antarctica PYCC 5048T
The target of this stage was to establish the best carbon intensity and mixing. In the case of
carbon source, there are different approaches and media formulations in the literature (Table 8). Since

47
the main carbon source are vegetable oils, there were found two main formulas that achieved greater
MEL titres at the end (2.3.3.1 – Using vegetable oils as substrates).
Rau et al. added 80 ml of SBO per litre of medium and after 8 days of bioconversion, they
achieved 90 gMEL/l (Table 8) [58]. Then in another trial, Rau et al. decreased the amount of vegetable
oil in the medium (20 mL SBO/l) , but add SBO over the culture gradually as foam controller. In the latter
experiment, they achieved 165 gMEL/l after 11.8 days of bioconversion on fed-batch mode (Table 8).
However, this study would produce MEL on batch mode in shaking flasks. In the current experiment fed-
batch was not considered, still will be essential to understand which was the best initial carbon intensity
for this work experiments and stirring mode (baffles or no baffles).
Figure 13 illustrates oil consumption and Figure 14 MEL production. These results clearly show
that the best condition for MEL synthesis is at a concentration of 72 g/l in plain flasks. Under these
conditions it could be achieved a titre of 18.31 ± 1.12 g/l along with higher productivity (1.83 ± 0.11 g·l-
1·day-1) and yield (0.23 ± 0.01) in comparison to the other tested conditions (Table 14).
Figure 13 Glycerides biotransformation by P. antarctica PYCC 5048T in two different concentrations of SBO (72 g/l and 21.1 g/l);; and two different mixing patterns. Bars comprises the mmol of triglycerides (pale blue), diglycerides (green), and monoglycerides (dark blue) at day 0 and 10 (27 ºC, 250 rpm) (n = 1).
The titres obtained are far from the ones obtained by of Rau et al. (90 – 165 gMEL/l),
however, such values were obtained with different strain one need to take into consideration is that Rau
et al. experiments were performed in fed-batch mode and in larger bioreactors (10 – 30 l) [58, 151].
Nonetheless, it should further mentioned that in the study where 165 gMEL/l were achieved, the authors
also mention that they presented problems of excessive foaming [151]. To overcome that, Rau et al.
added more SBO as antifoaming. Then, SBO was used both as carbon source and as antifoam agent.
Adding to that, an uncontrolled. feed of substrates (glucose, nitrate, yeast extract, and SBO) after nitrate
limitation lead to higher MEL titres and also achieved greater cell protein values. Therefore, although
the authors achieved the highest MEL titres, their report have some limitations. On first, it is not known
0
2
4
6
8
10
12
14
16
0 10 0 10 0 10 0 10
72 g SBO/L - Plain flask
72 g SBO/L - Flask w/ Baffles
21.1 g SBO/L - Plain flask
21.1 g SBO/L - Flask w/ Baffles
Glycerides (mmol)
Triglycerides (mmol)Diglycerides (mmol)Monoglycerides (mmol)
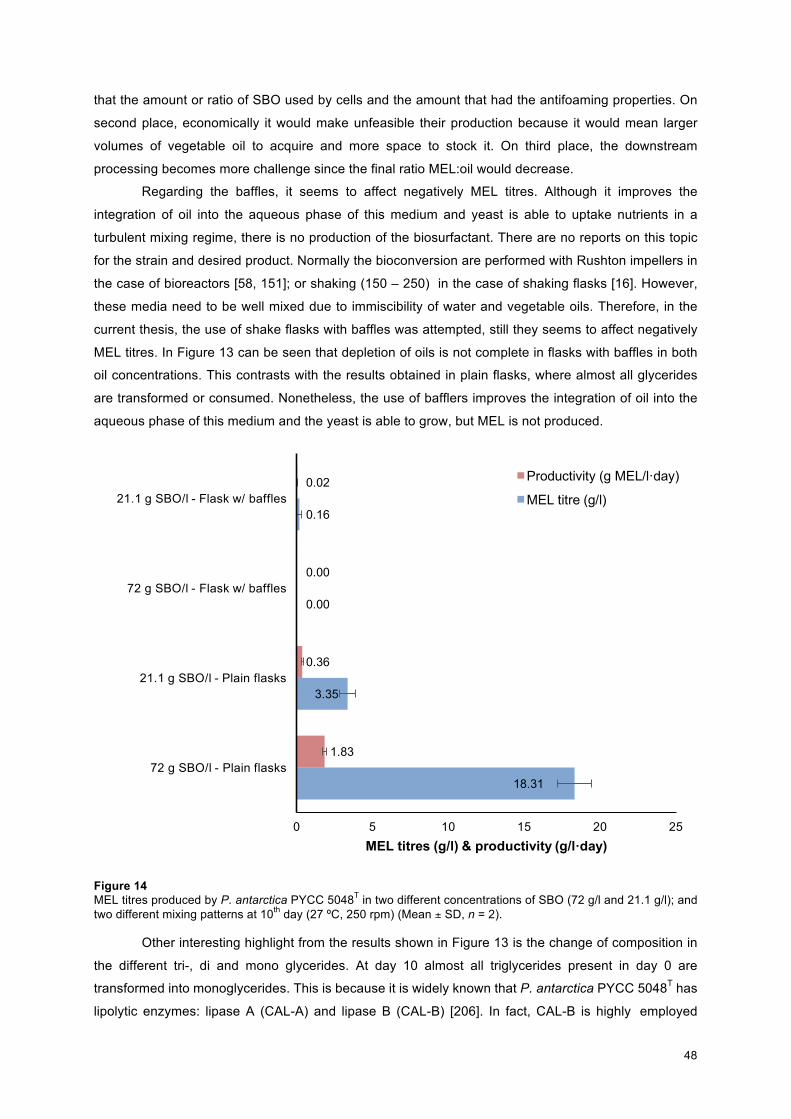
48
that the amount or ratio of SBO used by cells and the amount that had the antifoaming properties. On
second place, economically it would make unfeasible their production because it would mean larger
volumes of vegetable oil to acquire and more space to stock it. On third place, the downstream
processing becomes more challenge since the final ratio MEL:oil would decrease.
Regarding the baffles, it seems to affect negatively MEL titres. Although it improves the
integration of oil into the aqueous phase of this medium and yeast is able to uptake nutrients in a
turbulent mixing regime, there is no production of the biosurfactant. There are no reports on this topic
for the strain and desired product. Normally the bioconversion are performed with Rushton impellers in
the case of bioreactors [58, 151];; or shaking (150 – 250) in the case of shaking flasks [16]. However,
these media need to be well mixed due to immiscibility of water and vegetable oils. Therefore, in the
current thesis, the use of shake flasks with baffles was attempted, still they seems to affect negatively
MEL titres. In Figure 13 can be seen that depletion of oils is not complete in flasks with baffles in both
oil concentrations. This contrasts with the results obtained in plain flasks, where almost all glycerides
are transformed or consumed. Nonetheless, the use of bafflers improves the integration of oil into the
aqueous phase of this medium and the yeast is able to grow, but MEL is not produced.
Figure 14 MEL titres produced by P. antarctica PYCC 5048T in two different concentrations of SBO (72 g/l and 21.1 g/l);; and two different mixing patterns at 10th day (27 ºC, 250 rpm) (Mean ± SD, n = 2).
Other interesting highlight from the results shown in Figure 13 is the change of composition in
the different tri-, di and mono glycerides. At day 10 almost all triglycerides present in day 0 are
transformed into monoglycerides. This is because it is widely known that P. antarctica PYCC 5048T has
lipolytic enzymes: lipase A (CAL-A) and lipase B (CAL-B) [206]. In fact, CAL-B is highly employed
18.31
3.35
0.00
0.16
1.83
0.36
0.00
0.02
0 5 10 15 20 25
72 g SBO/l - Plain flasks
21.1 g SBO/l - Plain flasks
72 g SBO/l - Flask w/ baffles
21.1 g SBO/l - Flask w/ baffles
MEL titres (g/l) & productivity (g/l·day)
Productivity (g MEL/l·day)
MEL titre (g/l)

49
hydrolase in the biocatalysis field [206].
Interestingly, the experiments performed in the presence of baffles, which should have a slower
consumption of carbon source, exhibit an higher content of mono glycerides, whereas triglyceride had
already been consumed or broken down.
Table 14 Data obtained of at day 10 of bioconversion of refined SBO. It includes MEL titres, volumetric productivity, and yield (27 ºC, 250 rpm) (Mean ± SD, n = 2)
MEL titre (g/l) Productivity (g/l·day) Y (P/S) 72 g SBO/l - Plain flasks 18.3 ± 1.1 1.8 ± 0.11 0.23 ± 0.01 72 g SBO/l - Flask w/ baffles 0.0 ± 0.0 0.0 ± 0.0 0.0 ± 0.0
21.1 g SBO/l - Plain flasks 3.4 ± 0.5 0.36 ± 0.05 0.04 ± 0.01 21.1 g SBO/l - Flask w/ baffles 0.16 ± 0.16 0.02 ± 0.02 < 0.01
4.1.3 – Assessment of MEL production using different sustainable oil sources as carbon sources
Different oils were assessed: crude SBO, crude rapeseed oil, poultry oil, and WFO. All of them
at 72 g/l since it was seen that it is the best concentration towards MEL synthesis using SBO. Crude oils
were selected because they they don't pass through refining steps. Then, it means the environmental
impact will be lower in comparison to refined oils. Furthermore, most of the experiments in the literature
use refined oils. Poultry oil and WFO are waste material coming from the food industry. As mention
before, due to the fact of being wastes, they are more environmental sustainable and don’t interfere with
the food chain (see 2.3.3.2 – Alternative substrates).
4.1.3.1 – Biomass and nitrate consumption
In this set of experiments, the control had 72 g/l of glucose (29.31 gCarbon/l) as an attempt to
increase carbon supply. However, as seen in Figure 15, these formulation does not achieve the biomass
values that were obtained in oils. The highest biomass values were achieved with crude SBO (29.5 ±
7.5 g/l) and poultry oil (27.0 ± 2.0 g/l).
The differences on biomass generation could be explained further on the composition of each
oil. Crude oil contains small amounts of naturally occurring materials such as proteinaceous and various
classes of lipids. It consists primarily of neutral lipids, which include tri-, di-, and mono-acylglycerols, free
fatty acids, and polar lipids such as phospholipids. It also contains a minor amount of unsaponifiable
matter that includes phytosterols, tocopherols, and hydrocarbons such as squalene. In addition to that,
it contains small amounts of chlorophyll pigment, oxidation products, and trace metals are found in ppm
concentration. When the oil is refined, concentrations of minor constituents are reduced [207, 208].
Probably some compounds could inhibit their growth, or in the contrary, it may have a positive
effect. However, there are no any study regarding the inhibitory effect on Pseudozyma sp. of any of
these compounds. Further studies in this topic are needed to completely understand these variations
(i.e. heavy metals). In case of inhibition, one possible reason could be the oxidation products coming
from the auto oxidation of oils. The possible effect of these compounds are further explained in the
section 4.1.3.2 – MEL titres.

50
Figure 15 Cell dry weight on different growth media during 10 days of bioconversion (27ºC, 250 rpm). Carbon substrates: Glucose (dark dashed blue line), orange dashed line), crude rapeseed oil (pale blue dash line), poultry oil (purple dashed line), and crude SBO (green dashed line) (Mean ± SD, n = 2).
Figure 16 Nitrates concentration during 10 days of bioconversion on different media by P. antarctica PYCC 5048T (27ºC,
250 rpm). Carbon substrates: Glucose (dark dashed blue line), orange dashed line), crude rapeseed oil (pale
blue dash line), poultry oil (purple dashed line), and crude SBO (green dashed line) (Mean ± SD, n = 2).
Other aspect to highlight is that nitrate consumption is different if glucose is used as carbon
source. Looking at Table 15 and Figure 16 can be noticed that depletion of nitrates is not complete as it
is observed on oil media. These observations have not been pointed out by any author before. However,
0
5
10
15
20
25
30
35
40
0 2 4 6 8 10
Biom
ass (g/l)
Bioconversion time (days)
Glucose (72 g/l)Crude SBO (72 g/l) Poultry oil (72 g/l)Rapeseed oil (72 g/l)WFO (72 g/l)
0.0
0.5
1.0
1.5
2.0
2.5
3.0
3.5
4.0
0 2 4 6 8 10
Nitrates (g/l)
Bioconversion time (days)
Glucose (72 g/l)Crude SBO (72 g/l) Poultry oil (72 g/l)Rapeseed oil (72 g/l)WFO (72 g/l)

51
Rau et al. mentions that MEL primary formation begins after nitrate limitation in oil medium [151].
However, in the current study MEL seems to be formed before complete depletion of nitrate in the oil
media.
4.1.3.2 – MEL titres
In this set of experiments, the control had 72 g/l of glucose as an attempt to increase carbon
intensity. However, Table 15 show that the MEL titres achieved (3.79 ± 0.42 gMEL/l) are clearly lower
than those obtained by oil media. This value is similar to others obtained previously by other authors
using glucose as carbon source. Morita et al. achieved 3.5 g MEL/l with P. antarctica T-34 and under
absence of nitrate and 12% of glucose in the medium [153].
In the other hand, P. antarctica PYCC 5048T has demonstrated to produce 5.4 g MEL/l using
glucose as unique carbon source [11]. However, it was in fed-batch mode with glucose pulses. Another
experiment performed with P. antarctica T-34 achieved 12 g MEL/l also in fed-batch mode with glucose
pulses as well [153]. Then the operation in fed-batch mode helps to improve MEL titres comparing to
batch-mode operation.
Comparing MEL titres from refined SBO (18.31 ± 1.12 gMEL/l) (see 4.1.2 –Screening of different
refined SBO concentrations for optimal MEL production by Pseudozyma antarctica PYCC 5048T) and
crude SBO (13.66 ± 1.58 gMEL/l), there can be noticed that is slightly lower in the medium with crude
SBO. This differences can be explained in the composition of each type of oil.
Due to the facts explained in the previous section regarding the composition of crude oils (see
section 4.1.3.1 – Biomass and nitrate consumption), the titres achieved are lower in crude oil could be
because of the presence of compounds that may inhibit P. antarctica PYCC 5048T’s growth.
Unfortunately, there is no other study regarding the negative effect of these compounds in P. antarctica.
Nonetheless, one possible reason could be the oxidation products coming from the auto oxidation of
oils.
Autoxidation of polyunsaturated lipids of oils involves free radical chain reactions that are
promoted when oils are exposed to light, heat, ionizing radiation, metal ions, or metalloprotein catalysis
[201]. Furthermore, lipoxygenases are capable to begin lipid oxidation [201]. In consequence, reactive
oxygen species (ROS) are produced from these reactions.
Reactive oxygen species (ROS) are necessary for various physiological functions but an
imbalance in favour of reactive oxygen species results in oxidative stress. As in humans, the exposure
of bacteria to ROS causes damage to a variety of macromolecules, resulting in mutations and often in
cell death. Hence, this explains why the MEL titres and other values are lower for crude oils in
comparison to refined oil. At the same time, it might explain why WFO resulted in a much lower MEL
titre. This is because heating catalyses auto oxidation of lipids. However, an analysis of ROS or
peroxides (not performed) could confirm this.
In the case of poultry oil, probably it achieved similar values to crude SBO because it comes
from an animal source. Adding to that, since it comes from category 3 animal sources [209], it may
contain other nutrients that weren’t detected in the characterisation analysis of oils. It might have
minerals or proteins that could be used by the cells. Moreover, according to their fat analysis (see

52
Appendices - i) it has the higher percentage of saturated fats and lower iodine value. Hence, its oxidation
is less probable comparing to the other oils. The results obtained are resumed in Table 15.
Figure 17 MEL titres obtained during 10 days of bioconversion on different carbon sources by P. antarctica PYCC 5048T. Glucose 72 g/l (red dashed line), crude SBO 72 g/l (green dashed line), poultry oil 72 g/l (purple line), crude rapeseed oil 72 g/l (blue line), and WFO 72 g/l (orange dashed line) (27ºC, 250 rpm) (Mean ± SD, n = 2).
Table 15 Data obtained of at day 10 of bioconversion of the different biological oils that were assessed. It includes nitrate consumption, substrate consumption, MEL titres, volumetric productivity, and yield (27 ºC, 250 rpm) (Mean ± SD, n = 2).
Nitrate
consumption (NF/Ni)
Substrate consumption
(CF/Ci) MEL titre (g/l) Productivity
(g·l-1·day-1) Y (P/S)
Glucose (72 g/l) 47.8% 100% 3.79 ± 0.42 0.38 ± 0.04 0.04
Crude SBO (72 g/l) 100% 92.7% 13.66 ± 1.58 1.37 ± 0.16 0.13
Poultry oil (72 g/l) 100% 91.9% 12.89 ± 1.13 1.29 ± 0.11 0.13
Crude Rapeseed oil (72 g/l)
100% 94.7% 11.46 ± 2.18 1.15 ± 0.22 0.11
WFO (72 g/l) 100% 99.3% 8.26 ± 0.85 0.83 ± 0.08 0.08
4.1.3.3 –Lipase activity and oil consumption As mentioned before (see section 4.1.2 –Screening of different refined SBO concentrations for
optimal MEL production by Pseudozyma antarctica PYCC 5048T), P. antarctica PYCC 5048T has
lipolytic enzymes: lipase A (CAL-A) and lipase B (CAL-B) [206]. Therefore, measuring this lipolytic
activity was important to understand the consumption of biological oils. The results obtained are
presented in Figure 18. One thing that clearly stands out that lipolytic activity (U/ml medium) for glucose
media is by far higher than the registered activity on oil media. There is no other study to register or
describe this behaviour in P. antarctica. This result is counter intuitive, since the lipases are more needed
when the substrate used as carbon source by the yeast is the biological oils. Again, the results can also
suggest that when yeast doesn’t have available oil to transform, it produces lipases in an exacerbating
manner to try to recruit potential lower amounts of oil that eventually could be present on their
024681012141618
0 2 4 6 8 10
MEL (g/l)
Bioconversion time (days)

53
surrenders. On the other hand, the lower lipase production, in the presence of higher oil contents, seems
to be enough for the breakdown of such molecules and MEL production. Probably the carbon source
(glucose) is mainly addressed to obtain energy and to promote protein synthesis.
Figure 18 Lipase activity (U/ml) on different growth media during 10 days of bioconversion under conditions specified before. Glucose 72 g/l (red dashed line), crude SBO 72 g/l (green dashed line), poultry oil (purple line), crude rapeseed oil (blue line), and WFO (orange dashed line) (37ºC, 700 rpm) (Mean ± SD, n = 2).
A
B
C
D Figure 19 Specific activity (U/g of protein) vs oil content (total glycerides – g/l) during 10 days of bioconversion under the conditions specified before. A) Poultry oil, B) crude SBO, C) crude rapeseed oil, and D) WFO. The red dashed lines show the total concentration of glycerides in each medium, The blue dashed line shows the data regarding enzymatic activity (37ºC, 700 rpm) (Mean ± SD, n = 2).
0.00.51.01.52.02.53.03.54.04.5
0 2 4 6 8 10
Activity (U/ml)
Bioconversion time (days)
0
50
100
150
200
250
0.00
0.05
0.10
0.15
0.20
0.25
0 5 10
Oil content (g/l)
Specific Activity (U/g)
Bioconversion time (days)
0
50
100
150
200
250
300
0.00
0.05
0.10
0.15
0.20
0.25
0 5 10Oil content (g/l)
Specific Activity (U/g)
Bioconversion time (days)
0
50
100
150
200
0.00
0.05
0.10
0.15
0.20
0.25
0 5 10
Oil content (g/l)
Specific Activity (U/g)
Bioconversion time (days)
020406080100120140160180
0.000.020.040.060.080.100.120.140.160.18
0 5 10
Oil content (g/l)
Specific Activity (U/g)
Bioconversion time (days)

54
A
B
C
D
Figure 20 Chemical changes in the mono-, di-, and triglycerides on different oil sources during 10 days of bioconversion (27ºC, 250 rpm). A) Poultry oil, B) crude SBO, C) crude rapeseed oil, and D) WFO. The red dashed lines show the total glyceride concentration in each medium, Bars express TAG content (pale blue), DAG content (green), and MAG (dark blue) (Mean ± SD, n = 2).
Figure 19 presents the specific lipase activity and oil and total glyceride concentration along the
time. There can be seen in all cases that as the lipase activity (specific activity) increases, the glycerides
concentration decreases. Furthermore, the specific activity in the different media are quantitatively
similar. Figure 20 provides a more detailed analysis on the chemical changes in the tri-, di-and mono-
glycerides concentrations along the time. In all cases, it begins with a high concentration of TAG (86 –
93 % of total glycerides) and ends up with mainly MAG (64 – 100 % of total glycerides). This changes
in are due to the lipolytic characteristics of P. antarctica PYCC 5048T discussed above. There can be
seen further that most of this transformation occurs between day 0 and day 4. By day 4 between 73 –
85 % of total glycerides were transformed or metabolized by the cells. This may suggest that most of
the carbon substrate is up taken during the exponential phase of P. antarctica PYCC 5048T. However,
more biochemical studies are needed to elucidate all the mechanism of MEL synthesis and lipids
metabolism in this strain.
4.1.4 – Environmental assessment
The aim of this study was to asses whether different biological oils could be used to produce
MEL, aiming to search for more sustainable solutions concerning carbon sources. Therefore, it is
important to have a preliminary assessment of environmental performance of the different oils according
0
50
100
150
200
0 4 7 10
g/l
Bioconversion time (Days)
0
50
100
150
200
250
300
0 4 7 10
g/l
Bioconversion time (Days)
0
50
100
150
200
0 4 7 10
g/l
Bioconversion time (Days)
020406080100120140160180
0 4 7 10
g/l
Bioconversion time (Days)

55
with their source Figure 21 was obtained through a preliminary assessment as described in Chapter 3
and metrics obtained were standardised by amount of MEL obtained for each carbon source. It can be
seen that the oils with the lowest total impact is the WFO (303.9 mPt).
This is because this type of oil is a waste from food industry and domestic activities. The other
three oils, are seven or eight times greater on environmental impact than WFO. As seen in Figure 21,
the effect on the ecosystems account between 62 and 78 % of total environmental impact. This impact
on ecosystems is mainly due to the extensive land use for the crops. These results reaches the same
conclusion of a previous study performed by Schmidt [186]. This author performed a comparative study
of five different oils (see section 2.4.2 – Life-Cycle Assessment (LCA) for vegetable oils.) where one of
the conclusions was that the hotspots for GHG emissions for all of the oils were identified in the
cultivation stage of oil crops.
Actually, those preliminary analyses here carried out only tackled the vegetable oil substrate
used. Therefore, a more complete environmental analysis considering upstream, bioconversion and
downstream will be needed to achieve a more accurate conclusion about system sustainability. The use
of biological oils as carbon sources achieved higher MEL titres than when glucose is used. The
assessment of using lignocellulosic substrates for MEL production is yet to be performed and is not in
the scope of this thesis.
Figure 21 Environmental impact on the use of resources, on ecosystems, and human health of WFO (used cooking oils), poultry oil (Fats), crude rapeseed oil (Rapeseed), and crude SBO (Soybean). Databases: ECOINVENT3.1 (Switzerland) and Agri-footprint gouda © (The Netherlands).
4.1.5 – Remarks The results in Table 15, clearly show that the use of biological oils that promote higher MEL
titres, yields, and productivity, were crude SBO, poultry oil, and crude rapeseed oil. Although WFO
achieved higher titres than glucose based media, it values are lower than the other three oils. Therefore,
crude SBO, poultry oil, and crude rapeseed oil could be good candidates to produce MEL from oils.
However, their sustainability of these oils seems to be doubtful due to the environmental impacts they
might have. Due to these facts, lignocellulosic biomass may still hold as a potential candidate to produce

56
MEL in a more sustainable way, particularly considering downstream MEL isolation yields. The following
sections will be focused on the results showing the feasibility to using lignocellulosic biomass towards
MEL production and strategies to manage the existing of toxic inhibitors on the liquid fraction of these
renewable resources.
4.2 – MEL production from lignocellulosic biomass: detoxification and bioconversion
4.2.1 – Membrane selection
The experimental rejections obtained for the compounds detailed in Table 12 obtained for each
membrane were plotted (Figure 22 & Figure 23). From an overall perspective, Polyamide’s membranes
are tighter membranes than polyethersulfone’s membranes (Figure 22). Polyethersulfone’s membranes
clearly shown a poor rejection to sugars and to smaller compounds. Even large Triton-X100 with a MW
of 646.85 g/mol is not completely rejected by these membranes. Considering the size of
oligosaccharides (molecular weight of disaccharides is about 360 g/mol, disaccharides 540 g/mol and
so on) to be rejected, these polyethersulfone’s membranes are not adequate for retaining effectively the
carbon substrates, while permeating the toxic (smaller) compounds. Polyamide membranes are more
suitable for detoxification of lignocellulosic hydrolysates. This because they have high rejection to
sugars;; and permeate smaller toxic molecules like acetic acid and furfural. However, one disadvantage
of these membranes is that they have a smaller operational range of pH than polyethersulfone’s
membranes.
Regarding MWCO, this value couldn’t be determined for polyethersulfone’s membranes with
the tested compounds (Figure 22). Due to the facts explained before, polyethersulfone’s membranes
were not analysed further.
Figure 22 Rejection profile (Eq. (3)) of all tested membranes. NF-PA1 (blue line), NF-PA2 (red line), NF-PES1 (purple line), and NF-PES2 (green line) (20 bar, pH = 2) (Mean ± SD, n = 2).
0%
10%
20%
30%
40%
50%
60%
70%
80%
90%
100%
0 100 200 300 400 500 600 700
Rejection %
Molecular mass (Da)

57
Figure 23 Rejection profile (Eq. (3)) of Polyamide’s membranes. Standard deviation is represented with black vertical bars for each point. Rejection profile of NF-PA1 was obtained at pH=2 (blue continuous line) and at pH=7 (blue dashed line). Also, rejection profile of NF-PA2 was obtained at pH=2 (red continuous line) and at pH=7 (red dashed line) (20 bar) (Mean ± SD, n = 2).
The two smaller solutes, formic acid (46.02 g/mol) and acetic acid (60.50 g/mol) can exist in a
neutral protonated form or ionic conjugate base form according with solution pH. However, furfural
(96.08 g/mol), xylose (150.13 g/mol), glucose (180.15 g/mol) and cellobiose (342.30 g/mol) are always
neutral species. Therefore, their membrane rejection (which can still be dependent on pH due
differences on membrane surface, sugar changes in conformation, or effect of the ionic strength of the
solution), is certainly less susceptible to charge effects induced by pH. Therefore the MWCO was
estimate to these two membranes considering the rejections of the neutral species at values of 180 Da
and above 342 Da for NF-PA2 and NF-PA1 membranes respectively both at pH 2 and pH 7 (Figure 23).
The results clearly show that the rejection of organic acids will depend on the operational pH
range. One aspect that clearly stands out is the difference between the rejection of acids and organic
compounds (i.e. furfural) on polyamide’s membranes. According to molecular mass, it was expected
that acetic acid could permeate easier than furfural due to their lower molecular mass. NF-PA2 rejection
at pH 2 for acetic acid and furfural are both low at values of 11.42 ± 2.07%;; and 10.55 ± 1.00%,
respectively (Figure 23). However, for NF-PA2 rejections at pH 2 for acetic acid and furfural (Figure 23)
are 69.09 ± 4.58% and 37.31 ± 2.48%, whereas the lower rejection would be expected for acetic acid
than furfural. Therefore, the mechanism of rejection is not only dominated by size exclusion.
NF-PA2 membranes provide a more adequate rejection profile, at pH 2, than NF-PA1 for
detoxification of the hemicellulose hydrolysates allowing easier permeation of toxic solutes (i.e. low
rejection) and still a considerable rejection of sugars compounds. Therefore, further studies on effect of
pH in membrane rejections will be mainly focused on this membrane.
0%
10%
20%
30%
40%
50%
60%
70%
80%
90%
100%
0 50 100 150 200 250 300 350
Rejection %
Molecular mass (Da)

58
Figure 24 Chemical pattern for polyamide membranes proposed by Fernández, J. F., et.al. [210]. Black points represent “available” bonds, green points are positive charges (R-NH3+), and hydrophobic potentials are shaded in yellow. Brown point are the negative charges (R-COO-), red points are H donors, blue points are H receptors, and charge transfer areas due to π bonding are shaded in purple.
These rejection differences can be further explained in the aromatic polyamide’s structure
(Figure 24). Aromatic polyamides contains amino groups and carboxyl groups that may be charged or
not depending on experimental conditions;; namely, pH [210–212]. When the membrane is charged, the
rejection of more polar compounds and/or charged molecules will increase. This phenomenon is called
Donnan effect [210, 213]. Since furfural is an aromatic molecule with poor electric dipole moment, it is
able to diffuse easier than acetic acid trough the membrane.
Furthermore, Weng, et al., Brás, et al., and Liu, et al. have highlighted that molecular shape and
hydrophobicity of solutes are important factors during nanofiltration with aromatic polyamide membranes
[189, 211, 214]. For instance, sugars’ ring conformation may prevent from permeating through
membrane [214]. Therefore, to successfully permeate the inhibitors and reject sugars, it is essential to
eliminate the exclusion of inhibitors due to Donnan effect and let sieving mechanism to predominate
[189]. This could be achieved if feed’s pH is maintained below inhibitors’ pKa [189, 211]. Therefore, pH
becomes a critical control point and pKa values, presented in Table 12 should be taken into account to
define the operational conditions to detoxify hemicellulosic hydrolysates. Chemically, that means to
increase the concentration of protonated species of these organic acids instead of completely
dissociated ionic species. Doing that, the sieving mechanism of rejection will predominate over the
Donnan effect. Figure 25, clearly shows that both size exclusion and Donnan effect command the
rejection mechanism for organic acids in NF-PA2 membrane. There, the compound’s rejection increases
as the pH increases. This fact contrasts with sugars and aromatic molecules rejection, where only size
exclusion seems to control their permeation because their rejection is maintained over time. Therefore,
these results explain further why acetic acid seems to have a higher rejection percentage than furfural
in Figure 22.
These observations regarding pH contribution on rejection were also described before by Choi
et al., Weng et al. and Brás et al. [211, 215, 216]. They concluded that, as this study, pH increase
contributes to an increase in rejection. At pH 4.7, the acid constant dissociation was exceeded for both
acids. The majority of the acid molecules are hence present in their dissociated form, as anions, which
turns the solution negatively charged. At the same time, the membrane acquires also a negative charge
due to R-COO- groups. In consequence, the exclusion of weak acids intensifies.
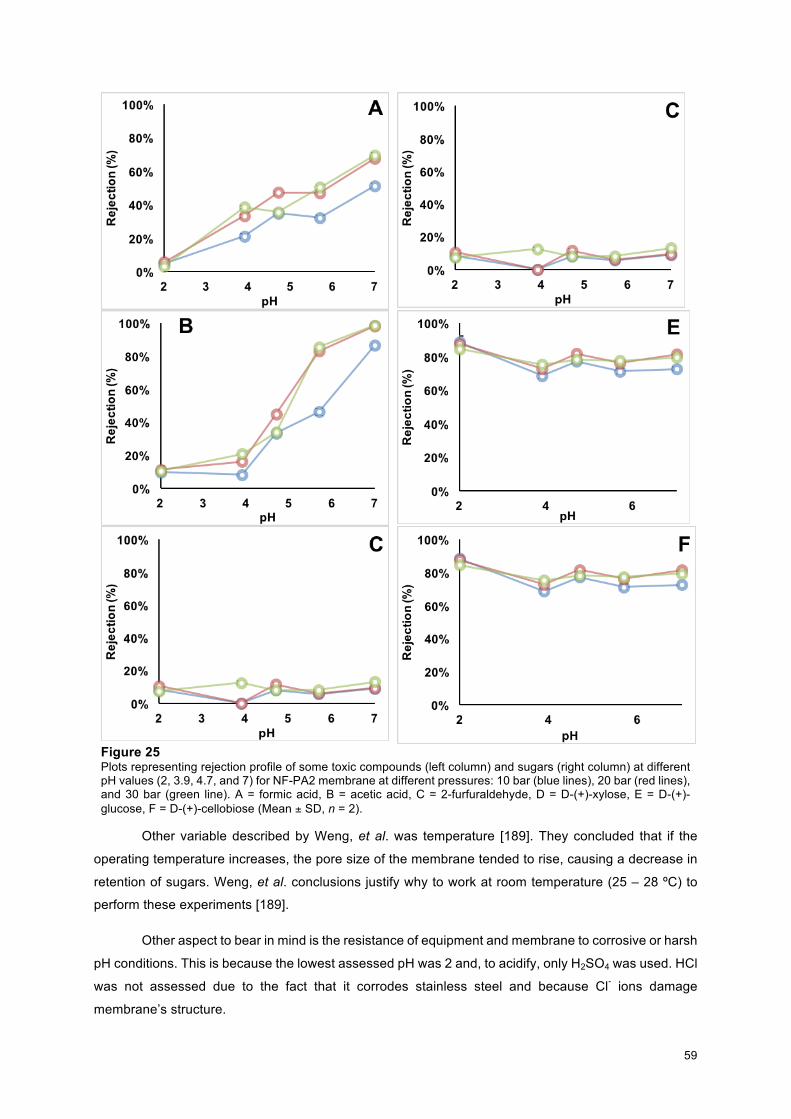
59
Figure 25 Plots representing rejection profile of some toxic compounds (left column) and sugars (right column) at different pH values (2, 3.9, 4.7, and 7) for NF-PA2 membrane at different pressures: 10 bar (blue lines), 20 bar (red lines), and 30 bar (green line). A = formic acid, B = acetic acid, C = 2-furfuraldehyde, D = D-(+)-xylose, E = D-(+)-glucose, F = D-(+)-cellobiose (Mean ± SD, n = 2).
Other variable described by Weng, et al. was temperature [189]. They concluded that if the
operating temperature increases, the pore size of the membrane tended to rise, causing a decrease in
retention of sugars. Weng, et al. conclusions justify why to work at room temperature (25 – 28 ºC) to
perform these experiments [189].
Other aspect to bear in mind is the resistance of equipment and membrane to corrosive or harsh
pH conditions. This is because the lowest assessed pH was 2 and, to acidify, only H2SO4 was used. HCl
was not assessed due to the fact that it corrodes stainless steel and because Cl- ions damage
membrane’s structure.
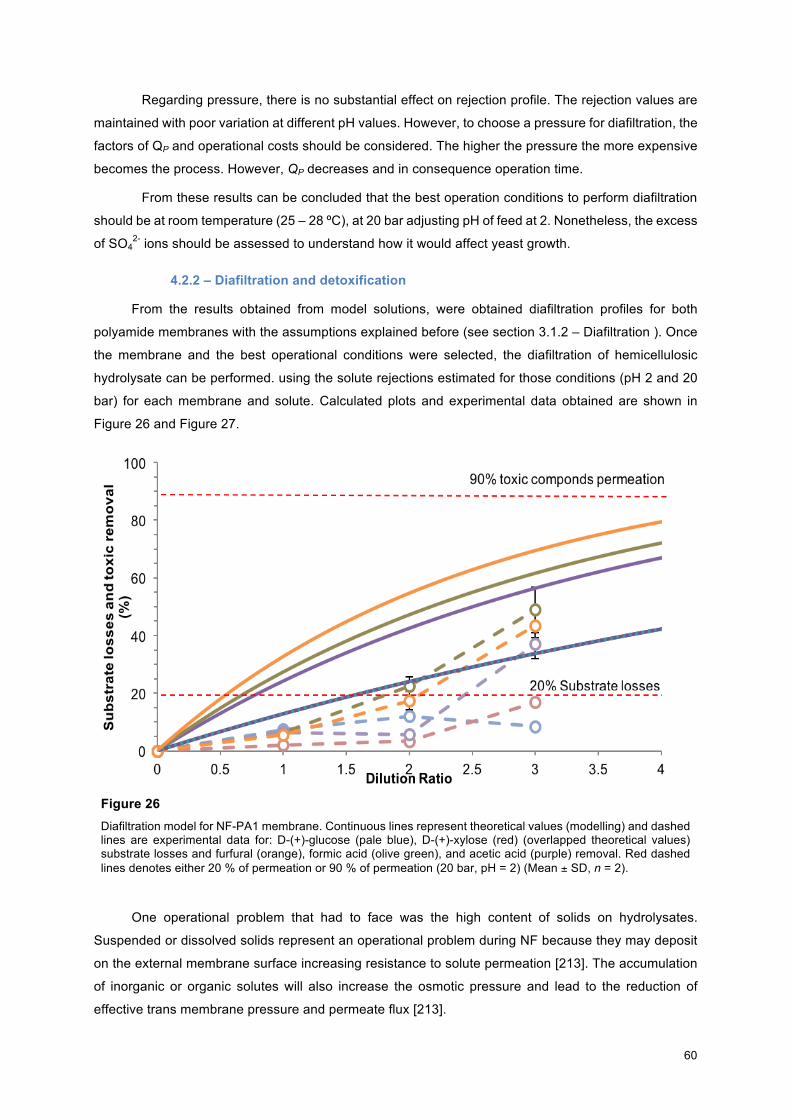
60
Regarding pressure, there is no substantial effect on rejection profile. The rejection values are
maintained with poor variation at different pH values. However, to choose a pressure for diafiltration, the
factors of QP and operational costs should be considered. The higher the pressure the more expensive
becomes the process. However, QP decreases and in consequence operation time.
From these results can be concluded that the best operation conditions to perform diafiltration
should be at room temperature (25 – 28 ºC), at 20 bar adjusting pH of feed at 2. Nonetheless, the excess
of SO42- ions should be assessed to understand how it would affect yeast growth.
4.2.2 – Diafiltration and detoxification
From the results obtained from model solutions, were obtained diafiltration profiles for both
polyamide membranes with the assumptions explained before (see section 3.1.2 – Diafiltration ). Once
the membrane and the best operational conditions were selected, the diafiltration of hemicellulosic
hydrolysate can be performed. using the solute rejections estimated for those conditions (pH 2 and 20
bar) for each membrane and solute. Calculated plots and experimental data obtained are shown in
Figure 26 and Figure 27.
Figure 26 Diafiltration model for NF-PA1 membrane. Continuous lines represent theoretical values (modelling) and dashed lines are experimental data for: D-(+)-glucose (pale blue), D-(+)-xylose (red) (overlapped theoretical values) substrate losses and furfural (orange), formic acid (olive green), and acetic acid (purple) removal. Red dashed lines denotes either 20 % of permeation or 90 % of permeation (20 bar, pH = 2) (Mean ± SD, n = 2).
One operational problem that had to face was the high content of solids on hydrolysates.
Suspended or dissolved solids represent an operational problem during NF because they may deposit
on the external membrane surface increasing resistance to solute permeation [213]. The accumulation
of inorganic or organic solutes will also increase the osmotic pressure and lead to the reduction of
effective trans membrane pressure and permeate flux [213].

61
Due to that, the hydrolysate was centrifuged and filtered before diafiltration to avoid these
phenomena diafiltration was performed using a tangential flux to to reduce membrane damage and
fouling [188]. Still the experimental data obtained obtained using the diafiltration of the hemicellulose
hydrolysates at pH 2 corresponds to operational rejections considerable higher than the ones obtained
in synthetic aqueous solutions, which can be advantageous considering substrate losses, but more
challenging considering the removal of toxic compounds.
Figure 27 Theoretical and experimental permeation of sugars and toxic compounds on NF-PA2 membrane (20 bar, pH = 2). Continuous lines represent theoretical values (modelling) and dashed lines are experimental data for: D-(+)-glucose (indigo), D-(+)-xylose (red) (theoretical values overlapped) substrate losses and furfural (orange), formic acid (green), and acetic acid (purple) removal. Horizontal red dashed lines denotes either 20 % of permeation of substrates or 90 % of permeation of toxic compounds (Mean ± SD, n = 2).
This permeation differences between the model and experimental results could be also due to
interactions between membrane-solutes that may interfere with solutes rejections [211]. In addition to
that, hydrolysate’s composition is more complex than model solutions. Nonetheless, fouling is another
factor that may affect solutes’ rejection and operation times [211].
Although a solid-liquid separations techniques were done, during the trial a reduction of QP was
noticed even in tangential flux (from 0.7 ml/min to 0.3 ml/min), which can be resulting of membrane
fouling. Most probably this would be the reason the experimental data don't fit in the model. In fact,
during the diafiltration was noticed a permeate flux decrease and the formation of a brownish layer on
the membrane area. .Although the study of fouling mechanisms have been documented, until now it still
remains difficult to predict which mechanism involves in a membrane operation [213]. Fouling
mechanism might change from one to another after the membrane process being operated for some
time or affected by feed properties [213].
0
20
40
60
80
100
0 0.5 1 1.5 2 2.5 3 3.5 4
Substrate losses and toxic removal (%)
Dilution Ratio
20% Substrate losses
90% toxic componds permeation

62
Additionally, to fouling mechanisms, the effect of osmotic pressure can impact in membrane
performance. This because the accumulation of inorganic or organic solutes will increase the osmotic
pressure of the solution and lead to the reduction of effective transmembrane pressure and permeate
flux [213].
Probably another variable that should be included, is the shift of pH during the diafiltration.
Measured values ranges between 2.0 and 2.6 in the retentate. Although these values might not
significant, it could help to predict more accurately the permeation of wheat straw hydrolysates.
One advantageous feature of these trials is that sugars are rejected more than expected. This
could also be helpful if it is needed to perform more diavolumes to achieve higher toxics removal. In the
other hand, in Figure 26 can be seen that there could be achieved a lower removal of organic acids
(below 49 %) comparing to Figure 27 (above 43 %). Even furfural removal in NF-PA2 (80 %) was higher
than in NF-PA1 (43.5 %). Then, NF-PA2 seems to be the best option to detoxify wheat straw
hydrolysates.
Brás, et al. reported for the first time a detoxification of hemicellulose hydrolysates from
extracted olive pomace using NF membranes [211]. They had success on removing toxic compounds,
but with the drawback of high sugars loss, especially pentoses that achieved 50 % of losses. However,
this problem was not presented in this experimental study. This may indicate that the membrane which
is used and the origin of the hydrolysate may influence the detoxification performance.
4.2.3 – Effects of organic acids on MEL production
Due to the fact that the liquid fractions contains organic acids, it was important to understand
how these compounds may interfere with the MEL production. However, the production of MEL is linked
to biomass formation, as seen before when oils were used as carbon source (see section 4.1.5 –
Remarks). In the other hand, it was relevant to know whether the excess of sulphate in the medium,
would affect negatively the production of MEL. This excess of sulphate comes from the addition of H2SO4
to adjust the pH to 2 before diafiltration, which was required to remove effectively the acetic acid. Recall
that was shown previously that the rejection profile depends on the pH of the feeding and on the
dissociation of these compounds (see section 4.2.1 – Membrane selection).
In Figure 28 can be noticed that the samples that contains higher amounts of both acids (1.92
g/l Acetic acid : 3.04 g/l Formic acid) or higher amounts of formic acid (1.74 g/l formic acid) reach the
lowest biomass values of these series. In the other side, the following conditions overpassed the
biomass achieved by the control (6 g/l biomass):
1) [0.29 g/l Acetic acid: 0.19 g/l Formic acid] = 9 g/l;;
2) [1.23 g/l Acetic acid: 1.04 g/l Formic acid] = 8 g/l;;
3) [0.12 g/l Acetic acid: 0.05 g/l Formic acid] = 8 g/l;;
4) [1.02 g/l Acetic acid: 0.03 g/l Formic acid] = 8 g/l.
Regarding the effect of sulphuric acid on biomass formation, there couldn't be seen significant
differences. Nonetheless, the samples with lower formations of biomass have the higher rate of glucose
consumption as noticed in Figure 29.

63
In previous study performed in Saccharomyces cerevisiae by Guo, et. al. they concluded that
acids, at moderate concentrations, can stimulate the glycolytic flux [217]. Although there are no bio
molecular studies in Pseudozyma sp., it seems that it might have some adaptive response to acid stress.
Figure 28
Biomass concentrations during 10 days of bioconversion on different ratios of organic acids (upper graph: day 0 and 4;; below graph: day 7 and 10). Samples with higher formic acid concentration are coloured in dark orange or in dark green. The control (40 g/l D-(+)-Glucose) is shown in the blue bars. The samples containing H2SO4 are presented in the green bars. The samples formulated without sulphuric acid are grouped in the orange bars. The bars are presented in the following order from left to right: 1) [1.92 g/l acetic acid : 3.04 g/l formic acid];; 2) [1.23 g/l acetic acid : 1.04 g/l formic acid];; 3) [0.54 g/l acetic acid : 0.44 g/l formic acid];; 4) [0.29 g/l acetic acid : 0.19 g/l formic acid];; 5) [0.12 g/l acetic acid : 0.05 g/l formic acid];; 6) [1.74 g/l formic acid];; 7) [0.11 g/l acetic acid : 0.86 g/l formic acid];; 8) [0.27 g/l acetic acid : 0.79 g/l formic acid];; 9) [1.22 g/l acetic acid : 0.24 g/l formic acid];; 10) [1.02 g/l acetic acid : 0.03 g/l formic acid];; 11) [2.01 g/l acetic acid];; 12) Control (40 g/l D-(+)-glucose);; 13) [1.07 g/l acetic acid : 0.84 g/l formic acid + H2SO4];; 14) [0.11 g/l acetic acid : 0.80 g/l formic acid + H2SO4];; 15) [1.09 g/l acetic acid : 0.84 g/l formic acid + H2SO4] (27ºC, 250 rpm) (n = 1).
In Figure 30, there can be seen the same trend of biomass results. The higher MEL titres are
achieved were formic acid is at low concentrations (0.03 – 0.24 g/l formic acid) along with acetic acid
1.92%g/l%Acetic%acid%:%3.04%g/l%Form
ic%acid
1.23%g/l%Acetic%acid%:%1.04%g/l%Form
ic%acid
0.54%g/l%Acetic%acid%:%0.44%g/l%Form
ic%acid
0.29%g/l%Acetic%acid%:%0.19%g/l%Form
ic%acid
0.12%g/l%Acetic%acid%:%0.05%g/l%Form
ic%acid
1.74%g/l%Form
ic%acid
1.74%g/l%Form
ic%acid
0.11%g/l%Acetic%acid%:%0.86%g/l%Form
ic%acid
0.27%g/l%Acetic%acid%:%0.79%g/l%Form
ic%acid
1.22%g/l%Acetic%acid%:%0.24%g/l%Form
ic%acid
1.02%g/l%Acetic%acid%:%0.03%g/l%Form
ic%acid
2.01%g/l%Acetic%acid
2.01%g/l%Acetic%acid
Glucose
Glucose
1.07%g/l%Acetic%acid%:%0.84%g/l%Form
ic%acid%+%H2SO4
0.11%g/l%Acetic%acid%:%0.80%g/l%Form
ic%acid%+%%%H2
SO4
1.09%g/l%Acetic%acid%:%0.07%g/l%Form
ic%acid%+%H2SO4
0
1
2
3
4
5
6
0 4
Biom
ass,(g/l)
Bioconversion,time,(days)1.23%g/l%Acetic%acid%:%1.04%g/l%Form
ic%acid
0.54%g/l%Acetic%acid%:%0.44%g/l%Form
ic%acid
0.29%g/l%Acetic%acid%:%0.19%g/l%Form
ic%acid
0.12%g/l%Acetic%acid%:%0.05%g/l%Form
ic%acid
1.74%g/l%Form
ic%acid
1.74%g/l%Form
ic%acid
0.11%g/l%Acetic%acid%:%0.86%g/l%Form
ic%acid
0.27%g/l%Acetic%acid%:%0.79%g/l%Form
ic%acid
1.22%g/l%Acetic%acid%:%0.24%g/l%Form
ic%acid
1.02%g/l%Acetic%acid%:%0.03%g/l%Form
ic%acid
2.01%g/l%Acetic%acid
2.01%g/l%Acetic%acid
Glucose
Glucose
1.07%g/l%Acetic%acid%:%0.84%g/l%Form
ic%acid%+%H2SO4
0.11%g/l%Acetic%acid%:%0.80%g/l%Form
ic%acid%+%%%H2
SO4
1.09%g/l%Acetic%acid%:%0.07%g/l%Form
ic%acid%+%H2SO4
0
1
2
3
4
5
6
7
8
9
10
7 10
Biom
ass,(g/l)
Bioconversion,time,(days)

64
concentrations between 1.02 – 1.22 g/l. Moreover, these media attained the highest values of
productivity and yield (Table 16).
Therefore, based on the results obtained from biomass and MEL production, the most
hydrophilic acid (formic acid), showed higher growth inhibition and MEL production than acetic acid. This
might be due to the smaller molecular size of formic acid, which can facilitate its diffusion through the
cell membrane, and possibly resulted in higher toxicity in cytoplasm [217].
Adaptation of the yeast to the inhibitory action of weak acids involves many different resistant
mechanisms, for instance, ATP-dependent efflux of protons and anions and cellular membrane
remodelling [217, 218]. However, the precise details of these mechanisms in counteracting the effects
of acids on yeast still remains unclear.
Regarding the effect of initial concentration of sulphuric acid on MEL titres, it can be notices that
MEL production is negatively affected by this variable (Figure 31). When P. antarctica grows in similar
conditions, including organic acid concentrations, the MEL titres are lower when this yeast grows with
an excess of sulphate (2.4 g/l SO42-). This becomes another technical problem to overcome since this
excess of sulphuric acid will come from the pH adjustment to two to perform the detoxification on NF
membranes.
Figure 29 Residual glucose concentrations at 4th (Orange bars), 7th (blue bars), and 10th (purple bars) day of bioconversion (27ºC, 250 rpm) (n = 1).
48.0542.08
38.56 40.9947.44
38.22 39.7441.66
36.18
48.15 47.33
39.82
0.70
7.05
3.25
12.31 22
.07
3.10 4.80
0.00
14.49 20.67
23.12
15.00
0.00
0.00
0.00
0.00
0.00
0.00
0.00
0.00
0.00
0.00 2.36
0.00
0
10
20
30
40
50
60
Residual glucose (%)
Day 4 Day 7 Day 10

65
Figure 30 MEL titres achieved at day 10 of bioconversion by P. antarctica (27 ºC, 250 rpm) (n = 1).
Figure 31 MEL titres achieved at 10th day of bioconversion by P. antarctica. The control (40 g/l D-(+)-Glucose) is presented as a white bar. On the left of control are grouped the samples formulated without sulphuric acid. The bars placed on the right side of the control show the data for those formulas supplemented with sulphuric acid. Values on the top of these bars display the MEL titre for these samples. Bars are ordered in the following order: 1) [1.23 g/l acetic acid: 1.04 g/l formic acid];; 2) [0.11 g/l acetic acid : 0.86 g/l formic acid];; 3) [0.12 g/l acetic acid : 0.05 g/l formic acid];; 4) Control;; 5) [1.07 g/l acetic acid : 0.84 g/l formic acid + H2SO4];; 6) [0.11 g/l acetic acid : 0.80 g/l formic acid + H2SO4];; 7) [1.09 g/l acetic acid : 0.84 g/l formic acid + H2SO4] (27 ºC, 250 rpm) (n = 1).
Nonetheless, as yeast cellular physiology depends on the environmental conditions, the
responses obtained on synthetic media used in the current study might be different to hemicellulosic
hydrolysates. This because these hydrolysates have a more complex composition.
0.796
1.675 1.6561.531
0.972
1.358 1.333
1.6221.896 1.962
2.183
0.0
0.5
1.0
1.5
2.0
2.5
1
MEL (g/l)
Day 10
1.92 g/l Acetic acid : 3.04 g/l Formic acid 1.23 g/l Acetic acid : 1.04 g/l Formic acid0.29 g/l Acetic acid : 0.19 g/l Formic acid 0.12 g/l Acetic acid : 0.05 g/l Formic acid1.74 g/l Formic acid 0.11 g/l Acetic acid : 0.86 g/l Formic acid0.27 g/l Acetic acid : 0.79 g/l Formic acid 2.01 g/l Acetic acidGlucose 1.22 g/l Acetic acid : 0.24 g/l Formic acid1.02 g/l Acetic acid : 0.03 g/l Formic acid
1.675
1.358
2.183
1.896
1.0561.156
1.624
0.0
0.5
1.0
1.5
2.0
2.5
1
MEL (g/l)
Day 10

66
Table 16
Substrate consumption, MEL titre, volumetric productivity, and yield obtained from the bioconversion from the acids assays at 10TH day (27 ºC, 250 rpm) (Mean ± SD, n = 2).
Substrate
consumption (CF/Ci)
MEL titre (g/l)
Productivity (g/l·day)
Y (P/S)
1.92 g/l acetic acid : 3.04 g/l formic acid 100% 0.80 0.08 0.01
1.23 g/l acetic acid : 1.04 g/l formic acid 100% 1.67 0.17 0.03
0.54 g/l acetic acid : 0.44 g/l formic acid 100% 1.72 0.17 0.03
0.29 g/l acetic acid : 0.19 g/l formic acid 100% 1.66 0.17 0.03
0.12 g/l acetic acid : 0.05 g/l formic acid 100% 1.53 0.15 0.03
2.01 g/l acetic acid 100% 1.62 0.16 0.03
1.74 g/l formic acid 100% 0.97 0.10 0.02
0.11 g/l acetic acid : 0.86 g/l formic acid 100% 1.36 0.14 0.02
0.27 g/l acetic acid : 0.79 g/l formic acid 100% 1.33 0.13 0.02
1.02 g/l acetic acid : 0.03 g/l formic acid 100% 2.18 0.22 0.04
1.22 g/l acetic acid : 0.24 g/l formic acid 100% 1.96 0.20 0.03
Glucose (Control) 100% 1.90 0.19 0.03
0.11 g/l acetic acid : 0.80 g/l formic acid + H2SO4 100% 1.16 0.12 0.02
1.09 g/l acetic acid : 0.07 g/l formic acid + H2SO4 100% 1.62 0.16 0.03
1.07 g/l acetic acid : 0.84 g/l formic acid + H2SO4 100% 1.06 0.11 0.02
4.2.4 – Assessment of the effect of inorganic ions on MEL production.
Since previous experiments shown that sulphuric acid has a negative effect on MEL titres, other
options came up as possible replacers. Furthermore, it was important to know whether the excess of
Na+ ions could have a negative effect on the MEL titres.
In Figure 32, there can be appreciated that the biomass formations does not have significant
differences among the samples that were tested. Even though the control sample did not show a
significant difference to the other samples.
In the other hand, MEL titres shown in Figure 33 suggest that MEL titres are affected negatively
by the excess of these ions in the medium. Other trend that can be seen is that KOH. This might suggest
that potassium ions are more suitable towards MEL production. However, the condition that achieved
the highest MEL titre at 14th day was the one containing 1.04 mmol de H3PO4 and neutralised with KOH.
Although K+ has been proven to be indispensable for diverse cellular purposes, such as enzyme
activation. However, there is still uncharacterized cellular targets that may exist inside the cells [219].
Therefore, phosphoric acid and neutralisation with KOH might be a second option to replace sulphuric
acid to adjust pH before diafiltration

67
Figure 32 Biomass formation during 14 days of bioconversion (27ºC, 250 rpm). The control medium is presented as the navy blue line. The medium containing [D-(+)-glucose + sulphuric acid + sodium hydroxide] is presented as a red line. The medium containing [D-(+)-glucose + sulphuric acid + potassium hydroxide] is presented as a green line. The medium containing [D-(+)-glucose + phosphoric acid + potassium hydroxide] is presented as a purple line. The medium containing [D-(+)-glucose + nitric acid + potassium hydroxide] is presented as a pale blue line (n = 1).
Figure 33 MEL titres achieved at 7th, 10th, and 14th day of bioconversion under influence of different inorganic ions (27ºC, 250 rpm). The control values are shown in the navy blue bars. The medium containing [D-(+)-glucose + sulphuric acid + sodium hydroxide] is presented as a red bar. The medium containing [D-(+)-glucose + sulphuric acid + potassium hydroxide] is presented as a green bar. The medium containing [D-(+)-glucose + phosphoric acid + potassium hydroxide] is presented as a purple bar. The medium containing [D-(+)-glucose + nitric acid + potassium hydroxide] is presented as a pale blue bar (n = 1).
4.2.5 - Bioconversion of wheat straw hemicellulose hydrolysate for MEL production After detoxification of wheat straw hydrolysates, the bioconversion of resultant retentates of
each diafiltration were done under the conditions specified before. The results obtained from the
detoxified hydrolysates using the two polyamide membranes (NF-PA1 and NF-PA2) are shown on next
to compare their detoxification capabilities for these hydrolysates. The media composition obtained after
3 diavolumes for each of the hydrolysates are resumed in Table 17. The solutions were autoclaved and
the compositions obtained were resumed in the same Table 17. Slight differences in solute
concentrations before and after autoclave, resulted from evaporation and heat decomposition.
0
2
4
6
8
10
12
0 2 4 6 8 10 12 14
Biomass (g/l)
Bioconversion time (day)
Control (40 g/l glucose)Glu+H2SO4+NaOHGlu+H2SO4+KOHGlu+H3PO4+KOHGlu+HNO3+KOH
2.45
3.523.2
1.49
2.502.0
1.66
2.61 2.4
1.65
2.56 2.72.85 2.952.5
00.51
1.52
2.53
3.54
7 10 14
MEL (g/l)
Bioconversion time (day)
Control (40 g/l glucose) Glu+H2SO4+NaOH Glu+H2SO4+KOH Glu+H3PO4+KOH Glu+HNO3+KOH

68
Table 17
Concentrations of D-(+)-glucose, D-(+)-xylose, formic acid, acetic acid, and 2-furfuraldehyde in wheat straw hemicellulosic hydrolysate after detoxification (3 D) (20 bar, pH = 2) either with NF-PA1 or NF-PA2 for MEL production. (Mean ± SD, n = 2;; n = 1 (detoxified, NF-PA1))
NF-PA1 NF-PA2
Substrate / Inhibitor Detoxified (3 D)
80 % v/v Detoxified (autoclaved)
Detoxified (3 D)
80 % v/v Detoxified (autoclaved)
D-(+)-glucose (g/l) 0.66 38.43 ± 0.11 0.53 ± 0.03 38.91 ± 0.22
D-(+)-xylose (g/l) 1.72 3.92 ± 0.11 1.47 ± 0.14 2.29 ± 0.10
Formic acid (g/l) 1.22 2.49 ± 0.60 1.12 ± 0.30 0.96 ± 0.21
Acetic acid (g/l) 1.68 3.36 ± 0.88 0.32 ± 0.13 0.19 ± 0.01
2-furfuraldehyde (g/l) 0.38 0.47 ± 0.01 0.03 ± 0.03 0.06 ± 0.03
XOS (g/l) n.a. n.a. n.a. 10.48 ± 3.22
Table 17 clearly shows that hemicellulosic hydrolysate from NF-PA1 has higher concentrations
of toxic compounds than NF-PA2’s hydrolysate;; both after detoxification and after autoclaving. NF-PA1’s
hydrolysate (3.36 ± 0.88 g/l) has 5 times as much of acetic acid as NF-PA2 (0.19 ± 0.01 g/l) has after
autoclaving. Moreover, the furfural concentration is NF-PA1 (0.47 ± 0.01 g/l) is nearly 8 times as much
as NF-PA2 (0.06 ± 0.03 g/l) has after autoclaving. Formic acid concentration doesn't seem to have
significant differences between NF-PA1 and NF-PA2 after detoxification. However, the concentration
after autoclaving in NF-PA1 nearly doubles the original value (1.22 to 2.49 ± 0.60 g/l). The increase of
glucose after autoclaving in both membranes is due to the supplementation with glucose to simulate the
cellulose-rich (solid) fraction of pre-treated wheat straw. The supplementation with glucose might be
replaced by glucose obtained from the cellulose through enzymatic hydrolysis, by combining the solid
fraction with the detoxified liquid fraction. The increase of xylose concentration in the flasks after
autoclaving, can be due to evaporation or heat decomposition of XOS.
Comparing the concentrations of formic acid and acetic acid in Table 16 and Table 17, it would
be expected that MEL titres to decrease up to 0.8 gMEL/l as it has similar concentrations of the sample
[1.92 g/l acetic acid : 3.04 g/l formic acid (10th day)]. Nonetheless, the effect of furfural has not considered
in this experiment. Furthermore, from the experimental data from 4.2.3 – Effect of organic acids on MEL
production can be seen that the inhibitory effect is more notorious when the toxic compounds are present
in the same medium in highest concentrations that were tested and also that formic acid has a higher
inhibitory effect (1.74 g/l formic acid rendered 0.97 gMEL/l). This inhibitory effect of formic acid is further
confirmed in the medium containing 5.4 g/l of formic acid (0.58 ± 0.01 gMEL/l) where MEL titres
decreased almost 1.6 times. In the other hand, all the media containing the toxic compounds separately
(0.6 g/l 2-furfuraldehyde, 5 g/l of acetic acid, and 5.4 g/l of formic acid) could support the yeast growth.
Figure 34 also suggest that the formic acid has a more negative effect on MEL titres than acetic acid;;
and even more than 2-furfuraldehyde in MEL production.
Nonetheless, the literature has pointed out that 2-furfuraldehyde has the greatest inhibitory
effect in S. cerevisiae towards bioethanol production [12, 13, 220]. It might suggest that P. antarctica is

69
a resistant strain to some aromatic compounds. However, in the literature there are no any study
performed on this yeast strain to understand its susceptibility to certain xenobiotic compounds.
Therefore, further studies in this matter are needed to understand P. antarctica metabolism.
Table 18
Substrate consumption (CF/ Ci), MEL titre, volumetric productivity, and yield obtained from the bioconversion using wheat straw hemicellulosic hydrolysate from NF-PA1 (18TH day) and NF-PA2 (14th day) membrane (27 ºC, 250 rpm). Some data from Table 16 (purple shaded) was added for comparison purposes (Mean ± SD, n = 2;; n = 1 acids assay).
Substrate
consumption (CF/Ci)
MEL titre (g/l) Productivity (g/l·day) Y (P/S) Biomass
(g/l)
40 g/l Glucose (Control 1 – NF-PA1) 100% 2.01 ± 0.09 0.11 ± 0.01 0.02 6.5 ± 0.5
40 g/l Glucose (Control 1 – NF-PA2) 100 % 2.84 ± 0.05 0.20 ± 0.0 0.05 8.0 ± 0.0
40 g/l Glucose + Sulphuric acid + NaOH (Control 2 – NF-PA1)
100% 1.30 ± 0.01 0.07 ± 0.0 0.03 3.5 ± 0.5
40 g/l Glucose + Sulphuric acid + NaOH (Control 2 – NF-PA2)
100 % 1.24 ± 0.21 0.09 ± 0.02 0.03 4.0 ± 0.0
80% v/v non-detoxified hydrolysate (NF-PA1) 0% 0.0 ± 0.0 0.0 ± 0.0 0.00 < 1.0
80% v/v non-detoxified hydrolysate (NF-PA2) 0% 0.0 ± 0.0 0.0 ± 0.0 0.00 < 1.0
80% v/v Detoxified hydrolysate (NF-PA1) 0% 0.0 ± 0.0 0.0 ± 0.0 0.00 < 1.0
80 % Detoxified hydrolysate (NF-PA2) 97 % 1.47 ± 0.09 0.10 ± 0.01 0.03 9.5 ± 0.5
40% v/v non-detoxified hydrolysate (NF-PA1) 0% 0.0 ± 0.0 0.0 ± 0.0 0.00 < 1.0
20% v/v non-detoxified hydrolysate (NF-PA1) 98% 0.67 ± 0.09 0.04 ± 0.01 0.01 5.5 ± 0.5
0.6 g/l 2-furfuraldehyde (18th day) 100% 1.29 ± 0.06 0.07 ± 0.0 0.03 6.5 ± 0.5
5 g/l acetic acid (18th day) 99% 1.47 ± 0.26 0.08 ± 0.02 0.03 5.5 ± 0.5
5.4 g/l formic acid (18th day) 98% 0.58 ± 0.01 0.03 ± 0.0 0.01 4.5 ± 0.5
1.07 g/l Acetic acid : 0.84 g/l Formic acid + H2SO4 (10th day)
100% 1.06 0.11 0.02 6.0
1.92 g/l Acetic acid : 3.04 g/l Formic acid (10th day)
100% 0.80 0.08 0.01 4.0
1.22 g/l acetic acid : 0.24 g/l formic acid (10th day)
100% 1.96 0.20 0.03 7.0
2.01 g/l acetic acid (10th day) 100% 1.62 0.16 0.03 7.0
1.74 g/l formic acid (10th day) 100% 0.97 0.10 0.02 5.0

70
The detoxification in NF-PA1 was not enough to let P. antarctica to grow and, in consequence,
to produce MEL. From Table 18 can be noticed that the medium containing the detoxified hydrolysate,
didn't allowed the yeast to grow and therefore the glucose could not be consumed (Figure 36). However,
it was expected that the yeast could grow and rendering low MEL titres. As mentioned before, the effect
of furans and other inhibitory compounds, such as phenolic molecules [12].
In the other side, it was important to know at which concentration of hydrolysate the inhibition
of cell growth occurs. Table 18 shows that the growth of P. antarctica could be achieved in the medium
containing 20 % of non-detoxified hydrolysate due to the dilution effect of inhibitory compounds. But not
at 40 % and 80 % of non-detoxified hydrolysate were the dilution was not enough. Knowing this, it would
help to set the detoxification levels are needed to produce MEL from wheat straw hydrolysate (Figure
36).
Despite the fact the cells were able to grow in the media containing 20% v/v of hydrolysate, the
MEL titres, productivity, and yield are nearly three times lower than the reference and nearly two times
lower than the medium with 2-furfuraldehyde and acetic acid (Table 18, Figure 34, Figure 35). This might
indicate that the inhibitory effect is more notorious when these compounds have a synergistic effect.
Regarding the substrate consumption (CF/CI), in Table 18 can be realized that above 97 % of
carbon substrate were consumed in the media were P. antarctica grew and produced the biosurfactant.
Nevertheless, the yields are not the same (Table 18). Therefore, it might suggest that the carbon up
taken by cells are used to other physiological needs (i.e. energy). However, there are no enough data
in the literature regarding metabolism of P. antarctica.
Figure 34 MEL titres achieved at day 18 of bioconversion (27 ºC, 250 rpm). The bars are displayed in the following order from left to right: 40 g/l Glucose (blue bar), 40 g/l glucose supplemented with 2.4 g/l H2SO4 and neutralised with NaOH (red bar), 80 % v/v of non-detoxified hydrolysate (gap), 40 % v/v detoxified hydrolysate (gap), 20 % v/v detoxified hydrolysate (pale blue bar), 0.6 g/l 2-furfuraldehyde (orange bar), 5 g/l acetic acid (blue navy bar), 5.4 g/l of formic acid (vermilion bar), and 80 % v/v detoxified hydrolysate (gap) (Mean ± SD, n = 2).
Figure 35 MEL titres at day 14. Numbers inside bars denotes MEL titres’ values on different media: 40 g/l Glucose (blue bar), 40 g/l glucose supplemented with 2.4 g/l H2SO4 (red bar), 80 % v/v of non-detoxified hydrolysate (gap), and 80 % v/v detoxified hydrolysate (purple bar) (Mean ± SD, n = 2).
2.005
1.295
0.000
0.000
0.6711.294 1.465
0.582
0.000
0.0
0.5
1.0
1.5
2.0
2.5
18
MEL (g/l)
Bioconversion time (days)
2.84
1.24
0.0
1.47
0
0.5
1
1.5
2
2.5
3
3.5
MEL titer

71
Figure 36 Biomass values during 18 days of bioconversion on different media: 40 g/l Glucose (blue dashed line), 40 g/l glucose supplemented with 2.4 g/l H2SO4 and neutralised with NaOH (red line), 80 % v/v of non-detoxified hydrolysate (green dashed line), 40 % v/v detoxified hydrolysate from NF-PA1 (purple dotted line), 20 % v/v detoxified hydrolysate (pale blue dashed line), 0.6 g/l 2-furfuraldehyde (orange continuous line), 5 g/l acetic acid (indigo continuous line), 5.4 g/l of formic acid (pink continuous line), and 80 % v/v detoxified hydrolysate (pale green continuous line) (27 ºC, 250 rpm) (Mean ± SD, n = 2).
Figure 37 Biomass concentrations during 14 days of bioconversion on different media: 40 g/l Glucose (blue dashed line), 40 g/l glucose supplemented with 2.4 g/l H2SO4 (red line), 80 % v/v of non-detoxified hydrolysate (green dashed line), and 80 % v/v detoxified hydrolysate (purple dotted line) (Mean ± SD, n = 2).
In contrast with the detoxified hydrolysate obtained from NF-PA1 membrane, the retentate
obtained from NF-PA2 could promote the growth of P. antarctica and MEL production 14 days.
Comparing Table 17, Figure 26, and Figure 27, can be noticed that NF-PA2 was able to detoxify further
the hemicellulosic hydrolysate. NF-PA2 membrane was able to remove almost twice as much of 2-
furfuraldehyde than NF-PA1 (se sections 4.2.1 – Detoxification performed on NF-PA1 & 4.2.4.2 –
Detoxification performed on NF-PA2).
During this experiment, P. antarctica could achieve higher values of biomass at day 14th in the
detoxified hydrolysate than the control (Figure 37, Table 18). Comparing the MEL titre attained by this
medium and the medium containing 20 % v/v of non-detoxified hydrolysate from NF-PA1 diafiltration,
figures clearly show that this detoxified hydrolysate was able to achieve twice as much MEL titres than
the medium with 20 % v/v of non-detoxified hydrolysate (0.67 ± 0.09 gMEL/l) (Table 17).
Although in this trial higher MEL titres were achieved (1.47 ± 0.09 gMEL/l) than the trial from
NF-PA1 diafiltration, it is still twice as less than the controls 1 in MEL titres, productivity, and yield (Table
18). Moreover, as seen in the trial of 18 days, the medium containing 80 % v/v of non-detoxified
hydrolysate was not able to support P. antarctica development in 14 days. In consequence, instead of
glucose consumption, there is glucose concentration due to evaporation in the flasks (Figure 38).
0
1
2
3
4
5
6
7
8
0 10
Biom
ass (g/l)
Bioconversion time (days)
0
2
4
6
8
10
12
0 5 10
Biom
ass (g/l)
Bioconversion time (days)

72
Figure 38 Glucose concentrations during 18 days of bioconversion on different media: 40 g/l Glucose (blue dashed line), 40 g/l glucose supplemented with 2.4 g/l H2SO4 and neutralised with NaOH (red line), 80 % v/v of non-detoxified hydrolysate (green dashed line), 40 % v/v detoxified hydrolysate from NF-PA1 (purple dotted line), 20 % v/v detoxified hydrolysate (pale blue dashed line), 0.6 g/l 2-furfuraldehyde (orange continuous line), 5 g/l acetic acid (indigo continuous line), 5.4 g/l of formic acid (pink continuous line), and 80 % v/v detoxified hydrolysate (pale green continuous line) (27 ºC, 250 rpm) (Mean ± SD, n = 2).
Figure 39 Glucose concentrations during 14 days of bioconversion on different media: 40 g/l Glucose (blue dashed line), 40 g/l glucose supplemented with 2.4 g/l H2SO4 (red line), 80 % v/v of non-detoxified hydrolysate (green dashed line), and 80 % v/v detoxified hydrolysate (purple dotted line) (Mean ± SD, n = 2).
Then in Figure 40 and Figure 41 are summarized in a whole from upstream to bioconversion.
There can be appreciated the changes in the parameters measured for this trial. Something that clearly
stands out is that there is an increase of xylose concentration as glucose is depleted by the yeast at day
7. This hydrolytic capability (not measured in this study) can be followed by the formation/disappearance
of oligosaccharides, penta-, tetra-, tri-, di-, and monosaccharides during the bioconversion [221]. Since
this hydrolysate comes from the liquid fraction, XOS concentrations were changing along the days of
this biological process. In Figure 40 the concentration of total XOS decreases as the bioconversion goes
on. In fact, when xylose concentration rises, the concentration of total XOS decreases. This
demonstrates that this yeast has xylanolytic capabilities. These hydrolytic properties have been
described by Faria, N. before [14]. However, further enzymatic analyses are needed to quantify the
hydrolytic activity from P. antarctica PYCC 5048T.
Moreover in Figure 40 can be noticed that xylose concentration drops by 10th day. This indicates
the ability of the yeast to metabolize xylose and probably because of that the yeast was able to increase
biomass. The capability of P. antarctica PYCC 5048T to use pentoses as carbon source has been
reported before by Faria, et. al in batch mode [11]. These authors were able to achieve 4.9 ± 1.9 gMEL/l
(20 g/l glucose + 20 g/l xylose), 5.4 ± 1.2 gMEL/l (40 g/l glucose);; and 4.8 ± 1.0 gMEL/l (40 g/l xylose)
with biomass concentrations from 9.1 – 10.6 g/l. These titres reached by Faria, et. al in batch mode are
05101520253035404550
0 10 20
Glucose (g/l)
Bioconversion time (days)
0
10
20
30
40
50
60
0 5 10
Glucose (g/l)
Bioconversion time (days)

73
as nearly twice as higher as those gotten in this study [11]. Nonetheless, it is important to point out that
in this study a more complex mixture was added and these authors worked with defined medium.
Furthermore, it seems that this strain when grows in the presence of glucose, produces the hydrolytic
enzymes that needs to breakdown other substrates. These substrates may be uptaken afterwards. This
would help to increase biomass and in consequence MEL titres. Also this increase of hydrolytic activity
was seen in the lipolytic activity of this strain (see section 4.1.3.3 – Lipase activity and oil consumption).
However, further enzymatic studies are needed to confirm this.
In the case of the non-detoxified hydrolysate, there are no considerable changes in the
concentrations. The slight increase of the concentration of the measured compounds could be due to
the evaporation of water and in consequence the concentration of solutes (Figure 41).
Figure 40 Detoxified wheat straw hydrolysate. Plot summarizes the changes of glucose (purple dashed line), xylose (red dashed line), formic acid (green dashed line), acetic acid (pale blue dashed line), furfural (dark blue line), XOS (indigo continuous line), and biomass (orange line) in the detoxified wheat straw hydrolysate. It begins with the upstream processing. This includes its reception (crude) and detoxification trough NF membrane. Day 0 of bioconversion shows the values after supplementation with glucose (40 g/l) and autoclaving (Mean ± SD, n = 2).
0
5
10
15
20
25
30
35
40
45
0
2
4
6
8
10
12
14
16
Glucose (g/l)
Xylose, Acetic acid, Formic acid, Furfural, Biomass,
XOS(g/l)
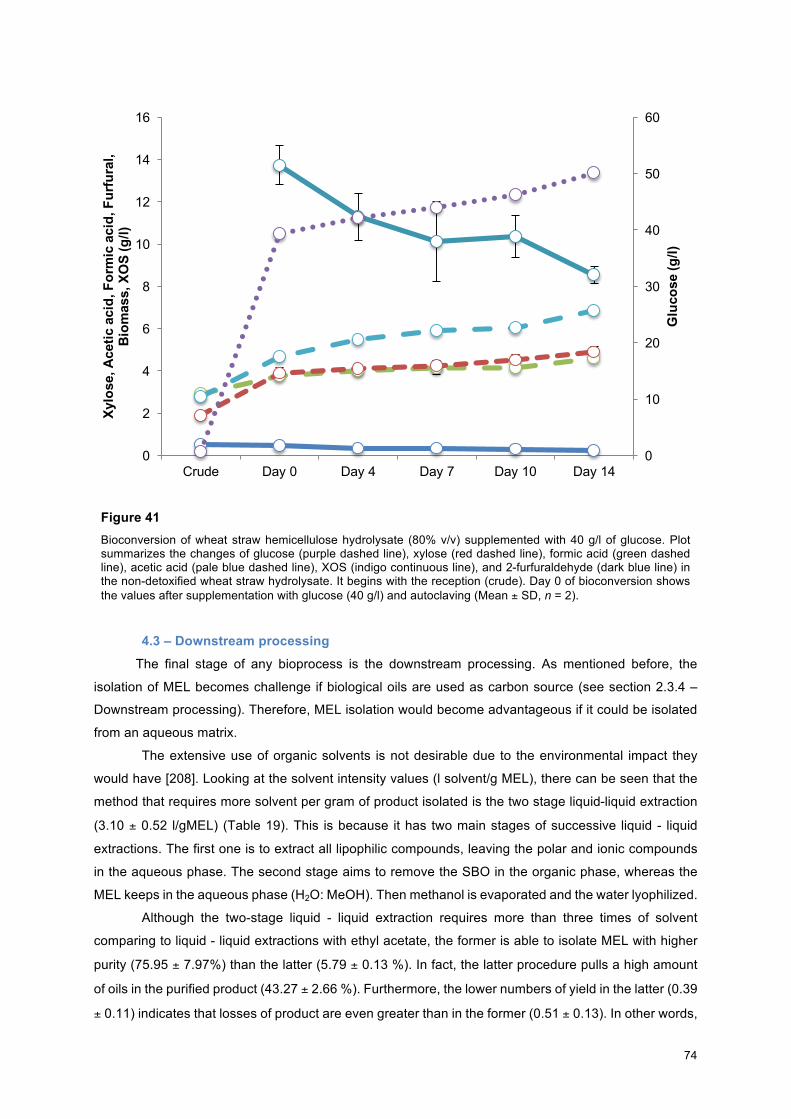
74
Figure 41 Bioconversion of wheat straw hemicellulose hydrolysate (80% v/v) supplemented with 40 g/l of glucose. Plot summarizes the changes of glucose (purple dashed line), xylose (red dashed line), formic acid (green dashed line), acetic acid (pale blue dashed line), XOS (indigo continuous line), and 2-furfuraldehyde (dark blue line) in the non-detoxified wheat straw hydrolysate. It begins with the reception (crude). Day 0 of bioconversion shows the values after supplementation with glucose (40 g/l) and autoclaving (Mean ± SD, n = 2).
4.3 – Downstream processing The final stage of any bioprocess is the downstream processing. As mentioned before, the
isolation of MEL becomes challenge if biological oils are used as carbon source (see section 2.3.4 –
Downstream processing). Therefore, MEL isolation would become advantageous if it could be isolated
from an aqueous matrix.
The extensive use of organic solvents is not desirable due to the environmental impact they
would have [208]. Looking at the solvent intensity values (l solvent/g MEL), there can be seen that the
method that requires more solvent per gram of product isolated is the two stage liquid-liquid extraction
(3.10 ± 0.52 l/gMEL) (Table 19). This is because it has two main stages of successive liquid - liquid
extractions. The first one is to extract all lipophilic compounds, leaving the polar and ionic compounds
in the aqueous phase. The second stage aims to remove the SBO in the organic phase, whereas the
MEL keeps in the aqueous phase (H2O: MeOH). Then methanol is evaporated and the water lyophilized.
Although the two-stage liquid - liquid extraction requires more than three times of solvent
comparing to liquid - liquid extractions with ethyl acetate, the former is able to isolate MEL with higher
purity (75.95 ± 7.97%) than the latter (5.79 ± 0.13 %). In fact, the latter procedure pulls a high amount
of oils in the purified product (43.27 ± 2.66 %). Furthermore, the lower numbers of yield in the latter (0.39
± 0.11) indicates that losses of product are even greater than in the former (0.51 ± 0.13). In other words,
0
10
20
30
40
50
60
0
2
4
6
8
10
12
14
16
Crude Day 0 Day 4 Day 7 Day 10 Day 14
Glucose (g/l)
Xylose, Acetic acid, Formic acid, Furfural,
Biom
ass, XOS (g/l)

75
is more efficient to extract residual oils than the target product.
Comparing SBO medium against glucose medium, table data show that liquid - liquid extractions
with ethyl acetate is more effective to isolate MEL from the broth containing hydrophilic substrates
(glucose). This procedure achieves nearly 13 times more purity than the dual-stage liquid - liquid
extractions. Moreover, the amount of fatty acids extracted with hydrophilic substrates is considerably
lower than in SBO medium. Regarding solvent intensity, there is a slightly difference between glucose
based media and the medium formulated with 72 g/l of oil if the extractions are performed with ethyl
acetate. The higher the value, the lower the amount of recovered product.
Table 19
MEL recovery using two different procedures on two different carbon sources (oils and sugars) used in the medium. The reported parameters are purity/concentration, yield of operation (Y) and solvent intensity (litres of solvent per gram of produced MEL). (Mean ± SD, n = 2 (SBO);; n = 3 (glucose)).
Liquid-liquid extractions with ethyl acetate Two-stage liquid-liquid extractions
Medium Purity (%)
Y (MELF/MELi)
Solvent intensity (l solvent/gMEL)
Purity (%)
Y (MELF/MELi)
Solvent intensity (l solvent/gMEL)
72 g/l SBO
MEL 5.79 ± 0.13 0.39 ± 0.11 1.16 ± 0.36
75.95 ± 7.97 0.51 ± 0.13 3.10 ± 0.52 Fatty
acids 43.27 ± 2.66 --- 0.0 ± 0.0 ---
40 g/l Glucose
MEL 79.66 ± 11.31 0.82 ± 0.12 1.30 ± 0.18
--- --- --- Fatty
acids 1.32 ± 0.60 --- --- ---
Previously, Gueiros, I. isolated MEL according to the procedures of two-stage liquid - liquid
extractions [178]. Comparing the data obtained by this author (Y = 0.53;; 69 % purity), the data of this
study are similar to those achieved by this researcher. Nonetheless, Rau, et. al successfully reached
100 % w/w of purity but with a high amount of losses (Y = 0.08) [58].
Although it wasn't isolated MEL from lignocellulose hydrolysates, it is expected to behave as a
medium containing glucose. Therefore, liquid - liquid extractions with ethyl acetate seems that is the
most suitable extraction procedure to isolate MEL from broths. Nonetheless, it would be important to
develop another isolation procedure where no or minimal amount of organic solvent is used to improve
sustainability of this bioprocess.

76
Chapter 5 – Conclusions
This is the first time that MEL is produced from the liquid fraction of wheat straw hydrolysate. In
the literature, most the attempts have been done towards bioethanol production [12] or using the solid
fraction of wheat hydrolysate [16]. Furthermore, it is also the first time that more oil sources are tested
comparatively along with their environmental impact towards MEL production.
As mentioned above, Brás, et al. reported for the first time a detoxification of hemicellulose
hydrolysates from extracted olive pomace using NF membranes to obtain xylitol after the bioconversion
by Debaryomyces hansenii NRRL Y-1448 [211]. However, these authors lost a high amount of sugars
and in this study this problem could be overcame using other type of membrane.
Comparing with other reported detoxification methods, NF presented a clear advantage on the
removal of aliphatic acids, specially over activated charcoal [222–224] and surpassing treatments with
ion-exchange resins [222, 223, 225], one of the best strategies reported in the literature for this purpose
so far [222, 226, 227]. The removal of furans is promising. Such high removal has being only achievable
using expensive evaporation processes [228], which tend to concentrate other (non-volatile)
compounds, such as phenolic compounds.
Also it is important to bear in mind that actually there is a lack of molecular studies on
Pseudozyma sp. to understand its metabolism (i.e. transcriptomics, metabolomics). When cells
consumes vegetable oils, the biosynthetic pathway of fatty acids to build up MEL is complex and
comprises a novel chain-shorting pathway containing β -oxidation [229]. Nonetheless, it is still unknown
how fatty acids are synthesized using glucose as carbon source towards MEL production. The fatty
acids of MEL produced from glucose should be synthesized de novo. This because it is generally known
that glucose represses β – oxidation pathway [229]. However, more biochemical studies are needed to
elucidate all the mechanism of MEL synthesis. For example, to decipher the role-play of NADPH
consumption since it seems to influence β –oxidation [11];; or why glucose is leaded to produce mainly
energy and lipases as seen in the results of this study.
Regarding downstream processing, it is important to mention that solvent extraction has been
recognized by the US Environmental Protection Agency (EPA) as a major hazardous air pollutant [208].
Actually, liquid - liquid extraction with solvent is the unique procedure described to isolate this
biosurfactant. Therefore, for a future industrial implementation, it is essential to find out other sustainable
strategies to isolate MEL from the medium. This would further decrease the environmental impact of this
biosurfactant.
This work compares for the first time two main carbon sources to produce MEL: biological oils
and lignocellulosic hydrolysates (Table 20). The advantages of using oils is that they are renewable
sources and achieve high MEL titres comparing to lignocellulosic hydrolysates. Nonetheless, their
downstream processing becomes compelling since the target product has similar miscible properties of
oils and yields tend to be low, which in turn increases operational costs. Furthermore, their
environmental impact seems to be high because of the extensive use of land that is needed for the
crops. In addition to that, it is a product targeted to human consumption and it is a highly volatile
commodity in the international markets.

77
In the other side, lignocellulose is an hydrophilic substrate where the isolation of MEL using
liquid - liquid extraction becomes easier and less solvent intensive. In addition to that, a material that is
considered an agricultural waste can be reused to obtain a product with applications in many areas.
Also wheat straw is a renewable material that doesn't need to use more land area to obtain this raw
material. Nevertheless, the operational costs of NF membranes and lower MEL titres represents the
major drawback of this carbon source.
Table 20
Advantages and disadvantages of the two main groups of carbon sources studied for this thesis work.
Biological oils Lignocellulosic materials Advantages Renewable material.
Higher MEL titres. Renewable material. Longer shelf-life. No land intensive. Agricultural waste that can be reused. Extraction is less solvent intensive. Does not compete with the food chain.
Disadvantages Extraction is high solvent intensive. Land intensive due to the crops. Shorter shelf-life due to chemical and enzymatic changes that occurs in oils. Product consumed for human feeding.
Long upstream processing is required: pre-treatment and detoxification. Operational cost of NF technologies. Lower MEL titres.
Finally, weighing the pros and cons of each carbon substrate, it seems that the best carbon
source are the lignocellulosic derivatives. The positive aspects worth the efforts done to improve the
technologies to exploit them and to reduce their operation costs. In the long term, it would turn
sustainable the production of biosurfactants. Furthermore, they certainly will contribute to reduce the
impact of the human activities and consumption of non-renewable resources.

78
Chapter 6 – Future opportunities
Although some questions could be answered in this study, other topics come up. Regarding P.
antarctica lipolytic activity, it would be important to understand why there is an exacerbated productions
of lipases when the yeast grows in a medium that only has glucose as carbon substrate. Furthermore,
it might suggest that in order to Increase MEL titres from oils, probably on first cells should grow on
glucose and after achieving a high lipolytic activity, provide feedings of oils to hydrolyse them. Maybe it
would turn more efficient oil metabolism.
In the other hand, it was noticed that most of the remaining oil after the end of the bioconversion
step exist in the form of MAG. This could help to design a new strategy of isolation for the downstream
processing. Probably a molecular sieve aided by NF technologies could help to isolate MEL from oils in
a more efficient manner.
Other topic that need further study is the understanding of xylanolytic activity in P. antarctica.
As seen in the results, this strain was able to hydrolyse XOS present in the liquid fraction. However, the
enzymatic activity was not quantified in this study. This would help to understand better the mechanisms
that the yeast has to grow in the presence of alternative carbon sources.
Also a robust Design of Experiment is needed to understand the synergistic effect of inhibitors.
This because the results show that cells are able to grow and produce MEL when one of these
compounds is in the medium. But when cells are exposed to more than one, their productivity is
negatively affected. The results would further help to improve the detoxification techniques because it
would define the minimum parameters that let the yeast to grow.

I
References 1. Pauline M. D: Bioprocess Development : An Interdisciplinary Challenge. In Bioprocess Engineering;; 1994.
2. Simpson R, Sastry SK: Chemical and Bioprocess Engineering. New York, NY: Springer New York;; 2013.
3. Vaclavik VA, Christian EW: Milk, Fermentation, and Fermented and Nonfermented Dairy Products. In Essentials of Food Science. Third Edit. Edited by Heldman DR. Springer Science+Business Media, LLC.;; 2008:149–173.
4. Macrelli S, Mogensen J, Zacchi G: Techno-economic evaluation of 2nd generation bioethanol production from sugar cane bagasse and leaves integrated with the sugar-based ethanol process. Biotechnology for Biofuels 2012:22.
5. Sims REH, Mabee W, Saddler JN, Taylor M: An overview of second generation biofuel technologies. Bioresource Technology 2010:1570–1580.
6. Randelli F: An integrated analysis of production costs and net energy balance of biofuels. Reg Environ Chang 2009, 9:221–229.
7. Timmis K, de Lorenzo V, Verstraete W, Garcia JL, Ramos JL, Santos H, Economidis I, Nogales B, Timmis JK, Fonseca C, Pruzzo C, Karagouni A, Panopoulos N, Dixon B: Pipelines for New Chemicals: A strategy to create new value chains and stimulate innovation-based economic revival in Southern European countries. Environ Microbiol 2014, 16:9–18.
8. Singh PB, Saini HS: Exploitation of Agro-Industrial Wastes to Produce Low-Cost Microbial Surfactants. In Biotransformation of Waste Biomass into High Value Biochemicals. Edited by Brar SK, Dhillon GS, Soccol CR. New York, NY: Springer New York;; 2014:445–471.
9. Arutchelvi J, Doble M, Shao Z, Van Bogaert INA, Soetaert W, Matsuyama T, Tanikawa T, Nakagawa Y, Jacques P, Abdel-Mawgoud AM, Hausmann R, Lépine F, Müller MM, Maier RM: Biosurfactants: From Genes to Applications. Springer Berlin Heidelberg;; 2011.
10. Fonseca CS da, Faria NR, Ferreira Alves FC: Processes for the production of microbial glycolipids, mannosylerythritol lipids, from lignocellulosic materials and their applications. 2014.
11. Faria NT, Santos M V., Fernandes P, Fonseca LL, Fonseca C, Ferreira FC: Production of glycolipid biosurfactants, mannosylerythritol lipids, from pentoses and d-glucose/d-xylose mixtures by Pseudozyma yeast strains. Process Biochem 2014.
12. Chen H: Biotechnology of Lignocellulose. Dordrecht: Springer Netherlands;; 2014.
13. Palmqvist E, Hahn-Hägerdal B: Fermentation of lignocellulosic hydrolysates. II: Inhibitors and mechanisms of inhibition. Bioresource Technology 2000:25–33.
14. Torres Faria NR: Yeast mannosylerythritol lipids from lignocellulose : a novel strategy for the production of jet biofuel. Universidade de Lisboa, Instituto Superior Técnico;; 2014.
15. FAOSTAT [http://faostat3.fao.org/download/Q/QC/E]
16. Faria N, Santos M, Ferreira C, Marques S, Ferreira F, Fonseca C: Conversion of cellulosic materials into glycolipid biosurfactants, mannosylerythritol lipids, by Pseudozyma spp. under SHF and SSF processes. Microb Cell Fact 2014, 13:155.
17. Kronberg B, Holmberg K, Lindman B: Types of Surfactants, their Synthesis, and Applications. In Surface Chemistry of Surfactants and Polymers. John Wiley & Sons, Ltd;; 2014:1–47.
18. Kronberg B, Holmberg K, Lindman B: Types of Surfactants, their Synthesis, and Applications. In Surface Chemistry of Surfactants and Polymers. First Edit. Edited by Kronberg B, Holmberg K, Lindman B. John Wiley & Sons, Ltd.;; 2014:1–47.
19. Wang SQ, Ye HQ: Theoretical studies of solid-solid interfaces. Curr Opin Solid State Mater Sci 2006, 10:26–32.
20. Bolis V: Fundamentals in Adsorption at the Solid-Gas Interface. Concepts and

II
Thermodynamics. Volume 154. Springer-Verlag Berlin Heidelberg;; 2013.
21. IHS Chemical: Surfactants. 2013.
22. Aspects H: Environmental and Health Aspects of Surfactants. In Surface Chemistry of Surfactants and Polymers. First edit. Edited by Kronberg B, Holmberg K. John Wiley & Sons, Ltd.;; 2014.
23. Mulligan CN: Environmental applications for biosurfactants. Environmental Pollution 2005:183–198.
24. Romsted LS: Surfactant Science and Technology : Retrospects and Prospects. Taylor and Francis;; 2014.
25. Reis RS, Pacheco GJ, Pereira AG, Freire DMG: Biosurfactants: Production and Applications. In Biodegradation - Life of Science. Edited by Chamy R, Rosenkrnaz F.;; 2013.
26. Kitamoto D, Isoda H, Nakahara T: Functions and potential applications of glycolipid biosurfactants--from energy-saving materials to gene delivery carriers. J Biosci Bioeng 2002, 94:187–201.
27. Arutchelvi JI, Bhaduri S, Uppara PV, Doble M: Mannosylerythritol lipids: a review. J Ind Microbiol Biotechnol 2008, 35:1559–70.
28. Applications [http://rhamnolipid.com/applications/]
29. Sachdev DP, Cameotra SS: Biosurfactants in agriculture. Appl Microbiol Biotechnol 2013, 97:1005–1016.
30. Soberón-Chávez G, Lépine F, Déziel E: Production of rhamnolipids by Pseudomonas aeruginosa. Applied Microbiology and Biotechnology 2005:718–725.
31. Dubeau D, Déziel E, Woods DE, Lépine F: Burkholderia thailandensis harbors two identical rhl gene clusters responsible for the biosynthesis of rhamnolipids. BMC Microbiol 2009, 9:263.
32. Kennedy J, O';Leary ND, Kiran GS, Morrissey JP, O';Gara F, Selvin J, Dobson a. DW: Functional metagenomic strategies for the discovery of novel enzymes and
biosurfactants with biotechnological applications from marine ecosystems. J Appl Microbiol 2011, 111:787–799.
33. Handelsman J: Metagenomics: application of genomics to uncultured microorganisms. Microbiol Mol Biol Rev 2004, 68:669–685.
34. Kawamura Y, Kamiya Y: Metagenomic analysis permitting identification of the minority bacterial populations in the oral microbiota. J Oral Biosci 2012, 54:132–137.
35. Gonzalez JM, Portillo MC, Belda-Ferre P, Mira A: Amplification by PCR Artificially Reduces the Proportion of the Rare Biosphere in Microbial Communities. PLoS One 2012, 7:e29973.
36. Satpute SK, Banat IM, Dhakephalkar PK, Banpurkar AG, Chopade BA: Biosurfactants, bioemulsifiers and exopolysaccharides from marine microorganisms. Biotechnology Advances 2010:436–450.
37. Morikawa M, Ito M, Imanaka T: Isolation of a new surfactin producer Bacillus pumilus A-1, and cloning and nucleotide sequence of the regulator gene, psf-1. J Ferment Bioeng 1992, 74:255–261.
38. Burch AY, Shimada BK, Browne PJ, Lindow SE: Novel high-throughput detection method to assess bacterial surfactant production. Appl Environ Microbiol 2010, 76:5363–5372.
39. MarketsandMarkets.com: Surfactants Market by Applications Type, Substrates - 2019 | MarketsandMarkets. 2014.
40. Grand View Research: Biosurfactants Market Analysis By Product (Rhamnolipids, Sophorolipids, MES, APG, Sorbitan Esters, Sucrose Esters) And Segment Forecast To 2020. 2014.
41. Parker PM: The World Market for Organic Surface-Active Agents: A 2013 Global Trade Perspective. 2013.
42. Transparency Market Research: Microbial Biosurfactants Market - Global Industry Analysis, Size, Share, Growth, Trends and Forecast. 2014.
43. Yoshida S, Morita T, Shinozaki Y, Watanabe T, Sameshima-Yamashita Y, Koitabashi M,

III
Kitamoto D, Kitamoto H: Mannosylerythritol lipids secreted by phyllosphere yeast Pseudozyma antarctica is associated with its filamentous growth and propagation on plant surfaces. Appl Microbiol Biotechnol 2014, 98:6419–29.
44. Sekhon KK, Rahman PKSM: Rhamnolipid biosurfactants – Past , Present and future scenario of global market. Front Microbiol 2014, 5(September):1–7.
45. Schilling M, Ruetering M, Dahl V, Cabirol F: Process for the isolation of rhamnolipids. 2014.
46. Makkar RS, Cameotra SS, Banat IM: Advances in utilization of renewable substrates for biosurfactant production. AMB Express 2011, 1:5.
47. Kitamoto D, Haneishi K, Tabuchi T: Production of Mannosylerythritol Lipids by from Vegetable Oils. Agric Biol Chem 1990, 54:37–40.
48. Henkel M, Müller MM, Kügler JH, Lovaglio RB, Contiero J, Syldatk C, Hausmann R: Rhamnolipids as biosurfactants from renewable resources : Concepts for next-generation rhamnolipid production. Process Biochem 2012, 47:1207–1219.
49. Reportlinker.com: Microbial Biosurfactants Market (Rhamnolipids, Sophorolipids, Mannosylerythritol Lipids (MEL) and Other) for Household Detergents, Industrial & Institutional Cleaners, Personal Care, Oilfield Chemicals, Agricultural Chemicals, Food Processing, Textile and. 2014.
50. Kosaric N, Vardan-Sukan F: Biosurfactants: Production and Utilization—Processes, Technologies, and Economics. Second edi. Taylor & Francis Group, LLC;; 2015.
51. Dzięgielewska E, Adamczak M: Evaluation of waste products in the synthesis of surfactants by yeasts. Chem Pap 2013, 67:1113–1122.
52. Rhamnolipid Biosurfactants [http://www.agaetech.com/]
53. Maneerat S: Production of biosurfactants using substrates from renewable-resources.
Songklanakarin J Sci Technol 2005, 27:675–683.
54. Kosaric N: Biosurfactants in Industry. Pure Appl Chem 1992, 64:1731–1737.
55. de Jong E, Gosselink RJA: Bioenergy Research: Advances and Applications. Elsevier;; 2014.
56. Menon V, Rao M: Trends in bioconversion of lignocellulose: Biofuels, platform chemicals & biorefinery concept. Prog Energy Combust Sci 2012, 38:522–550.
57. Sciences B: Isolation and Analysis of Low Molecular Weight Microbial Glycolipids. In Handbook of Hydrocarbon and Lipid Microbiology;; 2010:3705–3723.
58. Rau U, Nguyen LA, Roeper H, Koch H, Lang S: Downstream processing of mannosylerythritol lipids produced byPseudozyma aphidis. Eur J Lipid Sci Technol 2005, 107:373–380.
59. Mercadé ME, Manresa MA, Robert M, Espuny MJ, de Andrés C, Guinea J: Olive oil mill effluent (OOME). New substrate for biosurfactant production. Bioresour Technol 1993, 43:1–6.
60. Thavasi R, Jayalakshmi S, Balasubramanian T, Banat IM: Production and characterization of a glycolipid biosurfactant from Bacillus megaterium using economically cheaper sources. World J Microbiol Biotechnol 2007, 24:917–925.
61. Rufino RD, Sarubbo LA, Campos-Takaki GM: Enhancement of stability of biosurfactant produced by Candida lipolytica using industrial residue as substrate. World J Microbiol Biotechnol 2006, 23:729–734.
62. Sobrinho HBS, Rufino RD, Luna JM, Salgueiro AA, Campos-Takaki GM, Leite LFC, Sarubbo LA: Utilization of two agroindustrial by-products for the production of a surfactant by Candida sphaerica UCP0995. Process Biochem 2008, 43:912–917.
63. Coimbra CD, Rufino RD, Luna JM, Sarubbo LA: Studies of the cell surface properties of Candida species and relation to the production of biosurfactants for environmental applications. Curr Microbiol 2009, 58:245–51.

IV
64. Rufino RD, Sarubbo LA, Neto BB, Campos-Takaki GM: Experimental design for the production of tensio-active agent by Candida lipolytica. J Ind Microbiol Biotechnol 2008, 35:907–14.
65. Nitschke M, Costa SGVAO, Haddad R, Gonçalves LAG, Eberlin MN, Contiero J: Oil wastes as unconventional substrates for rhamnolipid biosurfactant production by Pseudomonas aeruginosa LBI. Biotechnol Prog , 21:1562–6.
66. Shabtai Y: Production of exopolysaccharides by Acinetobacter strains in a controlled fed-batch fermentation process using soap stock oil (SSO) as carbon source. Int J Biol Macromol 1990, 12:145–52.
67. Bednarski W, Adamczak M, Tomasik J, Płaszczyk M: Application of oil refinery waste in the biosynthesis of glycolipids by yeast. Bioresour Technol 2004, 95:15–8.
68. Prieto LM, Michelon M, Burkert JFM, Kalil SJ, Burkert CA V: The production of rhamnolipid by a Pseudomonas aeruginosa strain isolated from a southern coastal zone in Brazil. Chemosphere 2008, 71:1781–5.
69. Benincasa M, Contiero J, Manresa M., Moraes I.: Rhamnolipid production by Pseudomonas aeruginosa LBI growing on soapstock as the sole carbon source. J Food Eng 2002, 54:283–288.
70. Plaza G, Pacwa-Plociniczak M, Piotrowska-Seget Z, Jangid K, Wilk KA: Agroindustrial wastes as unconventional substrates for growing of Bacillus strains and production of biosurfactant. Environ Prot Eng 2011, 37:63–71.
71. Solaiman DKY, Ashby RD, Nuñez A, Foglia TA: Production of sophorolipids by Candida bombicola grown on soy molasses as substrate. Biotechnol Lett 2004, 26:1241–5.
72. Solaiman DKY, Ashby RD, Zerkowski JA, Foglia TA: Simplified soy molasses-based medium for reduced-cost production of sophorolipids by Candida bombicola. Biotechnol Lett 2007, 29:1341–7.
73. da Silva GP, Mack M, Contiero J: Glycerol: a promising and abundant carbon source for
industrial microbiology. Biotechnol Adv 2009, 27:30–9.
74. Amaral PFF, Ferreira TF, Fontes GC, Coelho MAZ: Glycerol valorization: New biotechnological routes. Food Bioprod Process 2009, 87:179–186.
75. Reis FASL, Sérvulo EFC, De França FP: Lipopeptide surfactant production by Bacillus subtilis grown on low-cost raw materials. Appl Biochem Biotechnol 2004, 113-116:899–912.
76. Liu Y, Koh CMJ, Ji L: Bioconversion of crude glycerol to glycolipids in Ustilago maydis. Bioresour Technol 2011, 102:3927–33.
77. Fox SL, Bala GA: Production of surfactant from Bacillus subtilis ATCC 21332 using potato substrates. Bioresour Technol 2000, 75:235–240.
78. Das K, Mukherjee AK: Comparison of lipopeptide biosurfactants production by Bacillus subtilis strains in submerged and solid state fermentation systems using a cheap carbon source: Some industrial applications of biosurfactants. Process Biochem 2007, 42:1191–1199.
79. Noah KS, Bruhn DF, Bala GA: Surfactin production from potato process effluent by Bacillus subtilis in a chemostat. Appl Biochem Biotechnol 2005, 121-124:465–73.
80. Thompson DN, Fox SL, Bala GA: Biosurfactants from Potato Process Effluents. Appl Biochem Biotechnol 2000, 84-86:917–930.
81. Thompson DN, Fox SL, Bala GA: The Effect of Pretreatments on Surfactin Production from Potato Process Effluent by Bacillus subtilis. Appl Biochem Biotechnol 2001, 91-93:487–502.
82. Costa SGVAO, Lépine F, Milot S, Déziel E, Nitschke M, Contiero J: Cassava wastewater as a substrate for the simultaneous production of rhamnolipids and polyhydroxyalkanoates by Pseudomonas aeruginosa. J Ind Microbiol Biotechnol 2009, 36:1063–72.
83. Nitschke M, Pastore GM: Cassava Flour Wastewater as a Substrate for Biosurfactant Production. Appl Biochem Biotechnol 2003, 106:295–302.

V
84. Nitschke M, Pastore GM: Biosurfactant production by Bacillus subtilis using cassava-processing effluent. Appl Biochem Biotechnol 2004, 112:163–72.
85. Nitschke M, Pastore GM: Production and properties of a surfactant obtained from Bacillus subtilis grown on cassava wastewater. Bioresour Technol 2006, 97:336–41.
86. Portilla Rivera OM, Moldes Menduiña AB, Torrado Agrasar AM, Domínguez González JM: Biosurfactants from grape marc: Stability study. J Biotechnol 2007, 131:S136.
87. Rivera OMP, Moldes AB, Torrado AM, Domínguez JM: Lactic acid and biosurfactants production from hydrolyzed distilled grape marc. Process Biochem 2007, 42:1010–1020.
88. Portilla-Rivera O, Torrado A, Domínguez JM, Moldes AB: Stability and emulsifying capacity of biosurfactants obtained from lignocellulosic sources using Lactobacillus pentosus. J Agric Food Chem 2008, 56:8074–80.
89. Portilla OM, Rivas B, Torrado A, Moldes AB, Domínguez JM: Revalorisation of vine trimming wastes using Lactobacillus acidophilus and Debaryomyces hansenii. J Sci Food Agric 2008, 88:2298–2308.
90. George S, Jayachandran K: Analysis of rhamnolipid biosurfactants produced through submerged fermentation using orange fruit peelings as sole carbon source. Appl Biochem Biotechnol 2009, 158:694–705.
91. Al-Bahry SN, Al-Wahaibi YM, Elshafie AE, Al-Bemani AS, Joshi SJ, Al-Makhmari HS, Al-Sulaimani HS: Biosurfactant production by Bacillus subtilis B20 using date molasses and its possible application in enhanced oil recovery. Int Biodeterior Biodegradation 2013, 81:141–146.
92. Ohno A, Ano T, Shoda M: Production of a lipopeptide antibiotic, surfactin, by recombinant Bacillus subtilis in solid state fermentation. Biotechnol Bioeng 1995, 47:209–14.
93. Ohno A, Ano T, Shoda M: Use of soybean curd residue, okara, for the solid state substrate in the production of a lipopeptide
antibiotic, iturin A, by Bacillus subtilis NB22. Process Biochem 1996, 31:801–806.
94. Mussatto SI, Dragone G, Roberto IC: Brewers’ spent grain: generation, characteristics and potential applications. J Cereal Sci 2006, 43:1–14.
95. Honorato TL, Rabelo MC, Gonçalves LRB, Pinto GAS, Rodrigues S: Fermentation of cashew apple juice to produce high added value products. World J Microbiol Biotechnol 2007, 23:1409–1415.
96. Giro MEA, Martins JJL, Rocha MVP, Melo VMM, Gonçalves LRB: Clarified cashew apple juice as alternative raw material for biosurfactant production by Bacillus subtilis in a batch bioreactor. Biotechnol J 2009, 4:738–47.
97. Silva EJ, Rocha e Silva NMP, Rufino RD, Luna JM, Silva RO, Sarubbo L a.: Characterization of a biosurfactant produced by Pseudomonas cepacia CCT6659 in the presence of industrial wastes and its application in the biodegradation of hydrophobic compounds in soil. Colloids Surfaces B Biointerfaces 2014, 117:36–41.
98. Haba E, Espuny MJ, Busquets M, Manresa A: Screening and production of rhamnolipids by Pseudomonas aeruginosa 47T2 NCIB 40044 from waste frying oils. J Appl Microbiol 2000, 88:379–387.
99. Shah V, Jurjevic M, Badia D: Utilization of restaurant waste oil as a precursor for sophorolipid production. Biotechnol Prog , 23:512–5.
100. Zhu Y, Gan J, Zhang G, Yao B, Zhu W, Meng Q: Reuse of waste frying oil for production of rhamnolipids using Pseudomonas aeruginosa zju.u1M. J Zhejiang Univ Sci A 2007, 8:1514–1520.
101. Sadouk Z, Hacene H, Tazerouti A: Biosurfactants Production from Low Cost Substrate and Degradation of Diesel Oil by a Rhodococcus Strain. Oil Gas Sci Technol - Rev l’IFP 2008, 63:747–753.
102. de Lima CJB, Ribeiro EJ, Sérvulo EFC, Resende MM, Cardoso VL: Biosurfactant

VI
production by Pseudomonas aeruginosa grown in residual soybean oil. Appl Biochem Biotechnol 2009, 152:156–68.
103. Liu J, Huang X-F, Lu L-J, Xu J-C, Wen Y, Yang D-H, Zhou Q: Comparison between waste frying oil and paraffin as carbon source in the production of biodemulsifier by Dietzia sp. S-JS-1. Bioresour Technol 2009, 100:6481–7.
104. Deshpande M, Daniels L: Evaluation of sophorolipid biosurfactant production by Candida bombicola using animal fat. Bioresour Technol 1995, 54:143–150.
105. Lee KM, Hwang S-H, Ha SD, Jang J-H, Lim D-J, Kong J-Y: Rhamnolipid production in batch and fed-batch fermentation usingPseudomonas aeruginosa BYK-2 KCTC 18012P. Biotechnol Bioprocess Eng 2004, 9:267–273.
106. Joshi S, Bharucha C, Jha S, Yadav S, Nerurkar A, Desai AJ: Biosurfactant production using molasses and whey under thermophilic conditions. Bioresour Technol 2008, 99:195–199.
107. Dubey K, Juwarkar A: Distillery and curd whey wastes as viable alternative sources for biosurfactant production. World J Microbiol Biotechnol 2001, 17:61–69.
108. Sudhakar Babu P, Vaidya AN, Bal AS, Kapur R, Juwarkar A, Khanna P: Kinetics of biosurfactant production by Pseudomonas aeruginosa strain BS2 from industrial wastes. Biotechnol Lett 1996, 18.
109. Daniel H-J, Reuss M, Syldatk C: Production of sophorolipids in high concentration from deproteinized whey and rapeseed oil in a two stage fed batch process using Candida bombicola ATCC 22214 and Cryptococcus curvatus ATCC 20509. Biotechnol Lett 1998, 20:1153–1156.
110. Daverey A, Pakshirajan K: Production, characterization, and properties of sophorolipids from the yeast Candida bombicola using a low-cost fermentative medium. Appl Biochem Biotechnol 2009, 158:663–74.
111. Rodrigues LR, Teixeira JA, Oliveira R: Low-
cost fermentative medium for biosurfactant production by probiotic bacteria. Biochem Eng J 2006, 32:135–142.
112. Patel RM, Desai AJ: Biosurfactant production by Pseudomonas aeruginosaGS3 from molasses. Lett Appl Microbiol 1997, 25:91–94.
113. Rashedi H, Mazaheri Assadi M, Bonakdarpour B, Jamshidi E: Environmental importance of rhamnolipid production from molasses as a carbon source. Int J Environ Sci Tech 2005, 2:59–62.
114. Raza ZA, Khan MS, Khalid ZM: Physicochemical and surface-active properties of biosurfactant produced using molasses by a Pseudomonas aeruginosa mutant. J Environ Sci Health A Tox Hazard Subst Environ Eng 2007, 42:73–80.
115. Onbasli D, Aslim B: Biosurfactant production in sugar beet molasses by some Pseudomonas spp. J Environ Biol 2009, 30:161–3.
116. Abdel-Mawgoud AM, Aboulwafa MM, Hassouna NA-H: Optimization of surfactin production by Bacillus subtilis isolate BS5. Appl Biochem Biotechnol 2008, 150:305–25.
117. Mohana S, Acharya BK, Madamwar D: Distillery spent wash: treatment technologies and potential applications. J Hazard Mater 2009, 163:12–25.
118. Füchtenbusch B, Wullbrandt D, Steinbüchel A: Production of polyhydroxyalkanoic acids by Ralstonia eutropha and Pseudomonas oleovorans from an oil remaining from biotechnological rhamnose production. Appl Microbiol Biotechnol 2000, 53:167–72.
119. Hori K, Marsudi S, Unno H: Simultaneous production of polyhydroxyalkanoates and rhamnolipids by Pseudomonas aeruginosa. Biotechnol Bioeng 2002, 78:699–707.
120. Ramnani P, Kumar SS, Gupta R: Concomitant production and downstream processing of alkaline protease and biosurfactant from Bacillus licheniformis RG1: Bioformulation as detergent additive. Process Biochem 2005, 40:3352–3359.

VII
121. Sekhon K, Khanna S, Cameotra S: Enhanced biosurfactant production through cloning of three genes and role of esterase in biosurfactant release. Microb Cell Fact 2011, 10:49.
122. Neville BA, O’Toole PW: MOLECULAR BIOLOGY | Genomics. Edited by Tortorello CABLBT-E of FM (Second E. Oxford: Academic Press;; 2014:770–779.
123. Primrose SB, Twyman RM: Principles of Gene Manipulation and Genomics. 7th. edition. Blackwell Publishing;; 2006.
124. Reddy TBK, Thomas AD, Stamatis D, Bertsch J, Isbandi M, Jansson J, Mallajosyula J, Pagani I, Lobos EA, Kyrpides C: The Genomes OnLine Database (GOLD) v.5: a metadata management system based on a four level (meta) genome project classification. Nucleic Acids Res 2015.
125. Knoepfler P: Stem Cells. World Scientific Publishing Company;; 2013.
126. Pele M, Cimpeanu C: Biotechnology: An Introduction. WIT Press;; 2012.
127. Azevedo AM, Rosa PAJ, Ferreira IF, Aires-Barros MR: Chromatography-free recovery of biopharmaceuticals through aqueous two-phase processing. Trends in Biotechnology 2009:240–247.
128. Stankiewicz AI, Moulijn JA: Process Intensification: Transforming Chemical Engineering. Chem Eng Prog 2000(January):22–34.
129. Reay D, Ramshaw C, Harvey A: Process Intensification - An Overview. In Process Intensification. Second Ed. Edited by Reay D, Ramshaw C, Harvey A. Elsevier;; 2013:27–55.
130. Reay D, Ramshaw C, Harvey A: A Brief History of Process Intensification. In Process Intensification. Second Ed. Edited by Reay D, Ramshaw C, Harvey A. Elsevier;; 2013:1–25.
131. Marques MPC, Fernandes P: Microfluidic devices: useful tools for bioprocess intensification. Molecules 2011, 16:8368–401.
132. Marwick JD, Wright PC, Burgess JG: Bioprocess Intensification for Production of
Novel Marine Bacterial Antibiotics Through Bioreactor Operation and Design. Mar Biotechnol 1999, 1:495–507.
133. Arroyo M, de la Mata I, Acebal C, Castillón MP: Biotechnological applications of penicillin acylases: state-of-the-art. Appl Microbiol Biotechnol 2003, 60:507–14.
134. Verbelen PJ, Nedović VA, Manojlović V, Delvaux FR, Laskošek-Čukalović I, Bugarski B, Willaert R: Bioprocess Intensification of Beer Fermentation Using Immobilised Cells. In Encapsulation Technologies for Active Food Ingredients and Food Processing. Edited by Zuidam NJ, Nedovic V. Springer New York;; 2010:303–325.
135. Subhedar PB, Babu NR, Gogate PR: Intensification of enzymatic hydrolysis of waste newspaper using ultrasound for fermentable sugar production. Ultrason Sonochem 2015, 22:326–32.
136. Zhao L, Peng Y, Gao J, Cai W: Bioprocess intensification: an aqueous two-phase process for the purification of C-phycocyanin from dry Spirulina platensis. Eur Food Res Technol 2013, 238:451–457.
137. Konishi M, Morita T, Fukuoka T, Imura T, Kakugawa K, Kitamoto D: Production of different types of mannosylerythritol lipids as biosurfactants by the newly isolated yeast strains belonging to the genus Pseudozyma. Appl Microbiol Biotechnol 2007, 75:521–531.
138. Kitamoto D, Ikegami T, Suzuki GT, Sasaki A, Takeyama YI, Idemoto Y, Koura N, Yanagishita H: Microbial conversion of n-alkanes into glycolipid biosurfactants, mannosylerythritol lipids, by Pseudozyma (Candida antarctica). Biotechnol Lett 2001, 23:1709–1714.
139. Inoh Y, Kitamoto D, Hirashima N, Nakanishi M: Biosurfactants of MEL-A increase gene transfection mediated by cationic liposomes. Biochem Biophys Res Commun 2001, 289:57–61.
140. Kitamoto D, Yanagishita H, Endo A, Nakaiwa M, Nakane T, Akiya T: Remarkable antiagglomeration effect of a yeast biosurfactant, diacylmannosylerythritol, on ice-water slurry for cold thermal storage.

VIII
Biotechnol Prog 2001, 17:362–365.
141. Kauffeld M, Wang MJ, Goldstein V, Kasza KE: Ice Slurry Applications. Int J Refrig 2010, 33:1491–1505.
142. Morita T, Kitagawa M, Suzuki M, Yamamoto S, Sogabe A, Yanagidani S, Imura T, Fukuoka T, Kitamoto D: A yeast glycolipid biosurfactant, mannosylerythritol lipid, shows potential moisturizing activity toward cultured human skin cells: the recovery effect of MEL-A on the SDS-damaged human skin cells. J Oleo Sci 2009, 58:639–642.
143. Product lineup [http://www.toyobousa.com/cosmetics.html]
144. Skincare materials [http://www.kanebo.com/science/skincare/biosurfactants.html]
145. MEL (Mannosylerthritol Liquid) [http://biotopia.en.ec21.com/MEL_Mannosylerthritol_Liquid--5655436_6955346.html]
146. Products Porfolio [http://damychem.com/damy-product/damy-product.html]
147. Freitag J, Ast J, Linne U, Stehlik T, Martorana D, Bölker M, Sandrock B: Peroxisomes contribute to biosynthesis of extracellular glycolipids in fungi. Mol Microbiol 2014, 93:24–36.
148. Greenspan P, Fowler SD: Spectrofluorometric studies of the lipid probe, nile red. J Lipid Res 1985, 26:781–789.
149. Kim H-S, Yoon B-D, Choung D-H, Oh H-M, Katsuragi T, Tani Y: Characterization of a biosurfactant, mannosylerythritol lipid produced from Candida sp. SY16. Appl Microbiol Biotechnol 1999, 52:713–721.
150. Adamczak M, Bednarski W: Influence of medium composition and aeration on the synthesis of biosurfactants produced by Candida antarctica. Biotechnol Lett 2000, 22:313–316.
151. Rau U, Nguyen L a, Roeper H, Koch H, Lang S: Fed-batch bioreactor production of mannosylerythritol lipids secreted by Pseudozyma aphidis. Appl Microbiol Biotechnol
2005, 68:607–13.
152. Rau U, Nguyen L a, Schulz S, Wray V, Nimtz M, Roeper H, Koch H, Lang S: Formation and analysis of mannosylerythritol lipids secreted by Pseudozyma aphidis. Appl Microbiol Biotechnol 2005, 66:551–9.
153. Morita T, Konishi M, Fukuoka T, Imura T, Kitamoto D: Physiological differences in the formation of the glycolipid biosurfactants, mannosylerythritol lipids, between Pseudozyma antarctica and Pseudozyma aphidis. Appl Microbiol Biotechnol 2006, 74:307–15.
154. Sanz Requena JF, Guimaraes AC, Quirós Alpera S, Relea Gangas E, Hernandez-Navarro S, Navas Gracia LM, Martin-Gil J, Fresneda Cuesta H: Life Cycle Assessment (LCA) of the biofuel production process from sunflower oil, rapeseed oil and soybean oil. Fuel Process Technol 2011, 92:190–199.
155. Bhangale A, Wadekar S, Kale S, Pratap A: Optimization and monitoring of water soluble substrate for synthesis of mannosylerythritol lipids by Pseudozyma antarctica (ATCC 32657). Biotechnol Bioprocess Eng 2013, 18:679–685.
156. Morita T, Ishibashi Y, Hirose N, Wada K, Takahashi M, Fukuoka T, Imura T, Sakai H, Abe M, Kitamoto D: Production and characterization of a glycolipid biosurfactant, mannosylerythritol lipid B, from sugarcane juice by Ustilago scitaminea NBRC 32730. Biosci Biotechnol Biochem 2011, 75:1371–6.
157. Bhattacharjee SS, Haskins RH, Gorin PAJ: Location of acyl groups on two acylated glycolipids from strains of Ustilago (smut fungi). Carbohydrate Research 1970:235–246.
158. Kawashima H, Nakahara T, Oogaki M, Tabuchi T: Extracellular Production of a Mannosylerythritol Lipid by a Mutant of Candida sp. from n-Alkanes and Triacylglycerols. J Ferment Technol 1983, 61:143–149.
159. Spoeckner S, Wray V, Nimtz M, Lang S: Glycolipids of the smut fungus Ustilago maydis from cultivation on renewable

IX
resources. Appl Microbiol Biotechnol 1999, 51:33–39.
160. Kakugawa K, Tamai M, Imamura K, Miyamoto K, Miyoshi S, Morinaga Y, Suzuki O, Miyakawa T: Isolation of yeast Kurtzmanomyces sp. I-11, novel producer of mannosylerythritol lipid. Biosci Biotechnol Biochem 2002, 66:188–191.
161. Fukuoka T, Morita T, Konishi M, Imura T, Kitamoto D: A basidiomycetous yeast, Pseudozyma tsukubaensis, efficiently produces a novel glycolipid biosurfactant. The identification of a new diastereomer of mannosylerythritol lipid-B. Carbohydr Res 2008, 343:555–560.
162. Morita T, Konishi M, Fukuoka T, Imura T, Kitamoto HK, Kitamoto D: Characterization of the genus Pseudozyma by the formation of glycolipid biosurfactants, mannosylerythritol lipids. FEMS Yeast Res 2007, 7:286–92.
163. Fukuoka T, Morita T, Konishi M, Imura T, Kitamoto D: Characterization of new types of mannosylerythritol lipids as biosurfactants produced from soybean oil by a basidiomycetous yeast, Pseudozyma shanxiensis. J Oleo Sci 2007, 56:435–442.
164. Konishi M, Imura T, Fukuoka T, Morita T, Kitamoto D: A yeast glycolipid biosurfactant, mannosylerythritol lipid, shows high binding affinity towards lectins on a self-assembled monolayer system. Biotechnol Lett 2007, 29:473–480.
165. Fukuoka T, Morita T, Konishi M, Imura T, Kitamoto D: Characterization of new glycolipid biosurfactants, tri-acylated mannosylerythritol lipids, produced by Pseudozyma yeasts. Biotechnol Lett 2007, 29:1111–1118.
166. Morita T, Konishi M, Fukuoka T, Imura T, Kitamoto D: Microbial conversion of glycerol into glycolipid biosurfactants, mannosylerythritol lipids, by a basidiomycete yeast, Pseudozyma antarctica JCM 10317(T). J Biosci Bioeng 2007, 104:78–81.
167. Morita T, Konishi M, Fukuoka T, Imura T, Kitamoto D: Discovery of Pseudozyma
rugulosa NBRC 10877 as a novel producer of the glycolipid biosurfactants, mannosylerythritol lipids, based on rDNA sequence. Appl Microbiol Biotechnol 2006, 73:305–13.
168. Adamczak M, Bednarski W: Properties and yield of synthesis of mannosylerythritol lipids by Candida antarctica. Food Biotechnol 2000:229–234.
169. Bioenergy Technologies Office: Crop Residues and Agricultural Wastes. 2011.
170. Téllez-Luis SJ, Ramírez J a, Vázquez M: Modelling of the hydrolysis of sorghum straw at atmospheric pressure. J Sci Food Agric 2002, 82:505–512.
171. Rutz D, Janssen R: Biofuel Technology Handbook. Münich: WIP Renewable Energies;; 2007.
172. Kitamoto D, Fuzishiro T, Yanagishita H, Nakane T, Nakahara T: Production of mannosylerythritol lipids as biosurfactants by resting cells of Candida antarctica. Biotechnol Lett 1992, 14:305–310.
173. Konishi M, Morita T, Fukuoka T, Imura T, Kakugawa K, Kitamoto D: Efficient production of mannosylerythritol lipids with high hydrophilicity by Pseudozyma hubeiensis KM-59. Appl Microbiol Biotechnol 2008, 78:37–46.
174. Morita T, Takashima M, Fukuoka T, Konishi M, Imura T, Kitamoto D: Isolation of basidiomycetous yeast Pseudozyma tsukubaensis and production of glycolipid biosurfactant, a diastereomer type of mannosylerythritol lipid-B. Appl Microbiol Biotechnol 2010, 88:679–88.
175. Sari M, Kanti A, Artika IM, Kusharyoto W: Identification of Pseudozyma hubeiensis Y10BS025 as a Potent Producer of Glycolipid Biosurfactant Mannosylerythritol Lipids. Am J Biochem Biotechnol 2013, 9:430–437.
176. Fan L-L, Dong Y-C, Fan Y-F, Zhang J, Chen Q-H: Production and identification of mannosylerythritol lipid-A homologs from the ustilaginomycetous yeast Pseudozyma aphidis ZJUDM34. Carbohydr Res 2014, 392:1–6.

X
177. Welz W, Sattler W, Leis HJ, Malle E: Rapid analysis of non-esterified fatty acids as methyl esters from different biological specimens by gas chromatography after one-step esterification. J Chromatogr 1990, 526:319–329.
178. Gueiros ID: Screening enzymatic systems for selective methyl ester production. Instituto Superior Técnico;; 2011.
179. Manik Y, Halog A: A Meta-Analytic Review of Life Cycle Assessment and Flow Analyses Studies of Palm Oil Biodiesel. 2012, 9:134–141.
180. Lam MK, Lee KT, Mohamed AR, Pinang P: On the Map Life cycle assessment for the production of biodiesel : A case study in Malaysia for palm oil versus jatropha oil. Biofuels, Bioprod Biorefining 2009:601–612.
181. Guilbot J, Kerverdo S, Milius A, Escola R, Pomrehn F: Life cycle assessment of surfactants: the case of an alkyl polyglucoside used as a self emulsifier in cosmetics. Green Chem 2013, 15:3337.
182. Curran MA: Life Cycle Assessment: Principles and Practice. Cincinnati;; 2006.
183. European Platform on Life Cycle Assessment [http://eplca.jrc.ec.europa.eu]
184. Arvidsson R, Persson S, Fröling M, Svanström M: Life cycle assessment of hydrotreated vegetable oil from rape, oil palm and Jatropha. J Clean Prod 2011, 19:129–137.
185. Schmidt JH: Comparative life cycle assessment of rapeseed oil and palm oil. Int J Life Cycle Assess 2010, 15:183–197.
186. Schmidt JH: Life cycle assessment of five vegetable oils. J Clean Prod 2014, 87:130–138.
187. Menichetti E, Otto M: Energy Balance & Greenhouse Gas Emissions of Biofuels from a Life Cycle Perspective. Environment 2009(September 2008):81–109.
188. Mulder M: Basic Principles of Membrane Technology. Second Ed. Dordrecht: Springer Netherlands;; 1996.
189. Weng YH, Wei HJ, Tsai TY, Lin TH, Wei TY, Guo GL, Huang CP: Separation of furans and carboxylic acids from sugars in dilute acid rice
straw hydrolyzates by nanofiltration. Bioresour Technol 2010, 101:4889–4894.
190. Mosier N, Wyman C, Dale B, Elander R, Lee YY, Holtzapple M, Ladisch M: Features of promising technologies for pretreatment of lignocellulosic biomass. Bioresour Technol 2005, 96:673–686.
191. Huang H-J, Ramaswamy S, Tschirner UW, Ramarao BV: A review of separation technologies in current and future biorefineries. Sep Purif Technol 2008, 62:1–21.
192. Paquot C: Standard Methods for the Analysis of Oils, Fats and Derivatives. Elsevier;; 1979.
193. Badenes SM: Enzymatic transesterification of triglycerides by cutinase for biodiesel production. Instituto Superior Técnico;; 2010.
194. Lourenço NMT, Matias SC, Altas MC, Fonseca LP: Low-temperature enzymatic hydrolysis resolution in mini-emulsion media. Chem Pap 2015, 69:810–816.
195. Bhattacharyya L, Rohrer JS (Eds): Applications of Ion Chromatography for Pharmaceutical and Biological Products. First. Hoboken, NJ, USA: John Wiley & Sons, Inc.;; 2012.
196. TRITON X-100 Surfactant [http://www.dow.com/assets/attachments/business/pcm/triton/triton_x-100/tds/triton_x-100.pdf]
197. Muik B, Lendl B, Molina-Díaz A, Ayora-Cañada MJ: Direct monitoring of lipid oxidation in edible oils by Fourier transform Raman spectroscopy. Chem Phys Lipids 2005, 134:173–182.
198. Vaskova H, Buckova M: Thermal Degradation of Vegetable Oils: Spectroscopic Measurement and Analysis. Procedia Eng 2015, 100:630–635.
199. FAO: Processing and refining edible oils. In Fats and oils in human nutrition: Report of a joint expert consultation. Rome;; 1994.
200. Food Additives [http://www.mhlw.go.jp/english/topics/foodsafety/foodadditives/]
XI
201. Shahidi F, Wanasundara PK: Phenolic antioxidants. Crit Rev Food Sci Nutr 1992, 32:67–103.
202. The European Parliament and the Council of the European Union.: Regulation (EC) No 1069/2009 of the European Parliament and of the Council. The Eropean Council;; 2009.
203. Toscano G, Riva G, Foppa Pedretti E, Duca D: Vegetable oil and fat viscosity forecast models based on iodine number and saponification number. Biomass and Bioenergy 2012, 46:511–516.
204. Codex Standard for Named Vegetable Oils (CODEX-STAN 210 - 1999) [http://www.fao.org/docrep/004/y2774e/y2774e04.htm#bm4.1]
205. Codex Standard for Named Animal Fats (CODEX-STAN 211 - 1999) [http://www.fao.org/docrep/004/y2774e/y2774e05.htm#bm5]
206. Domínguez de María P, Carboni-Oerlemans C, Tuin B, Bargeman G, van der Meer A, van Gemert R: Biotechnological applications of Candida antarctica lipase A: State-of-the-art. J Mol Catal B Enzym 2005, 37:36–46.
207. Environmental Protection Agency: 9.11.1 Vegetable Oil Processing. In Compilation of Air Pollutant Emission Factors. Fifth.;; 1995:9.11.1–1 – 9.11.1–11.
208. Wang T: Vegetable Oils in Food Technology. Oxford, UK: Wiley-Blackwell;; 2011.
209. The European Parliament and the Council of the European Union: Regulation (EC) No 1223/2009. 2009.
210. Fernández JF, Jastorff B, Störmann R, Stolte S, Thöming J: Thinking in terms of structure-activity-relationships (T-SAR): A tool to better understand nanofiltration membranes. Membranes (Basel) 2011, 1:162–183.
211. Brás T, Guerra V, Torrado I, Lourenço P, Carvalheiro F, Duarte LC, Neves L a.: Detoxification of hemicellulosic hydrolysates from extracted olive pomace by diananofiltration. Process Biochem 2014, 49:173–180.
212. López-Muñoz MJ, Sotto A, Arsuaga JM, Van der Bruggen B: Influence of membrane, solute and solution properties on the retention of phenolic compounds in aqueous solution by nanofiltration membranes. Sep Purif Technol 2009, 66:194–201.
213. Mohammad a. W, Teow YH, Ang WL, Chung YT, Oatley-Radcliffe DL, Hilal N: Nanofiltration membranes review: Recent advances and future prospects. Desalination 2014, 356:226–254.
214. Liu S, Amidon TE, David Wood C: Membrane Filtration: Concentration and Purification of Hydrolyzates from Biomass. J Biobased Mater Bioenergy 2008, 2:121–134.
215. Choi J-H, Fukushi K, Yamamoto K: A study on the removal of organic acids from wastewaters using nanofiltration membranes. Sep Purif Technol 2008, 59:17–25.
216. Weng YH, Wei HJ, Tsai TY, Chen WH, Wei TY, Hwang WS, Wang CP, Huang CP: Separation of acetic acid from xylose by nanofiltration. Sep Purif Technol 2009, 67:95–102.
217. Guo Z, Olsson L: Physiological response of Saccharomyces cerevisiae to weak acids present in lignocellulosic hydrolysate. FEMS Yeast Res 2014, 14:1234–48.
218. Piper P, Calderon CO, Hatzixanthis K, Mollapour M: Weak acid adaptation: the stress response that confers yeasts with resistance to organic acid food preservatives. Microbiology 2001, 147(Pt 10):2635–42.
219. Barreto L, Canadell D, Valverde-Saubí D, Casamayor A, Ariño J: The short-term response of yeast to potassium starvation. Environ Microbiol 2012, 14:3026–42.
220. Parawira W, Tekere M: Biotechnological strategies to overcome inhibitors in lignocellulose hydrolysates for ethanol production: review. Crit Rev Biotechnol 2011, 31:20–31.
221. Faria NT, Marques S, Fonseca C, Ferreira FC: Direct xylan conversion into glycolipid biosurfactants, mannosylerythritol lipids, by Pseudozyma antarctica PYCC 5048T. Enzyme
XII
Microb Technol 2014:IST type A, Accepted.
222. Carvalheiro F, Duarte LC, Lopes S, Parajó JC, Pereira H, Gırio FM: Evaluation of the detoxification of brewery’s spent grain hydrolysate for xylitol production by Debaryomyces hansenii CCMI 941. Process Biochem 2005, 40:1215–1223.
223. Canilha L, de Almeida e Silva JB, Solenzal AIN: Eucalyptus hydrolysate detoxification with activated charcoal adsorption or ion-exchange resins for xylitol production. Process Biochem 2004, 39:1909–1912.
224. Miyafuji H, Danner H, Neureiter M, Thomasser C, Bvochora J, Szolar O, Braun R: Detoxification of wood hydrolysates with wood charcoal for increasing the fermentability of hydrolysates. Enzyme Microb Technol 2003, 32:396–400.
225. Villarreal ML., Prata AMR, Felipe MG., Almeida E Silva JB: Detoxification procedures of eucalyptus hemicellulose hydrolysate for xylitol production by Candida guilliermondii. Enzyme Microb Technol 2006, 40:17–24.
226. Watson NE, Prior BA, Lategan PM, Lussi M: Factors in acid treated bagasse inhibiting ethanol production from d-xylose by Pachysolen tannophilus. Enzyme Microb Technol 1984, 6:451–456.
227. van Zyl C, Prior BA, du Preez JC: Acetic acid inhibition of d-xylose fermentation by Pichia stipitis. Enzyme Microb Technol 1991, 13:82–86.
228. Rodrigues RCLB, Felipe M das GA, Almeida e Silva JB, Vitolo M: Response surface methodology for xylitol production from sugarcane bagasse hemicellulosic hydrolyzate using controlled vacuum evaporation process variables. Process Biochem 2003, 38:1231–1237.
229. Kitamoto D, Yanagishita H, Haraya K, Kitamoto HK: Contribution of a chain-shortening pathway to the biosynthesis of the fatty acids of mannosylerythritol lipid (biosurfactant) in the yeast Candida antarctica: Effect of β-oxidation inhibitors on biosurfactant synthesis. Biotechnol Lett 1998,
20:813–818.

i
Appendices
Poultry oil (Animal fats) CoA
Analysis Value Reference/Method
Acid value (mg KOH/g) 7.44 EN ISO 660:1999
Moisture and volatile matter content (% m/m) 0.15 EN ISO 662:2000
Insoluble impurity content (% m/m) 2.81 EN ISO 663:2001
Saponification value (mg KOH/g) 189 ISO 3657:2002
Iodine value (g I2/100g) 92 EN 16300:2012
Unsaponifiable matter (% m/m) 2.71 EN ISO 3596:2001
Fatty acid analysis (% m/m)
C14:0 0.5
EN ISO 5509:2000 EN ISO 5508:1995
C16:0 20.4
C16:1 3.5
C18:0 6.2
C18:1 35.9
C18:2 27.1
C18:3 2.3
C20:0 0.1
C22:0 <0.1
C24:0 0.1
others 3.9
Saturated 27.3
Unsaturated 68.8

ii
Soybean oil CoA
Analysis Value Reference/Method
Acid value (mg KOH/g) 1.29 EN ISO 660:1999
Moisture and volatile matter content (% m/m) 0.07 EN ISO 662:2000
Insoluble impurity content (% m/m) 0.01 EN ISO 663:2001
Saponification value (mg KOH/g) 195 ISO 3657:2002
Iodine value (g I2/100g) 130 EN 16300:2012
Unsaponifiable matter (% m/m) n.a. EN ISO 3596:2001
Fatty acid analysis (% m/m)
C14:0 0.1
EN ISO 5509:2000 EN ISO 5508:1995
C16:0 11.5
C16:1 0.1
C18:0 3.7
C18:1 23.5
C18:2 53.5
C18:3 6.6
C20:0 0.4
C22:0 n.d.
C24:0 n.d.
others 0.6
Saturated 15.7
Unsaturated 83.7
n.d. – not detected;; n.a. – not assessed

iii
Rapeseed oil CoA
Analysis Value Reference/Method
Acid value (mg KOH/g) 1.87 EN ISO 660:1999
Moisture and volatile matter content (% m/m) 0.08 EN ISO 662:2000
Insoluble impurity content (% m/m) 0.02 EN ISO 663:2001
Saponification value (mg KOH/g) 192 ISO 3657:2002
Iodine value (g I2/100g) 110 EN 16300:2012
Unsaponifiable matter (% m/m) n.a. EN ISO 3596:2001
Fatty acid analysis (% m/m)
C14:0 0.1
EN ISO 5509:2000 EN ISO 5508:1995
C16:0 5.1
C16:1 0.3
C18:0 1.6
C18:1 61.9
C18:2 19.0
C18:3 9.1
C20:0 0.5
C22:0 n.d.
C24:0 n.d.
others 2.4
Saturated 7.3
Unsaturated 90.3
n.d. – not detected;; n.a. – not assessed

iv
Waste frying oil CoA
Analysis Value Reference/Method
Acid value (mg KOH/g) 4.67 EN ISO 660:1999
Moisture and volatile matter content (% m/m) 0.10 EN ISO 662:2000
Insoluble impurity content (% m/m) < 0.01 EN ISO 663:2001
Saponification value (mg KOH/g) 196 ISO 3657:2002
Iodine value (g I2/100g) 106 EN 16300:2012
Unsaponifiable matter (% m/m) n.a. EN ISO 3596:2001
Fatty acid analysis (% m/m)
C14:0 0.1
EN ISO 5509:2000 EN ISO 5508:1995
C16:0 4.9
C16:1 0.1
C18:0 0.1
C18:1 62.8
C18:2 27.9
C18:3 1.5
C20:0 0.4
C22:0 0.8
C24:0 n.d.
others 1.4
Saturated 6.3
Unsaturated 92.3
n.d. – not detected;; n.a. – not assessed
Recommended