
NIGERIA
AkpoA Giant Developmentin Nigeria's DeepOffshore
Umbilicals and flowlines
69 km of 10’’ production flow lines in 4 loops
32 km of 10’’ water injection flow lines (4 lines)
8 km of 8’’ gas injection flow line
150 km 16’’ gas-export pipeline from AKPO to AMENAM
8 main umbilicals to subsea wells and manifolds
Subsea production system 44 wells, with vertical Christmas Trees
22 oil producers20 water injectors2 gas injectors
9 offline production manifolds
1 offline gas injection manifold
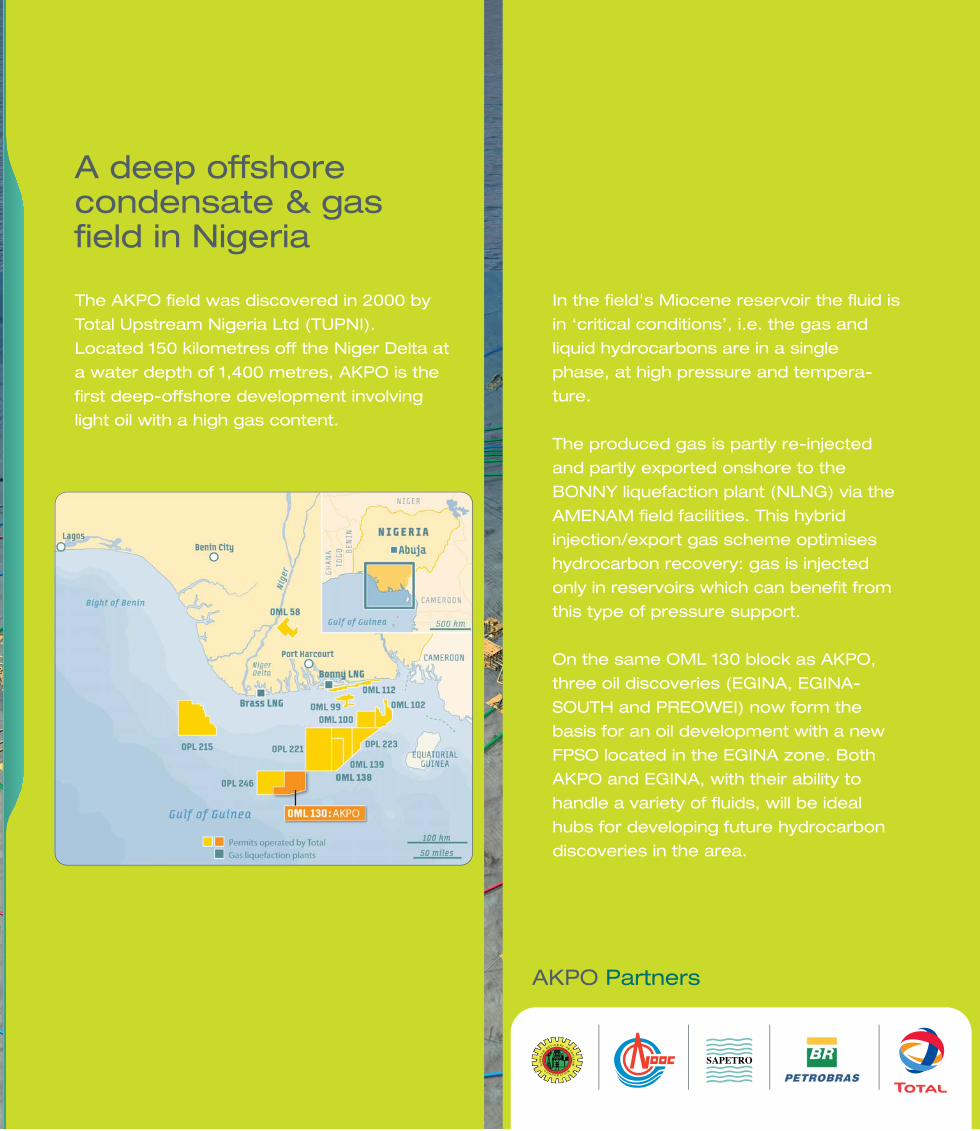
In the field's Miocene reservoir the fluid is
in ‘critical conditions’, i.e. the gas and
liquid hydrocarbons are in a single
phase, at high pressure and tempera-
ture.
The produced gas is partly re-injected
and partly exported onshore to the
BONNY liquefaction plant (NLNG) via the
AMENAM field facilities. This hybrid
injection/export gas scheme optimises
hydrocarbon recovery: gas is injected
only in reservoirs which can benefit from
this type of pressure support.
On the same OML 130 block as AKPO,
three oil discoveries (EGINA, EGINA-
SOUTH and PREOWEI) now form the
basis for an oil development with a new
FPSO located in the EGINA zone. Both
AKPO and EGINA, with their ability to
handle a variety of fluids, will be ideal
hubs for developing future hydrocarbon
discoveries in the area.
AKPO Partners
A deep offshore condensate & gas field in Nigeria
The AKPO field was discovered in 2000 by
Total Upstream Nigeria Ltd (TUPNI).
Located 150 kilometres off the Niger Delta at
a water depth of 1,400 metres, AKPO is the
first deep-offshore development involving
light oil with a high gas content.
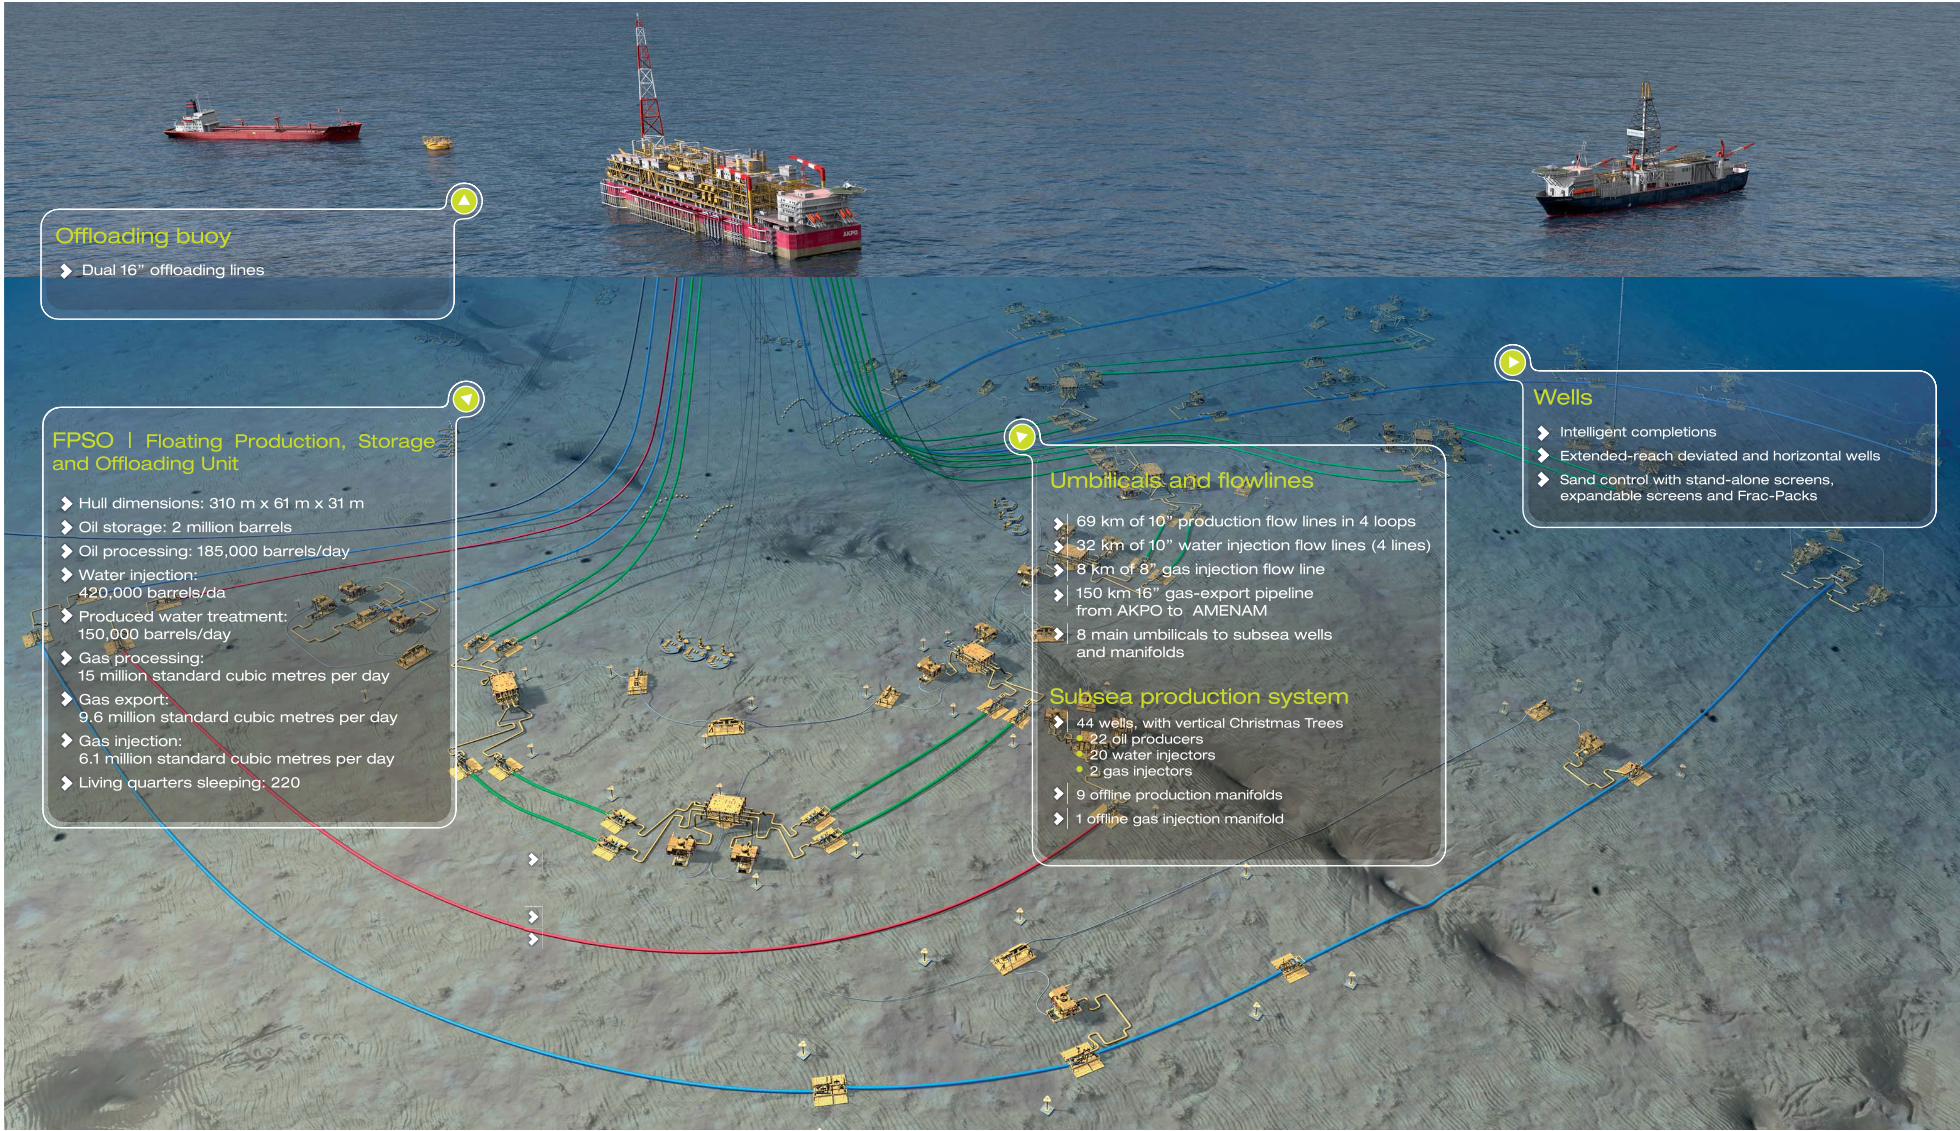
Offloading buoy
Dual 16’’ offloading lines
Wells
Intelligent completions
Extended-reach deviated and horizontal wells
Sand control with stand-alone screens, expandable screens and Frac-Packs
FPSO | Floating Production, Storage and Offloading Unit
Hull dimensions: 310 m x 61 m x 31 m
Oil storage: 2 million barrels
Oil processing: 185,000 barrels/day
Water injection: 420,000 barrels/da
Produced water treatment: 150,000 barrels/day
Gas processing: 15 million standard cubic metres per day
Gas export: 9.6 million standard cubic metres per day
Gas injection: 6.1 million standard cubic metres per day
Living quarters sleeping: 220
Umbilicals and flowlines
69 km of 10’’ production flow lines in 4 loops
32 km of 10’’ water injection flow lines (4 lines)
8 km of 8’’ gas injection flow line
150 km 16’’ gas-export pipeline from AKPO to AMENAM
8 main umbilicals to subsea wells and manifolds
Subsea production system 44 wells, with vertical Christmas Trees
22 oil producers20 water injectors2 gas injectors
9 offline production manifolds
1 offline gas injection manifold

The 14th
World Conference on Earthquake Engineering October 12-17, 2008, Beijing, China
EFFECT OF SOIL-PILE-STRUCTURE INTERACTION ON NONLINEAR RESPONSE OF JACKET TYPE OFFSHORE PLATFORMS THROUGH
INCREMENTAL DYNAMIC ANALYSIS Behrouz Asgarian
1 , Alireza Fiouz2 and Ali Shakeri Talarposhti 3
1Assistant Professor, K.N.Toosi University of Technology, Tehran, Iran
2 Assistant Professor, Persian Gulf University, Bushehr, IRAN
3 Msc in Structural Engineering, K.N.Toosi University of Technology, Tehran, Iran Email: [email protected], [email protected], [email protected]
ABSTRACT :
The response of a fixed offshore tower is greatly affected by nonlinear behavior of the supporting piles.Pile-Soil-Structure Interaction (PSSI) can significantly affect the seismic performance of structures. Thepile-soil interaction during earthquake loading is one of the most important sources of nonlinearity of offshoreplatforms. Incremental Dynamic Analysis (IDA) is an emerging analysis method that offers thorough seismic demand andcapacity prediction capability. This involves performing a series of nonlinear time history analyses under a suiteof ground motion records by equally scaling both components of each record to several levels of intensity and recording the structural response. This paper presents an efficient method to specify the effect of Seismic Soil-Pile-Structure Interaction (SSPSI) on structure through IDA method and shows suitable length to model offshore with equivalent dummy piles for more accuracy. Three-dimensional finite element model of offshore, jacket with both equivalent dummy piles(pile stub) and true piles considering soil-pile-structure interaction are subjected to Incremental Dynamic Analysis and the results of both are compared in terms of IDA curves. In this paper, a computer program for Nonlinear Earthquake site Response Analyses of layered soil deposits(NERA) is used for nonlinear response of soil layers. Modeling of structure of offshore with its pile is performed with a FEM program (OpenSees) considering the effects of pile-soil-structure interaction using p-y curves.
KEYWORDS: Jacket Platform, Incremental Dynamic Analysis, Pile-Soil-Structure Interaction, Euivalent Dummy Piles.
The 14th
World Conference on Earthquake Engineering October 12-17, 2008, Beijing, China 1. INTRODUCTION In recent years experimental and analytical investigations have been directed toward evaluating inelastic behavior of jacket type offshore structures subjected to strong ground motions. [1] Earthquake design of offshore platforms in seismic active areas is one of the most important parts in offshore platforms design. Dynamic response of piles in offshore platforms is a function of the characteristics of the loading, dynamic pile-soil interaction behavior and dynamic characteristics of the piles structural system. The SSPSI (Seismic Soil-Pile-Structure Interaction) analysis is the main step in evaluation of seismic behavior of pile supported offshore platforms. The pile-soil interaction problem during earthquake loading is one of the most important sources of nonlinear dynamic response analysis of offshore platforms. [2] incremental dynamic analysis (IDA)is a promising method that has recently risen which involves performing nonlinear dynamic analyses of the structural model under a suite of ground motion records, each scaled to several intensity levels designed to force the structure all the way from elasticity to final global dynamic instability [3]. Kimiaei.M et al. [2] has analyzed nonlinear response of offshore piles under seismic loads. They used BNWF model for the modeling of pile-soil interaction and finite element method for the modeling of jacket members in nonlinear range of deformation. Asgarian.B & Ajami.A [4] have surveyed dynamic behavior of jacket type offshore platforms through incremental dynamic analysis.
In this paper, the effect of considering Seismic Soil-Pile-Structure Interaction (SSPSI) on structure nonlinear seismic response was investigated by comparing with equivalent dummy piles model. For this purpose analysis of an existing sample offshore platform in Persian Gulf with Soil-Pile-structure interaction and equivalent dummy piles subjected to strong ground motions has been performed and the results in terms of peak interstory drift ratio of platform in IDA curves have been presented. This model has been developed using OPEN System for Earthquake Engineering Simulation (OPENSEES) [5] software. In order to analyze the variations in soil layers response against earthquake, "NERA" software [6] is used. In this software the nonlinear strain-stress behavior has been modeled and the relative displacements (or accelerations) in each sublayer have been calculated. [7] 2. INCREMENTAL DYNAMIC ANALYSIS The Incremental Dynamic Analysis (IDA) [8], is a computer intensive procedure that offers thorough (demand and capacity) prediction capability by using a series of nonlinear dynamic analyses under suitably multiply-scaled ground motion records. It can estimate accurately the seismic performance of structures.
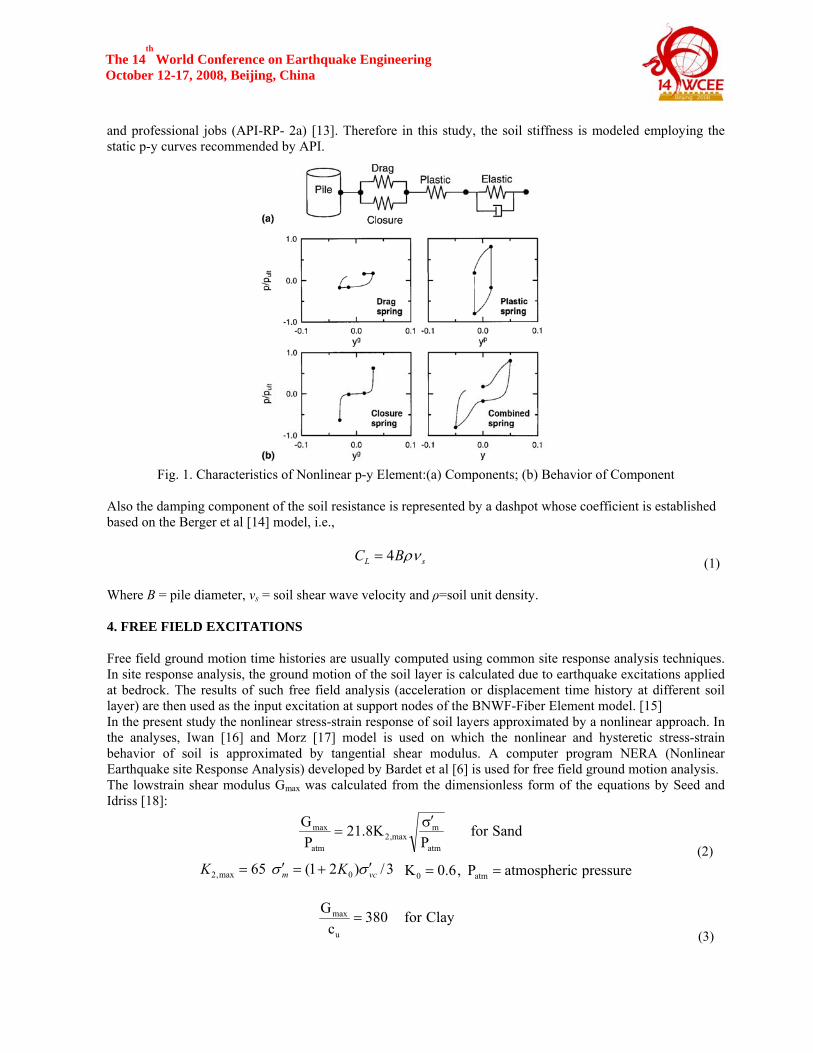
Applying IDA to determine the performance of a structure requires several steps. First, a proper nonlinear structural model needs to be formed, and a suite of records must be compiled. Then, for each record, the scaling levels must be selected, the dynamic analyses run and the results post processed. Thus, IDA curves of thestructural response can be generated, as measured by a Damage Measure (DM, e.g., peak roof drift ratio θroof or θmax), versus the ground motion intensity level, measured by an Intensity Measure (IM, e.g., peak ground acceleration, PGA, or the 5%-damped first-mode spectral acceleration Sa(T1,5%)). In turn these are interpolatedfor each record and summarized over all records to estimate the distribution of demand DM given intensity IM. 3. PILE-SOIL INTERACTION ANALYSIS USING BNWF BNWF models used to analyze the dynamic response of piles should allow for the variation of soil properties with depth, nonlinear soil behavior, nonlinear behavior of pile-soil interfaces and energy dissipation through radiation and hysteretic damping. Special attention must be given to the evaluation of the free-field excitation. The computed ground motion at different levels within the soil is then applied to the nodal boundary supports representing the support motions [2]. Figure 1 shows the general view of a BNWF model and its main components in dynamic nonlinear response analysis of piles. [9]
In the present study, the soil stiffness is established using the p-y curve (lateral soil resistance versus lateral soil deflection) approach. The procedures for generating p-y curves proposed by Matlock et al [10], Reese et al [11] and O’Neil [12] are recommended by the American Petroleum Institute and are widely used in both research
The 14th
World Conference on Earthquake Engineering October 12-17, 2008, Beijing, China and professional jobs (API-RP- 2a) [13]. Therefore in this study, the soil stiffness is modeled employing the static p-y curves recommended by API.
Fig. 1. Characteristics of Nonlinear p-y Element:(a) Components; (b) Behavior of Component
Also the damping component of the soil resistance is represented by a dashpot whose coefficient is established based on the Berger et al [14] model, i.e.,
sL BC ρν4= (1) Where B = pile diameter, vs = soil shear wave velocity and ρ=soil unit density. 4. FREE FIELD EXCITATIONS Free field ground motion time histories are usually computed using common site response analysis techniques. In site response analysis, the ground motion of the soil layer is calculated due to earthquake excitations applied at bedrock. The results of such free field analysis (acceleration or displacement time history at different soil layer) are then used as the input excitation at support nodes of the BNWF-Fiber Element model. [15] In the present study the nonlinear stress-strain response of soil layers approximated by a nonlinear approach. In the analyses, Iwan [16] and Morz [17] model is used on which the nonlinear and hysteretic stress-strain behavior of soil is approximated by tangential shear modulus. A computer program NERA (Nonlinear Earthquake site Response Analysis) developed by Bardet et al [6] is used for free field ground motion analysis. The lowstrain shear modulus Gmax was calculated from the dimensionless form of the equations by Seed and Idriss [18]:
Sandfor
PK8.21
PG
atm
mmax,2
atm
max σ′=
(2) 3/)21(65 0max,2 vcm KK σσ ′+=′= pressurecatmospheriP,6.0K atm0 ==
Clayfor380
cG
u
max = (3)
The 14th
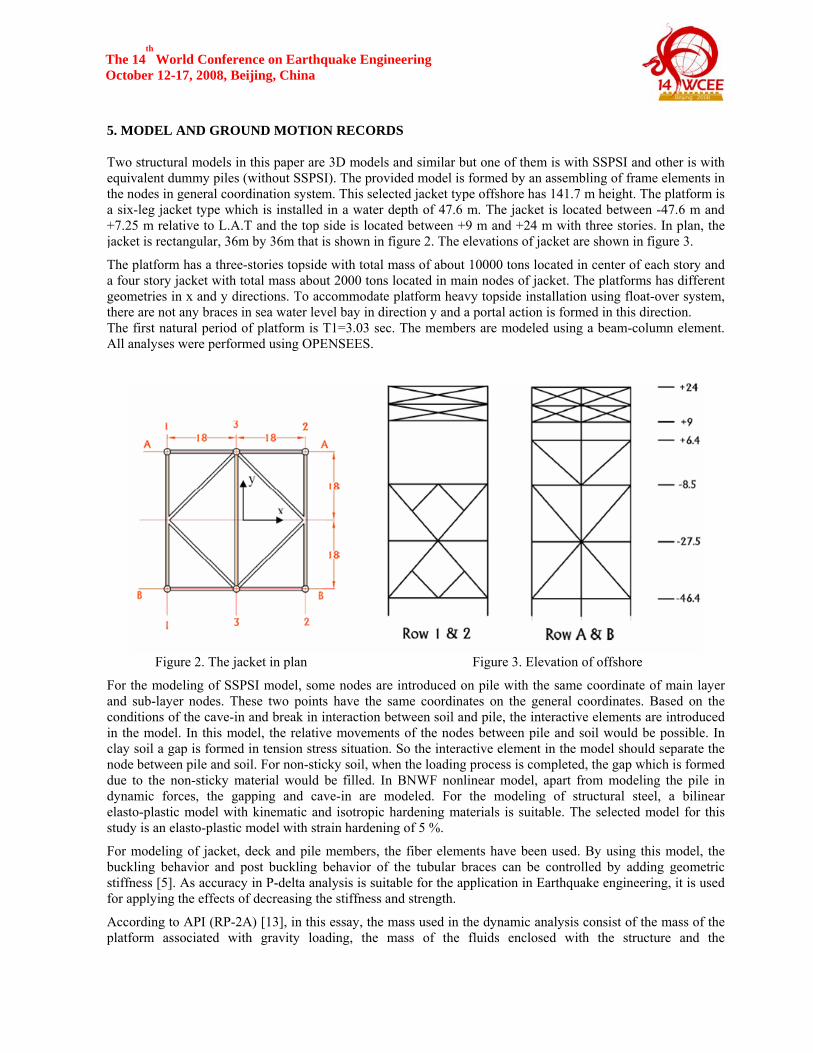
World Conference on Earthquake Engineering October 12-17, 2008, Beijing, China 5. MODEL AND GROUND MOTION RECORDS Two structural models in this paper are 3D models and similar but one of them is with SSPSI and other is with equivalent dummy piles (without SSPSI). The provided model is formed by an assembling of frame elements in the nodes in general coordination system. This selected jacket type offshore has 141.7 m height. The platform is a six-leg jacket type which is installed in a water depth of 47.6 m. The jacket is located between -47.6 m and +7.25 m relative to L.A.T and the top side is located between +9 m and +24 m with three stories. In plan, the jacket is rectangular, 36m by 36m that is shown in figure 2. The elevations of jacket are shown in figure 3.
The platform has a three-stories topside with total mass of about 10000 tons located in center of each story and a four story jacket with total mass about 2000 tons located in main nodes of jacket. The platforms has different geometries in x and y directions. To accommodate platform heavy topside installation using float-over system, there are not any braces in sea water level bay in direction y and a portal action is formed in this direction. The first natural period of platform is T1=3.03 sec. The members are modeled using a beam-column element. All analyses were performed using OPENSEES.
Figure 2. The jacket in plan Figure 3. Elevation of offshore
For the modeling of SSPSI model, some nodes are introduced on pile with the same coordinate of main layer and sub-layer nodes. These two points have the same coordinates on the general coordinates. Based on the conditions of the cave-in and break in interaction between soil and pile, the interactive elements are introducedin the model. In this model, the relative movements of the nodes between pile and soil would be possible. In clay soil a gap is formed in tension stress situation. So the interactive element in the model should separate the node between pile and soil. For non-sticky soil, when the loading process is completed, the gap which is formed due to the non-sticky material would be filled. In BNWF nonlinear model, apart from modeling the pile in dynamic forces, the gapping and cave-in are modeled. For the modeling of structural steel, a bilinear elasto-plastic model with kinematic and isotropic hardening materials is suitable. The selected model for this study is an elasto-plastic model with strain hardening of 5 %.
For modeling of jacket, deck and pile members, the fiber elements have been used. By using this model, the buckling behavior and post buckling behavior of the tubular braces can be controlled by adding geometric stiffness [5]. As accuracy in P-delta analysis is suitable for the application in Earthquake engineering, it is used for applying the effects of decreasing the stiffness and strength.
According to API (RP-2A) [13], in this essay, the mass used in the dynamic analysis consist of the mass of the platform associated with gravity loading, the mass of the fluids enclosed with the structure and the
The 14th
World Conference on Earthquake Engineering October 12-17, 2008, Beijing, China appurtenances, and the hydrodynamic added mass. The added mass may be estimated as the mass of the displaced water for motion transverse to the longitudinal axis of the individual structural framing andappurtenances. In computing the dynamic characteristics of braced, pile supported steel structures, viscous damping ratios of 5% are used for an elastic analysis.
In the SSPSI model, for soil dynamic analysis, the soil characteristics, layers and selected record are introduced in “NERA”. Then by using “NERA”, the time history of relative displacement at a selected sublayer is attained. After the formation of model, the time history of relative displacement of soil (in NERA) in pile nodes is applied and later the structure is analyzed by a nonlinear dynamic analysis [8].
The second model of jacket was created with above mentions and eliminating soil-pile-structure and modeling pile with equivalent dummy piles (pile stub). The length of pile stub was considered 15 times of pile diameter.
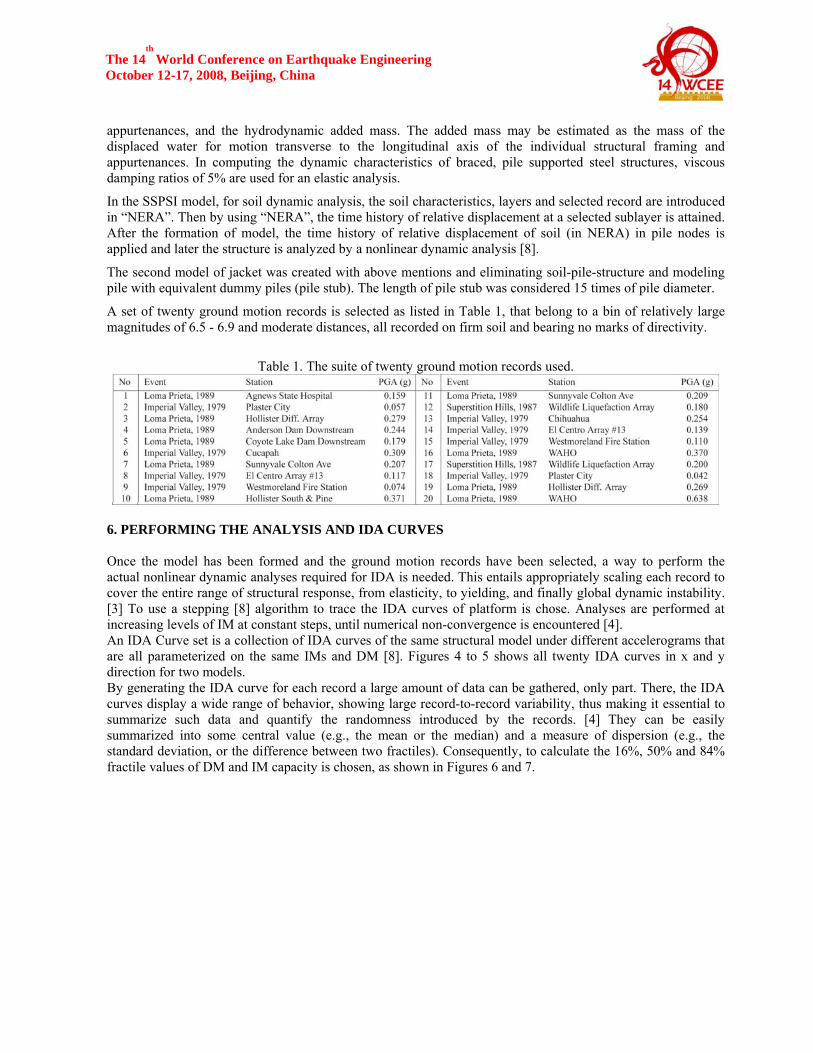
A set of twenty ground motion records is selected as listed in Table 1, that belong to a bin of relatively large magnitudes of 6.5 - 6.9 and moderate distances, all recorded on firm soil and bearing no marks of directivity.
Table 1. The suite of twenty ground motion records used.
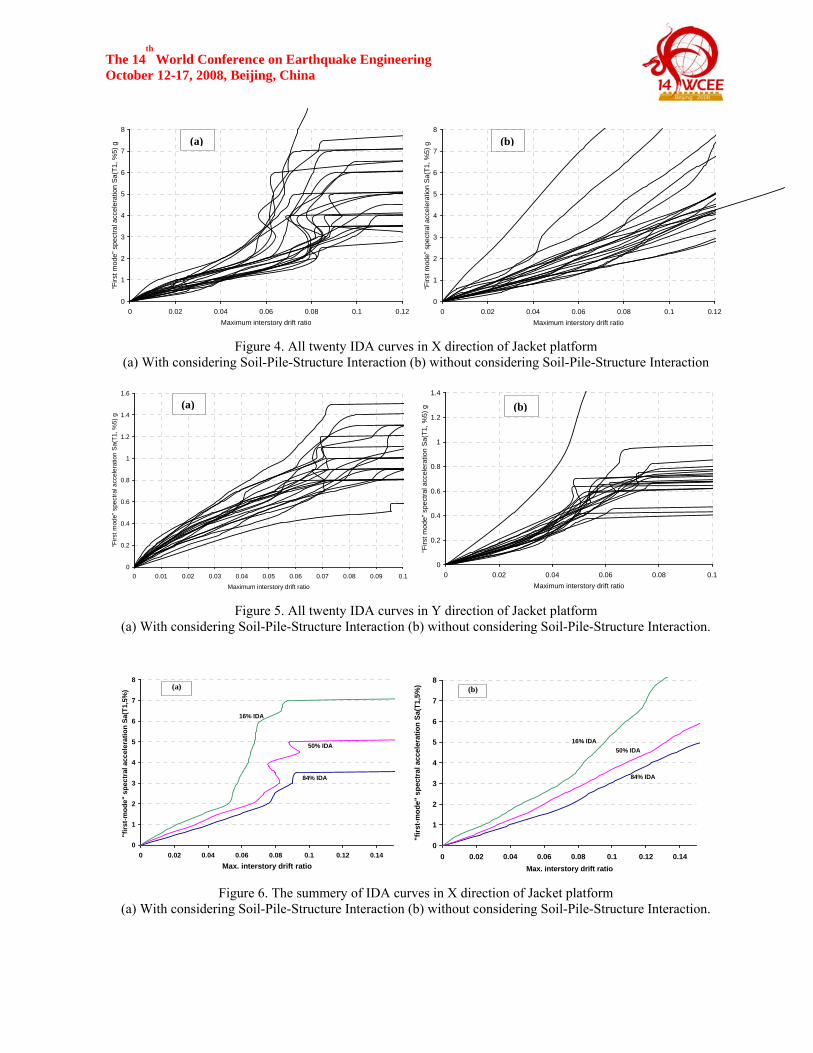
6. PERFORMING THE ANALYSIS AND IDA CURVES Once the model has been formed and the ground motion records have been selected, a way to perform the actual nonlinear dynamic analyses required for IDA is needed. This entails appropriately scaling each record to cover the entire range of structural response, from elasticity, to yielding, and finally global dynamic instability. [3] To use a stepping [8] algorithm to trace the IDA curves of platform is chose. Analyses are performed at increasing levels of IM at constant steps, until numerical non-convergence is encountered [4]. An IDA Curve set is a collection of IDA curves of the same structural model under different accelerograms that are all parameterized on the same IMs and DM [8]. Figures 4 to 5 shows all twenty IDA curves in x and y direction for two models. By generating the IDA curve for each record a large amount of data can be gathered, only part. There, the IDA curves display a wide range of behavior, showing large record-to-record variability, thus making it essential to summarize such data and quantify the randomness introduced by the records. [4] They can be easily summarized into some central value (e.g., the mean or the median) and a measure of dispersion (e.g., the standard deviation, or the difference between two fractiles). Consequently, to calculate the 16%, 50% and 84% fractile values of DM and IM capacity is chosen, as shown in Figures 6 and 7.
The 14th
World Conference on Earthquake Engineering October 12-17, 2008, Beijing, China
Figure 4. All twenty IDA curves in X direction of Jacket platform (a) With considering Soil-Pile-Structure Interaction (b) without considering Soil-Pile-Structure Interaction
Figure 5. All twenty IDA curves in Y direction of Jacket platform (a) With considering Soil-Pile-Structure Interaction (b) without considering Soil-Pile-Structure Interaction.
Figure 6. The summery of IDA curves in X direction of Jacket platform
(a) With considering Soil-Pile-Structure Interaction (b) without considering Soil-Pile-Structure Interaction.
0
1
2
3
4
5
6
7
8
0 0.02 0.04 0.06 0.08 0.1 0.12Maximum interstory drift ratio
“Firs
t mod
e” s
pect
ral a
ccel
erat
ion
Sa(T
1, %
5) g
0
1
2
3
4
5
6
7
8
0 0.02 0.04 0.06 0.08 0.1 0.12Maximum interstory drift ratio
“Firs
t mod
e” s
pect
ral a
ccel
erat
ion
Sa(T
1, %
5) g(a) (b)
0
0.2
0.4
0.6
0.8
1
1.2
1.4
0 0.02 0.04 0.06 0.08 0.1Maximum interstory drift ratio
“Firs
t mod
e” s
pect
ral a
ccel
erat
ion
Sa(T
1, %
5) g
0
0.2
0.4
0.6
0.8
1
1.2
1.4
1.6
0 0.01 0.02 0.03 0.04 0.05 0.06 0.07 0.08 0.09 0.1
Maximum interstory drift ratio
“Firs
t mod
e” s
pect
ral a
ccel
erat
ion
Sa(T
1, %
5) g
(a) (b)
0
1
2
3
4
5
6
7
8
0 0.02 0.04 0.06 0.08 0.1 0.12 0.14Max. interstory drift ratio
"firs
t-mod
e" s
pect
ral a
ccel
erat
ion
Sa(T
1,5%
)
16% IDA
84% IDA
50% IDA
(a)
0
1
2
3
4
5
6
7
8
0 0.02 0.04 0.06 0.08 0.1 0.12 0.14Max. interstory drift ratio
"firs
t-mod
e" s
pect
ral a
ccel
erat
ion
Sa(T
1,5%
)
16% IDA
84% IDA
50% IDA
(b)
The 14th
World Conference on Earthquake Engineering October 12-17, 2008, Beijing, China
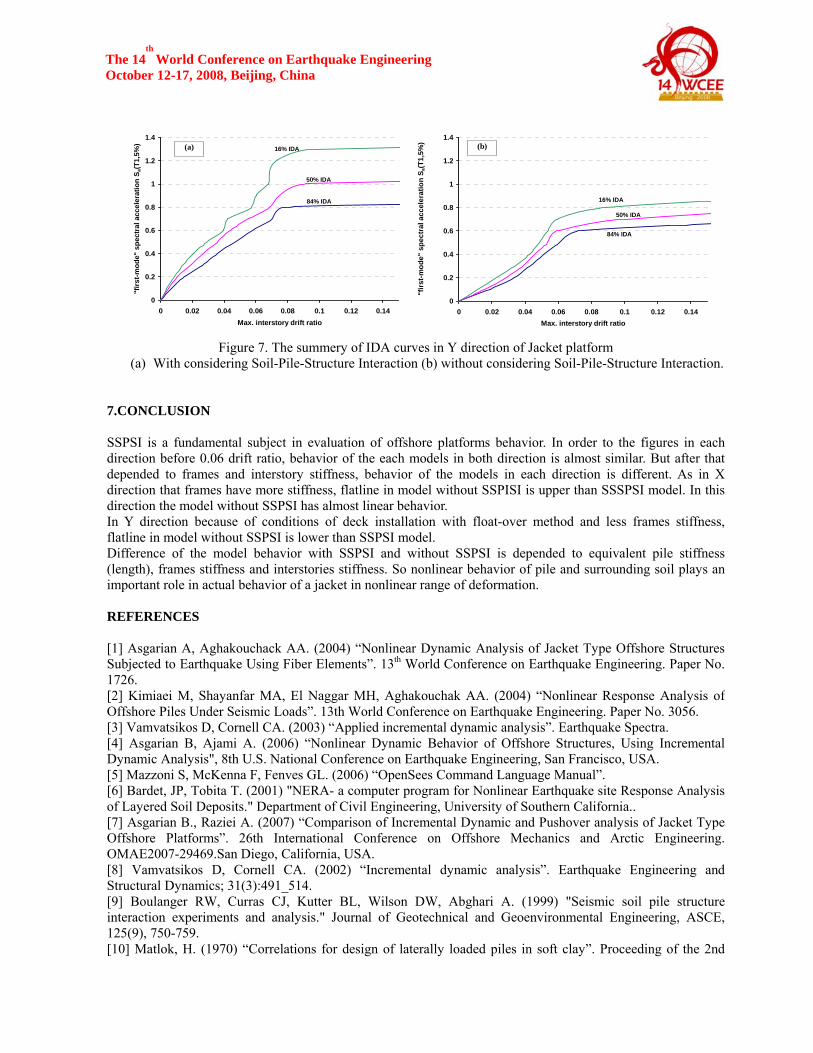
Figure 7. The summery of IDA curves in Y direction of Jacket platform
(a) With considering Soil-Pile-Structure Interaction (b) without considering Soil-Pile-Structure Interaction.
7.CONCLUSION SSPSI is a fundamental subject in evaluation of offshore platforms behavior. In order to the figures in each direction before 0.06 drift ratio, behavior of the each models in both direction is almost similar. But after that depended to frames and interstory stiffness, behavior of the models in each direction is different. As in X direction that frames have more stiffness, flatline in model without SSPISI is upper than SSSPSI model. In thisdirection the model without SSPSI has almost linear behavior. In Y direction because of conditions of deck installation with float-over method and less frames stiffness, flatline in model without SSPSI is lower than SSPSI model. Difference of the model behavior with SSPSI and without SSPSI is depended to equivalent pile stiffness(length), frames stiffness and interstories stiffness. So nonlinear behavior of pile and surrounding soil plays an important role in actual behavior of a jacket in nonlinear range of deformation. REFERENCES [1] Asgarian A, Aghakouchack AA. (2004) “Nonlinear Dynamic Analysis of Jacket Type Offshore StructuresSubjected to Earthquake Using Fiber Elements”. 13th World Conference on Earthquake Engineering. Paper No. 1726. [2] Kimiaei M, Shayanfar MA, El Naggar MH, Aghakouchak AA. (2004) “Nonlinear Response Analysis of Offshore Piles Under Seismic Loads”. 13th World Conference on Earthquake Engineering. Paper No. 3056. [3] Vamvatsikos D, Cornell CA. (2003) “Applied incremental dynamic analysis”. Earthquake Spectra. [4] Asgarian B, Ajami A. (2006) “Nonlinear Dynamic Behavior of Offshore Structures, Using IncrementalDynamic Analysis", 8th U.S. National Conference on Earthquake Engineering, San Francisco, USA. [5] Mazzoni S, McKenna F, Fenves GL. (2006) “OpenSees Command Language Manual”. [6] Bardet, JP, Tobita T. (2001) "NERA- a computer program for Nonlinear Earthquake site Response Analysis of Layered Soil Deposits." Department of Civil Engineering, University of Southern California.. [7] Asgarian B., Raziei A. (2007) “Comparison of Incremental Dynamic and Pushover analysis of Jacket TypeOffshore Platforms”. 26th International Conference on Offshore Mechanics and Arctic Engineering.OMAE2007-29469.San Diego, California, USA. [8] Vamvatsikos D, Cornell CA. (2002) “Incremental dynamic analysis”. Earthquake Engineering andStructural Dynamics; 31(3):491_514. [9] Boulanger RW, Curras CJ, Kutter BL, Wilson DW, Abghari A. (1999) "Seismic soil pile structure interaction experiments and analysis." Journal of Geotechnical and Geoenvironmental Engineering, ASCE, 125(9), 750-759. [10] Matlok, H. (1970) “Correlations for design of laterally loaded piles in soft clay”. Proceeding of the 2nd
0
0.2
0.4
0.6
0.8
1
1.2
1.4
0 0.02 0.04 0.06 0.08 0.1 0.12 0.14Max. interstory drift ratio
"firs
t-mod
e" s
pect
ral a
ccel
erat
ion
S a(T
1,5%
)16% IDA
84% IDA
50% IDA
(a)
0
0.2
0.4
0.6
0.8
1
1.2
1.4
0 0.02 0.04 0.06 0.08 0.1 0.12 0.14Max. interstory drift ratio
"firs
t-mod
e" s
pect
ral a
ccel
erat
ion
S a(T
1,5%
)
16% IDA
84% IDA
50% IDA
(b)
The 14th
World Conference on Earthquake Engineering October 12-17, 2008, Beijing, China Offshore Technology Conference, Houston, Tx., Vol. 1, pp. 577- 588. [11] Reese, L.C., and Welch, R.C. (1975) “Lateral loading of deep foundations in stiff clay”. Journal of theGeotechnical Engineering Division, ASCE, 101(GT7), 633-649. [12] O’Neill, M. and Murchison, J. (1983) “An evaluation of py relationships in sands”. Report GTDF02-83,Department of Civil Engineering, University of Houston, May. [13] American Petroleum Institute. (2000) “Recommended practice for planning, designing and constructing fixed offshore platforms”. API Recommended Practice 2A (RP-2A). 21st ed. American Petroleum Institute,Washington, D.C. [14] Berger, E., Mahin, S.A., and Pyke R. (1977) “Simplified method for evaluating soil-pile-structure interaction effects”. Proceedings of the 9th offshore Technology Conference, OTC paper 2954, Huston, Texas, 589-598. [15] Asgarian B., Roshandel Tavana MA. (2007) “Bedrock Depth Effect Investigation in Seismic Response ofOffshore Platforms Considering Soil- Pile- Structure Interaction”. 26th International Conference on OffshoreMechanics and Arctic Engineering. OMAE2007-29470. San Diego, California, USA. [16] Iwan, W.D. (1967) “On a class of models for the yielding behavior of continuous and composite systems”. Journal of Applied Mechanics, ASME, 34: 612-617. [17] Mroz, Z. (1967) “On the description of anistropic work hardening”. Journal of Mechanics and Physics of Solids, Vol. 15, pp. 163-175. [18] Seed, H. B., and Idriss, I. M. (1970) “Soil moduli and damping factors for dynamic response analysis”. Report No. UCB/EERC-70/10, Earthquake Engineering Res. Ctr., University of California, Berkeley, Calif.
Subsea control systemsSubseaWebTM- open systems architecture
Control systems
2
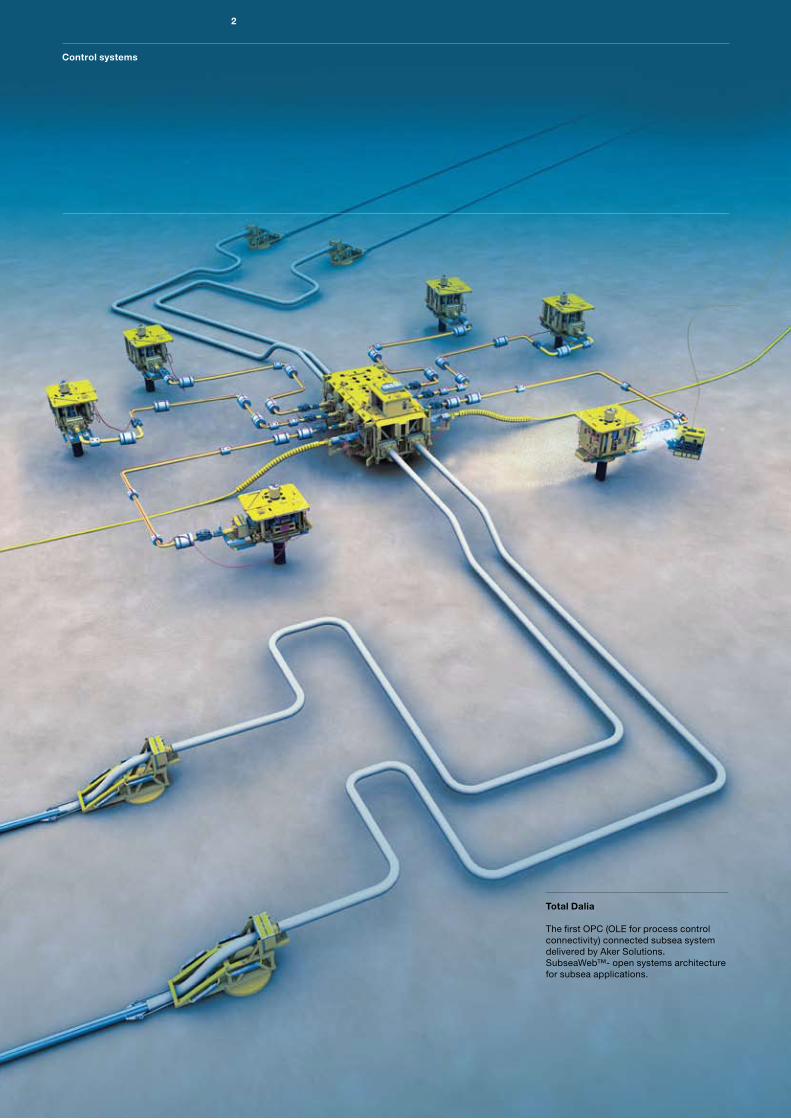
Total Dalia The first OPC (OLE for process control connectivity) connected subsea system delivered by Aker Solutions. SubseaWeb™- open systems architecture for subsea applications.
3
Control systems: the next generation
Control systems
Aker Solutions is one of the leading suppliers of fully integrated subsea control systems. Our new generation of control systems are open, reliable, robust and built upon commercially available building blocks.
Our systems come together under a concept known as SubseaWeb™. They rely on communications networks and open data management channels that are designed to meet challenges posed by the subsea environment. We guarantee flexibility and reliability, and by working in partnership with our customers we deliver technologies that realise the full potential of the field.
We have installed over 900 production control systems worldwide since our first installation in the mid 1970s.To this day we maintain our place as market leader. We have a dedicated research, development and engineering team who seek the smartest, most effective solutions, without compromising environment, health, safety or quality.
The projects we undertake have the entire Aker Solutions subsea capabilities at their disposal. We are unique in this respect. Our areas of expertise include:
• Feasibility and conceptual studies• FEED• Detailed engineering• Trees and manifolds• Subsea processing and boosting• Umbilicals• Tie-in and connection systems• Full aftermarket support
4
Control systems
The SubseaWebTM
concept
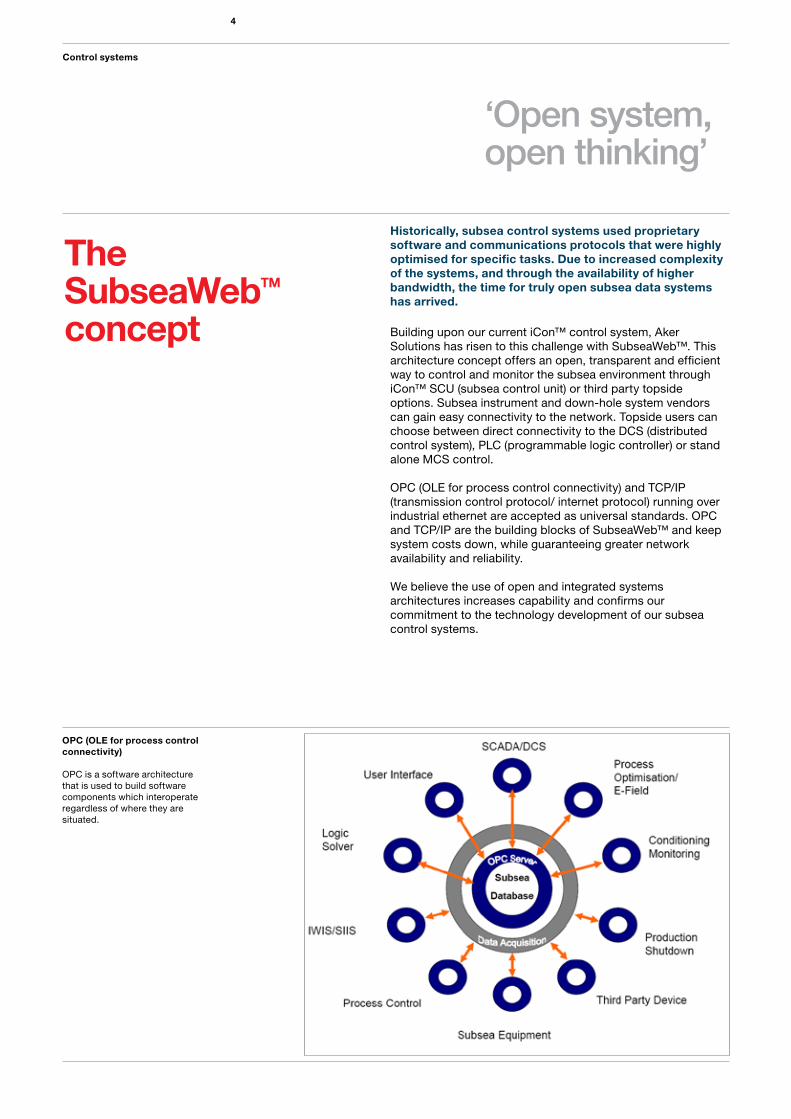
OPC (OLE for process control connectivity)
OPC is a software architecture that is used to build software components which interoperate regardless of where they are situated.
‘Open system,open thinking’
Historically, subsea control systems used proprietary software and communications protocols that were highly optimised for specific tasks. Due to increased complexity of the systems, and through the availability of higher bandwidth, the time for truly open subsea data systems has arrived.
Building upon our current iCon™ control system, Aker Solutions has risen to this challenge with SubseaWeb™. This architecture concept offers an open, transparent and efficient way to control and monitor the subsea environment through iCon™ SCU (subsea control unit) or third party topside options. Subsea instrument and down-hole system vendors can gain easy connectivity to the network. Topside users can choose between direct connectivity to the DCS (distributed control system), PLC (programmable logic controller) or stand alone MCS control.
OPC (OLE for process control connectivity) and TCP/IP (transmission control protocol/ internet protocol) running over industrial ethernet are accepted as universal standards. OPC and TCP/IP are the building blocks of SubseaWeb™ and keep system costs down, while guaranteeing greater networkavailability and reliability.
We believe the use of open and integrated systems architectures increases capability and confirms our commitment to the technology development of our subsea control systems.
Smart solutions
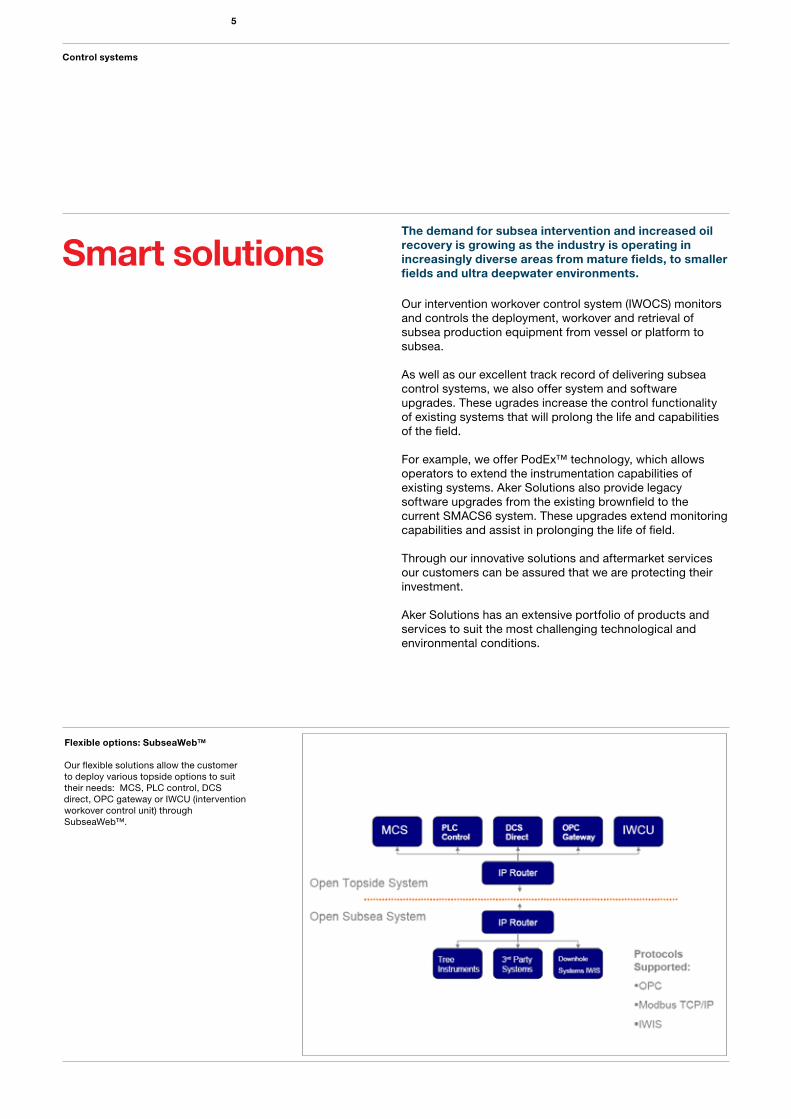
Flexible options: SubseaWebTM
Our flexible solutions allow the customer to deploy various topside options to suit their needs: MCS, PLC control, DCS direct, OPC gateway or IWCU (intervention workover control unit) through SubseaWeb™.
5
Control systems
The demand for subsea intervention and increased oil recovery is growing as the industry is operating in increasingly diverse areas from mature fields, to smaller fields and ultra deepwater environments.
Our intervention workover control system (IWOCS) monitors and controls the deployment, workover and retrieval of subsea production equipment from vessel or platform to subsea.
As well as our excellent track record of delivering subsea control systems, we also offer system and software upgrades. These ugrades increase the control functionality of existing systems that will prolong the life and capabilities of the field.
For example, we offer PodEx™ technology, which allows operators to extend the instrumentation capabilities of existing systems. Aker Solutions also provide legacy software upgrades from the existing brownfield to the current SMACS6 system. These upgrades extend monitoring capabilities and assist in prolonging the life of field.
Through our innovative solutions and aftermarket services our customers can be assured that we are protecting their investment.
Aker Solutions has an extensive portfolio of products and services to suit the most challenging technological and environmental conditions.
6
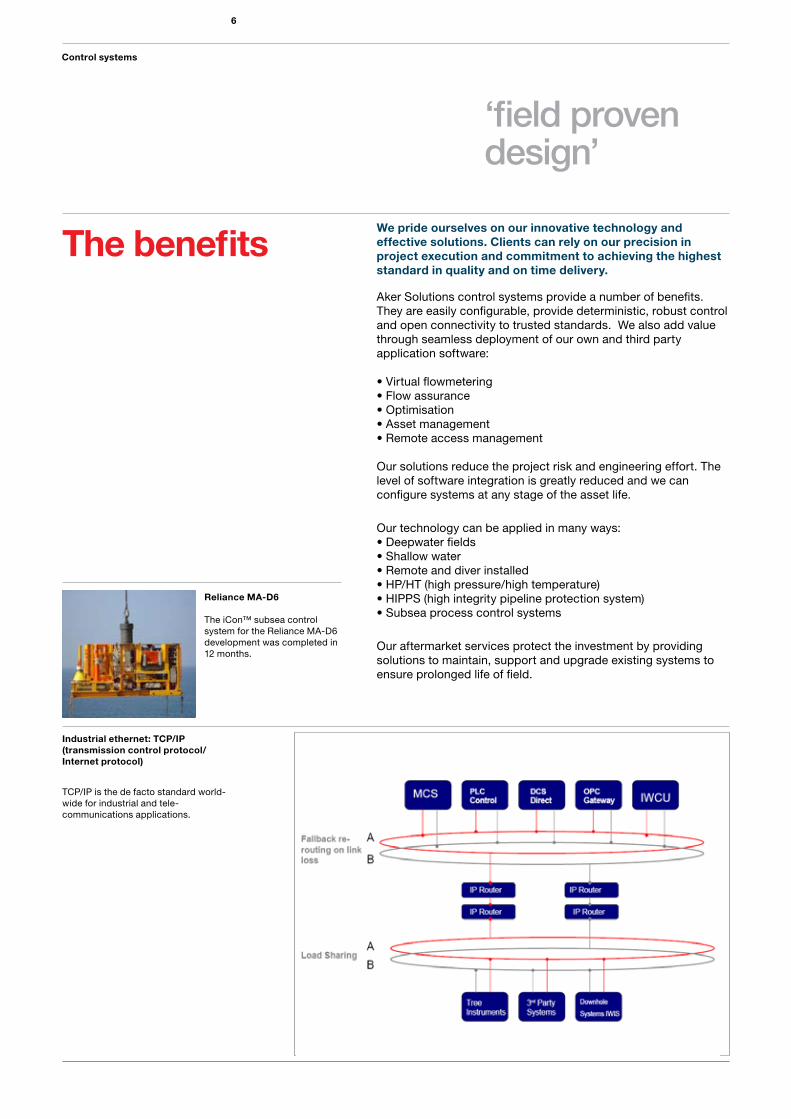
Industrial ethernet: TCP/IP (transmission control protocol/Internet protocol)
TCP/IP is the de facto standard world-wide for industrial and tele-communications applications.
The benefits
‘field proven design’
Control systems
We pride ourselves on our innovative technology and effective solutions. Clients can rely on our precision in project execution and commitment to achieving the highest standard in quality and on time delivery.
Aker Solutions control systems provide a number of benefits. They are easily configurable, provide deterministic, robust control and open connectivity to trusted standards. We also add value through seamless deployment of our own and third party application software:
• Virtual flowmetering• Flow assurance• Optimisation• Asset management• Remote access management
Our solutions reduce the project risk and engineering effort. The level of software integration is greatly reduced and we can configure systems at any stage of the asset life.
Our technology can be applied in many ways:• Deepwater fields• Shallow water• Remote and diver installed• HP/HT (high pressure/high temperature)• HIPPS (high integrity pipeline protection system)• Subsea process control systems
Our aftermarket services protect the investment by providing solutions to maintain, support and upgrade existing systems to ensure prolonged life of field.
Reliance MA-D6
The iCon™ subsea control system for the Reliance MA-D6 development was completed in 12 months.
7
Control systems
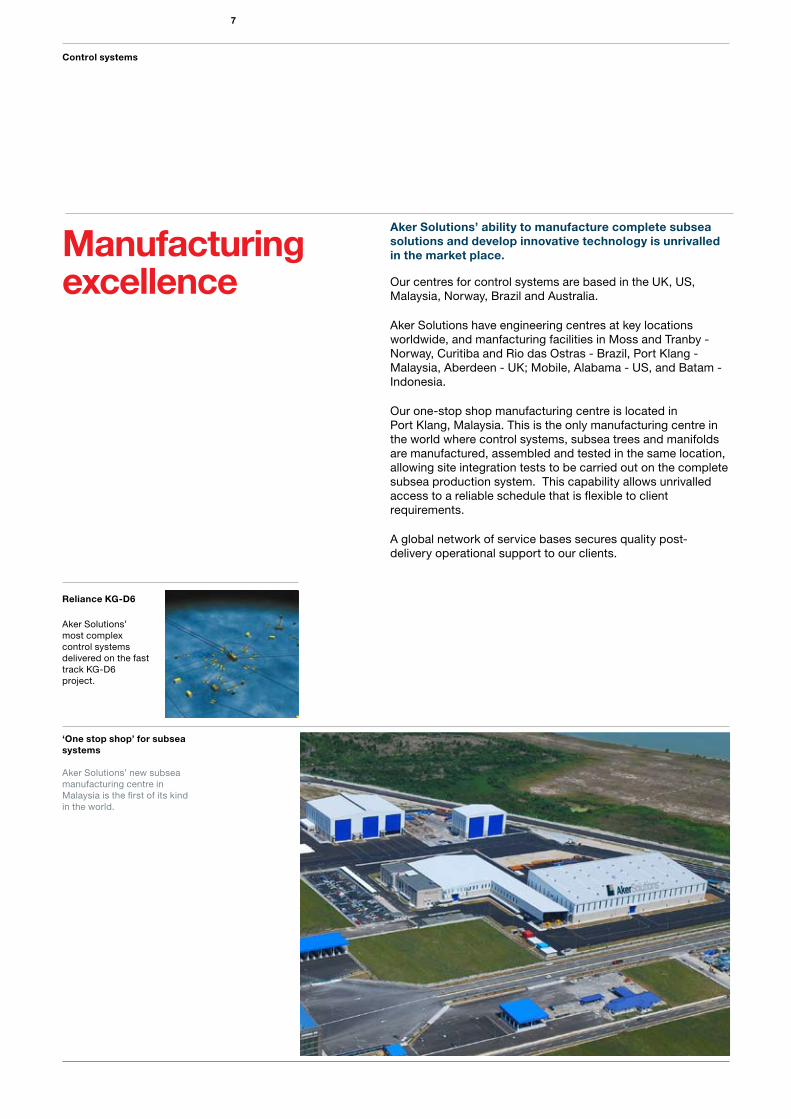
Manufacturingexcellence
Aker Solutions’ ability to manufacture complete subsea solutions and develop innovative technology is unrivalled in the market place.
Our centres for control systems are based in the UK, US, Malaysia, Norway, Brazil and Australia.
Aker Solutions have engineering centres at key locations worldwide, and manfacturing facilities in Moss and Tranby - Norway, Curitiba and Rio das Ostras - Brazil, Port Klang - Malaysia, Aberdeen - UK; Mobile, Alabama - US, and Batam - Indonesia.
Our one-stop shop manufacturing centre is located in Port Klang, Malaysia. This is the only manufacturing centre in the world where control systems, subsea trees and manifolds are manufactured, assembled and tested in the same location, allowing site integration tests to be carried out on the complete subsea production system. This capability allows unrivalled access to a reliable schedule that is flexible to client requirements.
A global network of service bases secures quality post-delivery operational support to our clients.
Reliance KG-D6
Aker Solutions’ most complex control systems delivered on the fast track KG-D6 project.
‘One stop shop’ for subsea systems
Aker Solutions’ new subsea manufacturing centre in Malaysia is the first of its kind in the world.

Subsea processing and boosting
8
8
Control systems
Control systemsequipment
Control systems
9
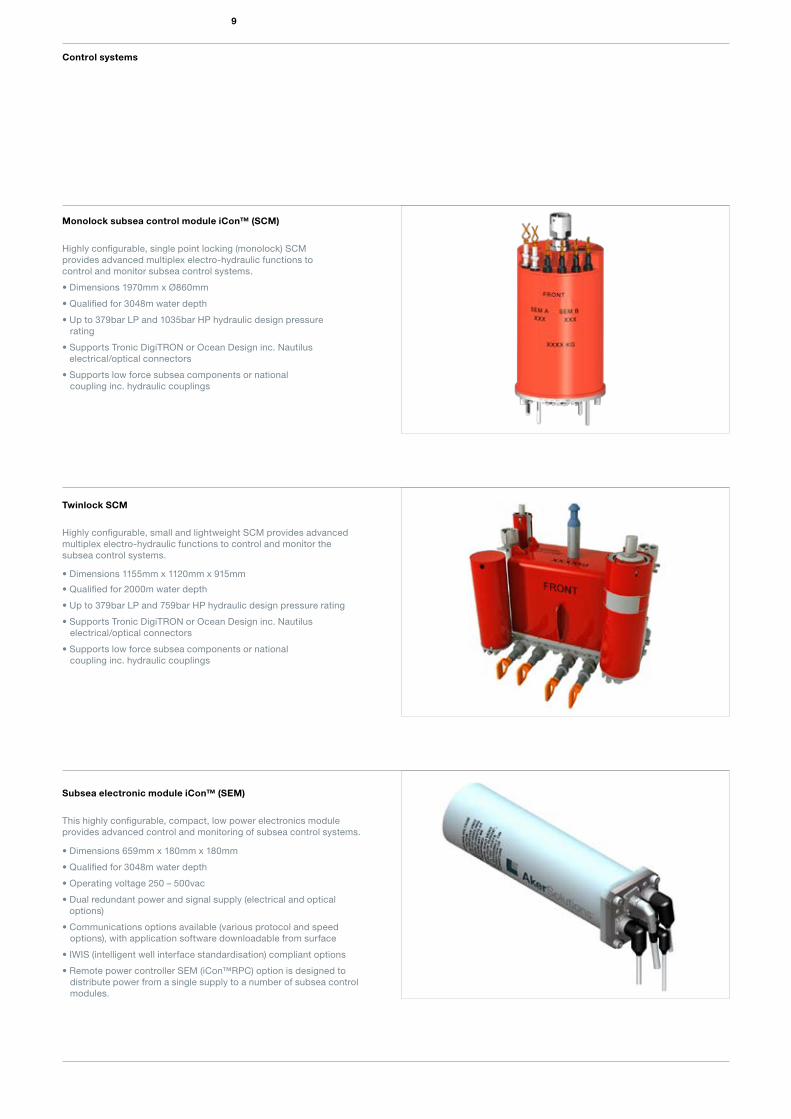
Monolock subsea control module iCon™ (SCM)
Highly configurable, single point locking (monolock) SCM provides advanced multiplex electro-hydraulic functions to control and monitor subsea control systems.
• Dimensions 1970mm x Ø860mm
• Qualified for 3048m water depth
• Up to 379bar LP and 1035bar HP hydraulic design pressure rating
• Supports Tronic DigiTRON or Ocean Design inc. Nautilus • electrical/optical connectors
• Supports low force subsea components or national coupling inc. hydraulic couplings
Subsea electronic module iCon™ (SEM)
This highly configurable, compact, low power electronics module provides advanced control and monitoring of subsea control systems.
• Dimensions 659mm x 180mm x 180mm
• Qualified for 3048m water depth
• Operating voltage 250 – 500vac
• Dual redundant power and signal supply (electrical and optical • options)
• Communications options available (various protocol and speed • options), with application software downloadable from surface
• IWIS (intelligent well interface standardisation) compliant options
• Remote power controller SEM (iCon™RPC) option is designed to distribute power from a single supply to a number of subsea control modules.
Twinlock SCM
Highly configurable, small and lightweight SCM provides advanced multiplex electro-hydraulic functions to control and monitor the subsea control systems.
• Dimensions 1155mm x 1120mm x 915mm
• Qualified for 2000m water depth
• Up to 379bar LP and 759bar HP hydraulic design pressure rating
• Supports Tronic DigiTRON or Ocean Design inc. Nautilus electrical/optical connectors
• Supports low force subsea components or national coupling inc. hydraulic couplings

Control systems
10
Topside solutions

Control systems
11
under the sea
Topside solutions
Subsea control unit iCon™ (SCU)
This configurable and modular subsea control unit provides a standard communications interface and facilitates control and monitoring of the subsea environment.
• High availability and hot swap capability
• Issue valve commands and retrieval of hydraulic function/ • • • • • process data
• Data hand-off to platform control system
• Supports maintenance interfaces to third party device PCs
• Valve closure sequences and interlocks
• Dual PLC for ESD/PSD input trips
Hydraulic Power Units (HPU)
The HPU provides LP and HP hydraulic supplies to the subsea distribution system. The enclosure is constructed of 316 stainless steel and designed in accordance with IP56 level of protection.
• Local control gauge panel for hydraulic fluid pressure indication • and pump control functions
• Internal accumulation and fluid reservoir
• Integrated onboard PLC, monitored by the SCU
• Designed to be operated in a zone 2, gas group IIB, • • temperature class T3, hazardous area
Electrical Power Units (EPU)
The EPU provides a controlled, monitored, electrically isolated and stable dual redundant power supply to the power distribution networks of the subsea control system.
• Modular design within industry standard cabinet
• Each channel has voltage, current and line insulation monitoring (LIM)
• Local current/voltage analogue and alarm indicators
• Outputs for remote alarm/trip indication

Subsea processing and boosting
12
© 2008 Aker SolutionsAll rights reserved. Photo by Pål Laukliwww.akersolutions.com/subsea
Contact Aker Solutions:
North America3600 Briarpark drive, HoustonTexas 77042USATel: +1 713 685 5700Fax: +1 713 685 5707
South AmericaRua da Ajuda, 35-21° andar, CentroRio de Janeiro - RJ CEP 20.040-915BrazilTel: +55 (21) 2122 44 01Fax: +55 (21) 2122 44 02
HeadquartersSnarøyveien 36, 1364 FornebuP.O. Box 94, 1325 Lysaker NorwayTel: +47 67 82 60 00Fax: +47 67 82 64 00
United KingdomHowe Moss Ave.Kirkhill Industrial Estate, DyceAberdeen AB21 0NAUKTel: +44 (0)1224 255 000Fax: +44 (0)1224 255 100
AfricaSONILS OSCRua 6 - I.L., Boavista, LuandaAngolaTel: +47 51 88 87 00Fax: +47 67 82 64 00
Asia PacificLevel 20, Menara HLA No. 3Jalan Kia Peng 50450 Kuala LumparMalaysiaTel: +6 (0) 3 2381 8388Fax: +6 (0) 3 2381 3560
Australia4-6 Anderson PlacePerth Airport, Western Australia 6105Tel: +61 (0)8 9262 9300
August 2008
Recommended