August 5, 2014 Jeanine Townsend, Clerk of the Board State Water Resources Control Board 1001 I Street, 24th Floor Sacramento, CA 95814 Subject: Comment Letter – Proposed Amendments to Statewide Water
Quality Control Plans to Control Trash This letter is submitted on behalf of the Bay Area Stormwater Management Agencies Association (BASMAA)1 in response to the invitation to submit comments on the proposed amendments to statewide Water Quality Control Plans to control trash. BASMAA and its member agencies share the State Water Resource Control Board’s (State Water Board) concern about the impacts of trash on beneficial uses in our receiving waters, and support the overall goals of the proposed amendments. BASMAA appreciates the State Water Board’s consideration and incorporation of previous recommendations provided by its member agencies during the stakeholder meetings conducted over the last two years. In particular, we appreciate the inclusion of the “Track 2” type control measures, “equivalent alternative land use” concepts, and the importance of regulatory source controls in the proposed amendments. However, Phase I municipal separate storm sewer system (MS4) permittees in the San Francisco Bay Area region have concerns with the amendments as drafted because they could result in permittees having to repeat work that has already been completed to comply with trash reduction provisions included in the San Francisco Bay Area Phase I Municipal Regional NPDES Permit (MRP)2 for stormwater discharges, costing municipalities additional staff time and resources, when these permittees have already gained significant knowledge implementing trash controls.
1 BASMAA is a 501(c)(3) non-profit organization comprised of the municipal stormwater programs in the San Francisco Bay Area representing 98 agencies, including 84 cities and 7 counties. BASMAA focuses on regional challenges and opportunities to improve the quality of stormwater that flows to our local creeks, the Delta, the San Francisco Bay, and the Pacific Ocean. 2 Hereinafter, all recommendations in this letter and references to the Phase I municipal separate storm sewer system (MS4) permittees in the San Francisco Bay Area and the San Francisco Bay Area Phase I Municipal Regional NPDES Permit (MRP) include and incorporate the cities of Antioch, Brentwood and Oakley, and the eastern portions of Contra Costa County and the Contra Costa County Flood Control and Water Conservation District, which are covered under the East Contra Costa County Municipal NPDES Permit issued by the Central Valley Water Board. These permittees are members of the Contra Costa Clean Water Program and BASMAA, and are subject to the same San Francisco Bay Area trash-specific provisions in the MRP.
Public CommentTrash Amendments
Deadline: 8/5/14 by 12:00 noon
8-5-14
BASMAA Comments on Proposed Statewide Trash Amendments August 5, 2014
2
BASMAA and its member agencies have been leaders in stormwater management since and even prior to the issuance of the first municipal stormwater NPDES permits in California. In 2002 in coordination with San Francisco Bay Regional Water Board staff, Bay Area Phase I MS4 permittees identified that the level of trash in some Bay Area creeks and shoreline areas is unacceptable and began assessing the extent and magnitude of the trash issue. Permittees also began implementing enhanced control measures to reduce the impacts of trash on local water bodies and the San Francisco Bay. With the inclusion of trash-specific control provisions in the MRP in 2009, Phase I permittees intensified their efforts to significantly reduce trash discharged from MS4s in the Bay Area. In just four years since the issuance of the MRP, Bay Area Phase I permittees have:
• Installed and maintained approximately 5,000 full capture devices that effectively intercept trash from over 20,000 acres of land;
• Adopted nearly 100 local ordinances prohibiting the distribution or sale of litter-prone items such as single use plastic bags and expanded polystyrene food ware;
• Installed hundreds of partial trash capture devices; • Enhanced the effectiveness of street sweeping and storm drain maintenance; • Implemented a litter reduction advertising campaign and an innovative regional social
media campaign intended to change the behavior of litterers; • Effectively engaged solid waste haulers in reducing litter from private trash bins and
dumpsters; • Annually cleaned up over 300 trash hot spots in creeks and shorelines of the Bay; and • Implemented numerous other control measures to reduce the amount of trash discharged
from Bay Area MS4s. These efforts were all conducted towards the goal of significantly reducing trash in MS4 discharges and achieving rigorous trash reduction goals set forth in the MRP (i.e., 40% by July 2014). These actions are part of a well thought out framework developed and refined by Bay Area Phase I MS4s and SF Bay Area Water Board staff, who have spent considerable resources identifying areas that contribute trash at problematic levels to local stormwater conveyance systems and tailoring control measures that are effectively reducing trash from high trash generating areas in the Bay Area. The identification of high, moderate, and low trash generating areas was primarily based upon the findings of the San Francisco Bay Trash Generation Rates Project (see enclosed final report) and the in-depth knowledge of trash generating areas by permittee staff and additional information gained by conducting on-land visual trash assessments. This knowledge is illustrated geographically through Trash Generation Maps developed by each permittee, which identify problematic trash generating areas and management areas where control measure implementation and effectiveness is being tracked. Furthermore, trash generation and management maps are included in detailed Long-Term Trash Reduction Plans, which were submitted to Region 2 earlier this year, and are currently being implemented by each permittee. These community-specific plans document the actions planned to achieve trash reduction goals outlined in the MRP. Actions include those that reduce trash generation at its source and intercept trash that makes its way to MS4s, before being discharged to local receiving waters.
BASMAA Comments on Proposed Statewide Trash Amendments August 5, 2014
3
The creation of the trash generation maps and long-term plans, and implementation of trash control measures over the past 10+ years, has brought considerable knowledge and experience with trash controls in the Bay Area, and will be used to address impairment of beneficial uses from trash over time in the most economically reasonable and technically feasible manner possible. The following recommendations for revisions to the proposed amendments are based on the considerable experience that Bay Area Phase I permittees have in identifying high trash generating areas, managing trash discharges from MS4s, and assessing progress towards trash reduction goals. Primary Recommendations
1. Consistency between Prohibition of Discharge and Water Quality Objective - In accordance with the California Water Code, the State Water Board’s proposed Water Quality Objective (WQO) for trash correctly recognizes that trash in discharges in “amounts that adversely affect beneficial uses or cause nuisance” should be regulated. However, as drafted, the State Water Board’s proposed Prohibitions of Discharges for Trash do not include language corresponding to this aspect of the WQO and could be misinterpreted to apply literally to any and all trash. This is inconsistent with the Water Code’s charge that State Water Quality Control Plans and implementation requirements be economically reasonable and technically feasible and has potentially significant resource demands and adverse enforcement implications for the regulated community. Recommendation - The State Water Board should provide consistency between the WQO and prohibitions by revising the trash prohibitions to include language that qualify that the trash discharges being prohibited and controlled by the specified implementation requirements, is the trash “in amounts that cause impairment of beneficial uses or conditions of nuisance in receiving waters.”
2. Alternative Track for Bay Area MS4s - For the reasons set forth throughout this letter,
the State Water Board should allow all Phase I Section 402(p) permittees under the jurisdiction of the San Francisco Bay Regional Water Board to effectuate compliance with the trash prohibitions and address the WQO for trash through the trash-specific reduction requirements in the MRP and its successor provisions that are already under discussion. This recommendation is consistent with recommendations presented by non-governmental organizations and other stakeholders at the State Water Board’s July 16th Trash Policy Workshop, and effectively would allow applicable Bay Area permittees to continue implementation consistent with the MRP.
Recommendation - The State Water Board should revise the amendments to provide an alternative to allow for compliance to be achieved via continued implementation of the trash-specific provisions in the MRP. Specifically, the State Water Board should revise the proposed Trash Provisions in Chapters III of the Ocean Plan and IV of the ISWEBE
BASMAA Comments on Proposed Statewide Trash Amendments August 5, 2014
4
Plan (i.e., Implementation Provision for Trash) to include in following text (revisions in bold)3:
Discharges Permitted Pursuant to Federal Clean Water Act Section 402(p)
Permitting authorities* shall include the following requirements in NPDES permits issued pursuant to Federal Clean Water Act section 402(p):
a. MS4* permittees with regulatory authority over priority land uses* shall be required
to comply with the prohibition of discharge in Chapter IV.B.2.a herein by one of the following measures:
(1) [retain existing language]
(2) [retain existing language]
(3) Track 3:For applicable MS4* permittees under the jurisdiction of the
Municipal Regional Permit (MRP) issued by the San Francisco Bay Regional Water Quality Control Board, install, operate, maintain any combination of full capture systems*, other treatment controls*, institutional controls*, and/or multi-benefit projects* within either the jurisdiction of the MS4* permittee or within the jurisdiction of the MS4* permittee and contiguous MRP permittees in a phased and prioritized approach that focuses on high trash generation areas that contribute Trash* to storm drains in their jurisdiction as further specified in the trash-specific provisions of the MRP and implementation plans developed by the permittees thereunder. This provision shall apply to MS4* permits that are successors to the current MRP if the San Francisco Bay Regional Water Board finds in adopting the successor permit that the trash-specific provisions of such successor permits are consistent with the requirements of the Trash* Prohibition implementation requirements set forth herein, including the time schedules set forth in Sections 4[or 5].a.(3) and (4) and Section 5 [or 6] below and appropriate monitoring and reporting provisions.
3. Full Capture System Certification - Over the last 4 years, Bay Area communities have installed and maintained over 5,000 full capture devices treating over 20,000 acres. To-date, municipalities have expended over $10 million dollars siting, installing and maintaining these devices, which are successfully assisting municipalities in achieving stringent trash reduction goals. Many devices were funded through a grant received by the San Francisco Estuary Project and all devices that have been installed to-date were approved by San Francisco Bay Regional Water Board staff as providing full trash capture in compliance with the MRP. Many of these device types have also been "certified" by the Los Angeles Regional Water Board. Others similar to the devices
3 Alternatively, the State Water Board could incorporate the concepts included in the proposed “Track 3” into the proposed language for Tracks 1 and 2, to specifically recognize the San Francisco Bay Area phased and prioritized approach currently being implemented via the MRP.
BASMAA Comments on Proposed Statewide Trash Amendments August 5, 2014
5
certified by the Los Angeles Regional Water Board have not been certified, rather have been "approved" by San Francisco Bay Regional Water Board staff for compliance with the MRP full capture requirements. The proposed amendments as presented, would only allow for those devices "certified" by the Los Angeles Regional Water Board to be considered as full capture devices at the time of adoption. Additionally, the amendments propose the State Water Board take over the "certification" process for other full capture devices, which would require municipalities to submit performance data and request for certification of devices not already certified by the Los Angeles Regional Water Board. If adopted as written, the amendments would require thousands of San Francisco Bay Regional Water Board staff approved devices currently installed and effectively removing trash in the Bay Area to be certified by the State Water Board. Aside from costing municipalities additional resources to develop performance data for these devices, the certification process could also potentially render devices currently installed and funded through federal funds, unacceptable as full capture devices. Bay Area permittees have relied on San Francisco Bay Regional Water Board staff to approve devices that meet the criteria for full capture, and have installed devices based on staff’s approval. Effectively “decertifying” devices funded through a federal grant, that are already in the ground and functioning appropriately would be counter-productive to achieving trash reduction goals. Recommendation – Immediately grandfather into the certification process those devices previously “approved” by San Francisco Bay Regional Water Board staff as full capture systems that are installed or in the process of being installed in the Bay Area prior to adoption of the amendments, or immediately certify all devices “approved” by San Francisco Bay Regional Water Board staff. Additionally, revise the amendments to indicate that any treatment device that meets the stated criteria fulfills the certification requirement, regardless of whether a device has or has not been certified by the State Water Board.
Additional Comments In addition to the primary recommendations described above, BASMAA recommends the following revisions also be made to the draft proposed amendments.
1. Definition of High Trash Generating Areas - As described in the recently completed technical report on trash generation rates in the Bay Area (see enclosed report); land use is only one of many factors associated with high trash generation. Trash generation within a single land use can range up to three orders-of-magnitude, which indicates that factors other than land use (i.e., income levels, proximity to trash generating businesses, and level of existing control measure implementation) can affect trash generation. Additionally, although monitoring data and models can provide first-order predictions of trash generation, site-specific information should be used to confirm these predictions and identify the magnitude and extent of high trash generating areas within a jurisdiction.
BASMAA Comments on Proposed Statewide Trash Amendments August 5, 2014
6
For example, annual trash generation within Bay Area retail/wholesale (i.e., commercial) land use areas ranges between 0.5 and 150 gallons/acre (greater than three orders-of-magnitude). Only 35% of this variation can be explained by the level of income within proximity of the land use area. Other reasons for the remaining 65% of variation are likely site-specific. Factors that may influence trash generation include the current levels of trash control measures implemented within the area that are unaccounted for in modeling based approaches. Furthering the example of retail/wholesale land use, the amendments as proposed could require the implementation of expensive long-term trash control measures within land use areas that may not exhibit problematic levels of trash (e.g., high income retail areas with existing control measures). Additionally, for certain communities, land uses excluded by the State Water Board (e.g., some low income single family residential areas) may in reality contribute higher levels of trash than those identified as “high trash generating” in the proposed amendments.
Recommendation - Revise the definition of “high trash generating areas” to allow permittees the option of identifying geographical areas within their municipality that generate problematic levels of trash, regardless of land use. Consistent with this recommendation and not withstanding our primary recommendation concerning MRP permittees (i.e., including a “Track 3”), the State Water Board should at a minimum revise the proposed Trash Provisions in Chapter III of the Ocean Plan and Chapter IV of the ISWEBE Plan to include in following text (revisions in bold): Permitting authorities* shall include the following requirements in NPDES permits issued pursuant to Federal Clean Water Act section 402(p):
a. MS4* permittees with regulatory authority over priority land uses* shall be required to comply with the prohibition of discharge in Chapter III.I.6.a. herein by either of the following measures:
(1) Track 1: Install, operate and maintain full capture systems* for all storm drains that captures runoff from one or more of the priority land uses* or equivalent alternate land uses* in their jurisdictions; or
(2) Track 2: Install, operate, and maintain any combination of full capture systems*, other treatment controls*, institutional controls*, and/or multi-benefit projects* within either the jurisdiction of the MS4* permittee or within the jurisdiction of the MS4* permittee and contiguous MS4s* permittees, so long as such combination achieves the same performance results as compliance under Track 1 would achieve for all storm drains that captures runoff from one or more of the priority land uses* or equivalent alternate land uses* within such jurisdiction(s).
Additionally, revise the definition of Equivalent Alternative Land Uses to include the following text (revisions in bold):
BASMAA Comments on Proposed Statewide Trash Amendments August 5, 2014
7
(6) Equivalent alternate land uses: An MS4* permittee with regulatory authority over priority land uses* may issue a request to the applicable permitting authority* that it be allowed to comply under Chapter III.J.2.a.1. with alternate land uses within its jurisdiction that generate rates of trash that are equivalent to or greater than one or more of the high density residential, industrial, commercial, mixed urban, and/or public transportation station sites, facilities or land uses defined above. Comparative Trash* generation rates shall be established through the reporting of quantification measures such as street sweeping and catch basin cleanup records; mapping; visual trash presence surveys, such as the “Keep America Beautiful Visible Litter Survey”; or other information as required by the permitting authority*. For Phase 1 MS4* permittees under the jurisdiction of the Municipal Regional Permit (MRP) issued by the San Francisco Bay Regional Water Quality Control Board, requests for allowance to comply with alternative land uses within its jurisdiction shall be deemed complete via the submittal of long-term trash reduction plans consistent with the MRP.
2. True Source Controls – Reducing the impacts of litter-prone items through source control is a key tool available to local municipalities. Prohibitions of the distribution or sale of litter-prone items implemented via municipal ordinances or other codes/laws can provide significant and cost-effective trash reduction benefits. In the recent past, over 100 ordinances have been adopted by Bay Area municipalities to reduce the environmental impacts of single use plastic bags and expanded polystyrene foodware. Considerable local resources have been expended during the adoption process for these actions, which are providing substantial environmental benefit. Only granting a (brief) time extension to the implementation dates in the amendments understates the significance of such actions in improving receiving water conditions. Recommendation – The proposed trash amendments should better account for the benefit of true source control actions that local municipalities initiate or participate. Additionally, time extensions should be granted to municipalities for participating with other local governments in statewide initiatives to advocate for legislation and industry cooperation in the development of product redesign, packaging redesign, take-back programs, and deposit legislation.
3. Demonstration of Track 2 (or 3) Performance and Monitoring/Reporting
Requirements - Demonstration of performance under Track 2 or 3 should not be limited to BMP performance monitoring (e.g., counting, weighing, measuring volume) as the method of demonstrating the effectiveness of trash BMPs. Trash quantification is extremely difficult and expensive. Permittees should be allowed to propose the method of demonstrating performance. For instance rigorous on-land visual assessments have proven to be effective tools in some jurisdictions. A current effort in the Bay Area, funded by a Proposition 84 stormwater planning and monitoring grant (Tracking California’s Trash project managed by BASMAA), may provide additional tools for permittees to demonstrate an equivalent level of performance to full capture devices. (The project is expected to be completed in 2017.)
BASMAA Comments on Proposed Statewide Trash Amendments August 5, 2014
8
Recommendation – Continue to provide flexibility in the methods used to demonstrate Track 2 or 3 performance. Permittees should be allowed to implement cost-effective methods to demonstrate performance equivalency. Monitoring and reporting provisions require the submittal of GIS information on the geographical extent of full capture device treatment (Track 1) and locations of other controls (Track 2 or 3). Based on our considerable experience in mapping trash control measure implementation, we recommend the State Water Board remove the requirement for submittal of GIS data to the on trash control measure implementation to the State Water Board and instead incorporate such a requirement into NPDES permits as needed. Additionally, the State Water Board (outside of the amendments and in collaboration with the Proposition 84 grant funded Tracking California’s Trash project managed by BASMAA) should provide guidance on the types and formats of GIS data that should be submitted by permittees, consistent with NPDES permits. The extent of control measure implementation may be illustrated in a number of forms (e.g., points, lines, and polygons), each specific to the type of control measures implemented. Recommendation – Remove the requirement for submittal of GIS data to the State Water Board on trash control measure implementation. Provide guidance, outside of the amendments and in collaboration with the Proposition 84 grant funded Tracking California’s Trash project managed by BASMAA, on the types and formats of GIS data that should be submitted by permittees, consistent with NPDES permits. The monitoring questions listed in the amendments suggest that monitoring of trash in receiving waters is required of permittees. While we agree that the ultimate goal of stormwater trash management is to significantly reduce the amount of trash found in receiving waters to a level where no adverse impacts are occurring, such monitoring is extremely difficult to perform. In the Bay Area, permittees and volunteers have collected data on the amounts of trash removed during cleanup events in local creeks, rivers, and shorelines for over a decade. More recently, permittees have conducted trash assessments in creek and shoreline hotspots using standardized assessment methods developed by BASMAA member agencies. Additionally, because trash is transported to receiving waters from pathways other than MS4s (e.g., illegal dumping into receiving waters and wind), trash from these pathways may confound a permittee’s ability to observe trash reductions in creeks and shorelines. Therefore, even if receiving water monitoring were feasible, data collected in receiving waters should not be considered a primary indicator of compliance with the amendments or more specifically Track 2 or 3. Lastly, reporting on decreases in the amount of trash discharged from an MS4 or in receiving water on an annual basis does not recognize the high degree of interannual variability in the amount of trash discharged from MS4s or accumulated in receiving waters from all pathways. Improvements in the amount of trash discharged from an MS4 or the level of trash in receiving water should be evaluated over longer periods of time
BASMAA Comments on Proposed Statewide Trash Amendments August 5, 2014
9
where year-to-year variability can be “smoothed out.” For example, multi-year rolling averages may be a more accurate method to utilize. Recommendation – Revise the monitoring questions described in Chapters III of the Ocean Plan and IV of the ISWEBE Plan (i.e., Implementation Provision for Trash – Monitoring and Reporting) to read (bold/strikethrough):
(1) What type of and how many treatment controls*, institutional controls*, and/or multi-
benefit projects* have been used, and in what locations? (2) How many full capture systems* have been installed (if any), and in what locations
have they been installed, and what is the individual and cumulative area served by them?
(3) What is the effectiveness of the total combination of treatment controls*, institutional controls*, and multi-benefit projects* employed by the MS4* permittee?
(4) Has the amount of Trash* discharged from the MS4* decreased from the previous year? If so, by how much? If not, explain why.
(3) To what extent has trash from priority land areas been addressed? (5) Has the amount of Trash* in the MS4’s* receiving water(s) decreased from the
previous year? If so, by how much? If not, explain why.
4. Compliance Funding Mechanisms for Trash Amendments – Based on the economic analysis conducted by the State Water Board (Appendix C of the Amendments), Bay Area municipalities (~7.5M residents) should anticipate between $22 and $58 million dollars will need to be spent each year for the next 10 years to implement the proposed amendments ($220-$580 million). These resources are not currently available to permittees and potential funding mechanisms to raise revenue in the future provide significant challenges for stormwater management.4 Permittees need assistance from the State Water Board to develop funding sources to comply with the trash amendments. Grant funds have assisted many communities to install full capture devices, however this type of funding does not address the ongoing costs of managing and maintaining treatment devices and implementing other trash control measures. Recommendation: BASMAA recommends that the State Water Board partner with permittees to explore the creation of a non-competitive program to fund trash control measures. One such program that could serve as an example is the Used Oil Payment Program (OPP). The California Oil Recycling Enhancement Act provides funding to assist local governments in maintaining an ongoing used oil and used oil filter
4 Proposition 218 precludes stormwater entities from raising their fees for stormwater management (where fees even exist as the Phase II regulations came into effect after Prop 218 was passed) without voter approval. Even with the recent changes to Proposition 218 from AB 2403 (2014), requests to raise fees for full capture devices may not be considered eligible for Prop 218’s water supply exemption from these voting requirements.
BASMAA Comments on Proposed Statewide Trash Amendments August 5, 2014
10
collection/recycling program for their communities. The OPP is funded by a state tax on automotive oil. Another example is the program that exists for automobile tires. A fee is paid at purchase to fund the proper disposal at the end of the tire’s life.
Trash is a high priority pollutant of concern in the Bay Area and permittees are successfully implementing a framework that will meet water quality goals outlined in the MRP, and consistent with the proposed amendments. Our recommendations contained herein attempt to provide clarity to the relationship between the proposed amendments and the Bay Area trash reduction framework developed in collaboration with the San Francisco Bay Regional Water Board staff and currently being implemented by Bay Area Phase I permittees, while incorporating the lessons learned to-date through trash management in the Bay Area. We look forward to further discussion of the proposed trash amendments and our recommendations. Please do not hesitate to contact me if you have any questions or would like to discuss our comments and recommendations further. Sincerely,
Matt Fabry, BASMAA Chair; San Mateo Countywide Water Pollution Prevention Program
James Scanlin, Alameda Countywide Clean Water Program
Tom Dalziel, Contra Costa Clean Water Program
Kevin Cullen, Fairfield-Suisun Urban Runoff Management Program
Terri Fashing, Marin County Stormwater Pollution Prevention Program
BASMAA Comments on Proposed Statewide Trash Amendments August 5, 2014
11
Jamison Crosby, Napa County Stormwater Pollution Prevention Program
Adam Olivieri, Santa Clara Valley Urban Runoff Pollution Prevention Program
Pat Gothard, Sonoma County Water Agency
Lance Barnett, Vallejo Sanitation and Flood Control District cc: Bruce Wolfe, San Francisco Bay Regional Water Quality Control Board
Tom Mumley, San Francisco Bay Regional Water Quality Control Board BASMAA Board of Directors
Enclosure: San Francisco Bay Area Stormwater Trash Generation Rates: Final Technical Report
San Francisco Bay Area Stormwater Trash Generation Rates Final Technical Report
Prepared for:
Bay Area Stormwater Management Agencies Association (BASMAA)
Prepared by:
EOA, Inc. 1410 Jackson Street Oakland, CA 94612
June 20, 2014
ii 6/20/2014
Page Initially Left Blank
iii 6/20/2014
TABLE OF CONTENTS List of Tables ......................................................................................................................................................................... iv
List of Figures ......................................................................................................................................................................... v
List of Abbreviations .......................................................................................................................................................... vi
Executive Summary ........................................................................................................................................................... vii
1.0 Introduction ............................................................................................................................................................ 1 1.1 Trash Sources, Pathways and Influencing Factors ................................................................................ 3 1.1.1 Defining Urban Trash ....................................................................................................................................................... 3 1.1.2 Trash Sources and Pathways ........................................................................................................................................ 4 1.1.3 Factors Potentially Influencing Trash in Stormwater Conveyances ........................................................... 4
1.2. Lessons Learned from the Los Angeles Region ....................................................................................... 5 1.3 Conceptual Model of Trash Generation and Loading ............................................................................ 8
2.0 MONITORING DESIGN AND Methods ............................................................................................................ 10 2.1 Monitoring Site Selection ............................................................................................................................ 10 2.2 Sampling and Characterization Methodology ...................................................................................... 14 2.2.1 Sampling Procedure ....................................................................................................................................................... 14 2.2.2 Characterization Procedure ........................................................................................................................................ 14
2.3 Data Analysis Methods ................................................................................................................................. 16 2.3.1 Trash and Debris Generation Rates ......................................................................................................................... 16 2.3.2 Influential Factor Analyses .......................................................................................................................................... 18
2.4 Validation of Trash Generation Rates ..................................................................................................... 20 2.5 Quality Assurance and Control Procedures .......................................................................................... 20
3.0 Monitoring and Characterization Results ................................................................................................... 22 3.1 Statement of Data Quality ........................................................................................................................... 22 3.2 Trash and Debris Volumes, Weights and Item Counts ....................................................................... 22 3.2.1 Summary for All Events ................................................................................................................................................ 22 3.2.2 Trash and Debris by Monitoring Event .................................................................................................................. 25
4.0 Discussion of Trash Data .................................................................................................................................. 28 4.1 Temporal Variability in Trash Generation ............................................................................................ 28 4.2 Factors Influencing Trash Generation .................................................................................................... 29 4.2.1 Land Use ............................................................................................................................................................................... 30 4.2.2 Other Factors ..................................................................................................................................................................... 31
4.3 Final Baseline Trash Generation Rates .................................................................................................. 34 4.4 Validation of Trash Generation Rates ..................................................................................................... 35 4.5 Comparison Between Bay Area and Los Angeles Regions ................................................................ 36
5.0 Application of trash generation rates .......................................................................................................... 39 5.1 Trash Condition Categories and Initial Mapping ................................................................................ 39 5.2 Initial Assessments and Refinement of Maps ....................................................................................... 39 5.3 Delineation of Trash Management Areas .............................................................................................. 40 5.4 Baseline Trash Generation ......................................................................................................................... 40
6.0 REFERENCES ......................................................................................................................................................... 42
7.0 Glossary ................................................................................................................................................................. 44
Appendix A Monitoring Site Descriptions .............................................................................................................. A1
Appendix BQuality Assurance Calculations ........................................................................................................... B1
Appendix C Monitoring Results by Event and Site ................................................................................................ C1
Appendix D Multiple Regression Results ............................................................................................................... D1
Final Technical Report
iv 6/20/2014
LIST OF TABLES
Table 1.1. Los Angeles region trash generation rates in volume and weight by land use class. ................................ 7
Table 1.2. Daily trash generation rates (gal/acre) for wet and dry weather in the Los Angeles region. ............... 8
Table 2.1. Land use and household median income categories used to form monitoring strata. ........................... 10
Table 2.2. Numbers of sites in each land use and household median income monitoring stratum. ...................... 14
Table 2.3. Trash characterization classification system utilized during the study. ....................................................... 15
Table 2.4. Factors evaluated to assess correlations with trash generation in Los Angeles and San Francisco Bay urban areas. ............................................................................................................................................................................................ 19
Table 3.1.Number of sites sampled during each of four sampling events. ........................................................................ 22
Table 3.2. Descriptive statistics for trash monitoring data collected and rainfall documented during four sampling events (May 2011 – April 2012). ........................................................................................................................................ 23
Table 3.3. Number of CRV beverage containers, single use plastic grocery bags, and expanded polystyrene food service ware items identified during each sampling event. ............................................................................................ 24
Table 3.4. Descriptive statistics for trash monitoring data collected and rainfall documented during each of four sampling events (May 2011 – April 2012). .............................................................................................................................. 26
Table 3.5. Relative percentages of trash and debris by weight and volume observed during each of the four sampling events. ............................................................................................................................................................................................ 26
Table 4.1. Pearson correlation coefficients (r) for trash generation and influential factors. Only those factors exhibiting significant correlations (p < 0.05) with trash generation rates in residential and retail land use areas are shown. Factors exhibiting moderate/strong positive (r >0.6) or negative (r< ‐0.6) correlations are bolded. Factors selected as the basis for trash generation rates in each land use class are in red. ......................... 32
Table 4.2. San Francisco Bay Area annual trash generation rates for stormwater (gal/acre). ............................... 35
Table 4.3. Comparison of estimated trash loading based on trash generation rates and predicted street sweeping effectiveness, and trash observed in large full capture devices. ......................................................................... 36
Table 5.1. Trash generation categories and associated generation rates (gallons/acre/year). ............................. 39
Final Technical Report
v 6/20/2014
LIST OF FIGURES
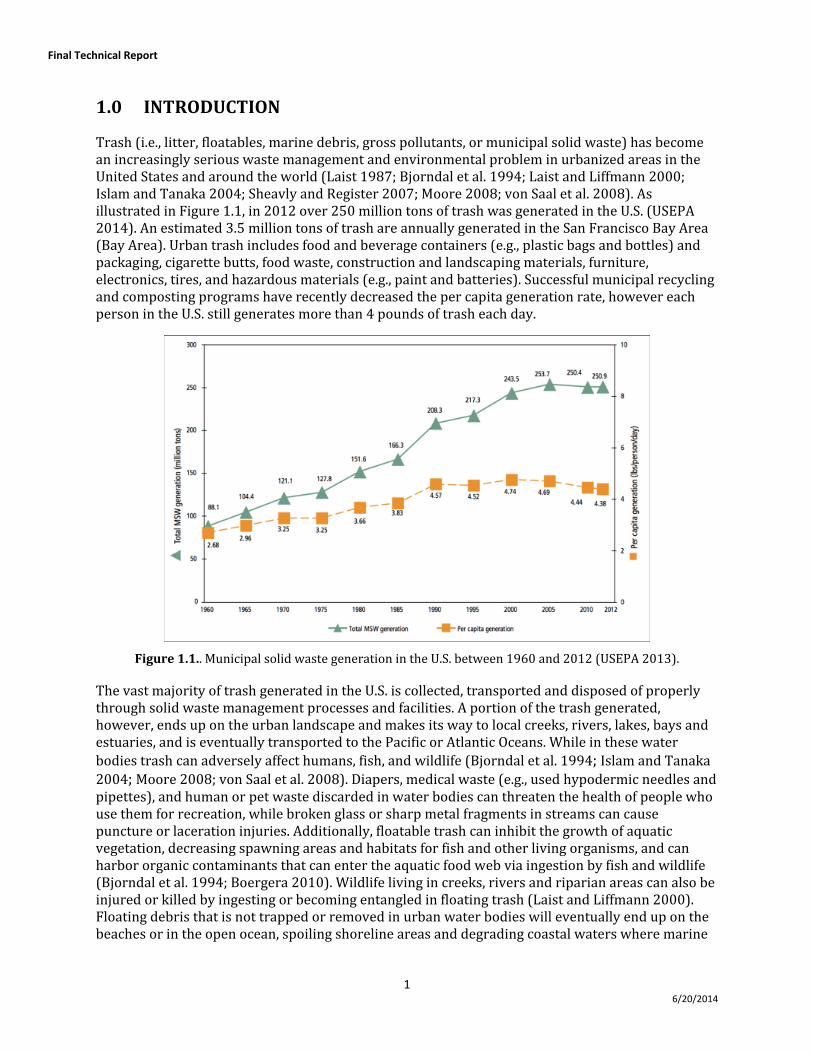
Figure 1.1.. Municipal solid waste generation in the U.S. between 1960 and 2012. ........................................................ 1
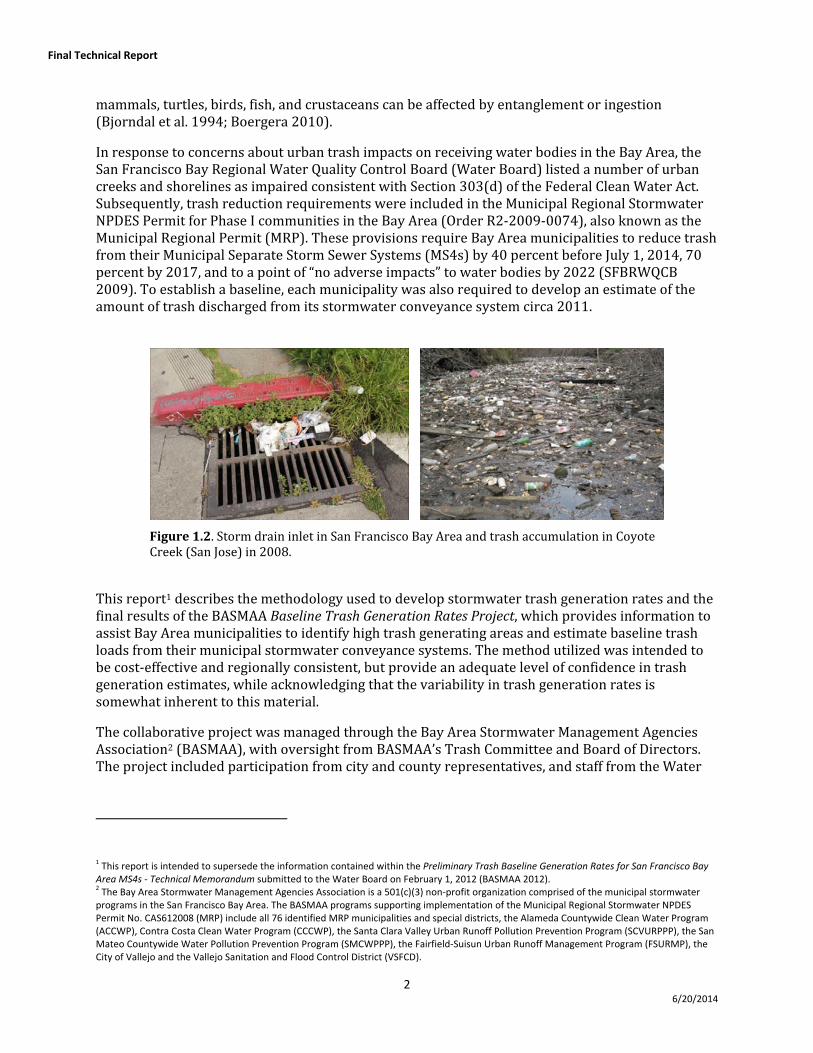
Figure 1.2. Storm drain inlet in San Francisco Bay Area and trash accumulation in Coyote Creek (San Jose) in 2008. ..................................................................................................................................................................................................................... 2
Figure 1.3. Potential trash sources and transport pathways, including stormwater conveyances, to urban creeks and shorelines. ................................................................................................................................................................................... 4
Figure 1.4. Daily trash generation rates by land use for dry and wet weather (storm) monitoring events in the Ballona Creek (A) and Los Angeles River (B) watersheds. ................................................................................................... 7
Figure 1.5. Ranges of daily trash generation rates among dry and wet weather monitoring events. Generation rates by weight (A) and volume (B). Note: volume was only recorded during the second year of the study. ...... 8
Figure 1.5. Conceptual model of trash generation and loading from Bay Area Stormwater Conveyances (i.e., MS4s). ................................................................................................................................................................................................................... 9
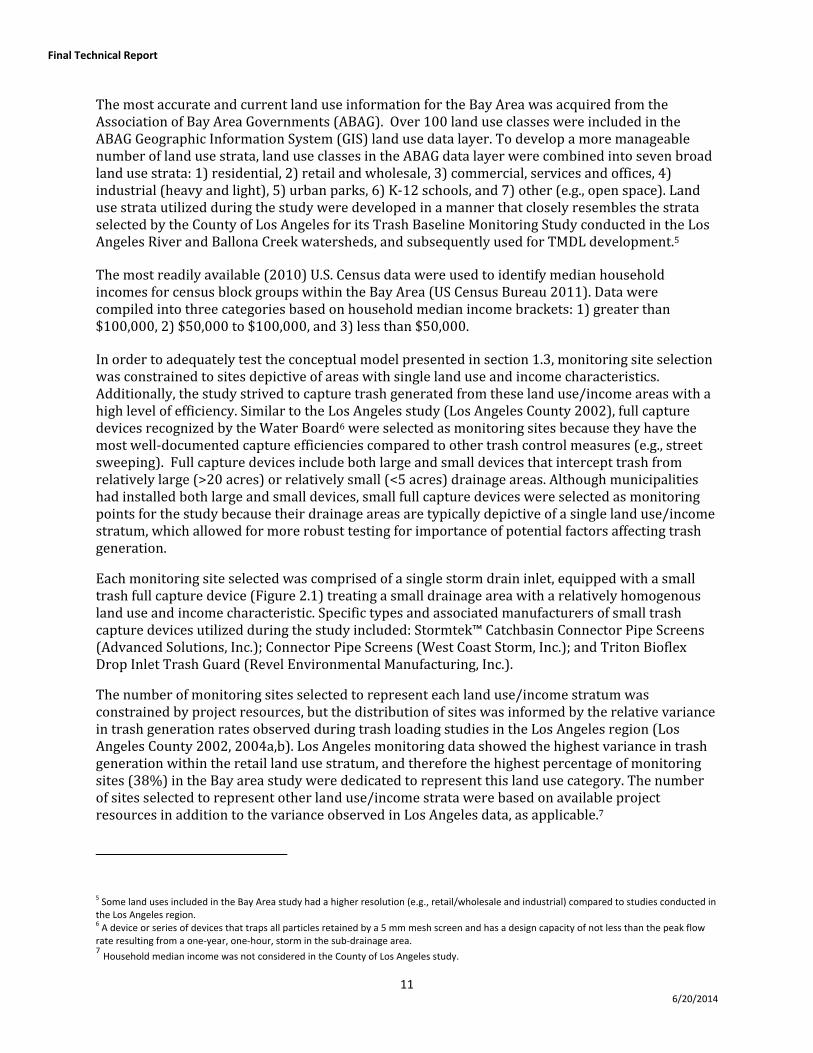
Figure 2.1. Example storm drain inlet screen utilized as a monitoring site. ..................................................................... 12
Figure 2.2. Monitoring sites included in the San Francisco Bay Area Trash Generation Rates Project. ............... 13
Figure 2.3. Trash sorting (left) and characterization (right). .................................................................................................. 16
Figure 2.4. Street sweeping effectiveness curve based on level of parking enforcement and the ratio of street sweeping frequency to storm frequency (adapted from Armitage 2001). .......................................................................... 18
Figure 3.2. Geographic relationships between County, Census Tract, Block Groups and Blocks (US Census Bureau 2011). ................................................................................................................................................................................................. 20
Figure 3.2. Percent of trash and debris by (A) volume and (B) weight that was characterized during the study. ................................................................................................................................................................................................................... 24
Figure 3.3. Linear regression of trash volumes and weights measured from 159 Bay Area monitoring sites. . 27
Figure 4.1. Ranges and medians (horizontal line in box) of trash generation for 58 sites monitored during all events. The statistical minimum (lower whisker) and maximum (upper whisker), 25th percentile (lower box), median (box midline) and 75th percentile (upper box) are presented. Circles are statistical outliers. ................ 29
Figure 4.2. Ranges of trash generation rates by land use class. The statistical minimum (lower whisker) and maximum (upper whisker), 25th percentile (lower box), median (horizontal line), mean (dashed line), and 75th percentile (upper box) are presented. Circles are statistical outliers. ....................................................................... 30
Figure 4.3. Linear regressions between Bay Area trash generation rates in residential (A) and retail (B) land use areas. 95th percentile confidence intervals (dotted line) and 95th percentile prediction intervals (dashed lines) are also shown. .................................................................................................................................................................................. 33
Figure 4.4. Ranges and median (vertical line) trash loading rates for by land use class for the San Francisco Bay Area and Los Angeles regions. The statistical minimum (lower whisker) and maximum (upper whisker), 25th percentile (lower box), median (horizontal line), mean (dashed line), and 75th percentile (upper box) are presented. Circles are statistical outliers. ................................................................................................................................... 37
Figure 5.1. Percentages of land area within applicable Bay Area municipal jurisdictions that have been identified in 2013 as generating low, moderate, high and very high levels of trash. ..................................................... 40
Figure 5.2. Regional map of annual stormwater trash generation in the San Francisco Bay Area. ........................ 41
Final Technical Report
vi 6/20/2014
LIST OF ABBREVIATIONS
ABAG Association of Bay Area Governments AP Accumulation Period BASMAA Bay Area Stormwater Management Agencies Association BMP Best Management Practice CRV California Redemption Value gal Gallon GIS Geographic Information System mm millimeter MRP San Francisco Bay Area Municipal Regional Stormwater NPDES Permit MS4s Municipal Separate Storm Sewer Systems NPDES National Pollutant Discharge Elimination System NWS National Weather Service RPD Relative Percent Difference SFBRWQCB San Francisco Bay Regional Water Quality Control Board TMDL Total Maximum Daily Load USEPA United States Environmental Protection Agency yr Year
Final Technical Report
vii 6/20/2014
EXECUTIVE SUMMARY
San Francisco Bay urban creeks and shorelines are impacted by trash/litter that is transported by stormwater and wind from urbanized areas or directly dumped into these water bodies. Trash provisions in the Municipal Regional Stormwater NPDES Permit for the San Francisco Bay Area require municipalities to reduce trash from their stormwater discharges to a point of “no adverse impacts” to water bodies by 2022. In 2010, Bay Area municipalities began a collaborative approach to establish stormwater trash generation rates that could serve as the baseline by which progress towards trash reduction goals could be evaluated. Based on the resources available, the trash generation project was intended to develop first‐order estimates of trash generation in Bay Area urban areas.
As a first step, the Bay Area Stormwater Management Agencies Association (BASMAA) conducted a literature review of previous trash generation studies and developed a simple conceptual model of trash generation and loading. A project‐specific sampling and analysis plan was then developed. The plan describes the monitoring and characterization methodology, which was designed to test the conceptual model and the importance of a number of factors that may influence trash generation. The methods employed incorporated lessons learned from trash generation studies conducted in urbanized areas in the U.S. and worldwide. Trash data collected during a large study conducted in the Los Angeles region was analyzed as part of the Bay Area project and the results indicated that no relationship between trash generation in that region (as measured by the amount of trash in “full capture” storm drain inlet devices) and the amount, intensity or duration of rainfall was apparent. Correlations between rainfall and trash generation were neither strong (r>0.8) nor significant (p<0.05). Trash transport processes other than stormwater runoff, such as wind, direct dumping into inlets, or street sweepers pushing trash into inlets could have played an important role in the amount of trash measured in inlets during the study. This finding assisted BASMAA in conducting a less intensive study in the Bay Area, which reduced project costs.
Between 2010 and 2011, over 150 trash full capture devices located in Bay Area storm drain inlets were monitored for trash. Trash and debris was intercepted, collected and characterized three to four times at each inlet/site. Monitoring sites represented seven different land use classes and a range of household income levels. Trash volumes measured during the course of the study were used to calculate annual generation rates for each site. The range of generation rates for sites within the residential and retail land uses classes were then compared to over 30 factors, such as population density, income, and drainage area, that were thought to potentially influence trash generation. Significant correlations were observed between residential and retail trash generation rates and many of the influential factors evaluated. Median household income was identified as the most consistent predictor of trash generation in areas draining predominantly retail or residential land uses, and therefore was incorporated into trash generation rates for these land use categories. Best estimates for trash generation rates in the Bay Area ranged from 0.5 to 150 gallons/acre per year, depending on the land use and the median household income level. These rates were not found to be significantly different than those recently developed for the Los Angeles region. To develop an initial preliminary estimate of the total amount of trash generated in each Bay Area municipality, trash generation rates were then applied to land areas via GIS. Land areas were then grouped into four categories (very high, high, moderate and low) based on generation rate, and assigned corresponding colors that were subsequently illustrated on trash generation maps. Maps and generation rate categories were then reviewed and refined by municipalities to ensure that modeled trash generation rates were correctly assigned to parcels or groups of parcels. Where appropriate, municipalities refined the generation rate categories based on their current
Final Technical Report
viii 6/20/2014
knowledge of trash generation and problem areas within their jurisdictional boundaries and on‐land visual assessments. The resulting maps and associated trash generation formed the best baseline estimate of trash generated in the urban portions of the Bay Area and, unless intercepted, available for transport to receiving waters via stormwater conveyances.
Final Technical Report
1 6/20/2014
1.0 INTRODUCTION
Trash (i.e., litter, floatables, marine debris, gross pollutants, or municipal solid waste) has become an increasingly serious waste management and environmental problem in urbanized areas in the United States and around the world (Laist 1987; Bjorndal et al. 1994; Laist and Liffmann 2000; Islam and Tanaka 2004; Sheavly and Register 2007; Moore 2008; von Saal et al. 2008). As illustrated in Figure 1.1, in 2012 over 250 million tons of trash was generated in the U.S. (USEPA 2014). An estimated 3.5 million tons of trash are annually generated in the San Francisco Bay Area (Bay Area). Urban trash includes food and beverage containers (e.g., plastic bags and bottles) and packaging, cigarette butts, food waste, construction and landscaping materials, furniture, electronics, tires, and hazardous materials (e.g., paint and batteries). Successful municipal recycling and composting programs have recently decreased the per capita generation rate, however each person in the U.S. still generates more than 4 pounds of trash each day.
Figure 1.1.. Municipal solid waste generation in the U.S. between 1960 and 2012 (USEPA 2013). The vast majority of trash generated in the U.S. is collected, transported and disposed of properly through solid waste management processes and facilities. A portion of the trash generated, however, ends up on the urban landscape and makes its way to local creeks, rivers, lakes, bays and estuaries, and is eventually transported to the Pacific or Atlantic Oceans. While in these water bodies trash can adversely affect humans, fish, and wildlife (Bjorndal et al. 1994; Islam and Tanaka 2004; Moore 2008; von Saal et al. 2008). Diapers, medical waste (e.g., used hypodermic needles and pipettes), and human or pet waste discarded in water bodies can threaten the health of people who use them for recreation, while broken glass or sharp metal fragments in streams can cause puncture or laceration injuries. Additionally, floatable trash can inhibit the growth of aquatic vegetation, decreasing spawning areas and habitats for fish and other living organisms, and can harbor organic contaminants that can enter the aquatic food web via ingestion by fish and wildlife (Bjorndal et al. 1994; Boergera 2010). Wildlife living in creeks, rivers and riparian areas can also be injured or killed by ingesting or becoming entangled in floating trash (Laist and Liffmann 2000). Floating debris that is not trapped or removed in urban water bodies will eventually end up on the beaches or in the open ocean, spoiling shoreline areas and degrading coastal waters where marine
Final Technical Report
2 6/20/2014
mammals, turtles, birds, fish, and crustaceans can be affected by entanglement or ingestion (Bjorndal et al. 1994; Boergera 2010).
In response to concerns about urban trash impacts on receiving water bodies in the Bay Area, the San Francisco Bay Regional Water Quality Control Board (Water Board) listed a number of urban creeks and shorelines as impaired consistent with Section 303(d) of the Federal Clean Water Act. Subsequently, trash reduction requirements were included in the Municipal Regional Stormwater NPDES Permit for Phase I communities in the Bay Area (Order R2‐2009‐0074), also known as the Municipal Regional Permit (MRP). These provisions require Bay Area municipalities to reduce trash from their Municipal Separate Storm Sewer Systems (MS4s) by 40 percent before July 1, 2014, 70 percent by 2017, and to a point of “no adverse impacts” to water bodies by 2022 (SFBRWQCB 2009). To establish a baseline, each municipality was also required to develop an estimate of the amount of trash discharged from its stormwater conveyance system circa 2011.
Figure 1.2. Storm drain inlet in San Francisco Bay Area and trash accumulation in Coyote Creek (San Jose) in 2008.
This report1 describes the methodology used to develop stormwater trash generation rates and the final results of the BASMAA Baseline Trash Generation Rates Project, which provides information to assist Bay Area municipalities to identify high trash generating areas and estimate baseline trash loads from their municipal stormwater conveyance systems. The method utilized was intended to be cost‐effective and regionally consistent, but provide an adequate level of confidence in trash generation estimates, while acknowledging that the variability in trash generation rates is somewhat inherent to this material.
The collaborative project was managed through the Bay Area Stormwater Management Agencies Association2 (BASMAA), with oversight from BASMAA’s Trash Committee and Board of Directors. The project included participation from city and county representatives, and staff from the Water
1 This report is intended to supersede the information contained within the Preliminary Trash Baseline Generation Rates for San Francisco Bay Area MS4s ‐ Technical Memorandum submitted to the Water Board on February 1, 2012 (BASMAA 2012). 2 The Bay Area Stormwater Management Agencies Association is a 501(c)(3) non‐profit organization comprised of the municipal stormwater programs in the San Francisco Bay Area. The BASMAA programs supporting implementation of the Municipal Regional Stormwater NPDES Permit No. CAS612008 (MRP) include all 76 identified MRP municipalities and special districts, the Alameda Countywide Clean Water Program (ACCWP), Contra Costa Clean Water Program (CCCWP), the Santa Clara Valley Urban Runoff Pollution Prevention Program (SCVURPPP), the San Mateo Countywide Water Pollution Prevention Program (SMCWPPP), the Fairfield‐Suisun Urban Runoff Management Program (FSURMP), the City of Vallejo and the Vallejo Sanitation and Flood Control District (VSFCD).
Final Technical Report
3 6/20/2014
Board and non‐governmental organizations. The project was managed by EOA, Inc. with assistance from Cascadia Consulting Group. The project included the following tasks:
1. Conduct review of the worldwide literature on trash/litter studies;
2. Develop a conceptual model that depicts the current understanding of factors that influence the amounts of trash in stormwater conveyances;
3. Develop and implement a cost‐effective optimized sampling and analysis plan that provides data of known quality that can be used to establish trash generation rates for all applicable Bay Area municipalities;
4. Test the conceptual model through statistical evaluations of the data collected to determine the most influential factors affecting trash generation;
5. Develop a set of trash generation rates based on statistical evaluations that to the extent possible explain the variability in trash generation; and,
6. Provide tools and guidance to Bay Area municipalities that allow the effective application of trash generation rates towards developing estimates of trash generated in their jurisdictional areas and identifying high priority trash problem areas.
1.1 Trash Sources, Pathways and Influencing Factors
1.1.1 Defining Urban Trash
The Bay Area is known as one of the epicenters of the environmental movement in the U.S and the world. With regards to municipal stormwater, the first National Pollutant Discharge Elimination System (NPDES) permit in the nation was issued to Bay Area municipalities in the early 1990’s. These permits generally focused on implementing control measures (also known as Best Management Practices or BMPs) associated with all types of stormwater pollutants and did not require management actions directed at specific pollutants of concern (e.g., urban trash).
Despite the implementation of stringent municipal stormwater control and solid waste management programs, trash continues to reach receiving waters through stormwater conveyance systems and other pathways. The expanding population and consumer culture has likely exacerbated this issue by continuing to create a massive demand for non‐durable or disposable products, most of which are smaller in size, relatively light weight, not recyclable, and can easily find their way into water bodies. 3 Based on previous studies carried out in the U.S. and around the world, products and packaging made of plastic frequently comprise the majority of trash found in creeks, rivers and lakes, beaches and oceans (Redford et al. 1992; Cornelius et al. 1994; Allison and Chiew 1995; Armitage and Rooseboom 2000; Marais and Armitage 2003; Ocean Conservancy 2013). These products include single‐use bags, packaging and films, containers, bottles, and polystyrene products/packaging. Products made of paper, metal, glass and other materials are typically observed less frequently, with the exception of cigarettes which generally are the most frequently observed item (by count) in most cleanup or assessment events.
Previous studies have developed varying definitions of “urban trash” or litter, but generally agree that vegetative debris, street dirt, sand, and sediment are not defined as trash. For the purposes of
3 9% of the total plastic waste generated in 2012 was recovered for recycling (USEPA 2014)
Final Technical Report
4 6/20/2014
this study, urban trash is defined as all human‐made materials, excluding sediments, sand, vegetation, oil and grease, and exotic species that cannot pass through a 5 millimeter (mm) mesh screen.
1.1.2 Trash Sources and Pathways
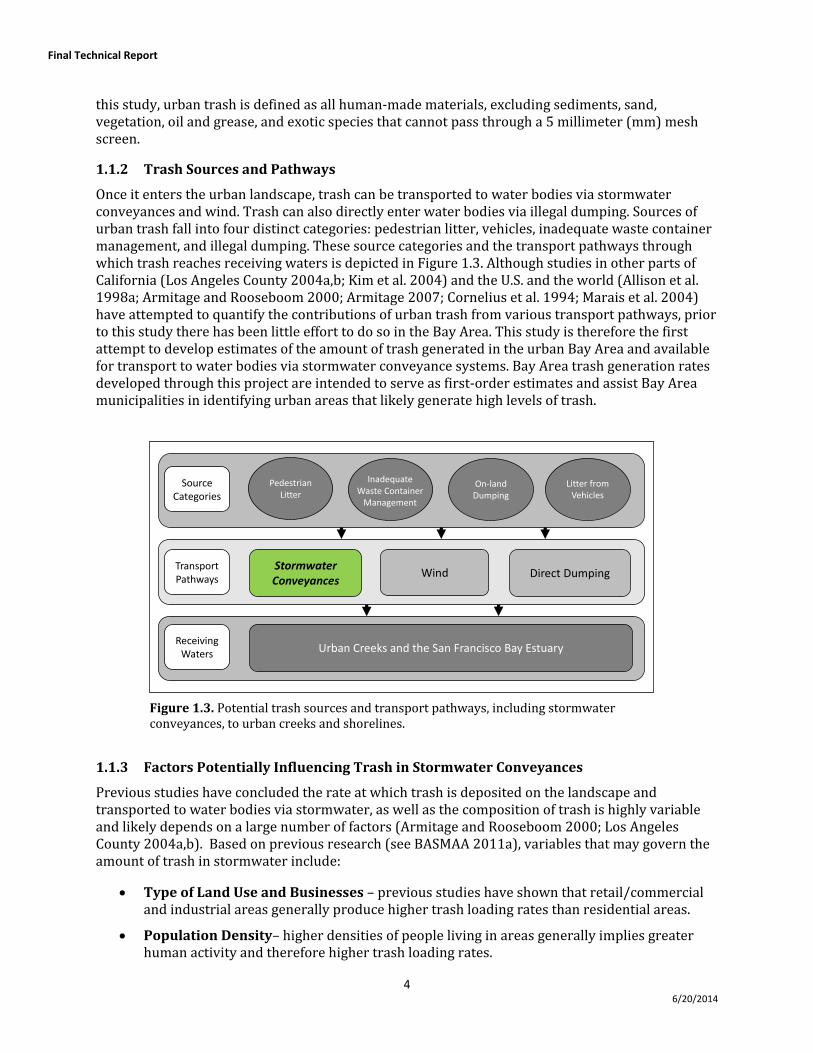
Once it enters the urban landscape, trash can be transported to water bodies via stormwater conveyances and wind. Trash can also directly enter water bodies via illegal dumping. Sources of urban trash fall into four distinct categories: pedestrian litter, vehicles, inadequate waste container management, and illegal dumping. These source categories and the transport pathways through which trash reaches receiving waters is depicted in Figure 1.3. Although studies in other parts of California (Los Angeles County 2004a,b; Kim et al. 2004) and the U.S. and the world (Allison et al. 1998a; Armitage and Rooseboom 2000; Armitage 2007; Cornelius et al. 1994; Marais et al. 2004) have attempted to quantify the contributions of urban trash from various transport pathways, prior to this study there has been little effort to do so in the Bay Area. This study is therefore the first attempt to develop estimates of the amount of trash generated in the urban Bay Area and available for transport to water bodies via stormwater conveyance systems. Bay Area trash generation rates developed through this project are intended to serve as first‐order estimates and assist Bay Area municipalities in identifying urban areas that likely generate high levels of trash.
Figure 1.3. Potential trash sources and transport pathways, including stormwater conveyances, to urban creeks and shorelines.
1.1.3 Factors Potentially Influencing Trash in Stormwater Conveyances
Previous studies have concluded the rate at which trash is deposited on the landscape and transported to water bodies via stormwater, as well as the composition of trash is highly variable and likely depends on a large number of factors (Armitage and Rooseboom 2000; Los Angeles County 2004a,b). Based on previous research (see BASMAA 2011a), variables that may govern the amount of trash in stormwater include:
Type of Land Use and Businesses – previous studies have shown that retail/commercial and industrial areas generally produce higher trash loading rates than residential areas.
Population Density– higher densities of people living in areas generally implies greater human activity and therefore higher trash loading rates.
Pedestrian Litter
Litter from Vehicles
On‐land Dumping
Source Categories
Wind Direct Dumping
Urban Creeks and the San Francisco Bay Estuary
Transport Pathways
Receiving Waters
Stormwater Conveyances
Inadequate Waste Container Management
Final Technical Report
5 6/20/2014
Income Level of the Community – based on the results of previous studies, it is hypothesized that lower income areas are more likely to have higher levels of trash deposited onto the landscape and available for transport to urban receiving waters, compared to areas with higher incomes.
Rainfall/Runoff Patterns – Litter will accumulate on the landscape until it is either cleaned up, intercepted via street sweepers or other maintenance activities, or transported to conveyances via stormwater runoff. Long dry spells give greater opportunity for management actions to take place, but also greater opportunity for trash to accumulate and be swept down the stormwater conveyance system via runoff.
Street Sweeping Effectiveness – Street sweeping is performed at varying frequencies and efficiencies in Bay Area municipalities. Based on the literature, the more frequent sweeping is conducted, and the greater the ability to reach the curb where litter accumulates, the greater the likelihood of intercepting trash that accumulates on the street surface prior to it entering storm drains.
Level of Vehicular Traffic –litter from vehicles and uncovered loads disperse trash onto the watershed landscape. Therefore, it is hypothesized that the greater the number of vehicles that travel through a community, the higher the trash loading rates.
Level of Environmental Concern in the Community – communities with a greater percentage of individuals with more established environmental ethics, for example a willingness to recycle, compost and minimize waste, will likely have less trash accumulate on the landscape.
1.2. Lessons Learned from the Los Angeles Region
Prior to the listing of Bay Area water bodies as impaired by trash, the Los Angeles Regional Water Quality Control Board identified the Los Angeles River, Ballona Creek and other water bodies as impaired by this pollutant. These listings in the LA region spawned baseline trash generation monitoring in the Los Angeles River and Ballona Creek watersheds to determine the amount of trash discharged from stormwater conveyance systems to these water bodies. Trash monitoring was conducted by the County of Los Angeles between 2002 and 2004. Data generated through this project were used to develop trash generation rates incorporated into the Total Maximum Daily Load (TMDL) for each of these two water bodies.
In total, the County of Los Angeles selected and monitored trash generation in 175 sites. Each site was comprised of 2 to 5 storm drain inlets (590 in total) equipped with full capture devices. Each site was also identified as draining one of five land use classes (commercial, industrial, high density single family residential, low density single family residential, and open space/urban parks). County staff identified the drainage area for each storm drain inlet included in the study. Trash intercepted by full capture devices during consecutive wet or dry weather events4 was removed, dried, and weighed. Volume was also measured, but only during the second year of sampling (storm events 10‐17 and dry events 2‐3). The weight or volume of all trash removed from inlets within the same land use class was then summed and divided by the total number of days trash accumulated at the sites. The results were daily trash generation rates (gal or lbs/acre) for each land use class.
4 Ballona Creek = 15 wet and 3 dry weather events; Los Angeles River = 17 wet and 3 dry weather events.
Final Technical Report
6 6/20/2014
In an effort to evaluate lessons learned in the Los Angeles region, trash data were obtained from the County of Los Angeles and reviewed prior to the development of the conceptual model of trash generation and loading described in the next section. Because the data from the Los Angeles region were collected using methods similar to those proposed for the Bay Area study, the data were evaluated to inform Bay Area sampling design. Specifically, data collected in the Los Angeles region were evaluated for variance in trash generation rates within each land use class, and the effects of antecedent dry weather and accumulation periods on trash generation. Because the effects of rainfall volumes and intensities for each storm and site combination were not evaluated in Los Angeles project reports (Los Angeles County 2004a,b), BASMAA was interested in identifying whether storm size and intensity affected trash generation in the Los Angeles study and should therefore be considered in the Bay Area sampling design.
To evaluate the effects of rainfall and other potentially influential factors (see Table 2.4) on trash generation, BASMAA acquired rainfall volumes and intensities from local rainfall gages in closest proximity to each site monitored in the Los Angeles region. Pearson correlation coefficients were then calculated for trash generation rates in combination with each of these factors. The following findings were developed based on the evaluation of Los Angeles regional trash generation data presented in Los Angeles County (2004a,b):
Monitoring and trash characterization methodologies utilized during the project were not well documented in the project plans or reports. The quality of the data reviewed is therefore unknown. Inconsistencies in methods could have led to unexplainable data and reduced the ability to observe relationships between trash generation and other factors (e.g., rainfall).
The project yielded average (mean) trash generation rates for five land use classes listed in Table 1.1.
Generation rates for the Los Angeles region did not explicitly consider the effects that existing control measure implementation or other factors (e.g., income, population density, proximity to retail land uses) may have had on these rates. Specifically, although the level of street sweeping differed among the sites, differences in levels of trash intercepted as a result of this control measure were not accounted for in the trash generation rates established. The effects of street sweeping could not be evaluated by BASMAA due to the lack of readily available information on street sweeping programs in the Los Angeles region.
Based on the correlation analysis conducted by BASMAA, neither strong (r>0.7) nor significant (p<0.05) relationships were observed between trash generation and factors such as hydrology, household income, property value, population density, level of education and other demographics.
Limited analyses and interpretation of the trash data were conducted by the County of Los Angeles. Specifically, variability in generation rates over time as a function of the intensity and duration of storm events were not fully evaluated. To analyze the data further and assess relationships between rainfall and trash generation, BASMAA compiled rainfall data associated with each site and event.
Based on the BASMAA’s analysis, daily trash generation rates (lbs/acre) were shown to have varied significantly during over the course of the Los Angeles region project. Figures 1.4 (A) and (B) illustrate the daily trash generation rates for Ballona Creek and the Los Angeles River sites, respectively, in comparison to rainfall volume for each event monitored. Generation rates (volume) for all wet and dry weather events in both watersheds are listed in Table 1.2. Based on comparisons between rainfall and trash generation, the amount of
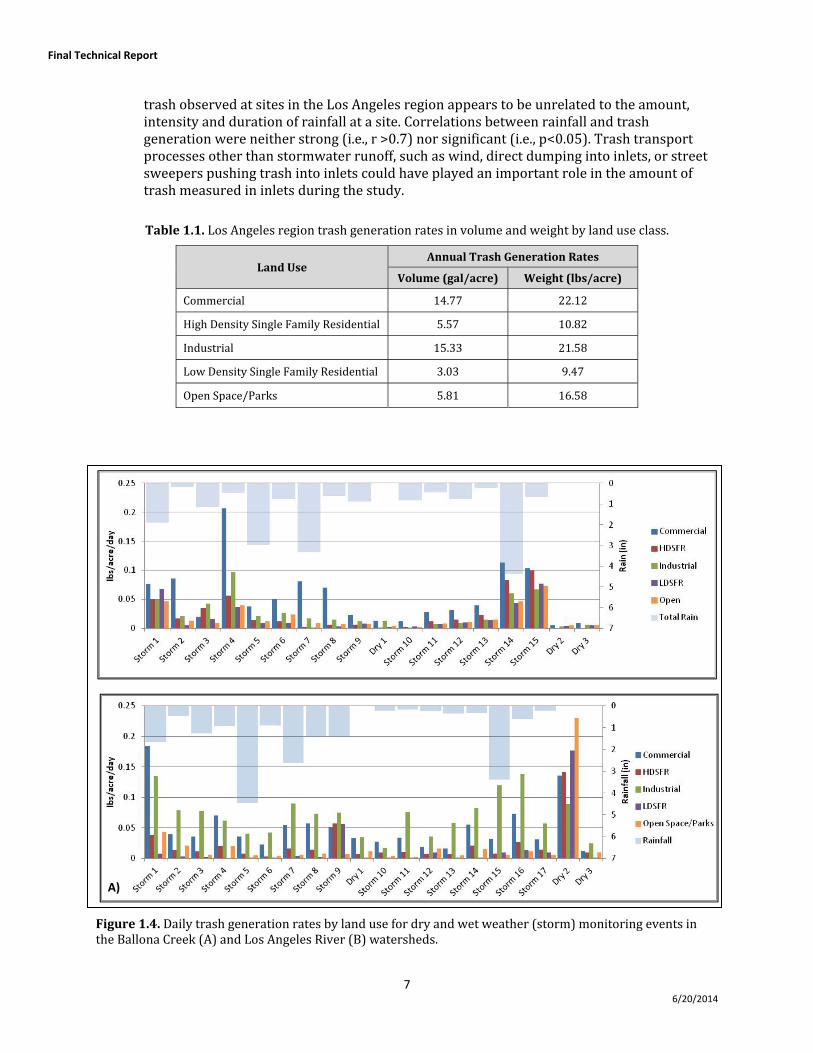
Final Technical Report
7 6/20/2014
trash observed at sites in the Los Angeles region appears to be unrelated to the amount, intensity and duration of rainfall at a site. Correlations between rainfall and trash generation were neither strong (i.e., r >0.7) nor significant (i.e., p<0.05). Trash transport processes other than stormwater runoff, such as wind, direct dumping into inlets, or street sweepers pushing trash into inlets could have played an important role in the amount of trash measured in inlets during the study.
Table 1.1. Los Angeles region trash generation rates in volume and weight by land use class.
Land Use Annual Trash Generation Rates
Volume (gal/acre) Weight (lbs/acre)
Commercial 14.77 22.12
High Density Single Family Residential 5.57 10.82
Industrial 15.33 21.58
Low Density Single Family Residential 3.03 9.47
Open Space/Parks 5.81 16.58
Figure 1.4. Daily trash generation rates by land use for dry and wet weather (storm) monitoring events in the Ballona Creek (A) and Los Angeles River (B) watersheds.
A)
Final Technical Report
8 6/20/2014
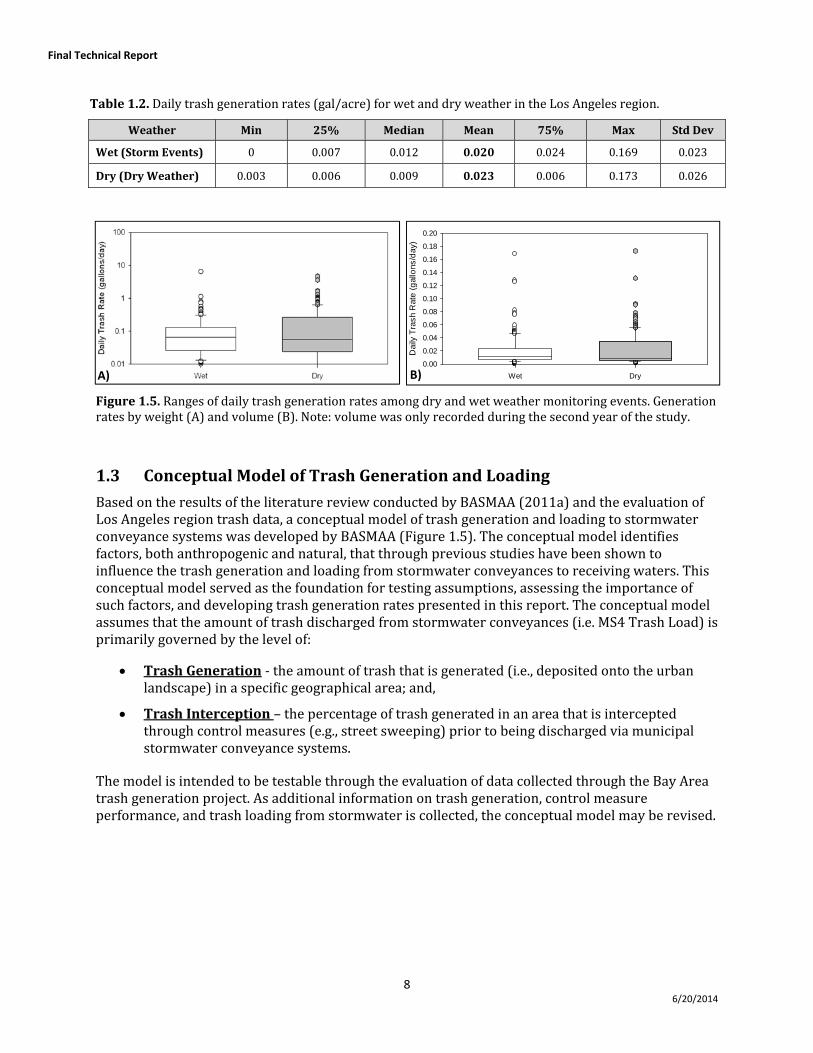
Table 1.2. Daily trash generation rates (gal/acre) for wet and dry weather in the Los Angeles region.
Weather Min 25% Median Mean 75% Max Std Dev
Wet (Storm Events) 0 0.007 0.012 0.020 0.024 0.169 0.023
Dry (Dry Weather) 0.003 0.006 0.009 0.023 0.006 0.173 0.026
Figure 1.5. Ranges of daily trash generation rates among dry and wet weather monitoring events. Generation rates by weight (A) and volume (B). Note: volume was only recorded during the second year of the study.
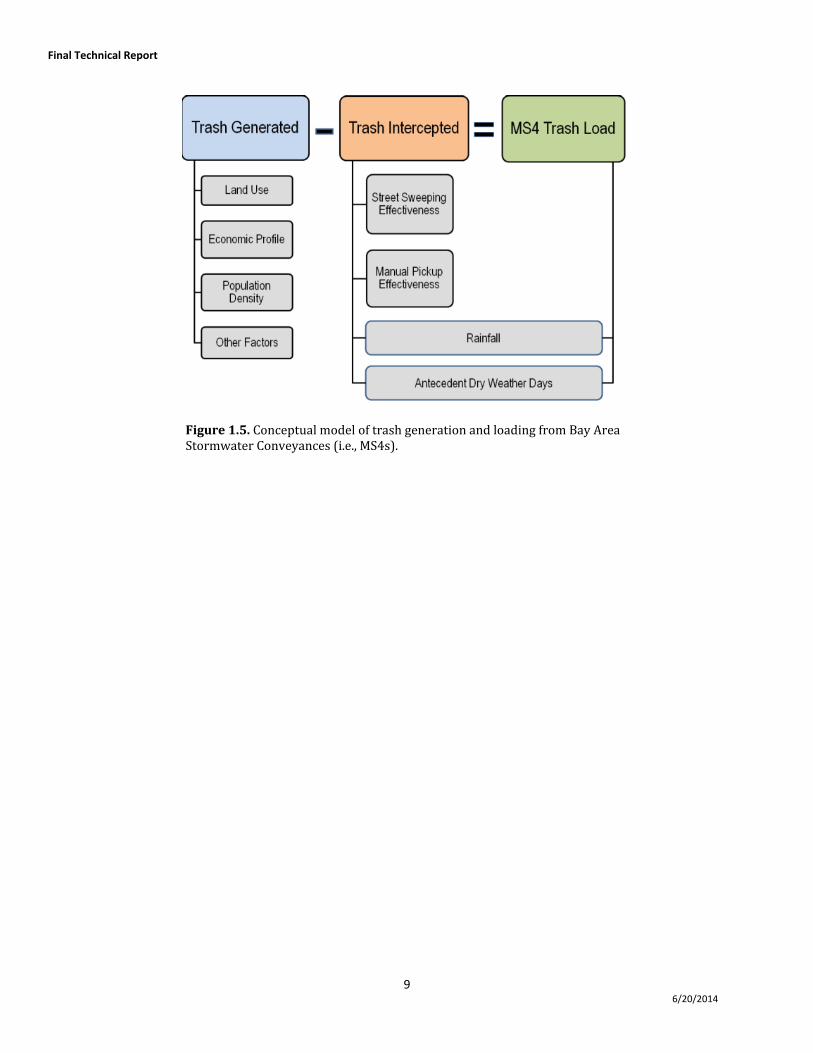
1.3 Conceptual Model of Trash Generation and Loading
Based on the results of the literature review conducted by BASMAA (2011a) and the evaluation of Los Angeles region trash data, a conceptual model of trash generation and loading to stormwater conveyance systems was developed by BASMAA (Figure 1.5). The conceptual model identifies factors, both anthropogenic and natural, that through previous studies have been shown to influence the trash generation and loading from stormwater conveyances to receiving waters. This conceptual model served as the foundation for testing assumptions, assessing the importance of such factors, and developing trash generation rates presented in this report. The conceptual model assumes that the amount of trash discharged from stormwater conveyances (i.e. MS4 Trash Load) is primarily governed by the level of:
Trash Generation ‐ the amount of trash that is generated (i.e., deposited onto the urban landscape) in a specific geographical area; and,
Trash Interception – the percentage of trash generated in an area that is intercepted through control measures (e.g., street sweeping) prior to being discharged via municipal stormwater conveyance systems.
The model is intended to be testable through the evaluation of data collected through the Bay Area trash generation project. As additional information on trash generation, control measure performance, and trash loading from stormwater is collected, the conceptual model may be revised.
Wet Dry
Dai
ly T
rash
Rat
e (
gal
lons
/day
)
0.00
0.02
0.04
0.06
0.08
0.10
0.12
0.14
0.16
0.18
0.20
A) B)
Final Technical Report
9 6/20/2014
Figure 1.5. Conceptual model of trash generation and loading from Bay Area Stormwater Conveyances (i.e., MS4s).
Final Technical Report
10 6/20/2014
2.0 MONITORING DESIGN AND METHODS
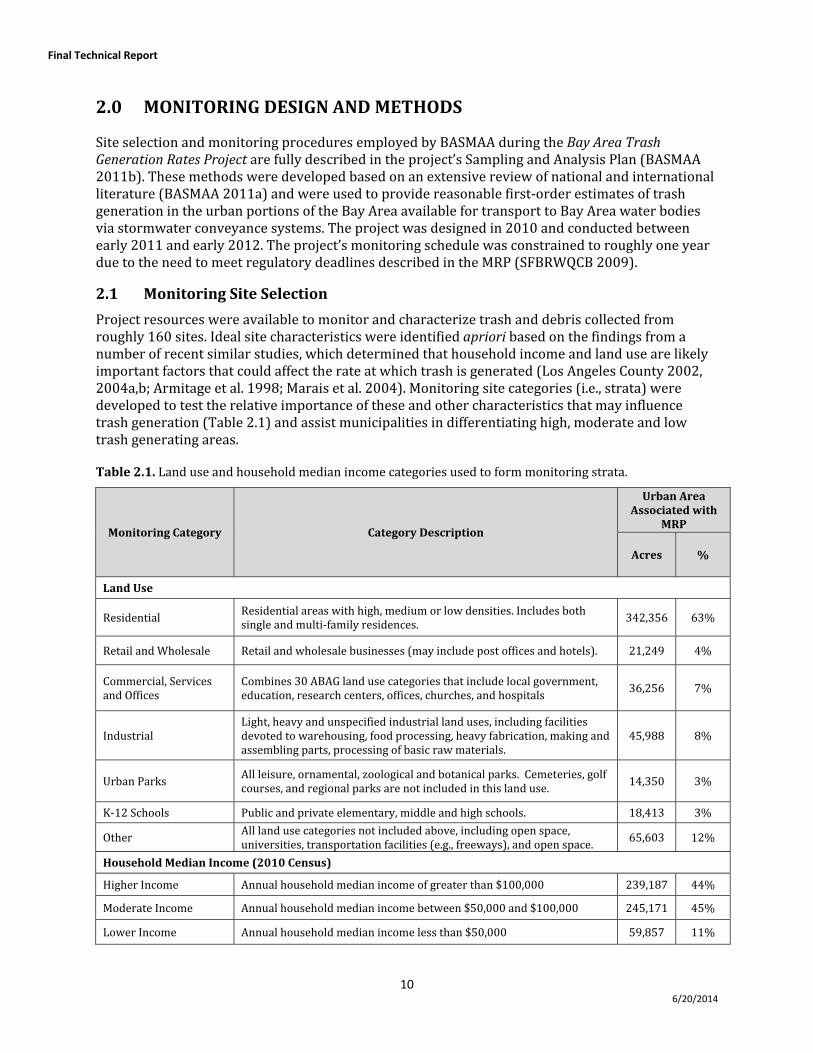
Site selection and monitoring procedures employed by BASMAA during the Bay Area Trash Generation Rates Project are fully described in the project’s Sampling and Analysis Plan (BASMAA 2011b). These methods were developed based on an extensive review of national and international literature (BASMAA 2011a) and were used to provide reasonable first‐order estimates of trash generation in the urban portions of the Bay Area available for transport to Bay Area water bodies via stormwater conveyance systems. The project was designed in 2010 and conducted between early 2011 and early 2012. The project’s monitoring schedule was constrained to roughly one year due to the need to meet regulatory deadlines described in the MRP (SFBRWQCB 2009).
2.1 Monitoring Site Selection
Project resources were available to monitor and characterize trash and debris collected from roughly 160 sites. Ideal site characteristics were identified apriori based on the findings from a number of recent similar studies, which determined that household income and land use are likely important factors that could affect the rate at which trash is generated (Los Angeles County 2002, 2004a,b; Armitage et al. 1998; Marais et al. 2004). Monitoring site categories (i.e., strata) were developed to test the relative importance of these and other characteristics that may influence trash generation (Table 2.1) and assist municipalities in differentiating high, moderate and low trash generating areas.
Table 2.1. Land use and household median income categories used to form monitoring strata.
Monitoring Category Category Description
Urban Area Associated with
MRP
Acres %
Land Use
Residential Residential areas with high, medium or low densities. Includes both single and multi‐family residences. 342,356 63%
Retail and Wholesale Retail and wholesale businesses (may include post offices and hotels). 21,249 4%
Commercial, Services and Offices
Combines 30 ABAG land use categories that include local government, education, research centers, offices, churches, and hospitals
36,256 7%
Industrial Light, heavy and unspecified industrial land uses, including facilities devoted to warehousing, food processing, heavy fabrication, making and assembling parts, processing of basic raw materials.
45,988 8%
Urban Parks All leisure, ornamental, zoological and botanical parks. Cemeteries, golf courses, and regional parks are not included in this land use.
14,350 3%
K‐12 Schools Public and private elementary, middle and high schools. 18,413 3%
Other All land use categories not included above, including open space, universities, transportation facilities (e.g., freeways), and open space.
65,603 12%
Household Median Income (2010 Census)
Higher Income Annual household median income of greater than $100,000 239,187 44%
Moderate Income Annual household median income between $50,000 and $100,000 245,171 45%
Lower Income Annual household median income less than $50,000 59,857 11%
Final Technical Report
11 6/20/2014
The most accurate and current land use information for the Bay Area was acquired from the Association of Bay Area Governments (ABAG). Over 100 land use classes were included in the ABAG Geographic Information System (GIS) land use data layer. To develop a more manageable number of land use strata, land use classes in the ABAG data layer were combined into seven broad land use strata: 1) residential, 2) retail and wholesale, 3) commercial, services and offices, 4) industrial (heavy and light), 5) urban parks, 6) K‐12 schools, and 7) other (e.g., open space). Land use strata utilized during the study were developed in a manner that closely resembles the strata selected by the County of Los Angeles for its Trash Baseline Monitoring Study conducted in the Los Angeles River and Ballona Creek watersheds, and subsequently used for TMDL development.5
The most readily available (2010) U.S. Census data were used to identify median household incomes for census block groups within the Bay Area (US Census Bureau 2011). Data were compiled into three categories based on household median income brackets: 1) greater than $100,000, 2) $50,000 to $100,000, and 3) less than $50,000.
In order to adequately test the conceptual model presented in section 1.3, monitoring site selection was constrained to sites depictive of areas with single land use and income characteristics. Additionally, the study strived to capture trash generated from these land use/income areas with a high level of efficiency. Similar to the Los Angeles study (Los Angeles County 2002), full capture devices recognized by the Water Board6 were selected as monitoring sites because they have the most well‐documented capture efficiencies compared to other trash control measures (e.g., street sweeping). Full capture devices include both large and small devices that intercept trash from relatively large (>20 acres) or relatively small (<5 acres) drainage areas. Although municipalities had installed both large and small devices, small full capture devices were selected as monitoring points for the study because their drainage areas are typically depictive of a single land use/income stratum, which allowed for more robust testing for importance of potential factors affecting trash generation.
Each monitoring site selected was comprised of a single storm drain inlet, equipped with a small trash full capture device (Figure 2.1) treating a small drainage area with a relatively homogenous land use and income characteristic. Specific types and associated manufacturers of small trash capture devices utilized during the study included: Stormtek™ Catchbasin Connector Pipe Screens (Advanced Solutions, Inc.); Connector Pipe Screens (West Coast Storm, Inc.); and Triton Bioflex Drop Inlet Trash Guard (Revel Environmental Manufacturing, Inc.).
The number of monitoring sites selected to represent each land use/income stratum was constrained by project resources, but the distribution of sites was informed by the relative variance in trash generation rates observed during trash loading studies in the Los Angeles region (Los Angeles County 2002, 2004a,b). Los Angeles monitoring data showed the highest variance in trash generation within the retail land use stratum, and therefore the highest percentage of monitoring sites (38%) in the Bay area study were dedicated to represent this land use category. The number of sites selected to represent other land use/income strata were based on available project resources in addition to the variance observed in Los Angeles data, as applicable.7
5 Some land uses included in the Bay Area study had a higher resolution (e.g., retail/wholesale and industrial) compared to studies conducted in the Los Angeles region. 6 A device or series of devices that traps all particles retained by a 5 mm mesh screen and has a design capacity of not less than the peak flow rate resulting from a one‐year, one‐hour, storm in the sub‐drainage area. 7 Household median income was not considered in the County of Los Angeles study.
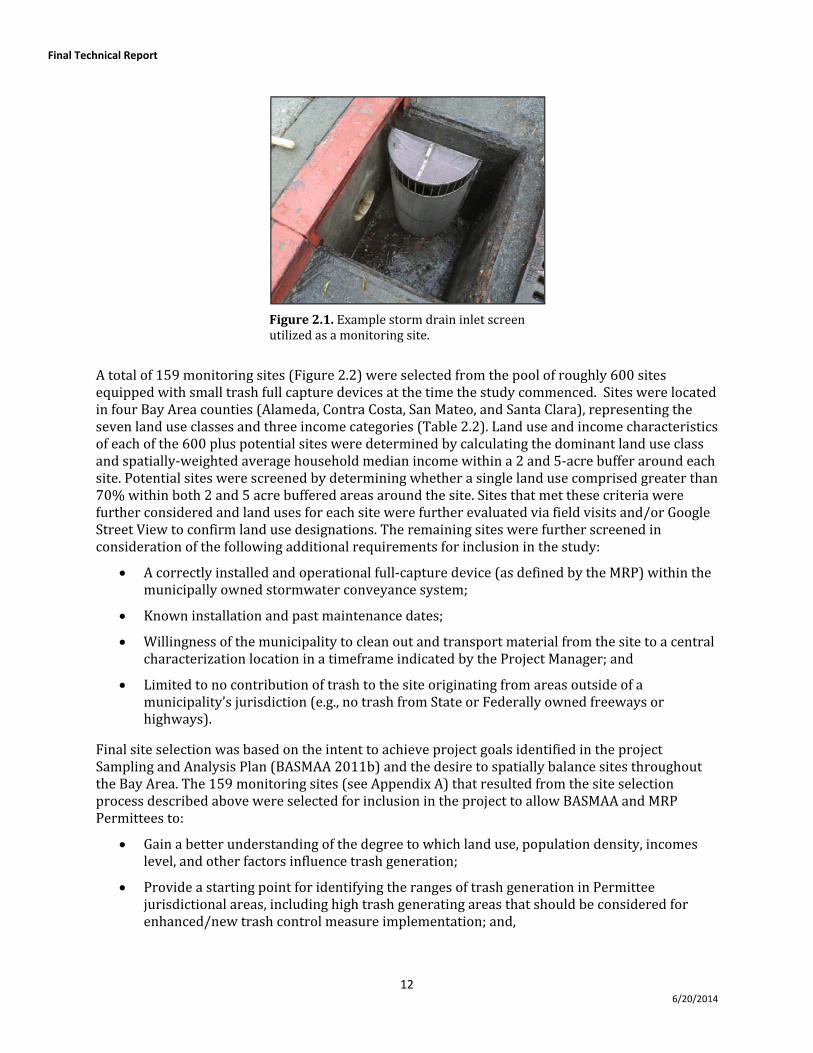
Final Technical Report
12 6/20/2014
Figure 2.1. Example storm drain inlet screen utilized as a monitoring site.
A total of 159 monitoring sites (Figure 2.2) were selected from the pool of roughly 600 sites equipped with small trash full capture devices at the time the study commenced. Sites were located in four Bay Area counties (Alameda, Contra Costa, San Mateo, and Santa Clara), representing the seven land use classes and three income categories (Table 2.2). Land use and income characteristics of each of the 600 plus potential sites were determined by calculating the dominant land use class and spatially‐weighted average household median income within a 2 and 5‐acre buffer around each site. Potential sites were screened by determining whether a single land use comprised greater than 70% within both 2 and 5 acre buffered areas around the site. Sites that met these criteria were further considered and land uses for each site were further evaluated via field visits and/or Google Street View to confirm land use designations. The remaining sites were further screened in consideration of the following additional requirements for inclusion in the study:
A correctly installed and operational full‐capture device (as defined by the MRP) within the municipally owned stormwater conveyance system;
Known installation and past maintenance dates;
Willingness of the municipality to clean out and transport material from the site to a central characterization location in a timeframe indicated by the Project Manager; and
Limited to no contribution of trash to the site originating from areas outside of a municipality’s jurisdiction (e.g., no trash from State or Federally owned freeways or highways).
Final site selection was based on the intent to achieve project goals identified in the project Sampling and Analysis Plan (BASMAA 2011b) and the desire to spatially balance sites throughout the Bay Area. The 159 monitoring sites (see Appendix A) that resulted from the site selection process described above were selected for inclusion in the project to allow BASMAA and MRP Permittees to:
Gain a better understanding of the degree to which land use, population density, incomes level, and other factors influence trash generation;
Provide a starting point for identifying the ranges of trash generation in Permittee jurisdictional areas, including high trash generating areas that should be considered for enhanced/new trash control measure implementation; and,
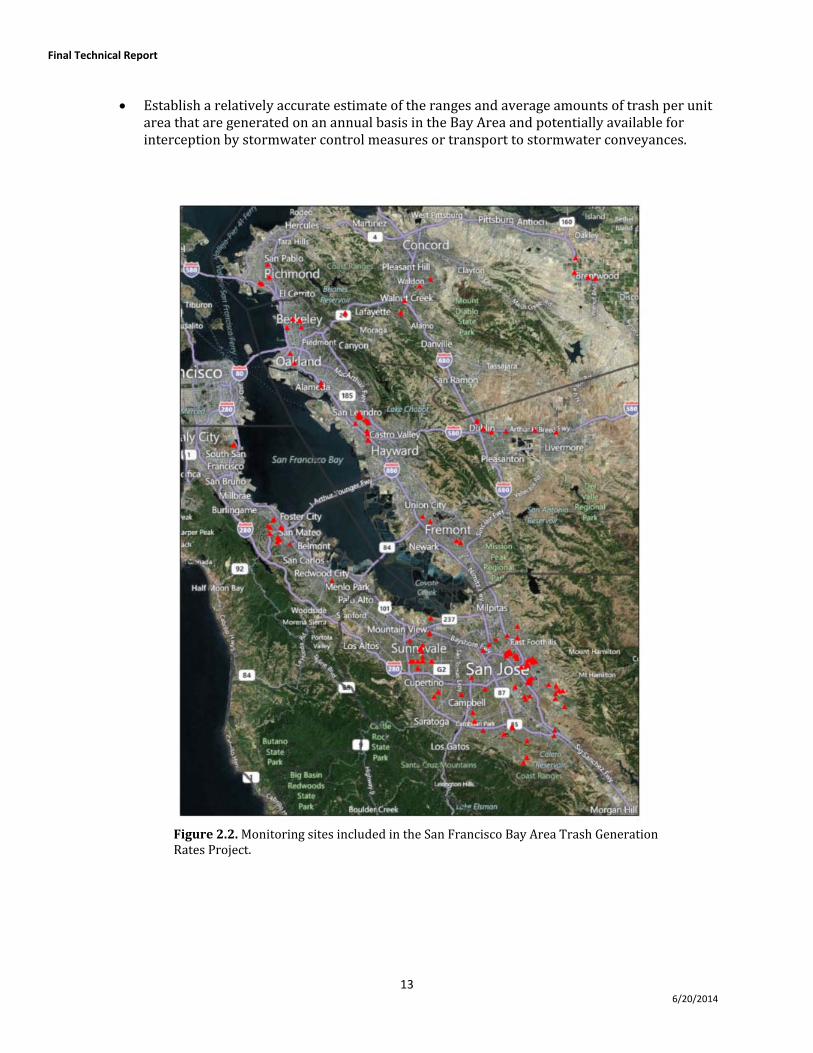
Final Technical Report
13 6/20/2014
Establish a relatively accurate estimate of the ranges and average amounts of trash per unit area that are generated on an annual basis in the Bay Area and potentially available for interception by stormwater control measures or transport to stormwater conveyances.
Figure 2.2. Monitoring sites included in the San Francisco Bay Area Trash Generation Rates Project.
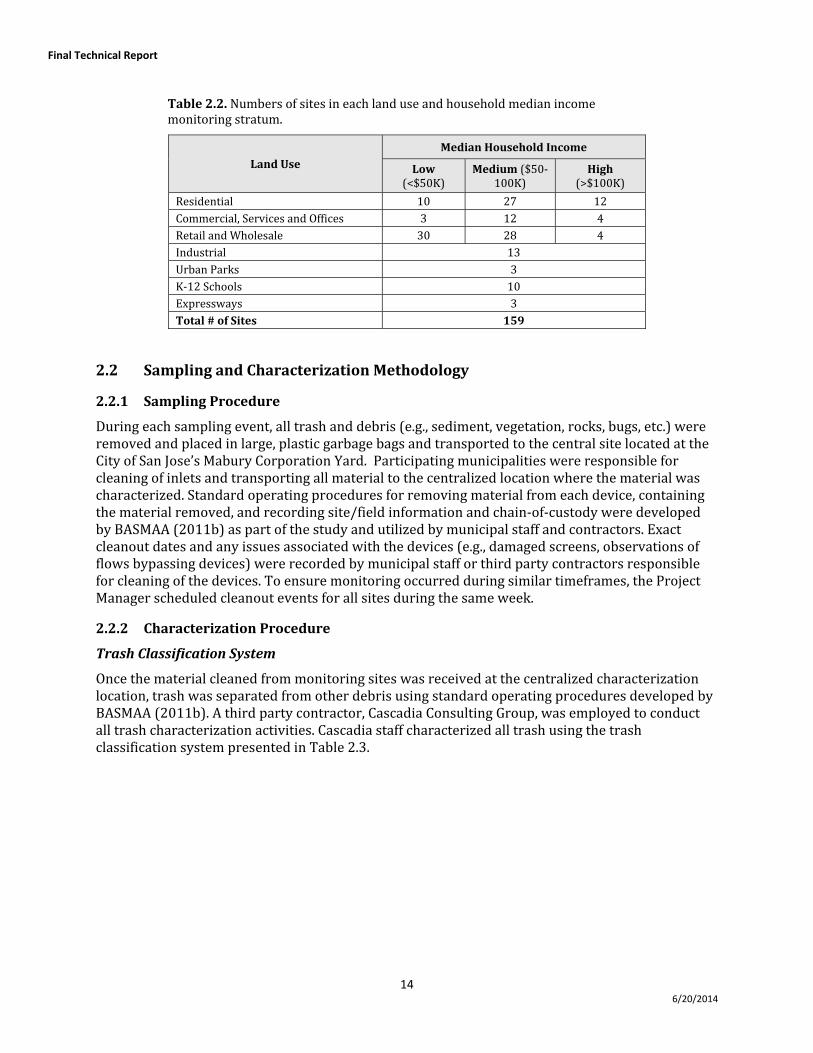
Final Technical Report
14 6/20/2014
Table 2.2. Numbers of sites in each land use and household median income monitoring stratum.
Land Use Median Household Income
Low (<$50K)
Medium ($50‐100K)
High (>$100K)
Residential 10 27 12 Commercial, Services and Offices 3 12 4 Retail and Wholesale 30 28 4 Industrial 13 Urban Parks 3 K‐12 Schools 10 Expressways 3 Total # of Sites 159
2.2 Sampling and Characterization Methodology
2.2.1 Sampling Procedure
During each sampling event, all trash and debris (e.g., sediment, vegetation, rocks, bugs, etc.) were removed and placed in large, plastic garbage bags and transported to the central site located at the City of San Jose’s Mabury Corporation Yard. Participating municipalities were responsible for cleaning of inlets and transporting all material to the centralized location where the material was characterized. Standard operating procedures for removing material from each device, containing the material removed, and recording site/field information and chain‐of‐custody were developed by BASMAA (2011b) as part of the study and utilized by municipal staff and contractors. Exact cleanout dates and any issues associated with the devices (e.g., damaged screens, observations of flows bypassing devices) were recorded by municipal staff or third party contractors responsible for cleaning of the devices. To ensure monitoring occurred during similar timeframes, the Project Manager scheduled cleanout events for all sites during the same week.
2.2.2 Characterization Procedure
Trash Classification System
Once the material cleaned from monitoring sites was received at the centralized characterization location, trash was separated from other debris using standard operating procedures developed by BASMAA (2011b). A third party contractor, Cascadia Consulting Group, was employed to conduct all trash characterization activities. Cascadia staff characterized all trash using the trash classification system presented in Table 2.3.
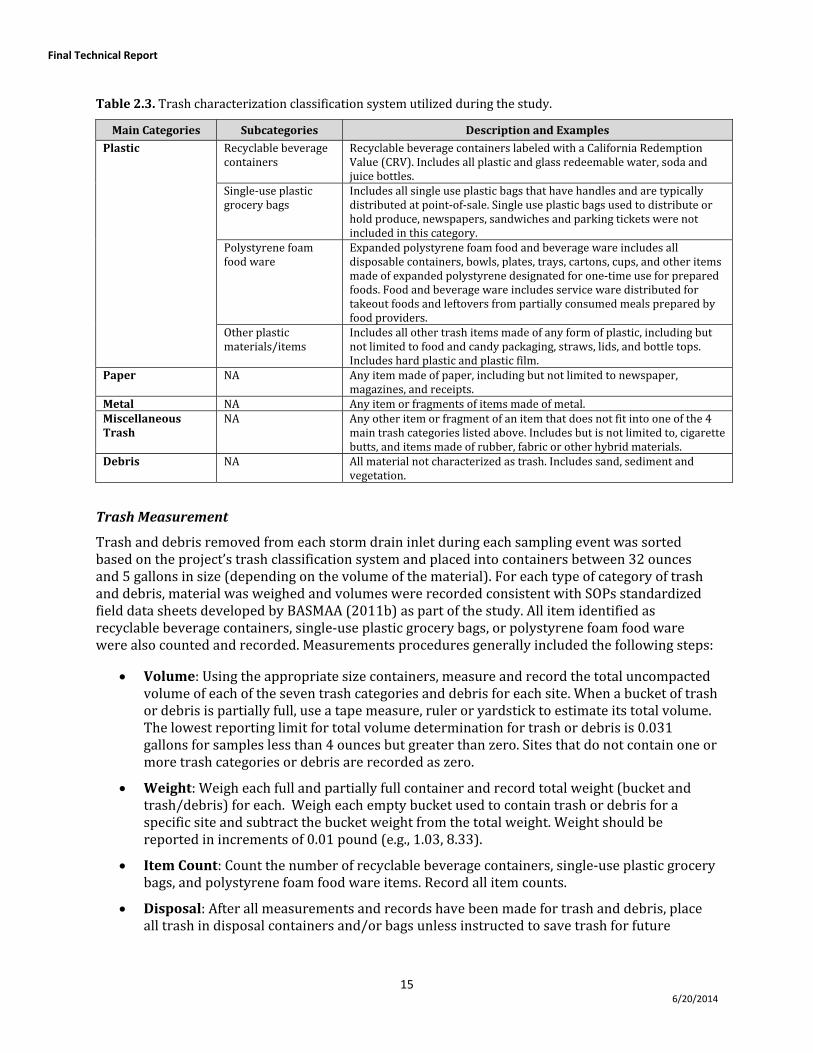
Final Technical Report
15 6/20/2014
Table 2.3. Trash characterization classification system utilized during the study.
Main Categories Subcategories Description and Examples
Plastic Recyclable beverage containers
Recyclable beverage containers labeled with a California Redemption Value (CRV). Includes all plastic and glass redeemable water, soda and juice bottles.
Single‐use plastic grocery bags
Includes all single use plastic bags that have handles and are typically distributed at point‐of‐sale. Single use plastic bags used to distribute or hold produce, newspapers, sandwiches and parking tickets were not included in this category.
Polystyrene foam food ware
Expanded polystyrene foam food and beverage ware includes all disposable containers, bowls, plates, trays, cartons, cups, and other items made of expanded polystyrene designated for one‐time use for prepared foods. Food and beverage ware includes service ware distributed for takeout foods and leftovers from partially consumed meals prepared by food providers.
Other plastic materials/items
Includes all other trash items made of any form of plastic, including but not limited to food and candy packaging, straws, lids, and bottle tops. Includes hard plastic and plastic film.
Paper NA Any item made of paper, including but not limited to newspaper, magazines, and receipts.
Metal NA Any item or fragments of items made of metal. Miscellaneous Trash
NA Any other item or fragment of an item that does not fit into one of the 4 main trash categories listed above. Includes but is not limited to, cigarette butts, and items made of rubber, fabric or other hybrid materials.
Debris NA All material not characterized as trash. Includes sand, sediment and vegetation.
Trash Measurement
Trash and debris removed from each storm drain inlet during each sampling event was sorted based on the project’s trash classification system and placed into containers between 32 ounces and 5 gallons in size (depending on the volume of the material). For each type of category of trash and debris, material was weighed and volumes were recorded consistent with SOPs standardized field data sheets developed by BASMAA (2011b) as part of the study. All item identified as recyclable beverage containers, single‐use plastic grocery bags, or polystyrene foam food ware were also counted and recorded. Measurements procedures generally included the following steps:
Volume: Using the appropriate size containers, measure and record the total uncompacted volume of each of the seven trash categories and debris for each site. When a bucket of trash or debris is partially full, use a tape measure, ruler or yardstick to estimate its total volume. The lowest reporting limit for total volume determination for trash or debris is 0.031 gallons for samples less than 4 ounces but greater than zero. Sites that do not contain one or more trash categories or debris are recorded as zero.
Weight: Weigh each full and partially full container and record total weight (bucket and trash/debris) for each. Weigh each empty bucket used to contain trash or debris for a specific site and subtract the bucket weight from the total weight. Weight should be reported in increments of 0.01 pound (e.g., 1.03, 8.33).
Item Count: Count the number of recyclable beverage containers, single‐use plastic grocery bags, and polystyrene foam food ware items. Record all item counts.
Disposal: After all measurements and records have been made for trash and debris, place all trash in disposal containers and/or bags unless instructed to save trash for future
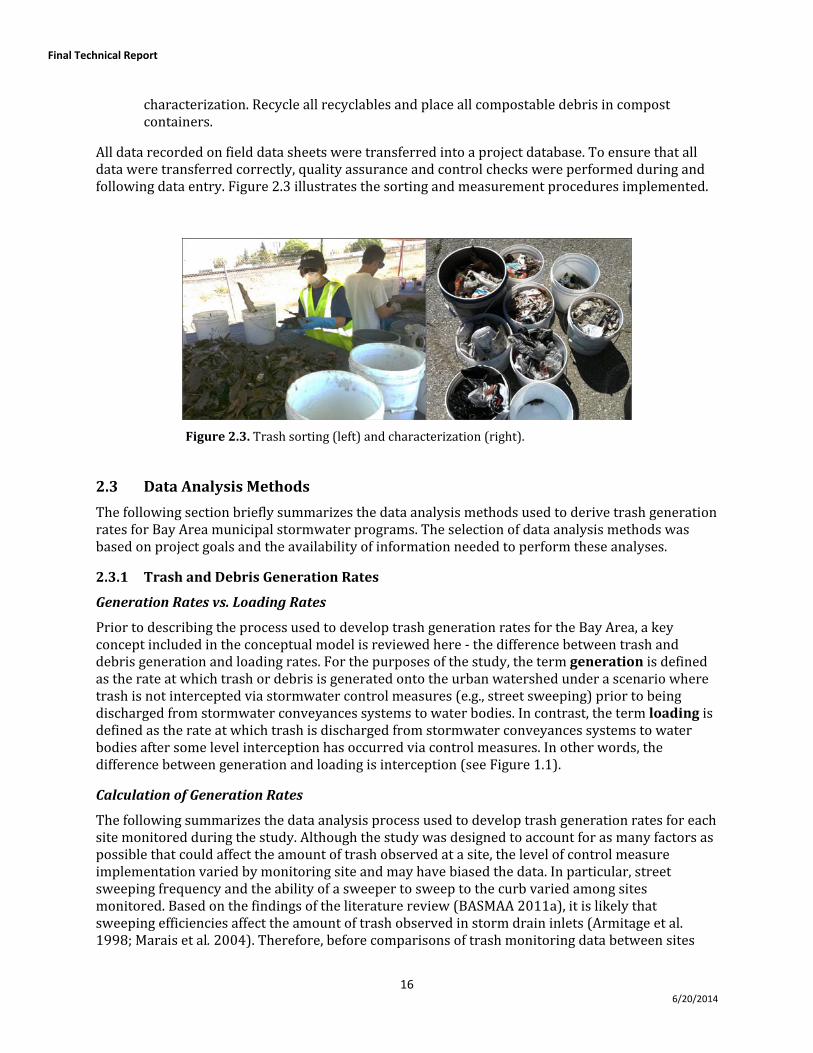
Final Technical Report
16 6/20/2014
characterization. Recycle all recyclables and place all compostable debris in compost containers.
All data recorded on field data sheets were transferred into a project database. To ensure that all data were transferred correctly, quality assurance and control checks were performed during and following data entry. Figure 2.3 illustrates the sorting and measurement procedures implemented.
Figure 2.3. Trash sorting (left) and characterization (right).
2.3 Data Analysis Methods
The following section briefly summarizes the data analysis methods used to derive trash generation rates for Bay Area municipal stormwater programs. The selection of data analysis methods was based on project goals and the availability of information needed to perform these analyses.
2.3.1 Trash and Debris Generation Rates
Generation Rates vs. Loading Rates
Prior to describing the process used to develop trash generation rates for the Bay Area, a key concept included in the conceptual model is reviewed here ‐ the difference between trash and debris generation and loading rates. For the purposes of the study, the term generation is defined as the rate at which trash or debris is generated onto the urban watershed under a scenario where trash is not intercepted via stormwater control measures (e.g., street sweeping) prior to being discharged from stormwater conveyances systems to water bodies. In contrast, the term loading is defined as the rate at which trash is discharged from stormwater conveyances systems to water bodies after some level interception has occurred via control measures. In other words, the difference between generation and loading is interception (see Figure 1.1).
Calculation of Generation Rates
The following summarizes the data analysis process used to develop trash generation rates for each site monitored during the study. Although the study was designed to account for as many factors as possible that could affect the amount of trash observed at a site, the level of control measure implementation varied by monitoring site and may have biased the data. In particular, street sweeping frequency and the ability of a sweeper to sweep to the curb varied among sites monitored. Based on the findings of the literature review (BASMAA 2011a), it is likely that sweeping efficiencies affect the amount of trash observed in storm drain inlets (Armitage et al. 1998; Marais et al. 2004). Therefore, before comparisons of trash monitoring data between sites
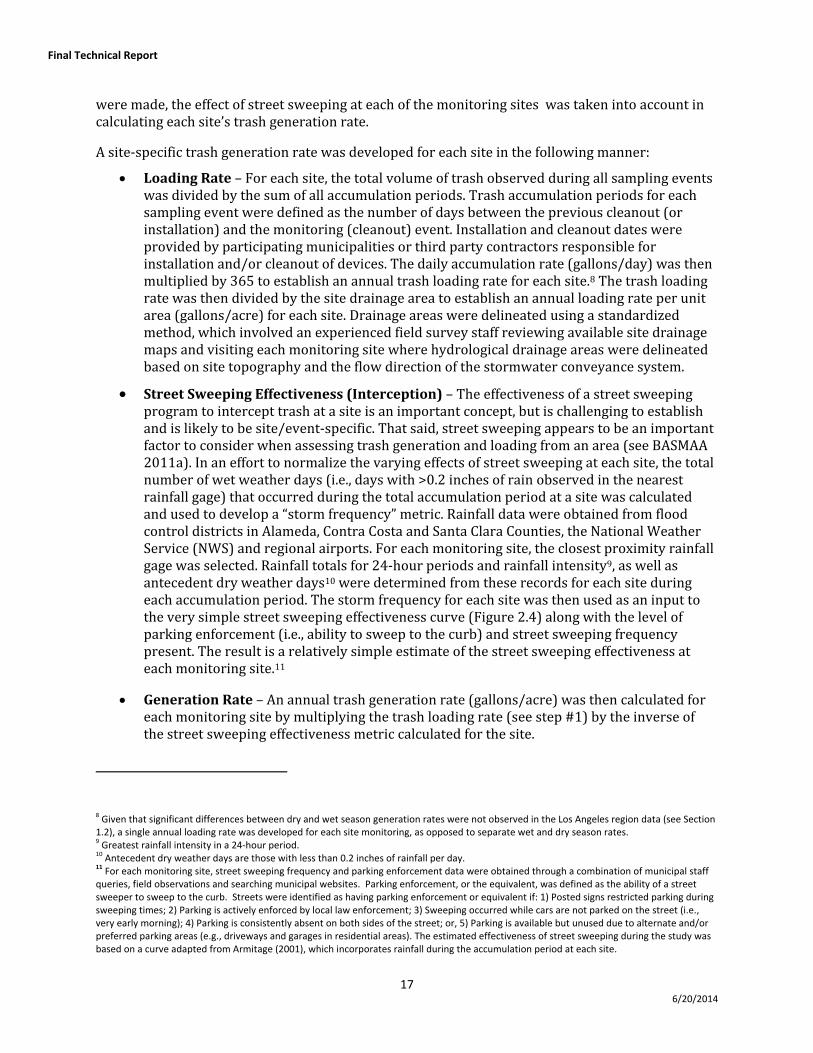
Final Technical Report
17 6/20/2014
were made, the effect of street sweeping at each of the monitoring sites was taken into account in calculating each site’s trash generation rate.
A site‐specific trash generation rate was developed for each site in the following manner:
Loading Rate – For each site, the total volume of trash observed during all sampling events was divided by the sum of all accumulation periods. Trash accumulation periods for each sampling event were defined as the number of days between the previous cleanout (or installation) and the monitoring (cleanout) event. Installation and cleanout dates were provided by participating municipalities or third party contractors responsible for installation and/or cleanout of devices. The daily accumulation rate (gallons/day) was then multiplied by 365 to establish an annual trash loading rate for each site.8 The trash loading rate was then divided by the site drainage area to establish an annual loading rate per unit area (gallons/acre) for each site. Drainage areas were delineated using a standardized method, which involved an experienced field survey staff reviewing available site drainage maps and visiting each monitoring site where hydrological drainage areas were delineated based on site topography and the flow direction of the stormwater conveyance system.
Street Sweeping Effectiveness (Interception) – The effectiveness of a street sweeping program to intercept trash at a site is an important concept, but is challenging to establish and is likely to be site/event‐specific. That said, street sweeping appears to be an important factor to consider when assessing trash generation and loading from an area (see BASMAA 2011a). In an effort to normalize the varying effects of street sweeping at each site, the total number of wet weather days (i.e., days with >0.2 inches of rain observed in the nearest rainfall gage) that occurred during the total accumulation period at a site was calculated and used to develop a “storm frequency” metric. Rainfall data were obtained from flood control districts in Alameda, Contra Costa and Santa Clara Counties, the National Weather Service (NWS) and regional airports. For each monitoring site, the closest proximity rainfall gage was selected. Rainfall totals for 24‐hour periods and rainfall intensity9, as well as antecedent dry weather days10 were determined from these records for each site during each accumulation period. The storm frequency for each site was then used as an input to the very simple street sweeping effectiveness curve (Figure 2.4) along with the level of parking enforcement (i.e., ability to sweep to the curb) and street sweeping frequency present. The result is a relatively simple estimate of the street sweeping effectiveness at each monitoring site.11
Generation Rate – An annual trash generation rate (gallons/acre) was then calculated for each monitoring site by multiplying the trash loading rate (see step #1) by the inverse of the street sweeping effectiveness metric calculated for the site.
8 Given that significant differences between dry and wet season generation rates were not observed in the Los Angeles region data (see Section 1.2), a single annual loading rate was developed for each site monitoring, as opposed to separate wet and dry season rates. 9 Greatest rainfall intensity in a 24‐hour period. 10 Antecedent dry weather days are those with less than 0.2 inches of rainfall per day.
11 For each monitoring site, street sweeping frequency and parking enforcement data were obtained through a combination of municipal staff
queries, field observations and searching municipal websites. Parking enforcement, or the equivalent, was defined as the ability of a street sweeper to sweep to the curb. Streets were identified as having parking enforcement or equivalent if: 1) Posted signs restricted parking during sweeping times; 2) Parking is actively enforced by local law enforcement; 3) Sweeping occurred while cars are not parked on the street (i.e., very early morning); 4) Parking is consistently absent on both sides of the street; or, 5) Parking is available but unused due to alternate and/or preferred parking areas (e.g., driveways and garages in residential areas). The estimated effectiveness of street sweeping during the study was based on a curve adapted from Armitage (2001), which incorporates rainfall during the accumulation period at each site.
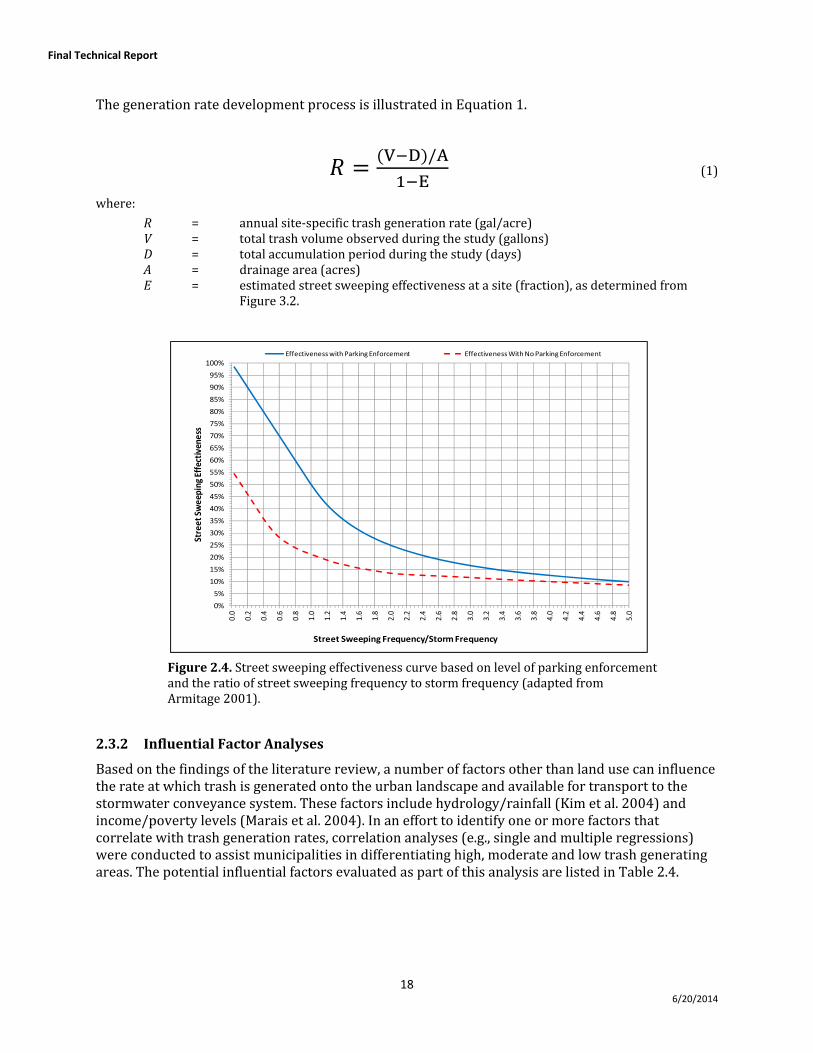
Final Technical Report
18 6/20/2014
The generation rate development process is illustrated in Equation 1.
V D /A
E (1)
where:
R = annual site‐specific trash generation rate (gal/acre) V = total trash volume observed during the study (gallons) D = total accumulation period during the study (days) A = drainage area (acres) E = estimated street sweeping effectiveness at a site (fraction), as determined from
Figure 3.2.
Figure 2.4. Street sweeping effectiveness curve based on level of parking enforcement and the ratio of street sweeping frequency to storm frequency (adapted from Armitage 2001).
2.3.2 Influential Factor Analyses
Based on the findings of the literature review, a number of factors other than land use can influence the rate at which trash is generated onto the urban landscape and available for transport to the stormwater conveyance system. These factors include hydrology/rainfall (Kim et al. 2004) and income/poverty levels (Marais et al. 2004). In an effort to identify one or more factors that correlate with trash generation rates, correlation analyses (e.g., single and multiple regressions) were conducted to assist municipalities in differentiating high, moderate and low trash generating areas. The potential influential factors evaluated as part of this analysis are listed in Table 2.4.
0%
5%
10%
15%
20%
25%
30%
35%
40%
45%
50%
55%
60%
65%
70%
75%
80%
85%
90%
95%
100%
0.0
0.2
0.4
0.6
0.8
1.0
1.2
1.4
1.6
1.8
2.0
2.2
2.4
2.6
2.8
3.0
3.2
3.4
3.6
3.8
4.0
4.2
4.4
4.6
4.8
5.0
Street Sweeping
Effectivene
ss
Street Sweeping Frequency/Storm Frequency
Effectiveness with Parking Enforcement Effectiveness With No Parking Enforcement
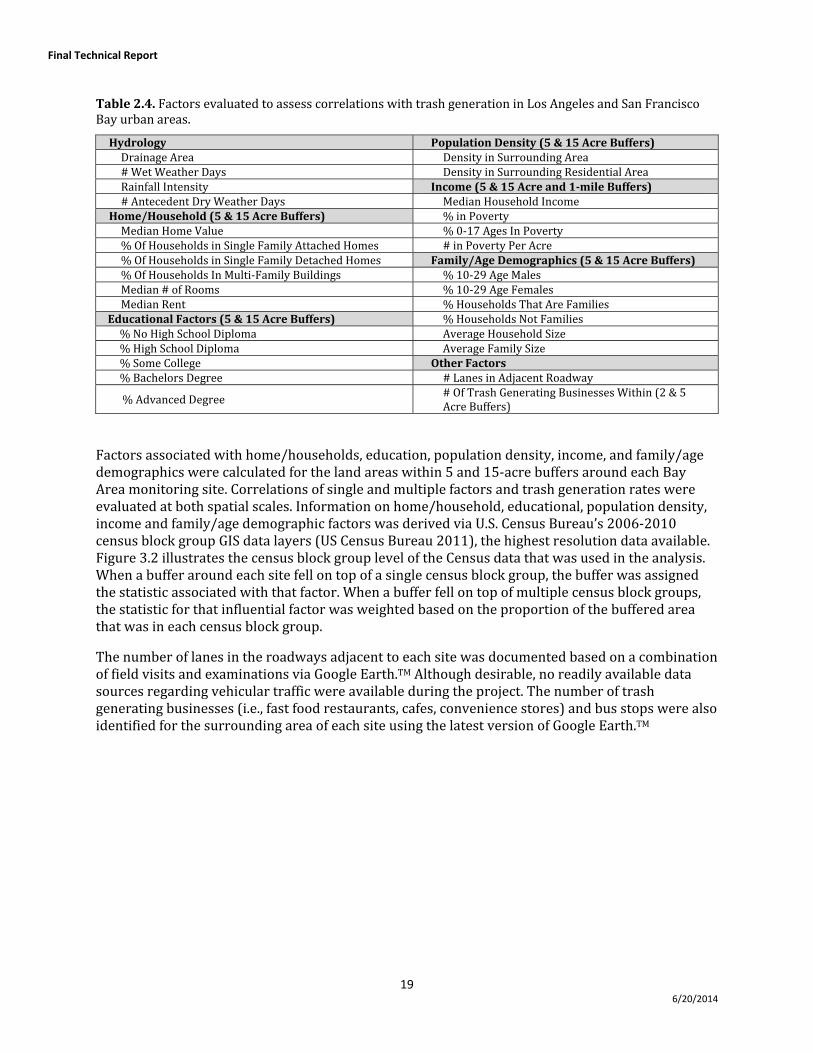
Final Technical Report
19 6/20/2014
Table 2.4. Factors evaluated to assess correlations with trash generation in Los Angeles and San Francisco Bay urban areas.
Hydrology Population Density (5 & 15 Acre Buffers) Drainage Area Density in Surrounding Area # Wet Weather Days Density in Surrounding Residential Area Rainfall Intensity Income (5 & 15 Acre and 1mile Buffers) # Antecedent Dry Weather Days Median Household Income
Home/Household (5 & 15 Acre Buffers) % in Poverty Median Home Value % 0‐17 Ages In Poverty % Of Households in Single Family Attached Homes # in Poverty Per Acre% Of Households in Single Family Detached Homes Family/Age Demographics (5 & 15 Acre Buffers)% Of Households In Multi‐Family Buildings % 10‐29 Age Males Median # of Rooms % 10‐29 Age Females Median Rent % Households That Are Families
Educational Factors (5 & 15 Acre Buffers) % Households Not Families % No High School Diploma Average Household Size % High School Diploma Average Family Size % Some College Other Factors % Bachelors Degree # Lanes in Adjacent Roadway
% Advanced Degree # Of Trash Generating Businesses Within (2 & 5 Acre Buffers)
Factors associated with home/households, education, population density, income, and family/age demographics were calculated for the land areas within 5 and 15‐acre buffers around each Bay Area monitoring site. Correlations of single and multiple factors and trash generation rates were evaluated at both spatial scales. Information on home/household, educational, population density, income and family/age demographic factors was derived via U.S. Census Bureau’s 2006‐2010 census block group GIS data layers (US Census Bureau 2011), the highest resolution data available. Figure 3.2 illustrates the census block group level of the Census data that was used in the analysis. When a buffer around each site fell on top of a single census block group, the buffer was assigned the statistic associated with that factor. When a buffer fell on top of multiple census block groups, the statistic for that influential factor was weighted based on the proportion of the buffered area that was in each census block group.
The number of lanes in the roadways adjacent to each site was documented based on a combination of field visits and examinations via Google Earth.TM Although desirable, no readily available data sources regarding vehicular traffic were available during the project. The number of trash generating businesses (i.e., fast food restaurants, cafes, convenience stores) and bus stops were also identified for the surrounding area of each site using the latest version of Google Earth.TM
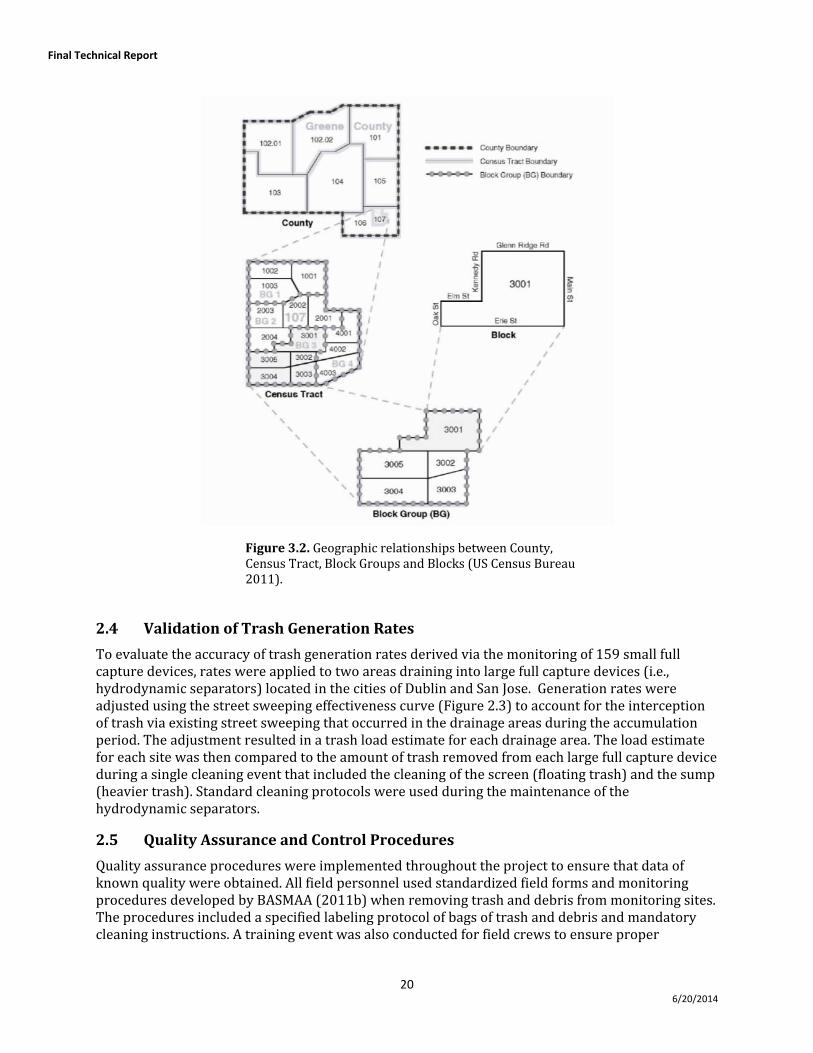
Final Technical Report
20 6/20/2014
Figure 3.2. Geographic relationships between County, Census Tract, Block Groups and Blocks (US Census Bureau 2011).
2.4 Validation of Trash Generation Rates
To evaluate the accuracy of trash generation rates derived via the monitoring of 159 small full capture devices, rates were applied to two areas draining into large full capture devices (i.e., hydrodynamic separators) located in the cities of Dublin and San Jose. Generation rates were adjusted using the street sweeping effectiveness curve (Figure 2.3) to account for the interception of trash via existing street sweeping that occurred in the drainage areas during the accumulation period. The adjustment resulted in a trash load estimate for each drainage area. The load estimate for each site was then compared to the amount of trash removed from each large full capture device during a single cleaning event that included the cleaning of the screen (floating trash) and the sump (heavier trash). Standard cleaning protocols were used during the maintenance of the hydrodynamic separators.
2.5 Quality Assurance and Control Procedures
Quality assurance procedures were implemented throughout the project to ensure that data of known quality were obtained. All field personnel used standardized field forms and monitoring procedures developed by BASMAA (2011b) when removing trash and debris from monitoring sites. The procedures included a specified labeling protocol of bags of trash and debris and mandatory cleaning instructions. A training event was also conducted for field crews to ensure proper
Final Technical Report
21 6/20/2014
understanding of field monitoring and quality control procedures. As appropriate, the following errors were identified during the study and associated data were qualified appropriately:
Installation Errors – devices that were installed incorrectly or in the wrong location;
Maintenance Errors – trash and debris were removed from the incorrect site and as a result, a storm drain inlet without a device was cleaned;
Bookkeeping Errors – the location of the device that was monitored, or the cleanout date could not be confirmed;
Land Use Errors – following delineation of the site drainage area and land use analysis, the site could not be defined as depicting a single land use category; and,
Jurisdictional Errors – sites included streets swept by the California Department of Transportation and not a municipality.
Quality assurance procedures performed during trash characterization included oversight by two project managers, and reweighing/measurements of material to ensure consistency, accuracy and completeness. Trash and debris from 10% of samples were reweighed and measured. Relative percent difference (RPD) calculations were used to assess the accuracy of measurements.
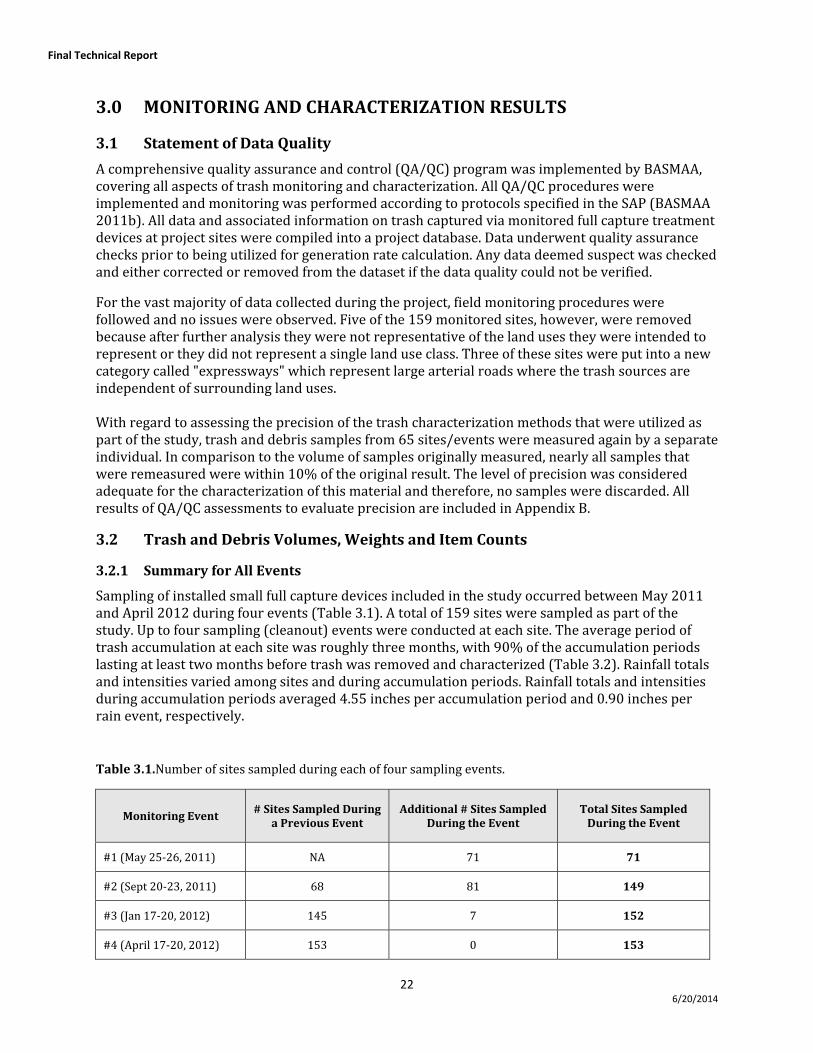
Final Technical Report
22 6/20/2014
3.0 MONITORING AND CHARACTERIZATION RESULTS
3.1 Statement of Data Quality
A comprehensive quality assurance and control (QA/QC) program was implemented by BASMAA, covering all aspects of trash monitoring and characterization. All QA/QC procedures were implemented and monitoring was performed according to protocols specified in the SAP (BASMAA 2011b). All data and associated information on trash captured via monitored full capture treatment devices at project sites were compiled into a project database. Data underwent quality assurance checks prior to being utilized for generation rate calculation. Any data deemed suspect was checked and either corrected or removed from the dataset if the data quality could not be verified.
For the vast majority of data collected during the project, field monitoring procedures were followed and no issues were observed. Five of the 159 monitored sites, however, were removed because after further analysis they were not representative of the land uses they were intended to represent or they did not represent a single land use class. Three of these sites were put into a new category called "expressways" which represent large arterial roads where the trash sources are independent of surrounding land uses. With regard to assessing the precision of the trash characterization methods that were utilized as part of the study, trash and debris samples from 65 sites/events were measured again by a separate individual. In comparison to the volume of samples originally measured, nearly all samples that were remeasured were within 10% of the original result. The level of precision was considered adequate for the characterization of this material and therefore, no samples were discarded. All results of QA/QC assessments to evaluate precision are included in Appendix B.
3.2 Trash and Debris Volumes, Weights and Item Counts
3.2.1 Summary for All Events
Sampling of installed small full capture devices included in the study occurred between May 2011 and April 2012 during four events (Table 3.1). A total of 159 sites were sampled as part of the study. Up to four sampling (cleanout) events were conducted at each site. The average period of trash accumulation at each site was roughly three months, with 90% of the accumulation periods lasting at least two months before trash was removed and characterized (Table 3.2). Rainfall totals and intensities varied among sites and during accumulation periods. Rainfall totals and intensities during accumulation periods averaged 4.55 inches per accumulation period and 0.90 inches per rain event, respectively.
Table 3.1.Number of sites sampled during each of four sampling events.
Monitoring Event # Sites Sampled During
a Previous Event Additional # Sites Sampled
During the Event Total Sites Sampled During the Event
#1 (May 25‐26, 2011) NA 71 71
#2 (Sept 20‐23, 2011) 68 81 149
#3 (Jan 17‐20, 2012) 145 7 152
#4 (April 17‐20, 2012) 153 0 153
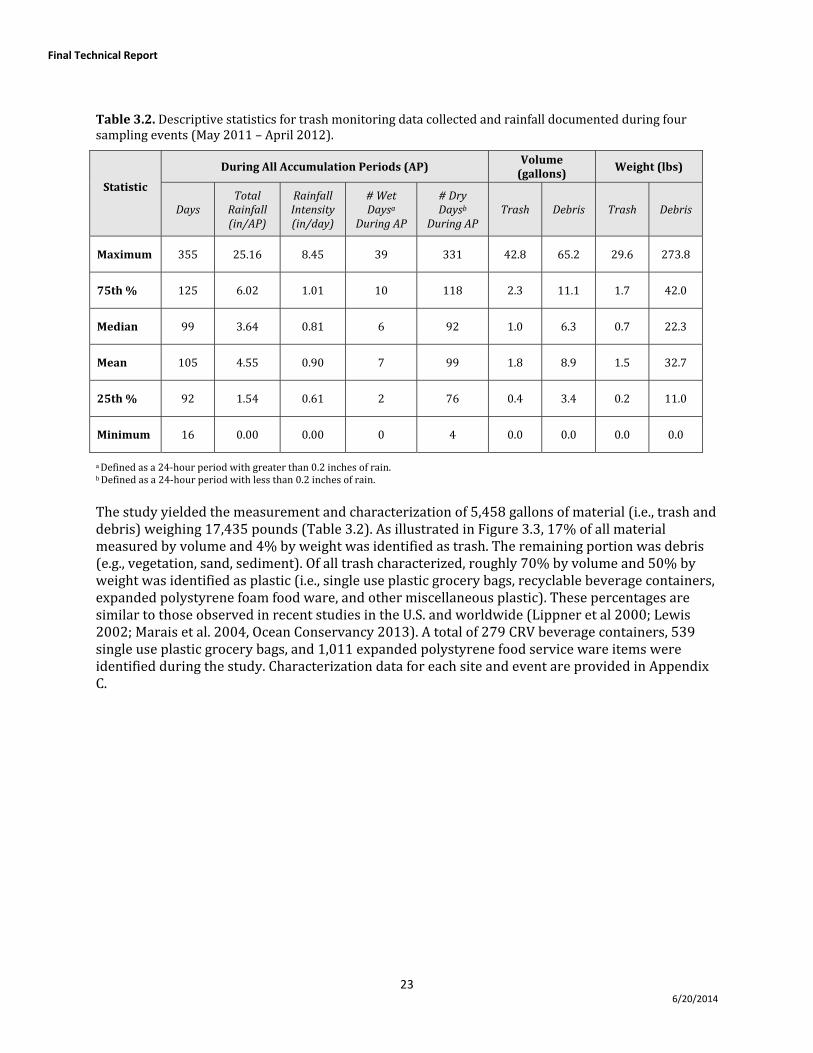
Final Technical Report
23 6/20/2014
Table 3.2. Descriptive statistics for trash monitoring data collected and rainfall documented during four sampling events (May 2011 – April 2012).
Statistic
During All Accumulation Periods (AP) Volume (gallons)
Weight (lbs)
Days Total Rainfall (in/AP)
Rainfall Intensity (in/day)
# Wet Daysa
During AP
# Dry Daysb
During AP Trash Debris Trash Debris
Maximum 355 25.16 8.45 39 331 42.8 65.2 29.6 273.8
75th % 125 6.02 1.01 10 118 2.3 11.1 1.7 42.0
Median 99 3.64 0.81 6 92 1.0 6.3 0.7 22.3
Mean 105 4.55 0.90 7 99 1.8 8.9 1.5 32.7
25th % 92 1.54 0.61 2 76 0.4 3.4 0.2 11.0
Minimum 16 0.00 0.00 0 4 0.0 0.0 0.0 0.0
a Defined as a 24‐hour period with greater than 0.2 inches of rain. b Defined as a 24‐hour period with less than 0.2 inches of rain.
The study yielded the measurement and characterization of 5,458 gallons of material (i.e., trash and debris) weighing 17,435 pounds (Table 3.2). As illustrated in Figure 3.3, 17% of all material measured by volume and 4% by weight was identified as trash. The remaining portion was debris (e.g., vegetation, sand, sediment). Of all trash characterized, roughly 70% by volume and 50% by weight was identified as plastic (i.e., single use plastic grocery bags, recyclable beverage containers, expanded polystyrene foam food ware, and other miscellaneous plastic). These percentages are similar to those observed in recent studies in the U.S. and worldwide (Lippner et al 2000; Lewis 2002; Marais et al. 2004, Ocean Conservancy 2013). A total of 279 CRV beverage containers, 539 single use plastic grocery bags, and 1,011 expanded polystyrene food service ware items were identified during the study. Characterization data for each site and event are provided in Appendix C.
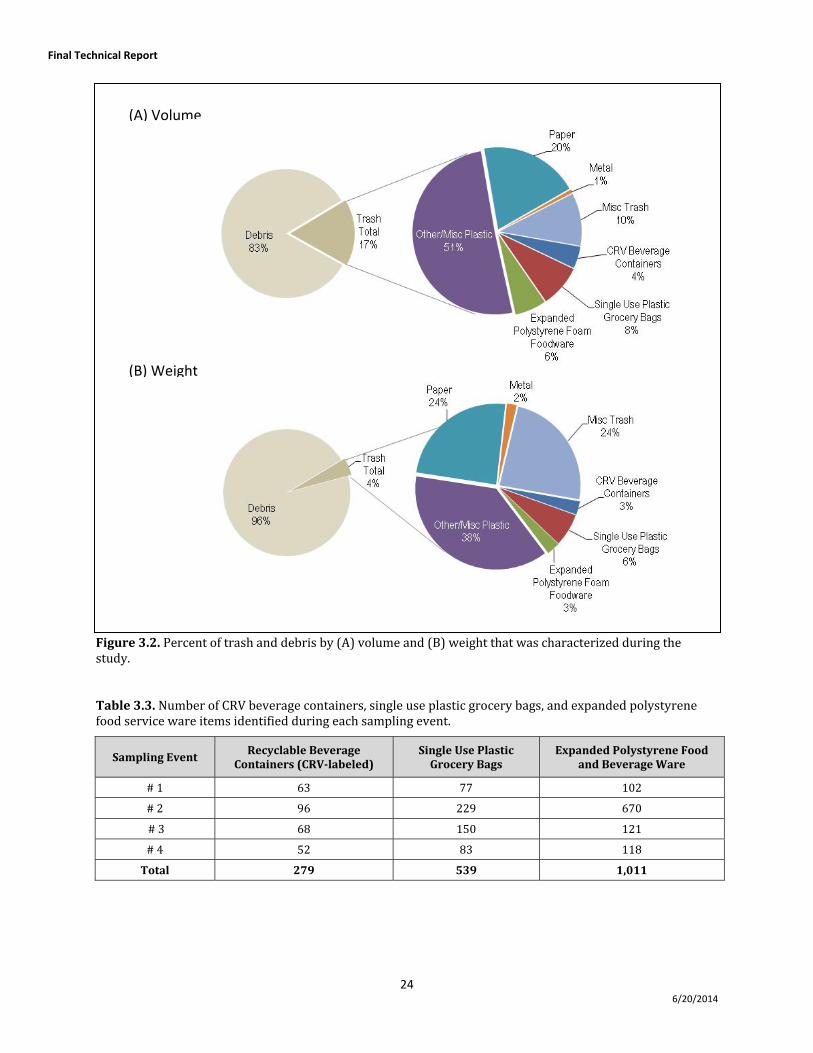
Final Technical Report
24 6/20/2014
Figure 3.2. Percent of trash and debris by (A) volume and (B) weight that was characterized during the study.
Table 3.3. Number of CRV beverage containers, single use plastic grocery bags, and expanded polystyrene food service ware items identified during each sampling event.
Sampling Event Recyclable Beverage
Containers (CRVlabeled) Single Use Plastic Grocery Bags
Expanded Polystyrene Food and Beverage Ware
# 1 63 77 102
# 2 96 229 670
# 3 68 150 121
# 4 52 83 118
Total 279 539 1,011
(A) Volume
(B) Weight
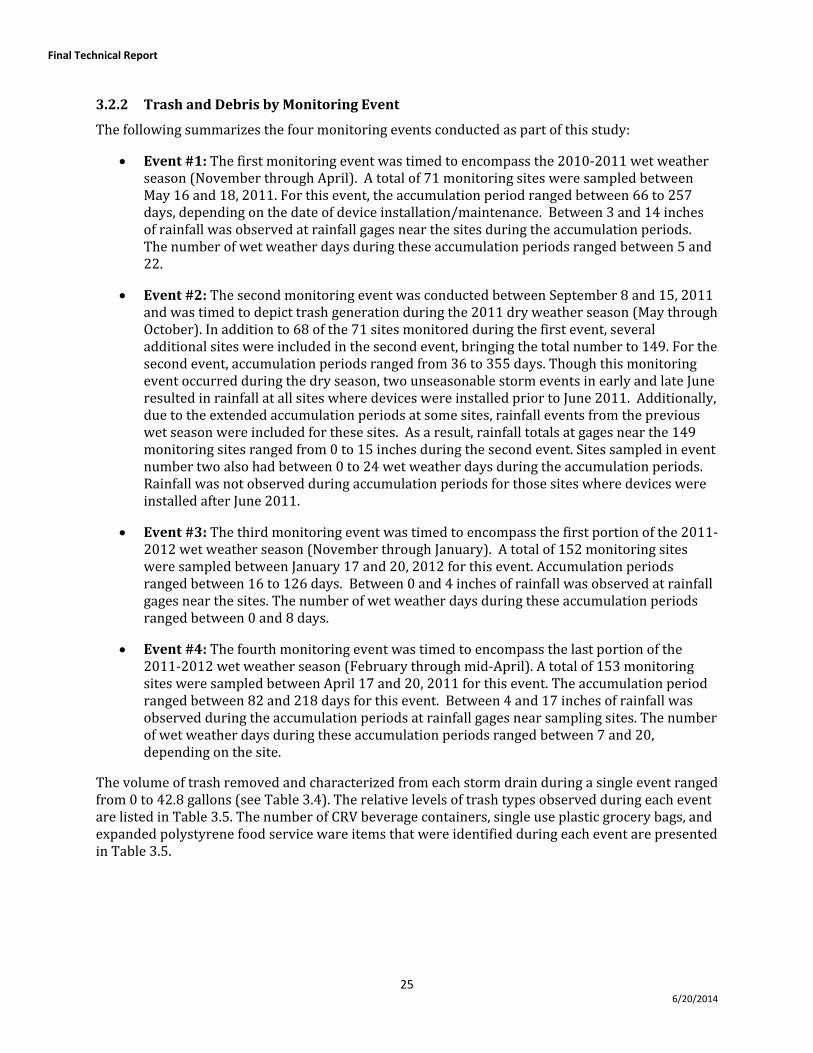
Final Technical Report
25 6/20/2014
3.2.2 Trash and Debris by Monitoring Event
The following summarizes the four monitoring events conducted as part of this study:
Event #1: The first monitoring event was timed to encompass the 2010‐2011 wet weather season (November through April). A total of 71 monitoring sites were sampled between May 16 and 18, 2011. For this event, the accumulation period ranged between 66 to 257 days, depending on the date of device installation/maintenance. Between 3 and 14 inches of rainfall was observed at rainfall gages near the sites during the accumulation periods. The number of wet weather days during these accumulation periods ranged between 5 and 22.
Event #2: The second monitoring event was conducted between September 8 and 15, 2011 and was timed to depict trash generation during the 2011 dry weather season (May through October). In addition to 68 of the 71 sites monitored during the first event, several additional sites were included in the second event, bringing the total number to 149. For the second event, accumulation periods ranged from 36 to 355 days. Though this monitoring event occurred during the dry season, two unseasonable storm events in early and late June resulted in rainfall at all sites where devices were installed prior to June 2011. Additionally, due to the extended accumulation periods at some sites, rainfall events from the previous wet season were included for these sites. As a result, rainfall totals at gages near the 149 monitoring sites ranged from 0 to 15 inches during the second event. Sites sampled in event number two also had between 0 to 24 wet weather days during the accumulation periods. Rainfall was not observed during accumulation periods for those sites where devices were installed after June 2011.
Event #3: The third monitoring event was timed to encompass the first portion of the 2011‐2012 wet weather season (November through January). A total of 152 monitoring sites were sampled between January 17 and 20, 2012 for this event. Accumulation periods ranged between 16 to 126 days. Between 0 and 4 inches of rainfall was observed at rainfall gages near the sites. The number of wet weather days during these accumulation periods ranged between 0 and 8 days.
Event #4: The fourth monitoring event was timed to encompass the last portion of the 2011‐2012 wet weather season (February through mid‐April). A total of 153 monitoring sites were sampled between April 17 and 20, 2011 for this event. The accumulation period ranged between 82 and 218 days for this event. Between 4 and 17 inches of rainfall was observed during the accumulation periods at rainfall gages near sampling sites. The number of wet weather days during these accumulation periods ranged between 7 and 20, depending on the site.
The volume of trash removed and characterized from each storm drain during a single event ranged from 0 to 42.8 gallons (see Table 3.4). The relative levels of trash types observed during each event are listed in Table 3.5. The number of CRV beverage containers, single use plastic grocery bags, and expanded polystyrene food service ware items that were identified during each event are presented in Table 3.5.
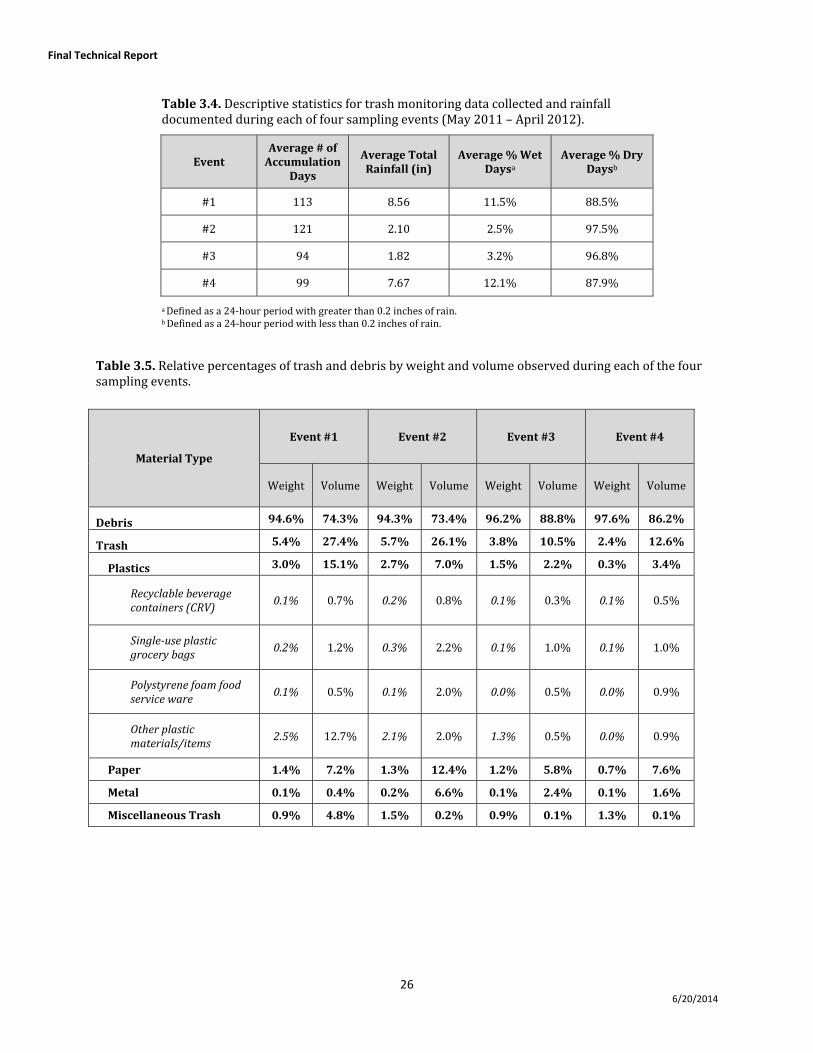
Final Technical Report
26 6/20/2014
Table 3.4. Descriptive statistics for trash monitoring data collected and rainfall documented during each of four sampling events (May 2011 – April 2012).
Event Average # of Accumulation
Days
Average Total Rainfall (in)
Average % Wet Daysa
Average % Dry Daysb
#1 113 8.56 11.5% 88.5%
#2 121 2.10 2.5% 97.5%
#3 94 1.82 3.2% 96.8%
#4 99 7.67 12.1% 87.9%
a Defined as a 24‐hour period with greater than 0.2 inches of rain. b Defined as a 24‐hour period with less than 0.2 inches of rain.
Table 3.5. Relative percentages of trash and debris by weight and volume observed during each of the four sampling events.
Material Type
Event #1 Event #2 Event #3 Event #4
Weight Volume Weight Volume Weight Volume Weight Volume
Debris 94.6% 74.3% 94.3% 73.4% 96.2% 88.8% 97.6% 86.2%
Trash 5.4% 27.4% 5.7% 26.1% 3.8% 10.5% 2.4% 12.6%
Plastics 3.0% 15.1% 2.7% 7.0% 1.5% 2.2% 0.3% 3.4%
Recyclable beverage containers (CRV)
0.1% 0.7% 0.2% 0.8% 0.1% 0.3% 0.1% 0.5%
Singleuse plastic grocery bags
0.2% 1.2% 0.3% 2.2% 0.1% 1.0% 0.1% 1.0%
Polystyrene foam food service ware
0.1% 0.5% 0.1% 2.0% 0.0% 0.5% 0.0% 0.9%
Other plastic materials/items
2.5% 12.7% 2.1% 2.0% 1.3% 0.5% 0.0% 0.9%
Paper 1.4% 7.2% 1.3% 12.4% 1.2% 5.8% 0.7% 7.6%
Metal 0.1% 0.4% 0.2% 6.6% 0.1% 2.4% 0.1% 1.6%
Miscellaneous Trash 0.9% 4.8% 1.5% 0.2% 0.9% 0.1% 1.3% 0.1%
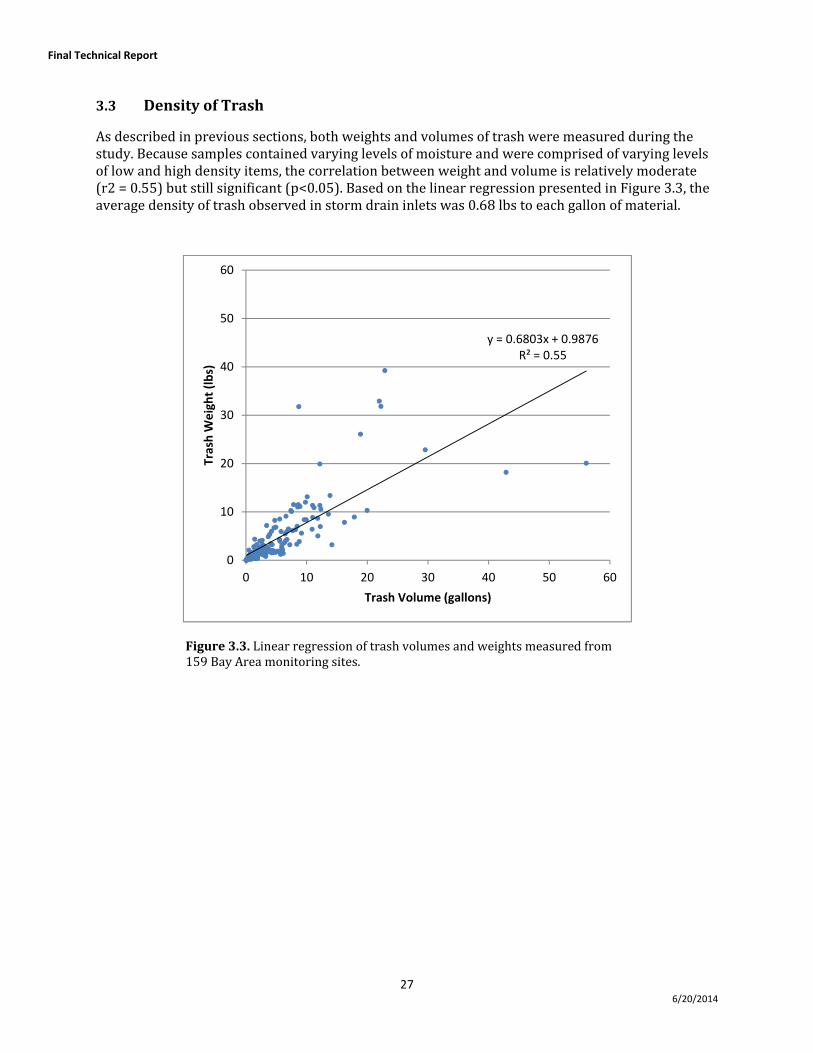
Final Technical Report
27 6/20/2014
3.3 Density of Trash
As described in previous sections, both weights and volumes of trash were measured during the study. Because samples contained varying levels of moisture and were comprised of varying levels of low and high density items, the correlation between weight and volume is relatively moderate (r2 = 0.55) but still significant (p<0.05). Based on the linear regression presented in Figure 3.3, the average density of trash observed in storm drain inlets was 0.68 lbs to each gallon of material.
Figure 3.3. Linear regression of trash volumes and weights measured from 159 Bay Area monitoring sites.
y = 0.6803x + 0.9876R² = 0.55
0
10
20
30
40
50
60
0 10 20 30 40 50 60
Trash W
eight (lbs)
Trash Volume (gallons)
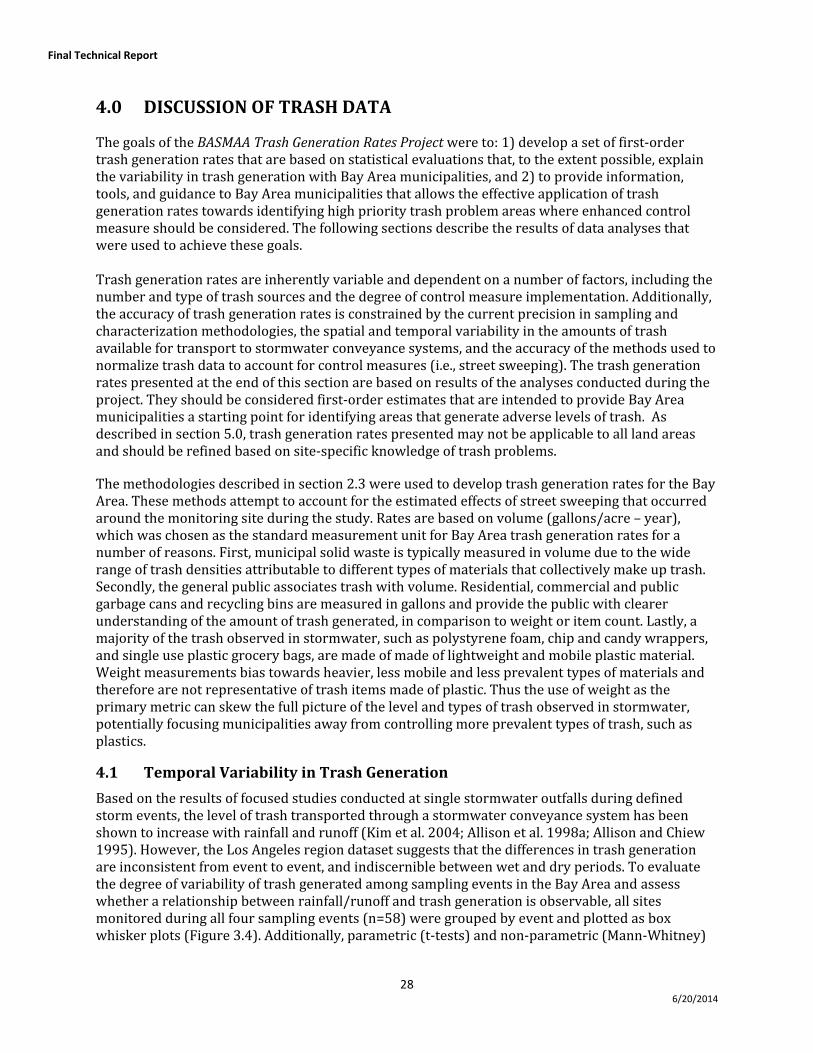
Final Technical Report
28 6/20/2014
4.0 DISCUSSION OF TRASH DATA
The goals of the BASMAA Trash Generation Rates Project were to: 1) develop a set of first‐order trash generation rates that are based on statistical evaluations that, to the extent possible, explain the variability in trash generation with Bay Area municipalities, and 2) to provide information, tools, and guidance to Bay Area municipalities that allows the effective application of trash generation rates towards identifying high priority trash problem areas where enhanced control measure should be considered. The following sections describe the results of data analyses that were used to achieve these goals. Trash generation rates are inherently variable and dependent on a number of factors, including the number and type of trash sources and the degree of control measure implementation. Additionally, the accuracy of trash generation rates is constrained by the current precision in sampling and characterization methodologies, the spatial and temporal variability in the amounts of trash available for transport to stormwater conveyance systems, and the accuracy of the methods used to normalize trash data to account for control measures (i.e., street sweeping). The trash generation rates presented at the end of this section are based on results of the analyses conducted during the project. They should be considered first‐order estimates that are intended to provide Bay Area municipalities a starting point for identifying areas that generate adverse levels of trash. As described in section 5.0, trash generation rates presented may not be applicable to all land areas and should be refined based on site‐specific knowledge of trash problems. The methodologies described in section 2.3 were used to develop trash generation rates for the Bay Area. These methods attempt to account for the estimated effects of street sweeping that occurred around the monitoring site during the study. Rates are based on volume (gallons/acre – year), which was chosen as the standard measurement unit for Bay Area trash generation rates for a number of reasons. First, municipal solid waste is typically measured in volume due to the wide range of trash densities attributable to different types of materials that collectively make up trash. Secondly, the general public associates trash with volume. Residential, commercial and public garbage cans and recycling bins are measured in gallons and provide the public with clearer understanding of the amount of trash generated, in comparison to weight or item count. Lastly, a majority of the trash observed in stormwater, such as polystyrene foam, chip and candy wrappers, and single use plastic grocery bags, are made of made of lightweight and mobile plastic material. Weight measurements bias towards heavier, less mobile and less prevalent types of materials and therefore are not representative of trash items made of plastic. Thus the use of weight as the primary metric can skew the full picture of the level and types of trash observed in stormwater, potentially focusing municipalities away from controlling more prevalent types of trash, such as plastics.
4.1 Temporal Variability in Trash Generation
Based on the results of focused studies conducted at single stormwater outfalls during defined storm events, the level of trash transported through a stormwater conveyance system has been shown to increase with rainfall and runoff (Kim et al. 2004; Allison et al. 1998a; Allison and Chiew 1995). However, the Los Angeles region dataset suggests that the differences in trash generation are inconsistent from event to event, and indiscernible between wet and dry periods. To evaluate the degree of variability of trash generated among sampling events in the Bay Area and assess whether a relationship between rainfall/runoff and trash generation is observable, all sites monitored during all four sampling events (n=58) were grouped by event and plotted as box whisker plots (Figure 3.4). Additionally, parametric (t‐tests) and non‐parametric (Mann‐Whitney)
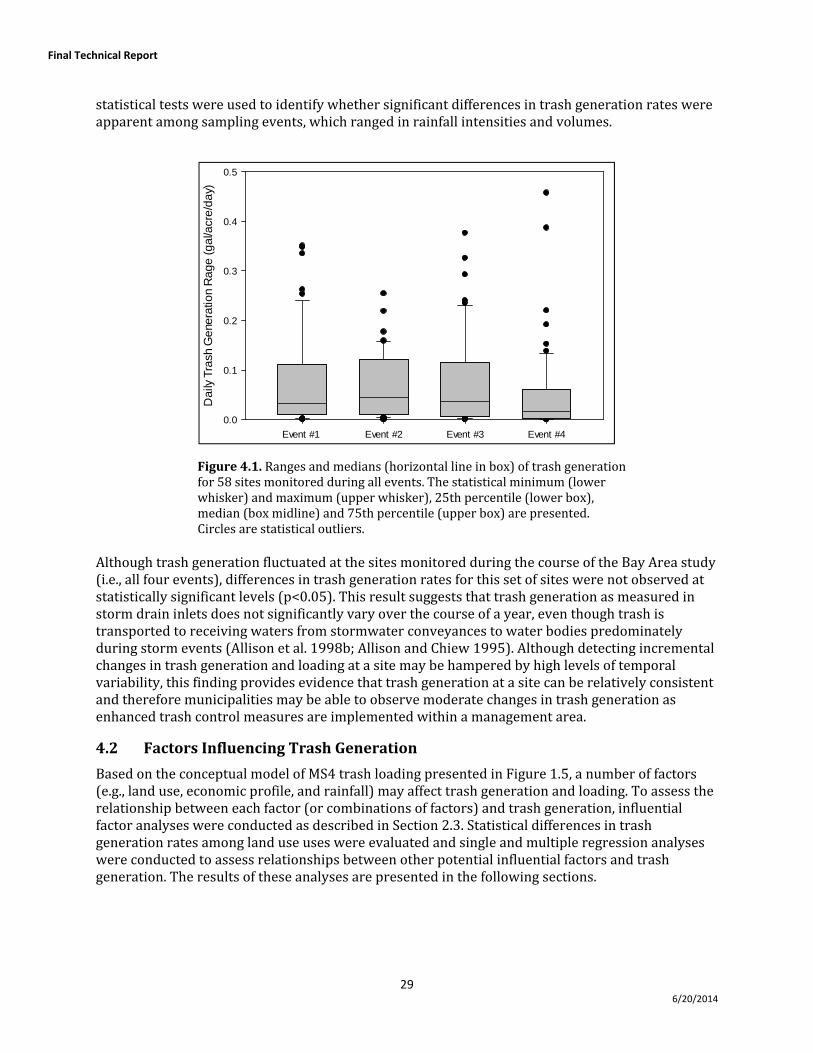
Final Technical Report
29 6/20/2014
statistical tests were used to identify whether significant differences in trash generation rates were apparent among sampling events, which ranged in rainfall intensities and volumes.
Figure 4.1. Ranges and medians (horizontal line in box) of trash generation for 58 sites monitored during all events. The statistical minimum (lower whisker) and maximum (upper whisker), 25th percentile (lower box), median (box midline) and 75th percentile (upper box) are presented. Circles are statistical outliers.
Although trash generation fluctuated at the sites monitored during the course of the Bay Area study (i.e., all four events), differences in trash generation rates for this set of sites were not observed at statistically significant levels (p<0.05). This result suggests that trash generation as measured in storm drain inlets does not significantly vary over the course of a year, even though trash is transported to receiving waters from stormwater conveyances to water bodies predominately during storm events (Allison et al. 1998b; Allison and Chiew 1995). Although detecting incremental changes in trash generation and loading at a site may be hampered by high levels of temporal variability, this finding provides evidence that trash generation at a site can be relatively consistent and therefore municipalities may be able to observe moderate changes in trash generation as enhanced trash control measures are implemented within a management area.
4.2 Factors Influencing Trash Generation
Based on the conceptual model of MS4 trash loading presented in Figure 1.5, a number of factors (e.g., land use, economic profile, and rainfall) may affect trash generation and loading. To assess the relationship between each factor (or combinations of factors) and trash generation, influential factor analyses were conducted as described in Section 2.3. Statistical differences in trash generation rates among land use uses were evaluated and single and multiple regression analyses were conducted to assess relationships between other potential influential factors and trash generation. The results of these analyses are presented in the following sections.
Event #1 Event #2 Event #3 Event #4
Daily
Tra
sh G
ene
ratio
n R
age
(g
al/a
cre/d
ay)
0.0
0.1
0.2
0.3
0.4
0.5
Final Technical Report
30 6/20/2014
4.2.1 Land Use
Land use is often used as a surrogate for stormwater pollutant generation and loading. Most researchers and municipalities that have attempted to develop trash generation rates have used land use as the primarily indicator of the magnitude of trash in urban areas (Cornelius et al. 1994; Allison and Chiew 1995; Allison et al. 1998a,b; Lippner et al 2000; Los Angeles 2004a,b; Marais et al. 2004; Armitage 2007). To assess the range and differences in trash generation rates by land use, box‐whisker plots illustrating the ranges and medians of trash generation were developed for each land use class (Figure 4.2). Additionally, parametric (t‐tests) and non‐parametric (Mann‐Whitney) statistical tests were used to identify whether significant differences in trash generation rates were apparent among land use classes.
As illustrated in Figure 4.2, trash generation rates of Bay Area sites within each land use class were highly variable, ranging over one to three orders‐of‐magnitude (see whiskers of box‐whiskers plots in Figure 4.2). This variability was also illustrated through the results of parametric and non‐parametric statistical tests, which indicated that significant differences (p<0.05) in trash generation rates were not apparent between land use classes. The lack of observed differences in rates between land uses suggests that other factors may be as (or more) influential on trash generation than land use. Most specifically, the highest coefficients of variation in generation rates were observed for residential and retail land use sites (Table 3.6), which suggests that other influential factors should be evaluated for these two land use classes.
Figure 4.2. Ranges of trash generation rates by land use class. The statistical minimum (lower whisker) and maximum (upper whisker), 25th percentile (lower box), median (horizontal line), mean (dashed line), and 75th percentile (upper box) are presented. Circles are statistical outliers.
Final Technical Report
31 6/20/2014
4.2.2 Other Factors
Previous studies have shown that factors other than land use can influence the magnitude of trash generated from a particular land area (Marais et al. 2004). In particular, researchers have shown that factors associated with hydrology and rainfall, population density and demographics, and trash sources correlate well (positively or negatively) with trash generation. However, correlative factors described in previous studies may be region‐specific and the applicability to the Bay Area is largely unknown. Establishing specific relationships between trash generation and influential factors in the Bay Area is of particular interest to municipalities. For example, the variability of trash generation rates in residential and retail land use sites is of particular interest, as residential land uses comprise the majority of urban land area in the Bay Area, and trash generation appears to be greatest in retail land use areas. Better identification of factors that influence trash generation in these two land use classes may help focus limited public resources towards areas generating disproportionately high levels of trash.
In an effort to identify the most important factors that may affect trash generation in Bay Area residential and retail land use areas, the trash generation rates observed in each land use class were compared to 30 factors. Single factor and multiple factor regression analyses were performed to identify which factor (or set of factors) best explains the variability in generation rates. Results of the analysis are presented in Table 4.1.
Significant correlations (p<0.05) were observed between residential and retail trash generation rates and many of the influential factors evaluated. Strong correlations (r > 0.80) were not observed, however, between trash generation rates and any single influential factor.
For retail sites, although many variables correlated with generation rates, the log of the household median income within a mile area of sites best explained the variation in trash generation. Combining other variables (via multiple regression) to the median income variable provided no better correlation with trash generation (see Appendix D), with the exception of the number of fast food restaurants within a mile of a retail monitoring site. This suggests that among the factors examined, median household income is the best predictor of trash generation in the retail land use category (i.e., high income, lower trash generation), in combination with presence of fast food restaurants within the vicinity. This relationship between fast food restaurants and trash generation is not surprising, given that a substantial portion of the trash characterized was associated with disposable plastic food service ware likely originating from fast food restaurants.
Similar to retail land uses, trash generation in residential land use areas also correlated with many factors. Of these, the percentage of individuals with no high school diploma in the area around the site, the number of males and individuals between the ages of 10 and 29 living near a site, and the household median income (logged) at the scale of a 5 acres around the site best explained the trash rates observed at residential sites.
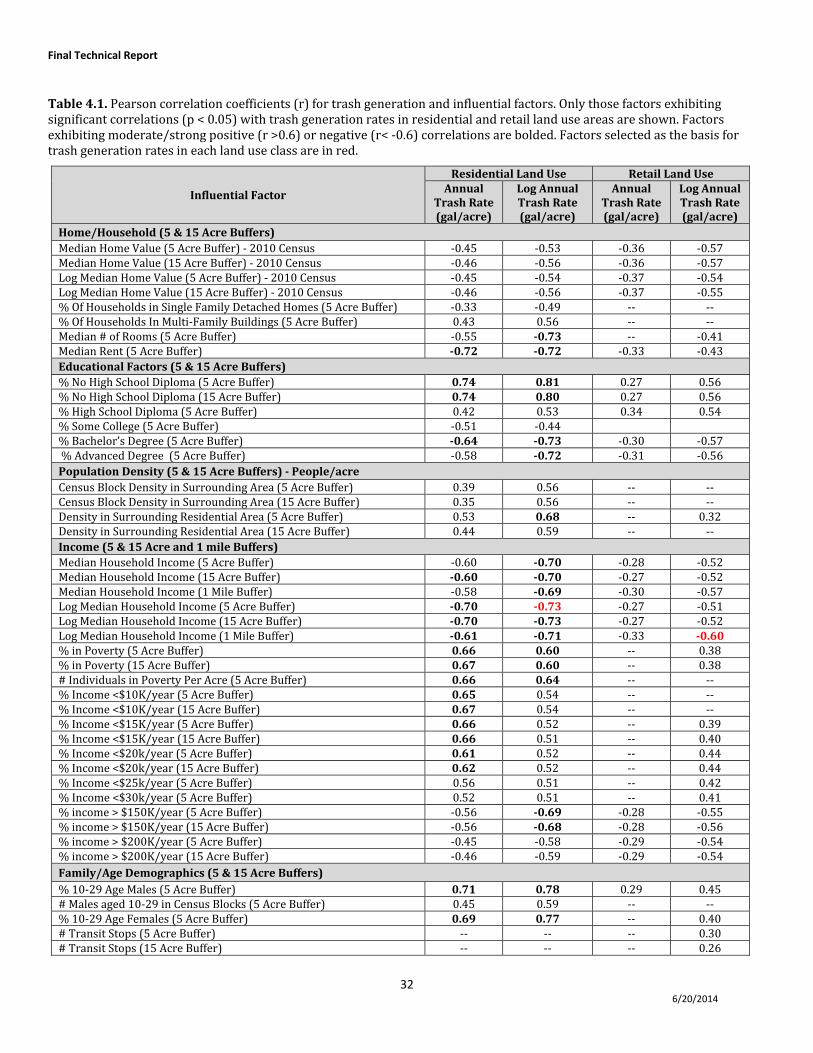
Final Technical Report
32 6/20/2014
Table 4.1. Pearson correlation coefficients (r) for trash generation and influential factors. Only those factors exhibiting significant correlations (p < 0.05) with trash generation rates in residential and retail land use areas are shown. Factors exhibiting moderate/strong positive (r >0.6) or negative (r< ‐0.6) correlations are bolded. Factors selected as the basis for trash generation rates in each land use class are in red.
Influential Factor
Residential Land Use Retail Land Use Annual
Trash Rate (gal/acre)
Log Annual Trash Rate (gal/acre)
Annual Trash Rate (gal/acre)
Log Annual Trash Rate (gal/acre)
Home/Household (5 & 15 Acre Buffers) Median Home Value (5 Acre Buffer) ‐ 2010 Census ‐0.45 ‐0.53 ‐0.36 ‐0.57Median Home Value (15 Acre Buffer) ‐ 2010 Census ‐0.46 ‐0.56 ‐0.36 ‐0.57Log Median Home Value (5 Acre Buffer) ‐ 2010 Census ‐0.45 ‐0.54 ‐0.37 ‐0.54Log Median Home Value (15 Acre Buffer) ‐ 2010 Census ‐0.46 ‐0.56 ‐0.37 ‐0.55% Of Households in Single Family Detached Homes (5 Acre Buffer) ‐0.33 ‐0.49 ‐‐ ‐‐% Of Households In Multi‐Family Buildings (5 Acre Buffer) 0.43 0.56 ‐‐ ‐‐Median # of Rooms (5 Acre Buffer) ‐0.55 0.73 ‐‐ ‐0.41Median Rent (5 Acre Buffer) 0.72 0.72 ‐0.33 ‐0.43Educational Factors (5 & 15 Acre Buffers) % No High School Diploma (5 Acre Buffer) 0.74 0.81 0.27 0.56% No High School Diploma (15 Acre Buffer) 0.74 0.80 0.27 0.56% High School Diploma (5 Acre Buffer) 0.42 0.53 0.34 0.54% Some College (5 Acre Buffer) ‐0.51 ‐0.44 % Bachelor’s Degree (5 Acre Buffer) 0.64 0.73 ‐0.30 ‐0.57 % Advanced Degree (5 Acre Buffer) ‐0.58 0.72 ‐0.31 ‐0.56Population Density (5 & 15 Acre Buffers) People/acre Census Block Density in Surrounding Area (5 Acre Buffer) 0.39 0.56 ‐‐ ‐‐Census Block Density in Surrounding Area (15 Acre Buffer) 0.35 0.56 ‐‐ ‐‐Density in Surrounding Residential Area (5 Acre Buffer) 0.53 0.68 ‐‐ 0.32Density in Surrounding Residential Area (15 Acre Buffer) 0.44 0.59 ‐‐ ‐‐Income (5 & 15 Acre and 1 mile Buffers) Median Household Income (5 Acre Buffer) ‐0.60 0.70 ‐0.28 ‐0.52Median Household Income (15 Acre Buffer) 0.60 0.70 ‐0.27 ‐0.52Median Household Income (1 Mile Buffer) ‐0.58 0.69 ‐0.30 ‐0.57Log Median Household Income (5 Acre Buffer) 0.70 0.73 ‐0.27 ‐0.51Log Median Household Income (15 Acre Buffer) 0.70 0.73 ‐0.27 ‐0.52Log Median Household Income (1 Mile Buffer) 0.61 0.71 ‐0.33 0.60 % in Poverty (5 Acre Buffer) 0.66 0.60 ‐‐ 0.38% in Poverty (15 Acre Buffer) 0.67 0.60 ‐‐ 0.38# Individuals in Poverty Per Acre (5 Acre Buffer) 0.66 0.64 ‐‐ ‐‐% Income <$10K/year (5 Acre Buffer) 0.65 0.54 ‐‐ ‐‐% Income <$10K/year (15 Acre Buffer) 0.67 0.54 ‐‐ ‐‐% Income <$15K/year (5 Acre Buffer) 0.66 0.52 ‐‐ 0.39% Income <$15K/year (15 Acre Buffer) 0.66 0.51 ‐‐ 0.40% Income <$20k/year (5 Acre Buffer) 0.61 0.52 ‐‐ 0.44% Income <$20k/year (15 Acre Buffer) 0.62 0.52 ‐‐ 0.44% Income <$25k/year (5 Acre Buffer) 0.56 0.51 ‐‐ 0.42% Income <$30k/year (5 Acre Buffer) 0.52 0.51 ‐‐ 0.41% income > $150K/year (5 Acre Buffer) ‐0.56 0.69 ‐0.28 ‐0.55% income > $150K/year (15 Acre Buffer) ‐0.56 0.68 ‐0.28 ‐0.56% income > $200K/year (5 Acre Buffer) ‐0.45 ‐0.58 ‐0.29 ‐0.54% income > $200K/year (15 Acre Buffer) ‐0.46 ‐0.59 ‐0.29 ‐0.54Family/Age Demographics (5 & 15 Acre Buffers) % 10‐29 Age Males (5 Acre Buffer) 0.71 0.78 0.29 0.45# Males aged 10‐29 in Census Blocks (5 Acre Buffer) 0.45 0.59 ‐‐ ‐‐% 10‐29 Age Females (5 Acre Buffer) 0.69 0.77 ‐‐ 0.40# Transit Stops (5 Acre Buffer) ‐‐ ‐‐ ‐‐ 0.30# Transit Stops (15 Acre Buffer) ‐‐ ‐‐ ‐‐ 0.26
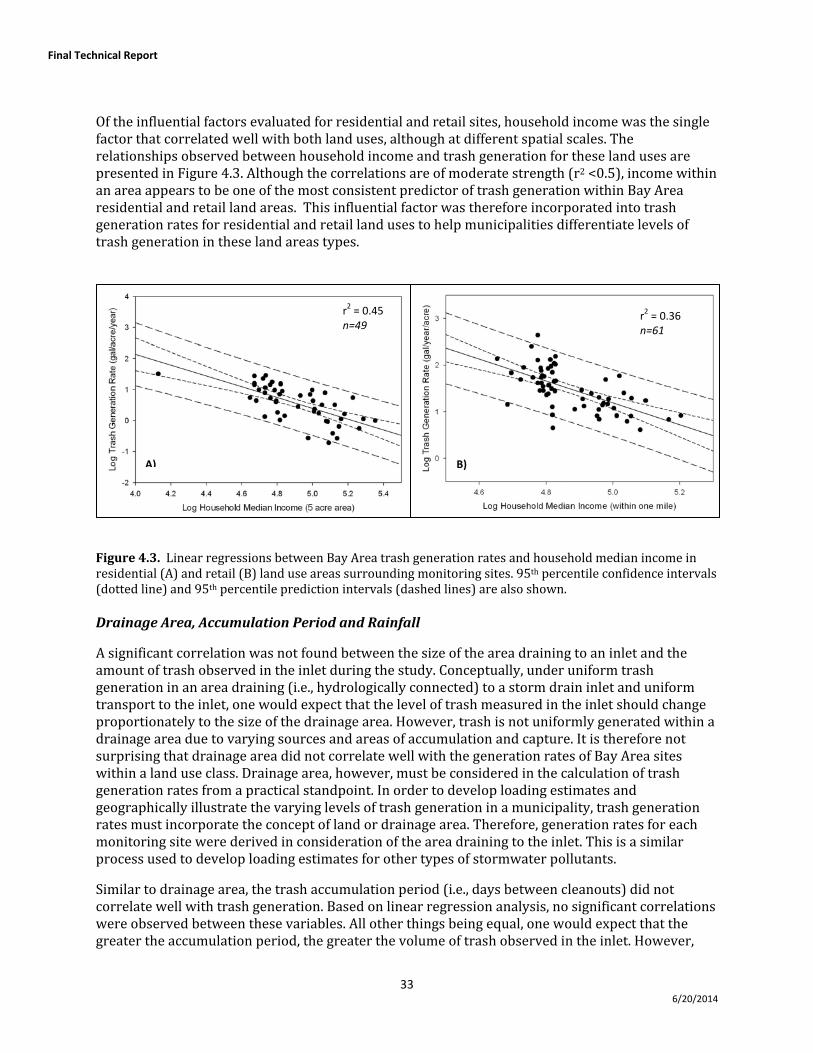
Final Technical Report
33 6/20/2014
Of the influential factors evaluated for residential and retail sites, household income was the single factor that correlated well with both land uses, although at different spatial scales. The relationships observed between household income and trash generation for these land uses are presented in Figure 4.3. Although the correlations are of moderate strength (r2 <0.5), income within an area appears to be one of the most consistent predictor of trash generation within Bay Area residential and retail land areas. This influential factor was therefore incorporated into trash generation rates for residential and retail land uses to help municipalities differentiate levels of trash generation in these land areas types.
Figure 4.3. Linear regressions between Bay Area trash generation rates and household median income in residential (A) and retail (B) land use areas surrounding monitoring sites. 95th percentile confidence intervals (dotted line) and 95th percentile prediction intervals (dashed lines) are also shown. Drainage Area, Accumulation Period and Rainfall
A significant correlation was not found between the size of the area draining to an inlet and the amount of trash observed in the inlet during the study. Conceptually, under uniform trash generation in an area draining (i.e., hydrologically connected) to a storm drain inlet and uniform transport to the inlet, one would expect that the level of trash measured in the inlet should change proportionately to the size of the drainage area. However, trash is not uniformly generated within a drainage area due to varying sources and areas of accumulation and capture. It is therefore not surprising that drainage area did not correlate well with the generation rates of Bay Area sites within a land use class. Drainage area, however, must be considered in the calculation of trash generation rates from a practical standpoint. In order to develop loading estimates and geographically illustrate the varying levels of trash generation in a municipality, trash generation rates must incorporate the concept of land or drainage area. Therefore, generation rates for each monitoring site were derived in consideration of the area draining to the inlet. This is a similar process used to develop loading estimates for other types of stormwater pollutants.
Similar to drainage area, the trash accumulation period (i.e., days between cleanouts) did not correlate well with trash generation. Based on linear regression analysis, no significant correlations were observed between these variables. All other things being equal, one would expect that the greater the accumulation period, the greater the volume of trash observed in the inlet. However,
r2 = 0.45 n=49
r2 = 0.36 n=61
B)A)
Final Technical Report
34 6/20/2014
trash that accumulates on a street may be intercepted prior to or during transport to an inlet, depending on the timing of rainfall/runoff events and the level of control measure implementation, and importance and proximity of sources to an inlet may vary between sites regardless of the period of accumulation. Thus, the sources and the level of interception may mask the importance of accumulation. Accumulation period, however, must also be considered in the calculation of trash generation rates from a practical standpoint. In order to develop annual loading estimates, trash generation rates must incorporate the concept of time. Daily generation rates were therefore derived for each site and for a single land use, used to calculate annual trash generation rates. Although for many pollutants, the rainfall‐runoff process governs the transport of the constituent through the stormwater conveyance system to receiving waters, the BASMAA Trash Generation Rates Project was not designed to assess the effects of rainfall intensity, duration and volume on the trash generation. The results of the analysis of Los Angeles Region data, the effects of rainfall on trash observed in storm drain inlets were not entirely clear. As described in section 1.2 the amount of trash observed in inlets in the Los Angeles Region did not correlate well with the intensity or volume of rainfall during the accumulation periods. Clearly this was a challenging analysis to conduct, considering the variability in trash sources and control measure implementation, and the findings should be considered provisional, however conceptually it may make sense. The trash captured in an inlet could have been transported via a number of mechanisms in addition to stormwater runoff, including wind, direct dumping or littering into the inlet, and street sweepers pushing trash into inlets. Additionally, full capture devices in the inlets have a designed capacity and typically only capture trash up to a specific rainfall amount and intensity. Therefore, the effects of larger storms exceeding the design capacity of the inlet device may not be observed when measuring trash in the inlet.
4.3 Final Baseline Trash Generation Rates
Based on the monitoring and analyses described in the previous sections, annual trash generation rates (gal/acre) for Bay Area stormwater were developed for seven land use classes. High, “best”, and low generation rates for each land use class are presented in Table 4.2. With the exception of residential and retail uses, best generation rates are represented by the mean generation rate for that land use. Low and high rates are represented by the 10th and 90th percentiles of the Bay Area data, respectively. For residential and retail land uses, best generation rates are represented by the “best fit” regression line based on the household median income in the area surrounding a site or parcel. Low and high generation rates are represented by the 5th and 95th confidence intervals, respectively.
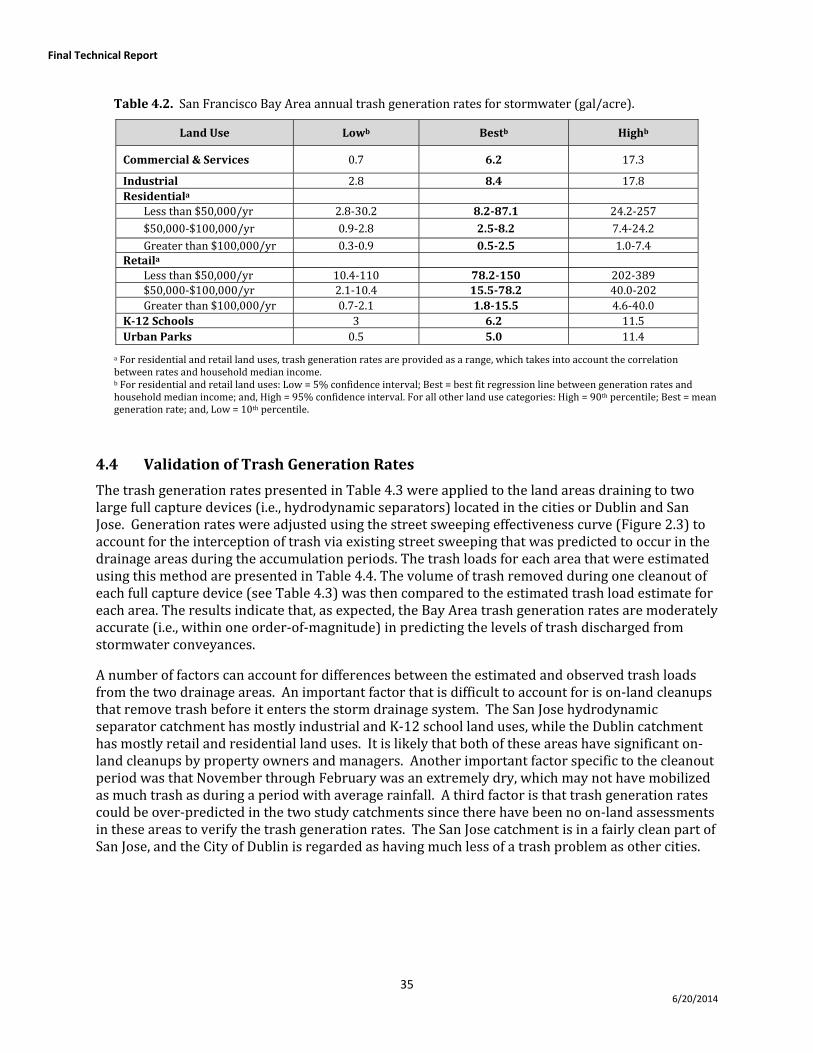
Final Technical Report
35 6/20/2014
Table 4.2. San Francisco Bay Area annual trash generation rates for stormwater (gal/acre).
Land Use Lowb Bestb Highb
Commercial & Services 0.7 6.2 17.3
Industrial 2.8 8.4 17.8 Residentiala
Less than $50,000/yr 2.8‐30.2 8.287.1 24.2‐257$50,000‐$100,000/yr 0.9‐2.8 2.58.2 7.4‐24.2 Greater than $100,000/yr 0.3‐0.9 0.52.5 1.0‐7.4
Retaila Less than $50,000/yr 10.4‐110 78.2150 202‐389 $50,000‐$100,000/yr 2.1‐10.4 15.578.2 40.0‐202Greater than $100,000/yr 0.7‐2.1 1.815.5 4.6‐40.0
K12 Schools 3 6.2 11.5 Urban Parks 0.5 5.0 11.4
a For residential and retail land uses, trash generation rates are provided as a range, which takes into account the correlation between rates and household median income. b For residential and retail land uses: Low = 5% confidence interval; Best = best fit regression line between generation rates and household median income; and, High = 95% confidence interval. For all other land use categories: High = 90th percentile; Best = mean generation rate; and, Low = 10th percentile.
4.4 Validation of Trash Generation Rates
The trash generation rates presented in Table 4.3 were applied to the land areas draining to two large full capture devices (i.e., hydrodynamic separators) located in the cities or Dublin and San Jose. Generation rates were adjusted using the street sweeping effectiveness curve (Figure 2.3) to account for the interception of trash via existing street sweeping that was predicted to occur in the drainage areas during the accumulation periods. The trash loads for each area that were estimated using this method are presented in Table 4.4. The volume of trash removed during one cleanout of each full capture device (see Table 4.3) was then compared to the estimated trash load estimate for each area. The results indicate that, as expected, the Bay Area trash generation rates are moderately accurate (i.e., within one order‐of‐magnitude) in predicting the levels of trash discharged from stormwater conveyances.
A number of factors can account for differences between the estimated and observed trash loads from the two drainage areas. An important factor that is difficult to account for is on‐land cleanups that remove trash before it enters the storm drainage system. The San Jose hydrodynamic separator catchment has mostly industrial and K‐12 school land uses, while the Dublin catchment has mostly retail and residential land uses. It is likely that both of these areas have significant on‐land cleanups by property owners and managers. Another important factor specific to the cleanout period was that November through February was an extremely dry, which may not have mobilized as much trash as during a period with average rainfall. A third factor is that trash generation rates could be over‐predicted in the two study catchments since there have been no on‐land assessments in these areas to verify the trash generation rates. The San Jose catchment is in a fairly clean part of San Jose, and the City of Dublin is regarded as having much less of a trash problem as other cities.
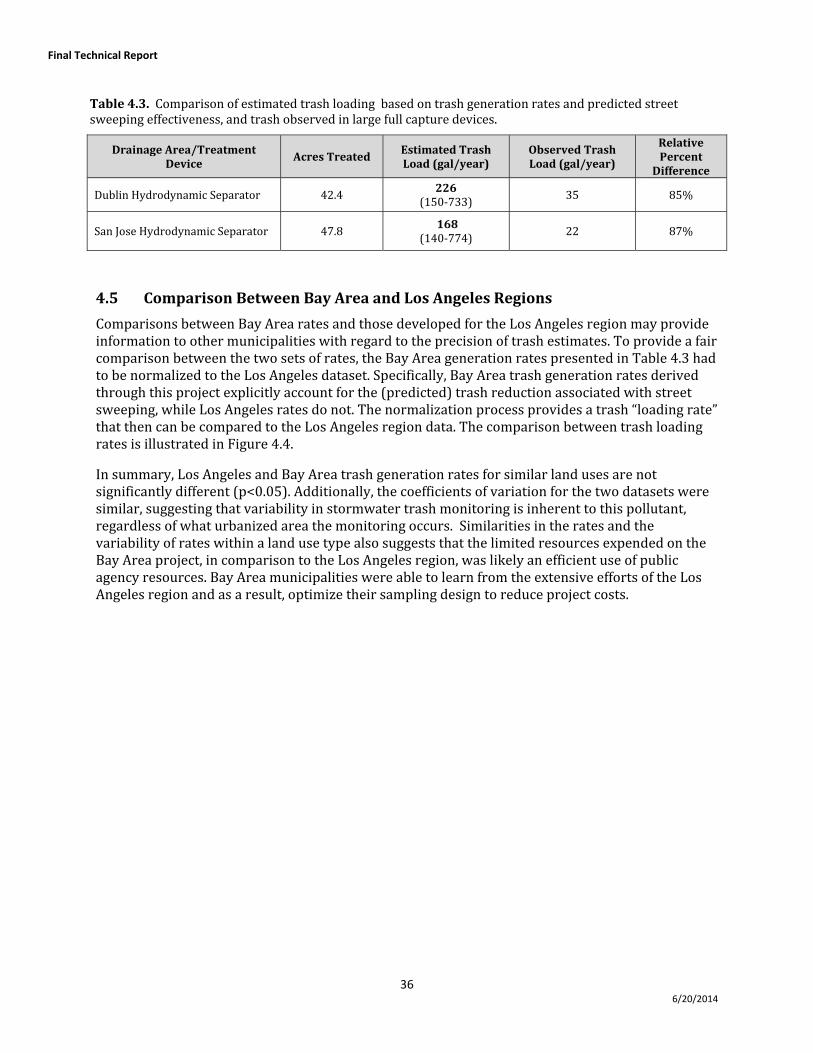
Final Technical Report
36 6/20/2014
Table 4.3. Comparison of estimated trash loading based on trash generation rates and predicted street sweeping effectiveness, and trash observed in large full capture devices.
Drainage Area/Treatment Device
Acres Treated Estimated Trash Load (gal/year)
Observed Trash Load (gal/year)
Relative Percent Difference
Dublin Hydrodynamic Separator 42.4 226
(150‐733) 35 85%
San Jose Hydrodynamic Separator 47.8 168
(140‐774) 22 87%
4.5 Comparison Between Bay Area and Los Angeles Regions
Comparisons between Bay Area rates and those developed for the Los Angeles region may provide information to other municipalities with regard to the precision of trash estimates. To provide a fair comparison between the two sets of rates, the Bay Area generation rates presented in Table 4.3 had to be normalized to the Los Angeles dataset. Specifically, Bay Area trash generation rates derived through this project explicitly account for the (predicted) trash reduction associated with street sweeping, while Los Angeles rates do not. The normalization process provides a trash “loading rate” that then can be compared to the Los Angeles region data. The comparison between trash loading rates is illustrated in Figure 4.4.
In summary, Los Angeles and Bay Area trash generation rates for similar land uses are not significantly different (p<0.05). Additionally, the coefficients of variation for the two datasets were similar, suggesting that variability in stormwater trash monitoring is inherent to this pollutant, regardless of what urbanized area the monitoring occurs. Similarities in the rates and the variability of rates within a land use type also suggests that the limited resources expended on the Bay Area project, in comparison to the Los Angeles region, was likely an efficient use of public agency resources. Bay Area municipalities were able to learn from the extensive efforts of the Los Angeles region and as a result, optimize their sampling design to reduce project costs.
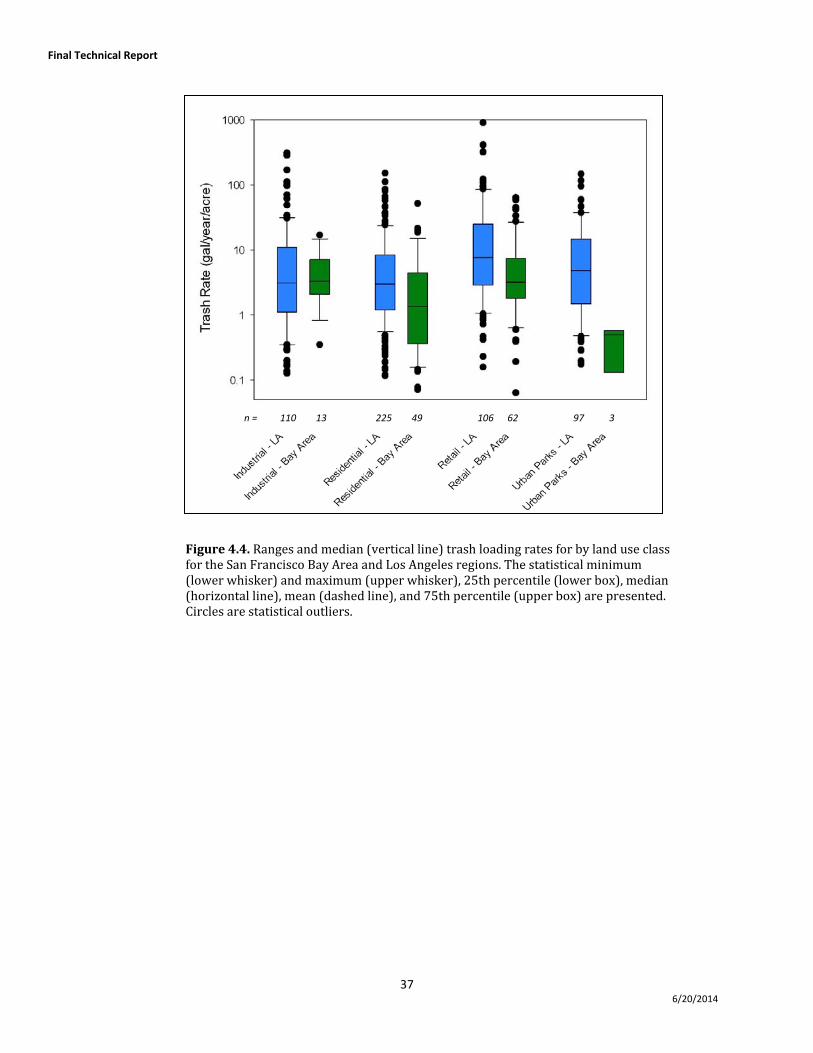
Final Technical Report
37 6/20/2014
Figure 4.4. Ranges and median (vertical line) trash loading rates for by land use class for the San Francisco Bay Area and Los Angeles regions. The statistical minimum (lower whisker) and maximum (upper whisker), 25th percentile (lower box), median (horizontal line), mean (dashed line), and 75th percentile (upper box) are presented. Circles are statistical outliers.
n = 110 13 225 49 106 62 97 3
Final Technical Report
38 6/20/2014
4.6 Conclusions and Uncertainties
Based on the results of the analyses presented, the BASMAA Trash Generation Rates Project provides adequate first‐order estimates of trash generation for stormwater conveyance systems. By including income as a factor that helps differentiate trash generation in residential and retail land areas, the project has likely given municipalities a more refined tool that can aide in more precisely identifying areas generating disproportionate levels and trash, and in need of enhanced trash control measures. That said, trash generation can be site specific and therefore rates developed through the project should be applied cautiously by municipalities and to the extent possible, verified based on existing knowledge of trash problem areas within their agencies and/or through field assessments, such as those described section 5.0.
The following are assumptions and uncertainties identified during the implementation of the project. These assumptions and uncertainties should be considered during the application of the results and conclusions presented herein.
Bay Area trash generation rates presented this report were based on limited data collected over the course of roughly one year (2011‐2012). Trash generation rates presented are therefore depictive of the year monitoring occured, and may or may not be applicable to other timeframes.
Trash full capture devices utilized during the course of the study were designed to meet the design standard for full capture devices set by the San Francisco Bay Water Board via the MRP. Trash devices likely do not capture all trash that enters the stormwater system from the associated drainage area. Full capture devices, however, do provide an acceptable of level of stormwater trash management, as indicated by the Water Board and in the MRP. For the purposes of this study, it was assumed that the amount of trash collected from a properly maintained full capture device was depictive of the amount of trash generated during the associated accumulation period.
A rainfall volume of 0.2 inches of rain in 24 hours observed in the nearest rainfall gage was assumed to have an intensity that would effectively transport trash to a monitoring site. Unless this volume of rainfall occurred over a short period of time (e.g., < 4 hours), this intensity is likely an overestimate of trash transportability. Additionally, the trash transport process that occurs via rainfall/runoff events is likely to be trash type and area specific.
Although trash estimates are of a known quality, procedures for measuring trash in stormwater conveyances have yet to be developed. Use of alternative characterization methods in the future would likely yield different trash generation rates than presented in this report.
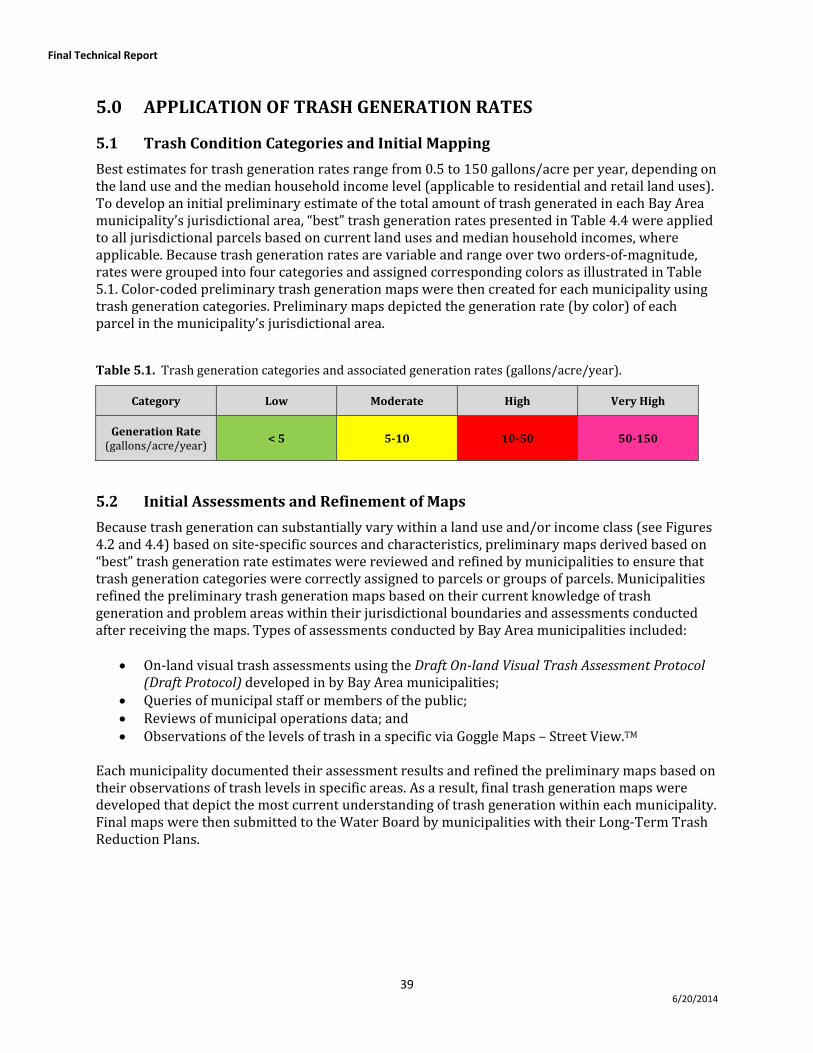
Final Technical Report
39 6/20/2014
5.0 APPLICATION OF TRASH GENERATION RATES
5.1 Trash Condition Categories and Initial Mapping
Best estimates for trash generation rates range from 0.5 to 150 gallons/acre per year, depending on the land use and the median household income level (applicable to residential and retail land uses). To develop an initial preliminary estimate of the total amount of trash generated in each Bay Area municipality’s jurisdictional area, “best” trash generation rates presented in Table 4.4 were applied to all jurisdictional parcels based on current land uses and median household incomes, where applicable. Because trash generation rates are variable and range over two orders‐of‐magnitude, rates were grouped into four categories and assigned corresponding colors as illustrated in Table 5.1. Color‐coded preliminary trash generation maps were then created for each municipality using trash generation categories. Preliminary maps depicted the generation rate (by color) of each parcel in the municipality’s jurisdictional area.
Table 5.1. Trash generation categories and associated generation rates (gallons/acre/year).
Category Low Moderate High Very High
Generation Rate (gallons/acre/year)
< 5 510 1050 50150
5.2 Initial Assessments and Refinement of Maps
Because trash generation can substantially vary within a land use and/or income class (see Figures 4.2 and 4.4) based on site‐specific sources and characteristics, preliminary maps derived based on “best” trash generation rate estimates were reviewed and refined by municipalities to ensure that trash generation categories were correctly assigned to parcels or groups of parcels. Municipalities refined the preliminary trash generation maps based on their current knowledge of trash generation and problem areas within their jurisdictional boundaries and assessments conducted after receiving the maps. Types of assessments conducted by Bay Area municipalities included:
On‐land visual trash assessments using the Draft Onland Visual Trash Assessment Protocol (Draft Protocol) developed in by Bay Area municipalities;
Queries of municipal staff or members of the public; Reviews of municipal operations data; and Observations of the levels of trash in a specific via Goggle Maps – Street View.TM
Each municipality documented their assessment results and refined the preliminary maps based on their observations of trash levels in specific areas. As a result, final trash generation maps were developed that depict the most current understanding of trash generation within each municipality. Final maps were then submitted to the Water Board by municipalities with their Long‐Term Trash Reduction Plans.
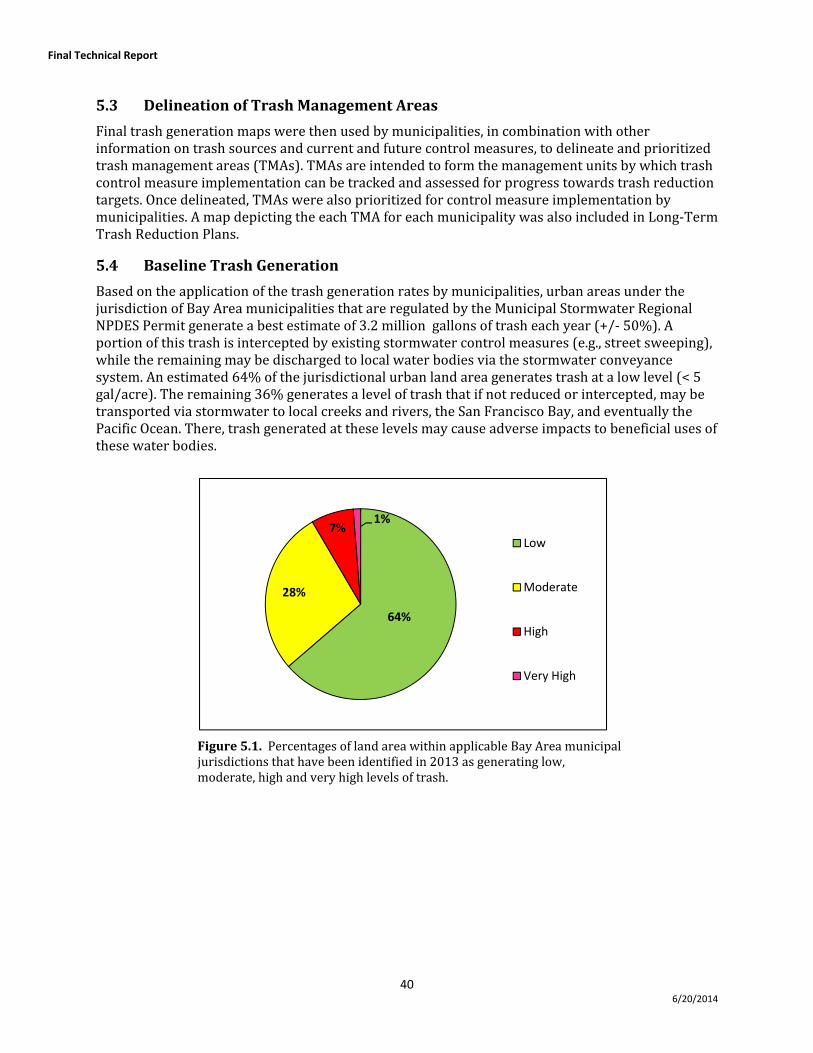
Final Technical Report
40 6/20/2014
5.3 Delineation of Trash Management Areas
Final trash generation maps were then used by municipalities, in combination with other information on trash sources and current and future control measures, to delineate and prioritized trash management areas (TMAs). TMAs are intended to form the management units by which trash control measure implementation can be tracked and assessed for progress towards trash reduction targets. Once delineated, TMAs were also prioritized for control measure implementation by municipalities. A map depicting the each TMA for each municipality was also included in Long‐Term Trash Reduction Plans.
5.4 Baseline Trash Generation
Based on the application of the trash generation rates by municipalities, urban areas under the jurisdiction of Bay Area municipalities that are regulated by the Municipal Stormwater Regional NPDES Permit generate a best estimate of 3.2 million gallons of trash each year (+/‐ 50%). A portion of this trash is intercepted by existing stormwater control measures (e.g., street sweeping), while the remaining may be discharged to local water bodies via the stormwater conveyance system. An estimated 64% of the jurisdictional urban land area generates trash at a low level (< 5 gal/acre). The remaining 36% generates a level of trash that if not reduced or intercepted, may be transported via stormwater to local creeks and rivers, the San Francisco Bay, and eventually the Pacific Ocean. There, trash generated at these levels may cause adverse impacts to beneficial uses of these water bodies.
Figure 5.1. Percentages of land area within applicable Bay Area municipal jurisdictions that have been identified in 2013 as generating low, moderate, high and very high levels of trash.
64%
28%
7%1%
Low
Moderate
High
Very High
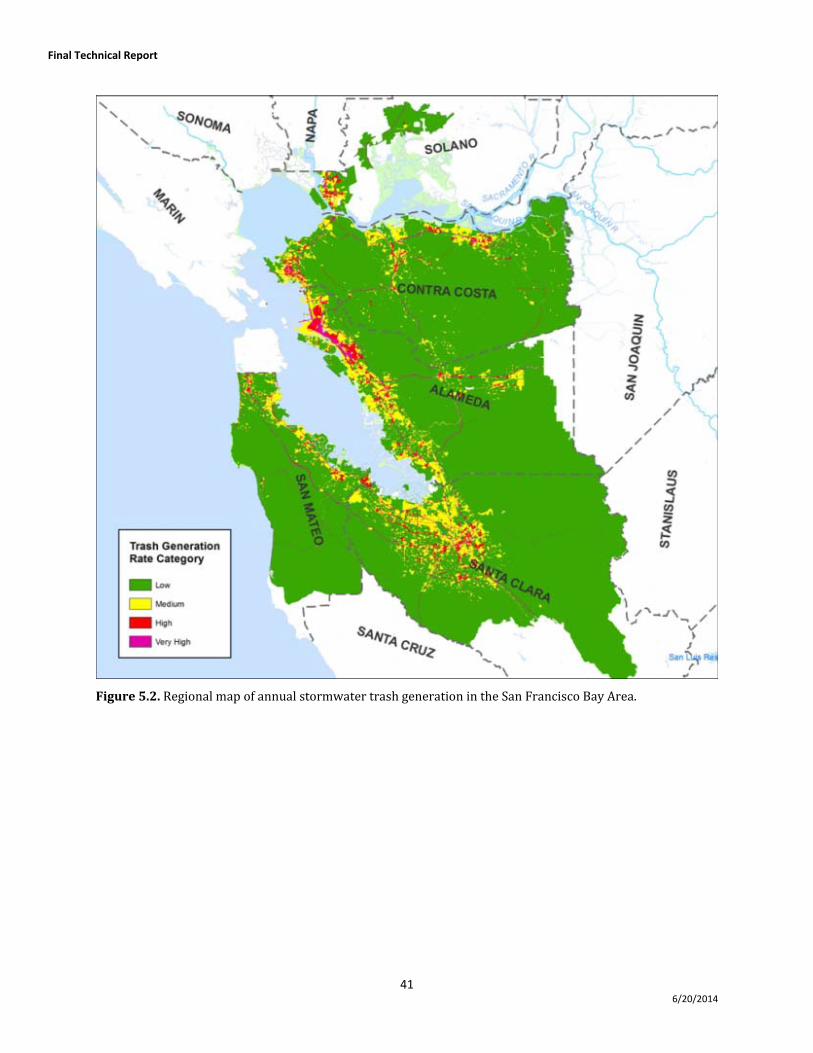
Final Technical Report
41 6/20/2014
Figure 5.2. Regional map of annual stormwater trash generation in the San Francisco Bay Area.
Final Technical Report
42 6/20/2014
6.0 REFERENCES
Allison R.A. and F.H.S. Chiew 1995. Monitoring stormwater pollution from various land uses in an urban catchment. Proceedings from the 2nd International Symposium on Urban Stormwater Management, Melbourne, 551‐516.
Allison, R.A., T.A. Walker, F.H.S. Chiew, I.C. O’Neill and T.A McMahon 1998a. From Roads to rivers: Gross pollutant removal from urban waterways. Report 98/6. Cooperative Research Centre for Catchment Hydrology. Victoria, Australia. May.
Allison, R.A., F.H.S. Chiew and T.A. McMahon. 1998b. A decision‐support‐system for determining effective trapping strategies for gross pollutants. Report 98/3. Cooperative Research Centre for Catchment Hydrology. April.
Armitage N., A. Rooseboom, C. Nel, and P. Townshend 1998. “The removal of Urban Litter from Stormwater Conduits and Streams. Water Research Commission (South Africa) Report No. TT 95/98, Prestoria.
Armitage, N. and A. Rooseboom 2000. The removal of urban litter from stormwater conduits and streams: Paper 1 – The quantities involved and catchment litter management options. Water S.A. Vol. 26. No. 2: 181‐187.
Armitage, N. 2001. The removal of Urban Litter from Stormwater Drainage Systems. Ch. 19 in Stormwater Collection Systems Design Handbook. L.W. Mays, Ed., McGraw‐Hill Companies, Inc. ISBN 0‐07‐135471‐9, New York, USA, 2001, 35 pp.
Armitage, N. 2007. The reduction of urban litter in the stormwater drains of South Africa. Urban Water Journal Vol. 4, No. 3: 151‐172. September.
BASMAA (2011a). Methods to Estimate Baseline Trash Loads from Bay Area Municipal Stormwater Systems: Technical Memorandum #1. Prepared for the Bay Area Stormwater Management Agencies Association (BASMAA). Oakland. Prepared by Eisenberg, Olivieri and Associates (EOA).
BASMAA (2011b). Baseline Trash Loading Rates from Bay Area Municipal Stormwater Systems: Sampling and Analysis Plan. Prepared for the Bay Area Stormwater Management Agencies Association (BASMAA). Oakland. Prepared by Eisenberg, Olivieri and Associates (EOA).
BASMAA (2012). Preliminary Trash Generation Rates – Technical Memorandum. Prepared for the Bay Area Stormwater Management Agencies Association (BASMAA). Oakland. Prepared by Eisenberg, Olivieri and Associates (EOA). February 1, 2012.
Bjorndal K.A., A.B. Bolten, C.J. Lagueux. 1994. Ingestion of marine debris by juvenile sea turtles in coastal Florida habitats. Marine Pollution Bulletin. Volume 28, Issue 3, Pages 154–158. March.
Boergera, C.M., G.L. Lattina, S.L. Mooreb, C.J. Moore. 2010. Plastic ingestion by planktivorous fishes in the North Pacific Central Gyre. Marine Pollution Bulletin. Volume 60, Issue 12, Pages 2275–2278. December.
Cornelius, M, Clayton, T, Lewis, G, Arnold, G and Craig, J. 1994. Litter Associated with Stormwater Discharge in Auckland City New Zealand. Auckland: Island Care New Zealand Trust.
Islam, M. S. and M. Tanaka. 2004. Impacts of pollution on coastal and marine ecosystems including coastal and marine fisheries and approach for management: a review and synthesis. Marine Pollution Bulletin. Volume 48, Issues 7–8, Pages 624–649. 2004.
Kim, L.H, M. Kayhanian, M.K. Stenstrom 2004. Event mean concentration and loading of litter from highways during storms. Science of the Total Environment Vol 330: 101‐113.
Laist, D.W. 1987. Overview of the biological effects of lost and discarded plastic debris in the marine environment. Marine Pollution Bulletin. Volume 18, Issue 6, Supplement B, Pages 319–326. June.
Laist, D.W. and M. Liffmann 2000. Impacts of marine debris: research and management needs. Issue papers of the International Marine Debris Conference. pp 16‐29. Honolulu, HI. 6‐11 Aug.
Final Technical Report
43 6/20/2014
Lewis, J. 2002. Effectiveness of stormwater litter traps for syringe and litter removal. Cooperative Research Centre for Catchment Hydrology, Melbourne.
Lippner, G., R. Churchwell, R. Allison, G. Moeller, and J. Johnston 2000. A Scientific Approach to Evaluating Storm Water Best Management Practices for Litter. Transportation Research Record . TTR 1743, 10‐15.
Los Angeles County 2002. Los Angeles County Litter Monitoring Plan for the Los Angeles River and Ballona Creek Trash Total Maximum Daily Load. 30 May.
Los Angeles County 2004a. Trash Baseline Monitoring Results Los Angeles River and Ballona Creek Watershed. Los Angeles County Department of Public Works. 17 February.
Los Angeles County 2004b. Trash Baseline Monitoring for Los Angeles River and Ballona Creek Watersheds. Los Angeles County Department of Public Works. 6 May.
Marais M. and N. Armitage 2003. The measurement and reduction of urban litter entering stormwater drainage systems. WRC Report No. TT211/03. Pretoria.
Marais, M., N. Amritage and C. Wise 2004. The measurements and reduction of urban liter entering stormwater drainage systems: Paper 1 – Quantifying the problem using the City of Cape town as a case study. Water SA Vol. 30, No. 4: 469‐482.
Moore, C.J. 2008. Synthetic polymers in the marine environment: A rapidly increasing, long‐term threat. Environmental Research. Volume 108, Issue 2, Pages 131–139. October.
Ocean Conservancy. 2013. Working for Clean Beaches and Clean Water ‐ 2013 Report. http://www.oceanconservancy.org/our‐work/international‐coastal‐cleanup/icc‐2013‐report.pdf.
Redford, D., W.R. Trulli, and H.K. Trulli 1992. Composition of floating debris in harbors of the United States. Chemistry and Ecology Vol. 7: 75‐92.
SFBRWQCB. 2009. Municipal Regional NPDES Permit for Stormwater Discharges. Order R2‐2009‐0074. San Francisco Bay Regional Water Quality Control Board.
Sheavly, S. B. and K. M. Register. 2007. Marine Debris & Plastics: Environmental Concerns, Sources, Impacts and Solutions. Journal of Polymers and the Environment. Volume 15, Issue 4, pp 301‐305. October.
United States Census Bureau. (2011). Census 2010 Geographical Information System Data. United States Department of Commerce.
United States Environmental Protection Agency (USEPA) 2014. Municipal Solid Waste Generation, Recycling, and Disposal in the United States: Facts and Figures for 2012. United States Environmental Protection Agency. Solid Waste and Emergency Response. EPA‐530‐F‐14‐001. Washington, DC. February.
von Saal. F.S., S. Parmigiani, P.L. Palanza, L.G. Everett, R. Ragaini. 2008. The plastic world: Sources, amounts, ecological impacts and effects on development, reproduction, brain and behavior in aquatic and terrestrial animals and humans. Environmental Research. Volume 108, Issue 2, Pages 127–130. October.
Final Technical Report
44 6/20/2014
7.0 GLOSSARY Best Management Practice (BMP): Any activity, technology, process, operational method or measure, or engineered system, which when implemented prevents, controls, removes, or reduces pollution. A BMP is also referred to as a control measure.
Bypass: The intentional diversion of waste streams from any portion of a treatment (or pretreatment) facility.
Conceptual Model: A model that explicitly describes and graphically represents all existing knowledge on the sources of a pollutant, its fate and transport, and its effects in the ecosystem.
Discharge: A release or flow of stormwater or other substance from a stormwater conveyance system.
Effectiveness (with regard to treatment BMPs): A measure of how well a BMP system meets its goals for all storm water flows reaching the BMP site, including flow bypasses.
Full Capture Device: A single device or series of devices that can trap all particles retained by a 5 mm mesh screen, and has a treatment capacity that exceeds the peak flow rate resulting from a one‐year, one‐hour storm in the subdrainage area treated by the BMP.
Generation Rate – The amount of trash that is annually generated per acre of urban land.
Gross Solids: Gross solids are litter, trash, leaves, and large coarse sediments that travel, as either floating debris or bed loads, in stormwater conveyance systems. Sometimes referred to as gross pollutants.
Jurisdictional Areas: All urban land areas within a Permittee’s geographical boundary that are directly subject to MRP requirements. Land use areas not included as jurisdictional areas include: Federal and State of California Facilities and Roads (e.g., Interstates, State Highways, Military Bases, Prisons); Roads Owned and Maintained by other municipalities (e.g., Unincorporated Counties); Public and Private Colleges and Universities; Non‐urban Land Uses (e.g., agriculture, forest, rangeland, open space, wetlands, water);; Communication or Power Facilities (e.g., PG & E Substations); Water and Wastewater Treatment Facilities; and, Other Transportation Facilities (e.g., airports, railroads, and maritime shipping ports).
Litter: As defined by California Code Section 68055.1(g), litter means all improperly discarded waste material, including, but not limited to, convenience food, beverage, and other product packages or containers constructed of steel, aluminum, glass, paper, plastic, and other natural and synthetic materials, thrown or deposited on the lands and water.
Loading Rate – The total amount of trash annually discharged from an MS4 per acre of urban land.
Municipal Separate Storm Sewer System (MS4): "a conveyance or system of conveyances (including roads with drainage systems, municipal streets, catch basins, curbs, gutters, ditches, man‐made channels, or storm drains): (i) Owned or operated by a state, city, town, borough, county, parish, district, association, or other public body (created to or pursuant to state law) including special districts under state law such as a sewer district, flood control district or drainage district, or similar entity, or an Indian tribe or an authorized Indian tribal organization, or a designated and approved management agency under section 208 of the Clean Water Act that discharges into waters of the United States. (ii) Designed or used for collecting or conveying stormwater; (iii) Which is not a combined sewer; and (iv) Which is not part of a Publicly Owned Treatment Works (POTW) as defined at 40 CFR 122.2." (40 CFR 122.26(b)(8))
Outfall: The discharge point of a water conveyance system (e.g. pipes) to a receiving water body
Overflow: To be filled beyond the design capacity of a BMP.
Performance (with regard to treatment BMPs): A measure of how well a treatment BMP meets its goals for storm water that flows through, or is processed by it.
Pollutant: A substance introduced into the environment that adversely affects or potentially affects the usefulness of a resource.
Pollutant Load: The mass of a pollutant discharged into or from a receiving water body.
Final Technical Report
45 6/20/2014
Receiving Waters: Natural water bodies receiving discharges from municipal stormwater drainage systems.
Stormwater: Runoff from roofs, roads and other surfaces that is generated during rainfall and snow events and flows into a stormwater drainage system.
Storm Drain Inlet: Part of the stormwater drainage system where surface runoff enters the underground conveyance system. Includes side inlets located adjacent to curbs and grate inlets located on the surface of a street or parking lot.
Storm Drain Insert: A device (e.g., screen or basket) designed to capture trash capture within a storm drain inlet.
Stormwater Conveyance System: Any pipe, ditch or gully, or system of pipes, ditches, or gullies, that is owned or operated by a governmental entity and used for collecting and conveying stormwater.
Trash: Man‐made litter (as defined by California Code Section 68055.1g) that cannot pass through a 5 mm mesh screen. Excludes sediments, sand, vegetation, oil and grease, and exotic species.
Trash Dispersal: Inadvertent distribution of trash in the environment due to improper handling and transportation.
Urban Runoff: All flows in a stormwater drainage system and consists stormwater (wet weather flows) and non‐storm water illicit discharges (dry weather flows).
Watershed: A defined area of land that catches rain and snow and drains or seeps into a marsh, stream, river, lake or groundwater.
Final Technical Report
1 6/20/2014
APPENDIX A
MONITORING SITE DESCRIPTIONS
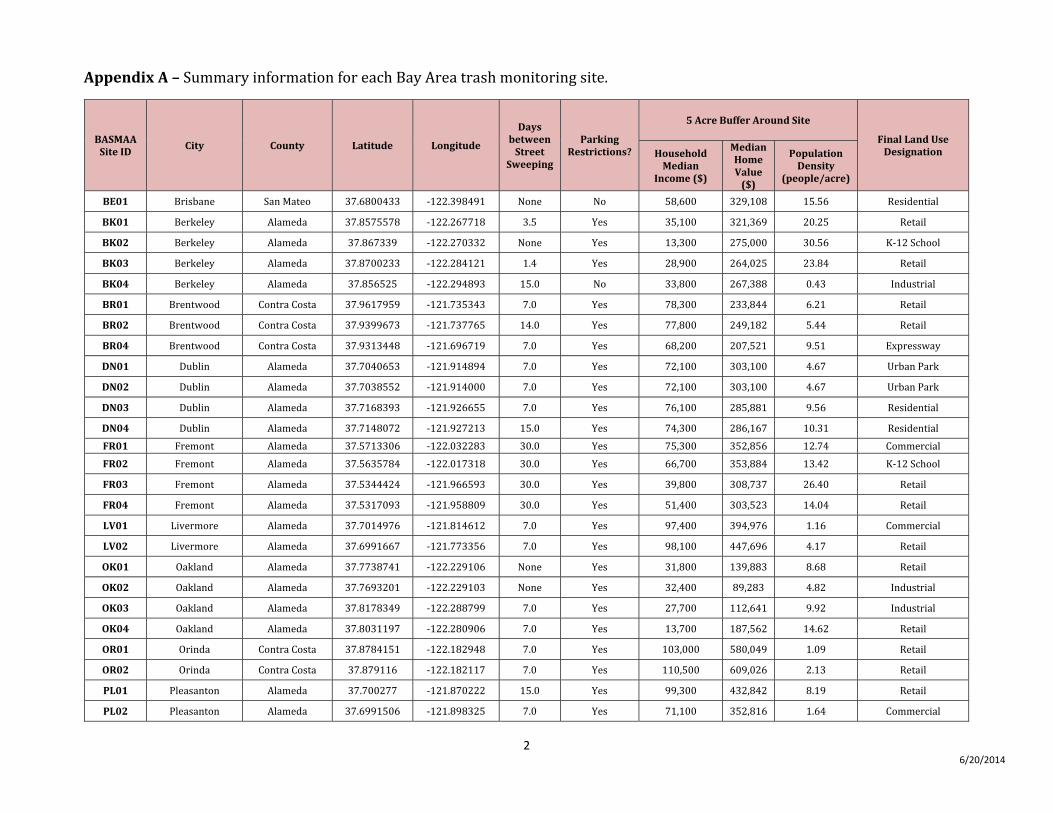
2 6/20/2014
Appendix A – Summary information for each Bay Area trash monitoring site.
BASMAA Site ID
City County Latitude Longitude
Days between Street
Sweeping
Parking Restrictions?
5 Acre Buffer Around Site
Final Land Use Designation Household
Median Income ($)
Median Home Value ($)
Population Density
(people/acre)
BE01 Brisbane San Mateo 37.6800433 ‐122.398491 None No 58,600 329,108 15.56 Residential
BK01 Berkeley Alameda 37.8575578 ‐122.267718 3.5 Yes 35,100 321,369 20.25 Retail
BK02 Berkeley Alameda 37.867339 ‐122.270332 None Yes 13,300 275,000 30.56 K‐12 School
BK03 Berkeley Alameda 37.8700233 ‐122.284121 1.4 Yes 28,900 264,025 23.84 Retail
BK04 Berkeley Alameda 37.856525 ‐122.294893 15.0 No 33,800 267,388 0.43 Industrial
BR01 Brentwood Contra Costa 37.9617959 ‐121.735343 7.0 Yes 78,300 233,844 6.21 Retail
BR02 Brentwood Contra Costa 37.9399673 ‐121.737765 14.0 Yes 77,800 249,182 5.44 Retail
BR04 Brentwood Contra Costa 37.9313448 ‐121.696719 7.0 Yes 68,200 207,521 9.51 Expressway
DN01 Dublin Alameda 37.7040653 ‐121.914894 7.0 Yes 72,100 303,100 4.67 Urban Park
DN02 Dublin Alameda 37.7038552 ‐121.914000 7.0 Yes 72,100 303,100 4.67 Urban Park
DN03 Dublin Alameda 37.7168393 ‐121.926655 7.0 Yes 76,100 285,881 9.56 Residential
DN04 Dublin Alameda 37.7148072 ‐121.927213 15.0 Yes 74,300 286,167 10.31 Residential
FR01 Fremont Alameda 37.5713306 ‐122.032283 30.0 Yes 75,300 352,856 12.74 Commercial
FR02 Fremont Alameda 37.5635784 ‐122.017318 30.0 Yes 66,700 353,884 13.42 K‐12 School
FR03 Fremont Alameda 37.5344424 ‐121.966593 30.0 Yes 39,800 308,737 26.40 Retail
FR04 Fremont Alameda 37.5317093 ‐121.958809 30.0 Yes 51,400 303,523 14.04 Retail
LV01 Livermore Alameda 37.7014976 ‐121.814612 7.0 Yes 97,400 394,976 1.16 Commercial
LV02 Livermore Alameda 37.6991667 ‐121.773356 7.0 Yes 98,100 447,696 4.17 Retail
OK01 Oakland Alameda 37.7738741 ‐122.229106 None Yes 31,800 139,883 8.68 Retail
OK02 Oakland Alameda 37.7693201 ‐122.229103 None Yes 32,400 89,283 4.82 Industrial
OK03 Oakland Alameda 37.8178349 ‐122.288799 7.0 Yes 27,700 112,641 9.92 Industrial
OK04 Oakland Alameda 37.8031197 ‐122.280906 7.0 Yes 13,700 187,562 14.62 Retail
OR01 Orinda Contra Costa 37.8784151 ‐122.182948 7.0 Yes 103,000 580,049 1.09 Retail
OR02 Orinda Contra Costa 37.879116 ‐122.182117 7.0 Yes 110,500 609,026 2.13 Retail
PL01 Pleasanton Alameda 37.700277 ‐121.870222 15.0 Yes 99,300 432,842 8.19 Retail
PL02 Pleasanton Alameda 37.6991506 ‐121.898325 7.0 Yes 71,100 352,816 1.64 Commercial
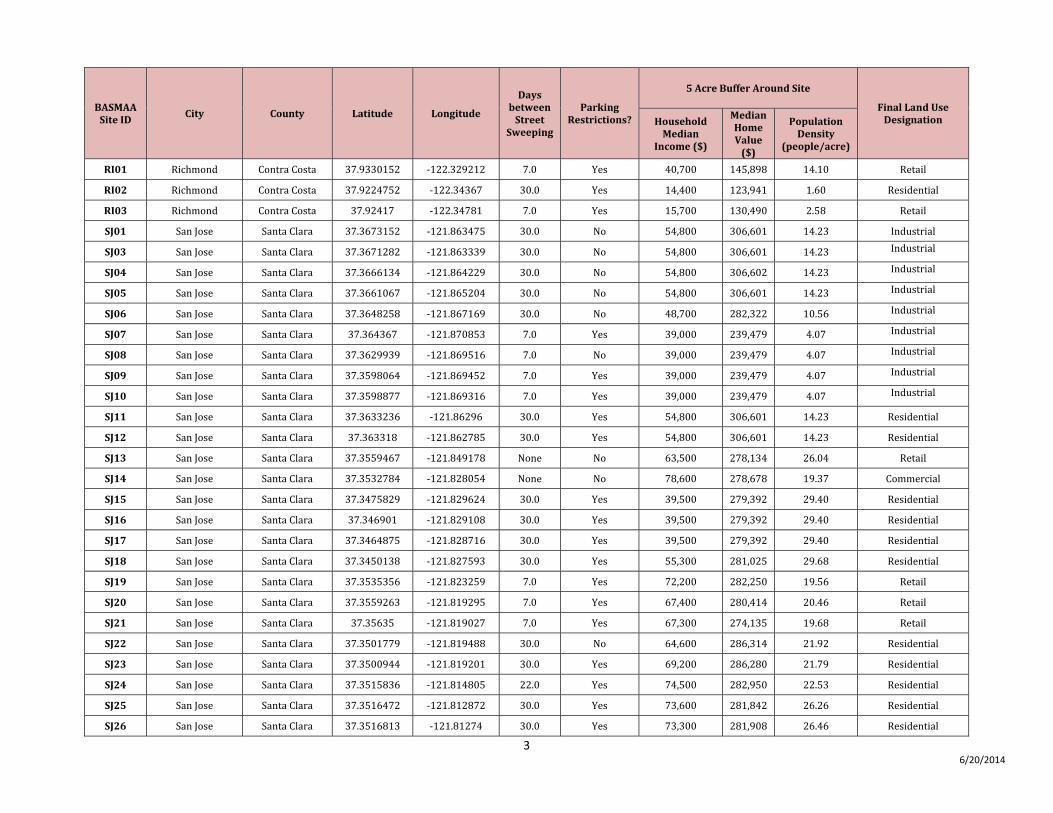
3 6/20/2014
BASMAA Site ID
City County Latitude Longitude
Days between Street
Sweeping
Parking Restrictions?
5 Acre Buffer Around Site
Final Land Use Designation Household
Median Income ($)
Median Home Value ($)
Population Density
(people/acre)
RI01 Richmond Contra Costa 37.9330152 ‐122.329212 7.0 Yes 40,700 145,898 14.10 Retail
RI02 Richmond Contra Costa 37.9224752 ‐122.34367 30.0 Yes 14,400 123,941 1.60 Residential
RI03 Richmond Contra Costa 37.92417 ‐122.34781 7.0 Yes 15,700 130,490 2.58 Retail
SJ01 San Jose Santa Clara 37.3673152 ‐121.863475 30.0 No 54,800 306,601 14.23 Industrial
SJ03 San Jose Santa Clara 37.3671282 ‐121.863339 30.0 No 54,800 306,601 14.23 Industrial
SJ04 San Jose Santa Clara 37.3666134 ‐121.864229 30.0 No 54,800 306,602 14.23 Industrial
SJ05 San Jose Santa Clara 37.3661067 ‐121.865204 30.0 No 54,800 306,601 14.23 Industrial
SJ06 San Jose Santa Clara 37.3648258 ‐121.867169 30.0 No 48,700 282,322 10.56 Industrial
SJ07 San Jose Santa Clara 37.364367 ‐121.870853 7.0 Yes 39,000 239,479 4.07 Industrial
SJ08 San Jose Santa Clara 37.3629939 ‐121.869516 7.0 No 39,000 239,479 4.07 Industrial
SJ09 San Jose Santa Clara 37.3598064 ‐121.869452 7.0 Yes 39,000 239,479 4.07 Industrial
SJ10 San Jose Santa Clara 37.3598877 ‐121.869316 7.0 Yes 39,000 239,479 4.07 Industrial
SJ11 San Jose Santa Clara 37.3633236 ‐121.86296 30.0 Yes 54,800 306,601 14.23 Residential
SJ12 San Jose Santa Clara 37.363318 ‐121.862785 30.0 Yes 54,800 306,601 14.23 Residential
SJ13 San Jose Santa Clara 37.3559467 ‐121.849178 None No 63,500 278,134 26.04 Retail
SJ14 San Jose Santa Clara 37.3532784 ‐121.828054 None No 78,600 278,678 19.37 Commercial
SJ15 San Jose Santa Clara 37.3475829 ‐121.829624 30.0 Yes 39,500 279,392 29.40 Residential
SJ16 San Jose Santa Clara 37.346901 ‐121.829108 30.0 Yes 39,500 279,392 29.40 Residential
SJ17 San Jose Santa Clara 37.3464875 ‐121.828716 30.0 Yes 39,500 279,392 29.40 Residential
SJ18 San Jose Santa Clara 37.3450138 ‐121.827593 30.0 Yes 55,300 281,025 29.68 Residential
SJ19 San Jose Santa Clara 37.3535356 ‐121.823259 7.0 Yes 72,200 282,250 19.56 Retail
SJ20 San Jose Santa Clara 37.3559263 ‐121.819295 7.0 Yes 67,400 280,414 20.46 Retail
SJ21 San Jose Santa Clara 37.35635 ‐121.819027 7.0 Yes 67,300 274,135 19.68 Retail
SJ22 San Jose Santa Clara 37.3501779 ‐121.819488 30.0 No 64,600 286,314 21.92 Residential
SJ23 San Jose Santa Clara 37.3500944 ‐121.819201 30.0 Yes 69,200 286,280 21.79 Residential
SJ24 San Jose Santa Clara 37.3515836 ‐121.814805 22.0 Yes 74,500 282,950 22.53 Residential
SJ25 San Jose Santa Clara 37.3516472 ‐121.812872 30.0 Yes 73,600 281,842 26.26 Residential
SJ26 San Jose Santa Clara 37.3516813 ‐121.81274 30.0 Yes 73,300 281,908 26.46 Residential
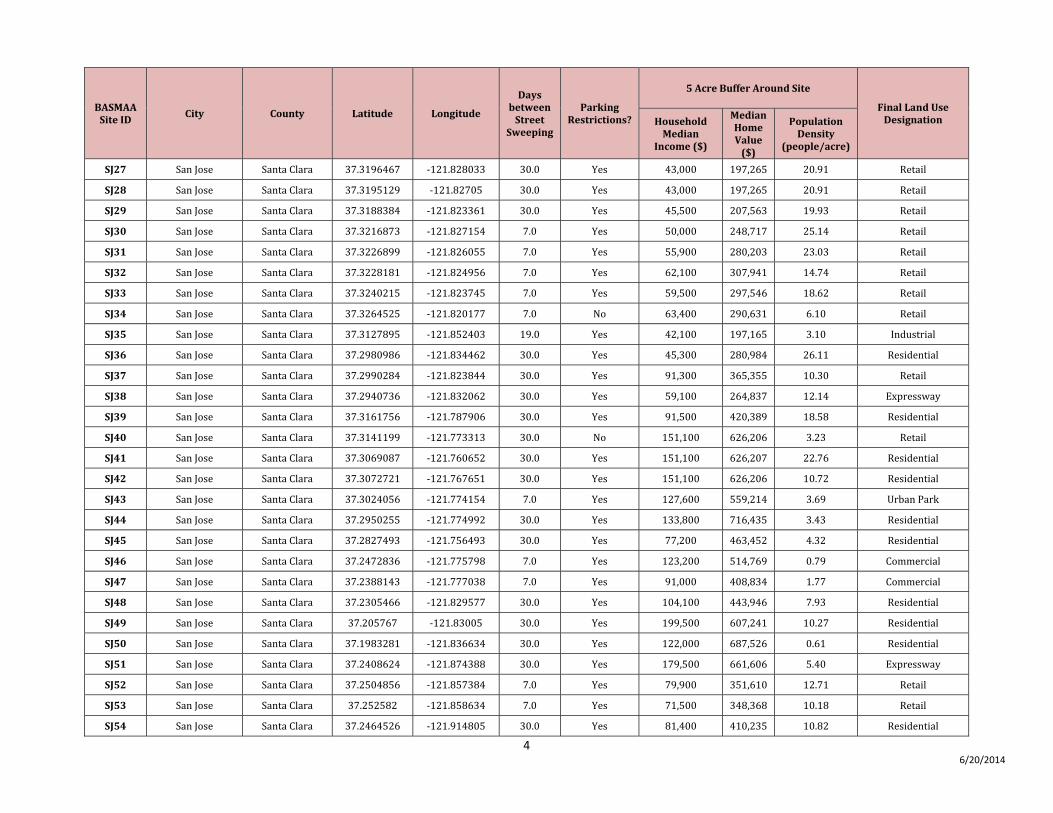
4 6/20/2014
BASMAA Site ID
City County Latitude Longitude
Days between Street
Sweeping
Parking Restrictions?
5 Acre Buffer Around Site
Final Land Use Designation Household
Median Income ($)
Median Home Value ($)
Population Density
(people/acre)
SJ27 San Jose Santa Clara 37.3196467 ‐121.828033 30.0 Yes 43,000 197,265 20.91 Retail
SJ28 San Jose Santa Clara 37.3195129 ‐121.82705 30.0 Yes 43,000 197,265 20.91 Retail
SJ29 San Jose Santa Clara 37.3188384 ‐121.823361 30.0 Yes 45,500 207,563 19.93 Retail
SJ30 San Jose Santa Clara 37.3216873 ‐121.827154 7.0 Yes 50,000 248,717 25.14 Retail
SJ31 San Jose Santa Clara 37.3226899 ‐121.826055 7.0 Yes 55,900 280,203 23.03 Retail
SJ32 San Jose Santa Clara 37.3228181 ‐121.824956 7.0 Yes 62,100 307,941 14.74 Retail
SJ33 San Jose Santa Clara 37.3240215 ‐121.823745 7.0 Yes 59,500 297,546 18.62 Retail
SJ34 San Jose Santa Clara 37.3264525 ‐121.820177 7.0 No 63,400 290,631 6.10 Retail
SJ35 San Jose Santa Clara 37.3127895 ‐121.852403 19.0 Yes 42,100 197,165 3.10 Industrial
SJ36 San Jose Santa Clara 37.2980986 ‐121.834462 30.0 Yes 45,300 280,984 26.11 Residential
SJ37 San Jose Santa Clara 37.2990284 ‐121.823844 30.0 Yes 91,300 365,355 10.30 Retail
SJ38 San Jose Santa Clara 37.2940736 ‐121.832062 30.0 Yes 59,100 264,837 12.14 Expressway
SJ39 San Jose Santa Clara 37.3161756 ‐121.787906 30.0 Yes 91,500 420,389 18.58 Residential
SJ40 San Jose Santa Clara 37.3141199 ‐121.773313 30.0 No 151,100 626,206 3.23 Retail
SJ41 San Jose Santa Clara 37.3069087 ‐121.760652 30.0 Yes 151,100 626,207 22.76 Residential
SJ42 San Jose Santa Clara 37.3072721 ‐121.767651 30.0 Yes 151,100 626,206 10.72 Residential
SJ43 San Jose Santa Clara 37.3024056 ‐121.774154 7.0 Yes 127,600 559,214 3.69 Urban Park
SJ44 San Jose Santa Clara 37.2950255 ‐121.774992 30.0 Yes 133,800 716,435 3.43 Residential
SJ45 San Jose Santa Clara 37.2827493 ‐121.756493 30.0 Yes 77,200 463,452 4.32 Residential
SJ46 San Jose Santa Clara 37.2472836 ‐121.775798 7.0 Yes 123,200 514,769 0.79 Commercial
SJ47 San Jose Santa Clara 37.2388143 ‐121.777038 7.0 Yes 91,000 408,834 1.77 Commercial
SJ48 San Jose Santa Clara 37.2305466 ‐121.829577 30.0 Yes 104,100 443,946 7.93 Residential
SJ49 San Jose Santa Clara 37.205767 ‐121.83005 30.0 Yes 199,500 607,241 10.27 Residential
SJ50 San Jose Santa Clara 37.1983281 ‐121.836634 30.0 Yes 122,000 687,526 0.61 Residential
SJ51 San Jose Santa Clara 37.2408624 ‐121.874388 30.0 Yes 179,500 661,606 5.40 Expressway
SJ52 San Jose Santa Clara 37.2504856 ‐121.857384 7.0 Yes 79,900 351,610 12.71 Retail
SJ53 San Jose Santa Clara 37.252582 ‐121.858634 7.0 Yes 71,500 348,368 10.18 Retail
SJ54 San Jose Santa Clara 37.2464526 ‐121.914805 30.0 Yes 81,400 410,235 10.82 Residential
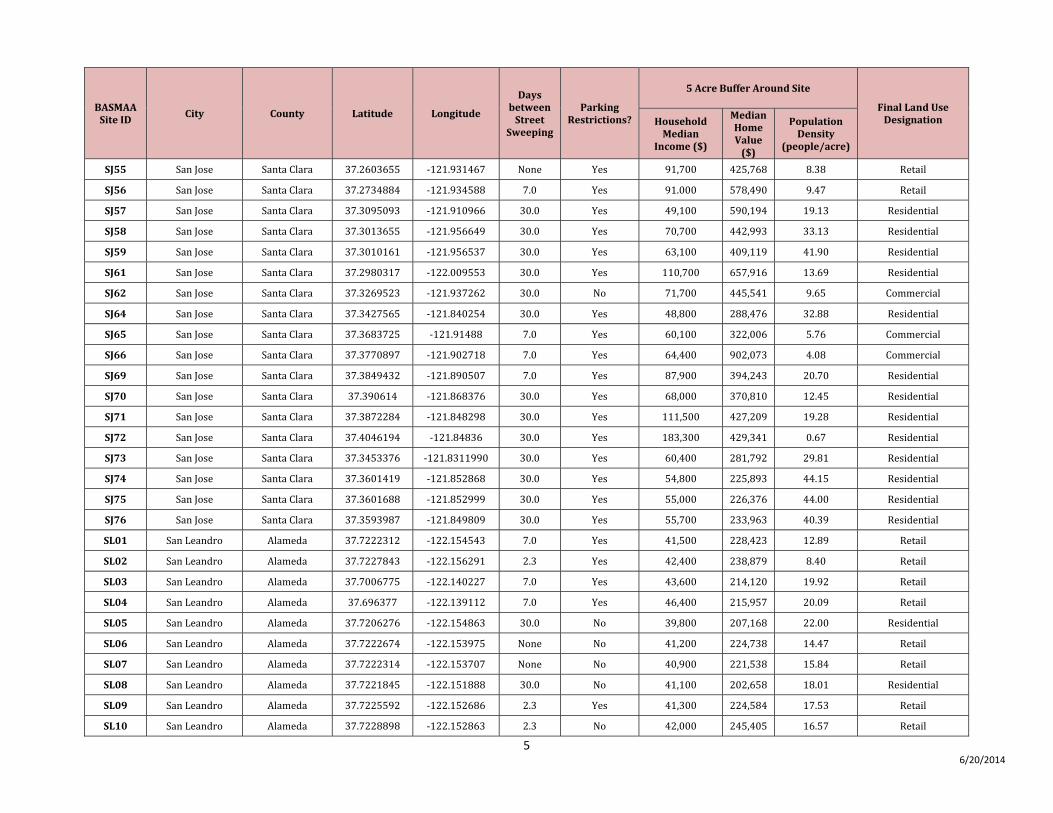
5 6/20/2014
BASMAA Site ID
City County Latitude Longitude
Days between Street
Sweeping
Parking Restrictions?
5 Acre Buffer Around Site
Final Land Use Designation Household
Median Income ($)
Median Home Value ($)
Population Density
(people/acre)
SJ55 San Jose Santa Clara 37.2603655 ‐121.931467 None Yes 91,700 425,768 8.38 Retail
SJ56 San Jose Santa Clara 37.2734884 ‐121.934588 7.0 Yes 91.000 578,490 9.47 Retail
SJ57 San Jose Santa Clara 37.3095093 ‐121.910966 30.0 Yes 49,100 590,194 19.13 Residential
SJ58 San Jose Santa Clara 37.3013655 ‐121.956649 30.0 Yes 70,700 442,993 33.13 Residential
SJ59 San Jose Santa Clara 37.3010161 ‐121.956537 30.0 Yes 63,100 409,119 41.90 Residential
SJ61 San Jose Santa Clara 37.2980317 ‐122.009553 30.0 Yes 110,700 657,916 13.69 Residential
SJ62 San Jose Santa Clara 37.3269523 ‐121.937262 30.0 No 71,700 445,541 9.65 Commercial
SJ64 San Jose Santa Clara 37.3427565 ‐121.840254 30.0 Yes 48,800 288,476 32.88 Residential
SJ65 San Jose Santa Clara 37.3683725 ‐121.91488 7.0 Yes 60,100 322,006 5.76 Commercial
SJ66 San Jose Santa Clara 37.3770897 ‐121.902718 7.0 Yes 64,400 902,073 4.08 Commercial
SJ69 San Jose Santa Clara 37.3849432 ‐121.890507 7.0 Yes 87,900 394,243 20.70 Residential
SJ70 San Jose Santa Clara 37.390614 ‐121.868376 30.0 Yes 68,000 370,810 12.45 Residential
SJ71 San Jose Santa Clara 37.3872284 ‐121.848298 30.0 Yes 111,500 427,209 19.28 Residential
SJ72 San Jose Santa Clara 37.4046194 ‐121.84836 30.0 Yes 183,300 429,341 0.67 Residential
SJ73 San Jose Santa Clara 37.3453376 ‐121.8311990 30.0 Yes 60,400 281,792 29.81 Residential
SJ74 San Jose Santa Clara 37.3601419 ‐121.852868 30.0 Yes 54,800 225,893 44.15 Residential
SJ75 San Jose Santa Clara 37.3601688 ‐121.852999 30.0 Yes 55,000 226,376 44.00 Residential
SJ76 San Jose Santa Clara 37.3593987 ‐121.849809 30.0 Yes 55,700 233,963 40.39 Residential
SL01 San Leandro Alameda 37.7222312 ‐122.154543 7.0 Yes 41,500 228,423 12.89 Retail
SL02 San Leandro Alameda 37.7227843 ‐122.156291 2.3 Yes 42,400 238,879 8.40 Retail
SL03 San Leandro Alameda 37.7006775 ‐122.140227 7.0 Yes 43,600 214,120 19.92 Retail
SL04 San Leandro Alameda 37.696377 ‐122.139112 7.0 Yes 46,400 215,957 20.09 Retail
SL05 San Leandro Alameda 37.7206276 ‐122.154863 30.0 No 39,800 207,168 22.00 Residential
SL06 San Leandro Alameda 37.7222674 ‐122.153975 None No 41,200 224,738 14.47 Retail
SL07 San Leandro Alameda 37.7222314 ‐122.153707 None No 40,900 221,538 15.84 Retail
SL08 San Leandro Alameda 37.7221845 ‐122.151888 30.0 No 41,100 202,658 18.01 Residential
SL09 San Leandro Alameda 37.7225592 ‐122.152686 2.3 Yes 41,300 224,584 17.53 Retail
SL10 San Leandro Alameda 37.7228898 ‐122.152863 2.3 No 42,000 245,405 16.57 Retail
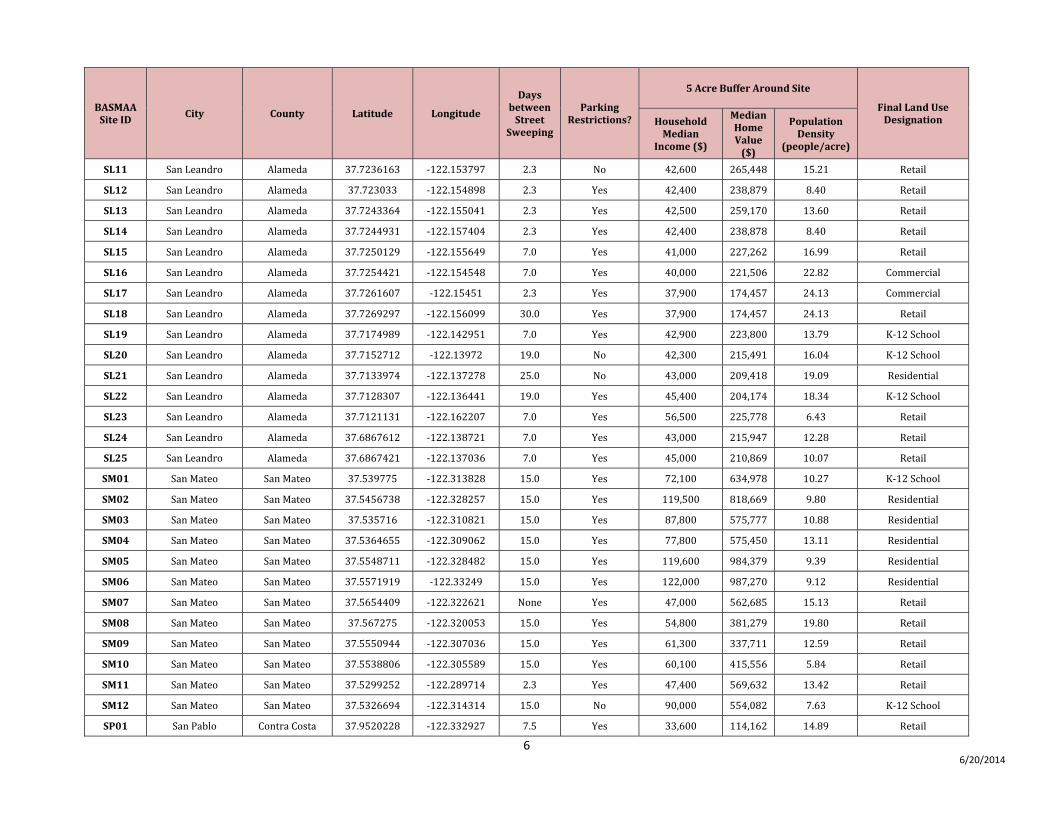
6 6/20/2014
BASMAA Site ID
City County Latitude Longitude
Days between Street
Sweeping
Parking Restrictions?
5 Acre Buffer Around Site
Final Land Use Designation Household
Median Income ($)
Median Home Value ($)
Population Density
(people/acre)
SL11 San Leandro Alameda 37.7236163 ‐122.153797 2.3 No 42,600 265,448 15.21 Retail
SL12 San Leandro Alameda 37.723033 ‐122.154898 2.3 Yes 42,400 238,879 8.40 Retail
SL13 San Leandro Alameda 37.7243364 ‐122.155041 2.3 Yes 42,500 259,170 13.60 Retail
SL14 San Leandro Alameda 37.7244931 ‐122.157404 2.3 Yes 42,400 238,878 8.40 Retail
SL15 San Leandro Alameda 37.7250129 ‐122.155649 7.0 Yes 41,000 227,262 16.99 Retail
SL16 San Leandro Alameda 37.7254421 ‐122.154548 7.0 Yes 40,000 221,506 22.82 Commercial
SL17 San Leandro Alameda 37.7261607 ‐122.15451 2.3 Yes 37,900 174,457 24.13 Commercial
SL18 San Leandro Alameda 37.7269297 ‐122.156099 30.0 Yes 37,900 174,457 24.13 Retail
SL19 San Leandro Alameda 37.7174989 ‐122.142951 7.0 Yes 42,900 223,800 13.79 K‐12 School
SL20 San Leandro Alameda 37.7152712 ‐122.13972 19.0 No 42,300 215,491 16.04 K‐12 School
SL21 San Leandro Alameda 37.7133974 ‐122.137278 25.0 No 43,000 209,418 19.09 Residential
SL22 San Leandro Alameda 37.7128307 ‐122.136441 19.0 Yes 45,400 204,174 18.34 K‐12 School
SL23 San Leandro Alameda 37.7121131 ‐122.162207 7.0 Yes 56,500 225,778 6.43 Retail
SL24 San Leandro Alameda 37.6867612 ‐122.138721 7.0 Yes 43,000 215,947 12.28 Retail
SL25 San Leandro Alameda 37.6867421 ‐122.137036 7.0 Yes 45,000 210,869 10.07 Retail
SM01 San Mateo San Mateo 37.539775 ‐122.313828 15.0 Yes 72,100 634,978 10.27 K‐12 School
SM02 San Mateo San Mateo 37.5456738 ‐122.328257 15.0 Yes 119,500 818,669 9.80 Residential
SM03 San Mateo San Mateo 37.535716 ‐122.310821 15.0 Yes 87,800 575,777 10.88 Residential
SM04 San Mateo San Mateo 37.5364655 ‐122.309062 15.0 Yes 77,800 575,450 13.11 Residential
SM05 San Mateo San Mateo 37.5548711 ‐122.328482 15.0 Yes 119,600 984,379 9.39 Residential
SM06 San Mateo San Mateo 37.5571919 ‐122.33249 15.0 Yes 122,000 987,270 9.12 Residential
SM07 San Mateo San Mateo 37.5654409 ‐122.322621 None Yes 47,000 562,685 15.13 Retail
SM08 San Mateo San Mateo 37.567275 ‐122.320053 15.0 Yes 54,800 381,279 19.80 Retail
SM09 San Mateo San Mateo 37.5550944 ‐122.307036 15.0 Yes 61,300 337,711 12.59 Retail
SM10 San Mateo San Mateo 37.5538806 ‐122.305589 15.0 Yes 60,100 415,556 5.84 Retail
SM11 San Mateo San Mateo 37.5299252 ‐122.289714 2.3 Yes 47,400 569,632 13.42 Retail
SM12 San Mateo San Mateo 37.5326694 ‐122.314314 15.0 No 90,000 554,082 7.63 K‐12 School
SP01 San Pablo Contra Costa 37.9520228 ‐122.332927 7.5 Yes 33,600 114,162 14.89 Retail
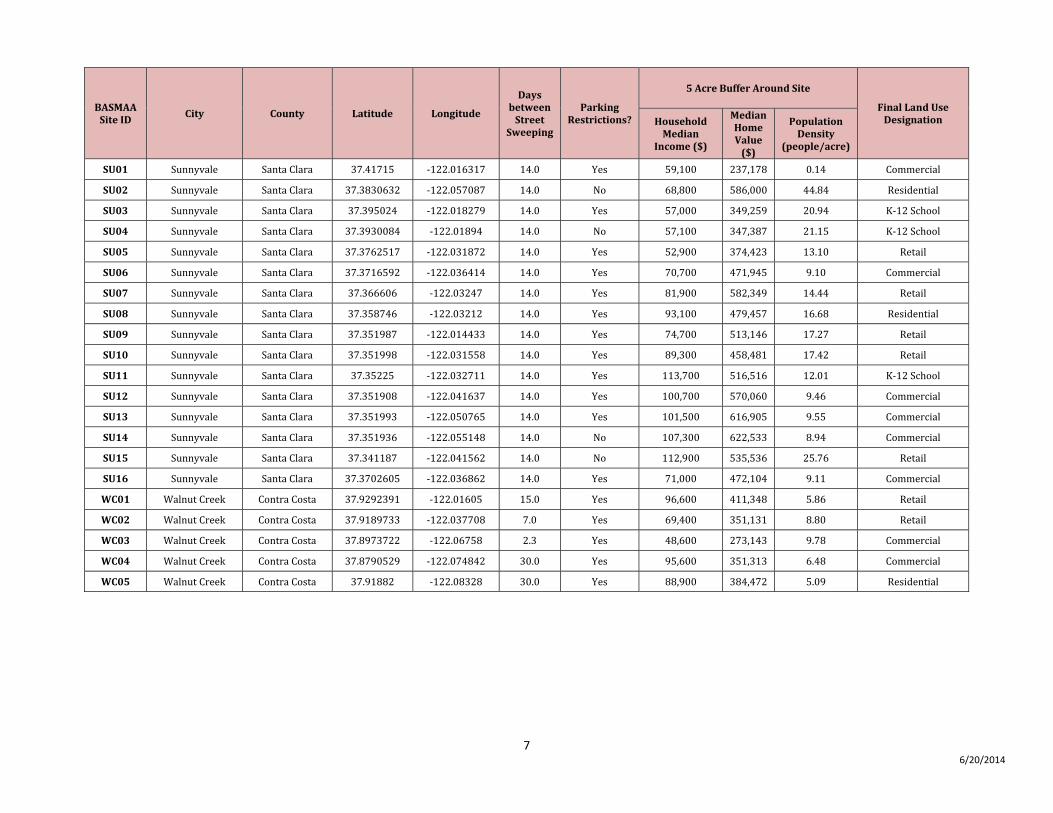
7 6/20/2014
BASMAA Site ID
City County Latitude Longitude
Days between Street
Sweeping
Parking Restrictions?
5 Acre Buffer Around Site
Final Land Use Designation Household
Median Income ($)
Median Home Value ($)
Population Density
(people/acre)
SU01 Sunnyvale Santa Clara 37.41715 ‐122.016317 14.0 Yes 59,100 237,178 0.14 Commercial
SU02 Sunnyvale Santa Clara 37.3830632 ‐122.057087 14.0 No 68,800 586,000 44.84 Residential
SU03 Sunnyvale Santa Clara 37.395024 ‐122.018279 14.0 Yes 57,000 349,259 20.94 K‐12 School
SU04 Sunnyvale Santa Clara 37.3930084 ‐122.01894 14.0 No 57,100 347,387 21.15 K‐12 School
SU05 Sunnyvale Santa Clara 37.3762517 ‐122.031872 14.0 Yes 52,900 374,423 13.10 Retail
SU06 Sunnyvale Santa Clara 37.3716592 ‐122.036414 14.0 Yes 70,700 471,945 9.10 Commercial
SU07 Sunnyvale Santa Clara 37.366606 ‐122.03247 14.0 Yes 81,900 582,349 14.44 Retail
SU08 Sunnyvale Santa Clara 37.358746 ‐122.03212 14.0 Yes 93,100 479,457 16.68 Residential
SU09 Sunnyvale Santa Clara 37.351987 ‐122.014433 14.0 Yes 74,700 513,146 17.27 Retail
SU10 Sunnyvale Santa Clara 37.351998 ‐122.031558 14.0 Yes 89,300 458,481 17.42 Retail
SU11 Sunnyvale Santa Clara 37.35225 ‐122.032711 14.0 Yes 113,700 516,516 12.01 K‐12 School
SU12 Sunnyvale Santa Clara 37.351908 ‐122.041637 14.0 Yes 100,700 570,060 9.46 Commercial
SU13 Sunnyvale Santa Clara 37.351993 ‐122.050765 14.0 Yes 101,500 616,905 9.55 Commercial
SU14 Sunnyvale Santa Clara 37.351936 ‐122.055148 14.0 No 107,300 622,533 8.94 Commercial
SU15 Sunnyvale Santa Clara 37.341187 ‐122.041562 14.0 No 112,900 535,536 25.76 Retail
SU16 Sunnyvale Santa Clara 37.3702605 ‐122.036862 14.0 Yes 71,000 472,104 9.11 Commercial
WC01 Walnut Creek Contra Costa 37.9292391 ‐122.01605 15.0 Yes 96,600 411,348 5.86 Retail
WC02 Walnut Creek Contra Costa 37.9189733 ‐122.037708 7.0 Yes 69,400 351,131 8.80 Retail
WC03 Walnut Creek Contra Costa 37.8973722 ‐122.06758 2.3 Yes 48,600 273,143 9.78 Commercial
WC04 Walnut Creek Contra Costa 37.8790529 ‐122.074842 30.0 Yes 95,600 351,313 6.48 Commercial
WC05 Walnut Creek Contra Costa 37.91882 ‐122.08328 30.0 Yes 88,900 384,472 5.09 Residential
B‐1 6/20/2014
APPENDIX B
QUALITY ASSURANCE
RELATIVE PERCENT REDUCTION CALCULATIONS
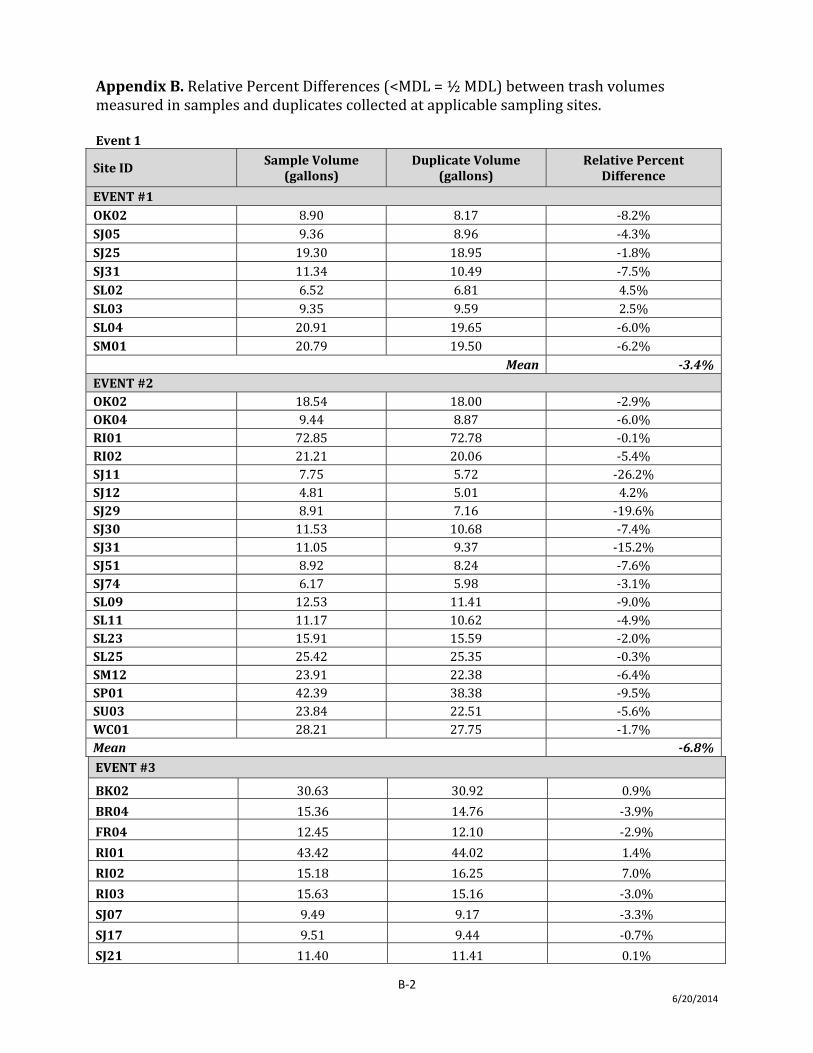
B‐2 6/20/2014
Appendix B. Relative Percent Differences (<MDL = ½ MDL) between trash volumes measured in samples and duplicates collected at applicable sampling sites. Event 1
Site ID Sample Volume
(gallons) Duplicate Volume
(gallons) Relative Percent
Difference
EVENT #1 OK02 8.90 8.17 ‐8.2% SJ05 9.36 8.96 ‐4.3% SJ25 19.30 18.95 ‐1.8% SJ31 11.34 10.49 ‐7.5% SL02 6.52 6.81 4.5% SL03 9.35 9.59 2.5% SL04 20.91 19.65 ‐6.0% SM01 20.79 19.50 ‐6.2%
Mean 3.4%EVENT #2 OK02 18.54 18.00 ‐2.9% OK04 9.44 8.87 ‐6.0% RI01 72.85 72.78 ‐0.1% RI02 21.21 20.06 ‐5.4% SJ11 7.75 5.72 ‐26.2% SJ12 4.81 5.01 4.2% SJ29 8.91 7.16 ‐19.6% SJ30 11.53 10.68 ‐7.4% SJ31 11.05 9.37 ‐15.2% SJ51 8.92 8.24 ‐7.6% SJ74 6.17 5.98 ‐3.1% SL09 12.53 11.41 ‐9.0% SL11 11.17 10.62 ‐4.9% SL23 15.91 15.59 ‐2.0% SL25 25.42 25.35 ‐0.3% SM12 23.91 22.38 ‐6.4% SP01 42.39 38.38 ‐9.5% SU03 23.84 22.51 ‐5.6% WC01 28.21 27.75 ‐1.7% Mean 6.8%
EVENT #3
BK02 30.63 30.92 0.9%
BR04 15.36 14.76 ‐3.9%
FR04 12.45 12.10 ‐2.9%
RI01 43.42 44.02 1.4%
RI02 15.18 16.25 7.0%
RI03 15.63 15.16 ‐3.0%
SJ07 9.49 9.17 ‐3.3%
SJ17 9.51 9.44 ‐0.7%
SJ21 11.40 11.41 0.1%
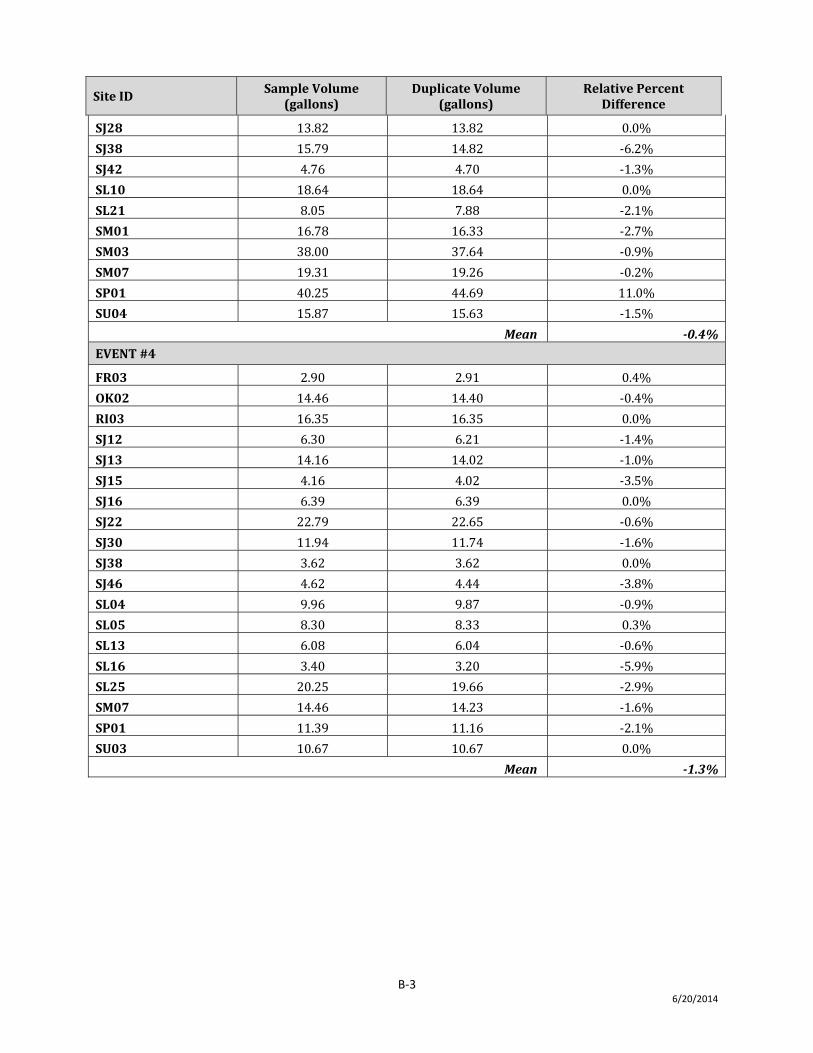
B‐3 6/20/2014
Site ID Sample Volume
(gallons) Duplicate Volume
(gallons) Relative Percent
Difference
SJ28 13.82 13.82 0.0%
SJ38 15.79 14.82 ‐6.2%
SJ42 4.76 4.70 ‐1.3%
SL10 18.64 18.64 0.0%
SL21 8.05 7.88 ‐2.1%
SM01 16.78 16.33 ‐2.7%
SM03 38.00 37.64 ‐0.9%
SM07 19.31 19.26 ‐0.2%
SP01 40.25 44.69 11.0%
SU04 15.87 15.63 ‐1.5%
Mean 0.4%
EVENT #4
FR03 2.90 2.91 0.4%
OK02 14.46 14.40 ‐0.4%
RI03 16.35 16.35 0.0%
SJ12 6.30 6.21 ‐1.4%
SJ13 14.16 14.02 ‐1.0%
SJ15 4.16 4.02 ‐3.5%
SJ16 6.39 6.39 0.0%
SJ22 22.79 22.65 ‐0.6%
SJ30 11.94 11.74 ‐1.6%
SJ38 3.62 3.62 0.0%
SJ46 4.62 4.44 ‐3.8%
SL04 9.96 9.87 ‐0.9%
SL05 8.30 8.33 0.3%
SL13 6.08 6.04 ‐0.6%
SL16 3.40 3.20 ‐5.9%
SL25 20.25 19.66 ‐2.9%
SM07 14.46 14.23 ‐1.6%
SP01 11.39 11.16 ‐2.1%
SU03 10.67 10.67 0.0%
Mean 1.3%
C‐1 6/20/2014
APPENDIX C
MONITORING RESULTS BY EVENT AND SITE
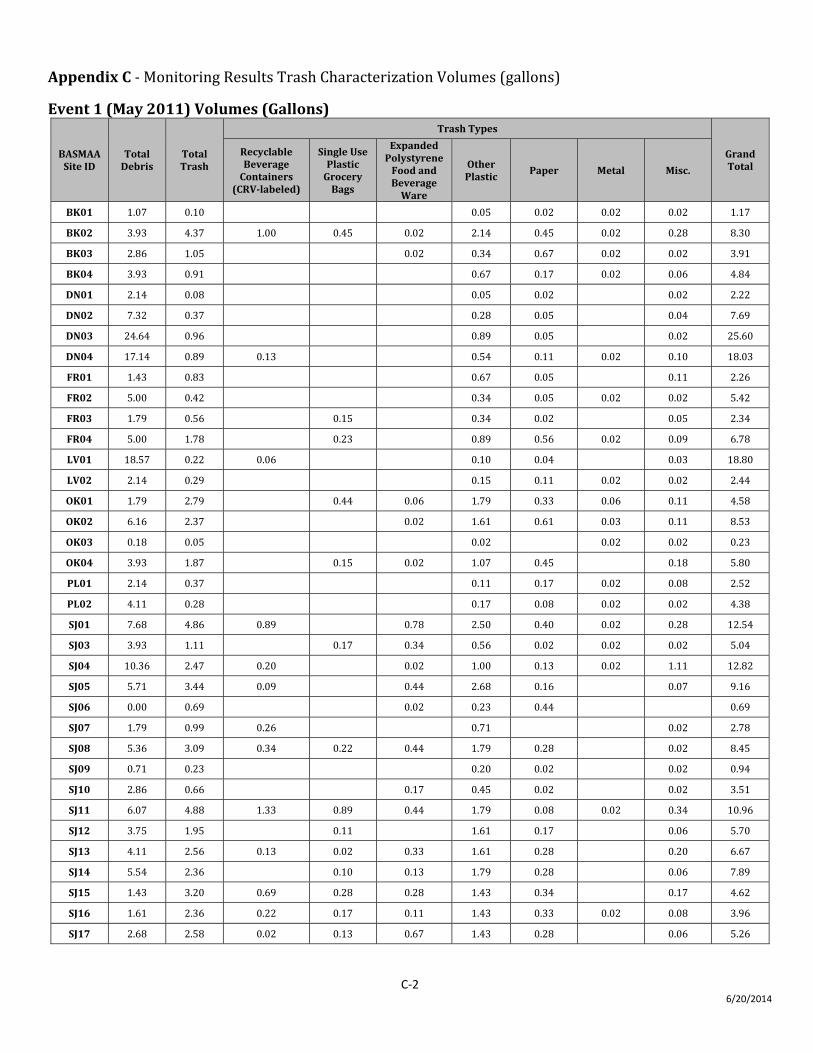
C‐2 6/20/2014
Appendix C ‐ Monitoring Results Trash Characterization Volumes (gallons)
Event 1 (May 2011) Volumes (Gallons)
BASMAA Site ID
Total Debris
Total Trash
Trash Types
Grand Total
Recyclable Beverage Containers
(CRVlabeled)
Single Use Plastic Grocery Bags
Expanded Polystyrene Food and Beverage Ware
Other Plastic
Paper Metal Misc.
BK01 1.07 0.10 0.05 0.02 0.02 0.02 1.17
BK02 3.93 4.37 1.00 0.45 0.02 2.14 0.45 0.02 0.28 8.30
BK03 2.86 1.05 0.02 0.34 0.67 0.02 0.02 3.91
BK04 3.93 0.91 0.67 0.17 0.02 0.06 4.84
DN01 2.14 0.08 0.05 0.02 0.02 2.22
DN02 7.32 0.37 0.28 0.05 0.04 7.69
DN03 24.64 0.96 0.89 0.05 0.02 25.60
DN04 17.14 0.89 0.13 0.54 0.11 0.02 0.10 18.03
FR01 1.43 0.83 0.67 0.05 0.11 2.26
FR02 5.00 0.42 0.34 0.05 0.02 0.02 5.42
FR03 1.79 0.56 0.15 0.34 0.02 0.05 2.34
FR04 5.00 1.78 0.23 0.89 0.56 0.02 0.09 6.78
LV01 18.57 0.22 0.06 0.10 0.04 0.03 18.80
LV02 2.14 0.29 0.15 0.11 0.02 0.02 2.44
OK01 1.79 2.79 0.44 0.06 1.79 0.33 0.06 0.11 4.58
OK02 6.16 2.37 0.02 1.61 0.61 0.03 0.11 8.53
OK03 0.18 0.05 0.02 0.02 0.02 0.23
OK04 3.93 1.87 0.15 0.02 1.07 0.45 0.18 5.80
PL01 2.14 0.37 0.11 0.17 0.02 0.08 2.52
PL02 4.11 0.28 0.17 0.08 0.02 0.02 4.38
SJ01 7.68 4.86 0.89 0.78 2.50 0.40 0.02 0.28 12.54
SJ03 3.93 1.11 0.17 0.34 0.56 0.02 0.02 0.02 5.04
SJ04 10.36 2.47 0.20 0.02 1.00 0.13 0.02 1.11 12.82
SJ05 5.71 3.44 0.09 0.44 2.68 0.16 0.07 9.16
SJ06 0.00 0.69 0.02 0.23 0.44 0.69
SJ07 1.79 0.99 0.26 0.71 0.02 2.78
SJ08 5.36 3.09 0.34 0.22 0.44 1.79 0.28 0.02 8.45
SJ09 0.71 0.23 0.20 0.02 0.02 0.94
SJ10 2.86 0.66 0.17 0.45 0.02 0.02 3.51
SJ11 6.07 4.88 1.33 0.89 0.44 1.79 0.08 0.02 0.34 10.96
SJ12 3.75 1.95 0.11 1.61 0.17 0.06 5.70
SJ13 4.11 2.56 0.13 0.02 0.33 1.61 0.28 0.20 6.67
SJ14 5.54 2.36 0.10 0.13 1.79 0.28 0.06 7.89
SJ15 1.43 3.20 0.69 0.28 0.28 1.43 0.34 0.17 4.62
SJ16 1.61 2.36 0.22 0.17 0.11 1.43 0.33 0.02 0.08 3.96
SJ17 2.68 2.58 0.02 0.13 0.67 1.43 0.28 0.06 5.26
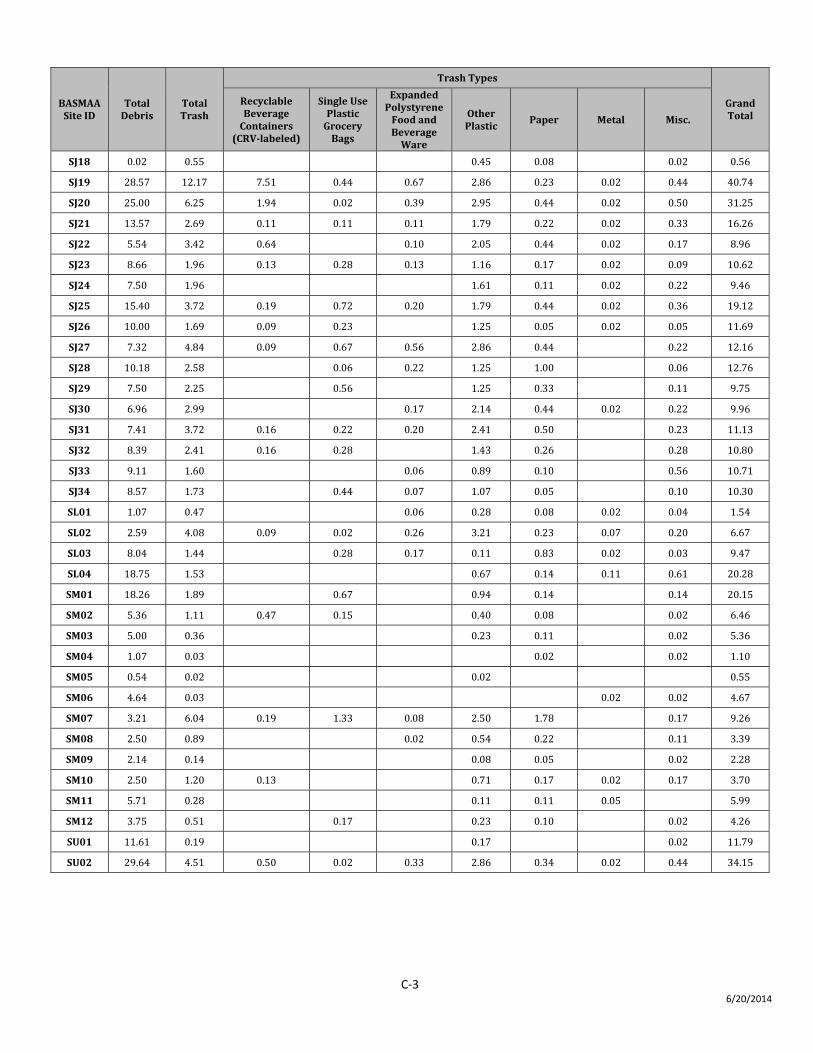
C‐3 6/20/2014
BASMAA Site ID
Total Debris
Total Trash
Trash Types
Grand Total
Recyclable Beverage Containers
(CRVlabeled)
Single Use Plastic Grocery Bags
Expanded Polystyrene Food and Beverage Ware
Other Plastic
Paper Metal Misc.
SJ18 0.02 0.55 0.45 0.08 0.02 0.56
SJ19 28.57 12.17 7.51 0.44 0.67 2.86 0.23 0.02 0.44 40.74
SJ20 25.00 6.25 1.94 0.02 0.39 2.95 0.44 0.02 0.50 31.25
SJ21 13.57 2.69 0.11 0.11 0.11 1.79 0.22 0.02 0.33 16.26
SJ22 5.54 3.42 0.64 0.10 2.05 0.44 0.02 0.17 8.96
SJ23 8.66 1.96 0.13 0.28 0.13 1.16 0.17 0.02 0.09 10.62
SJ24 7.50 1.96 1.61 0.11 0.02 0.22 9.46
SJ25 15.40 3.72 0.19 0.72 0.20 1.79 0.44 0.02 0.36 19.12
SJ26 10.00 1.69 0.09 0.23 1.25 0.05 0.02 0.05 11.69
SJ27 7.32 4.84 0.09 0.67 0.56 2.86 0.44 0.22 12.16
SJ28 10.18 2.58 0.06 0.22 1.25 1.00 0.06 12.76
SJ29 7.50 2.25 0.56 1.25 0.33 0.11 9.75
SJ30 6.96 2.99 0.17 2.14 0.44 0.02 0.22 9.96
SJ31 7.41 3.72 0.16 0.22 0.20 2.41 0.50 0.23 11.13
SJ32 8.39 2.41 0.16 0.28 1.43 0.26 0.28 10.80
SJ33 9.11 1.60 0.06 0.89 0.10 0.56 10.71
SJ34 8.57 1.73 0.44 0.07 1.07 0.05 0.10 10.30
SL01 1.07 0.47 0.06 0.28 0.08 0.02 0.04 1.54
SL02 2.59 4.08 0.09 0.02 0.26 3.21 0.23 0.07 0.20 6.67
SL03 8.04 1.44 0.28 0.17 0.11 0.83 0.02 0.03 9.47
SL04 18.75 1.53 0.67 0.14 0.11 0.61 20.28
SM01 18.26 1.89 0.67 0.94 0.14 0.14 20.15
SM02 5.36 1.11 0.47 0.15 0.40 0.08 0.02 6.46
SM03 5.00 0.36 0.23 0.11 0.02 5.36
SM04 1.07 0.03 0.02 0.02 1.10
SM05 0.54 0.02 0.02 0.55
SM06 4.64 0.03 0.02 0.02 4.67
SM07 3.21 6.04 0.19 1.33 0.08 2.50 1.78 0.17 9.26
SM08 2.50 0.89 0.02 0.54 0.22 0.11 3.39
SM09 2.14 0.14 0.08 0.05 0.02 2.28
SM10 2.50 1.20 0.13 0.71 0.17 0.02 0.17 3.70
SM11 5.71 0.28 0.11 0.11 0.05 5.99
SM12 3.75 0.51 0.17 0.23 0.10 0.02 4.26
SU01 11.61 0.19 0.17 0.02 11.79
SU02 29.64 4.51 0.50 0.02 0.33 2.86 0.34 0.02 0.44 34.15
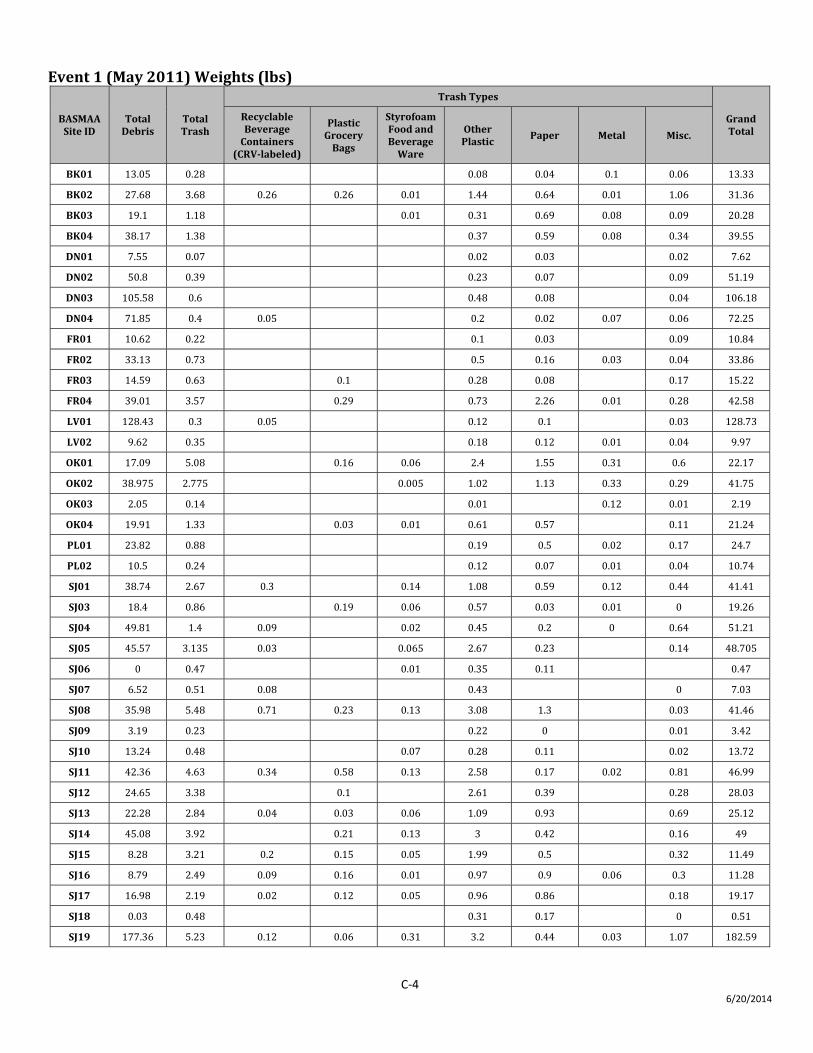
C‐4 6/20/2014
Event 1 (May 2011) Weights (lbs)
BASMAA Site ID
Total Debris
Total Trash
Trash Types
Grand Total
Recyclable Beverage Containers
(CRVlabeled)
Plastic Grocery Bags
Styrofoam Food and Beverage Ware
Other Plastic
Paper Metal Misc.
BK01 13.05 0.28 0.08 0.04 0.1 0.06 13.33
BK02 27.68 3.68 0.26 0.26 0.01 1.44 0.64 0.01 1.06 31.36
BK03 19.1 1.18 0.01 0.31 0.69 0.08 0.09 20.28
BK04 38.17 1.38 0.37 0.59 0.08 0.34 39.55
DN01 7.55 0.07 0.02 0.03 0.02 7.62
DN02 50.8 0.39 0.23 0.07 0.09 51.19
DN03 105.58 0.6 0.48 0.08 0.04 106.18
DN04 71.85 0.4 0.05 0.2 0.02 0.07 0.06 72.25
FR01 10.62 0.22 0.1 0.03 0.09 10.84
FR02 33.13 0.73 0.5 0.16 0.03 0.04 33.86
FR03 14.59 0.63 0.1 0.28 0.08 0.17 15.22
FR04 39.01 3.57 0.29 0.73 2.26 0.01 0.28 42.58
LV01 128.43 0.3 0.05 0.12 0.1 0.03 128.73
LV02 9.62 0.35 0.18 0.12 0.01 0.04 9.97
OK01 17.09 5.08 0.16 0.06 2.4 1.55 0.31 0.6 22.17
OK02 38.975 2.775 0.005 1.02 1.13 0.33 0.29 41.75
OK03 2.05 0.14 0.01 0.12 0.01 2.19
OK04 19.91 1.33 0.03 0.01 0.61 0.57 0.11 21.24
PL01 23.82 0.88 0.19 0.5 0.02 0.17 24.7
PL02 10.5 0.24 0.12 0.07 0.01 0.04 10.74
SJ01 38.74 2.67 0.3 0.14 1.08 0.59 0.12 0.44 41.41
SJ03 18.4 0.86 0.19 0.06 0.57 0.03 0.01 0 19.26
SJ04 49.81 1.4 0.09 0.02 0.45 0.2 0 0.64 51.21
SJ05 45.57 3.135 0.03 0.065 2.67 0.23 0.14 48.705
SJ06 0 0.47 0.01 0.35 0.11 0.47
SJ07 6.52 0.51 0.08 0.43 0 7.03
SJ08 35.98 5.48 0.71 0.23 0.13 3.08 1.3 0.03 41.46
SJ09 3.19 0.23 0.22 0 0.01 3.42
SJ10 13.24 0.48 0.07 0.28 0.11 0.02 13.72
SJ11 42.36 4.63 0.34 0.58 0.13 2.58 0.17 0.02 0.81 46.99
SJ12 24.65 3.38 0.1 2.61 0.39 0.28 28.03
SJ13 22.28 2.84 0.04 0.03 0.06 1.09 0.93 0.69 25.12
SJ14 45.08 3.92 0.21 0.13 3 0.42 0.16 49
SJ15 8.28 3.21 0.2 0.15 0.05 1.99 0.5 0.32 11.49
SJ16 8.79 2.49 0.09 0.16 0.01 0.97 0.9 0.06 0.3 11.28
SJ17 16.98 2.19 0.02 0.12 0.05 0.96 0.86 0.18 19.17
SJ18 0.03 0.48 0.31 0.17 0 0.51
SJ19 177.36 5.23 0.12 0.06 0.31 3.2 0.44 0.03 1.07 182.59
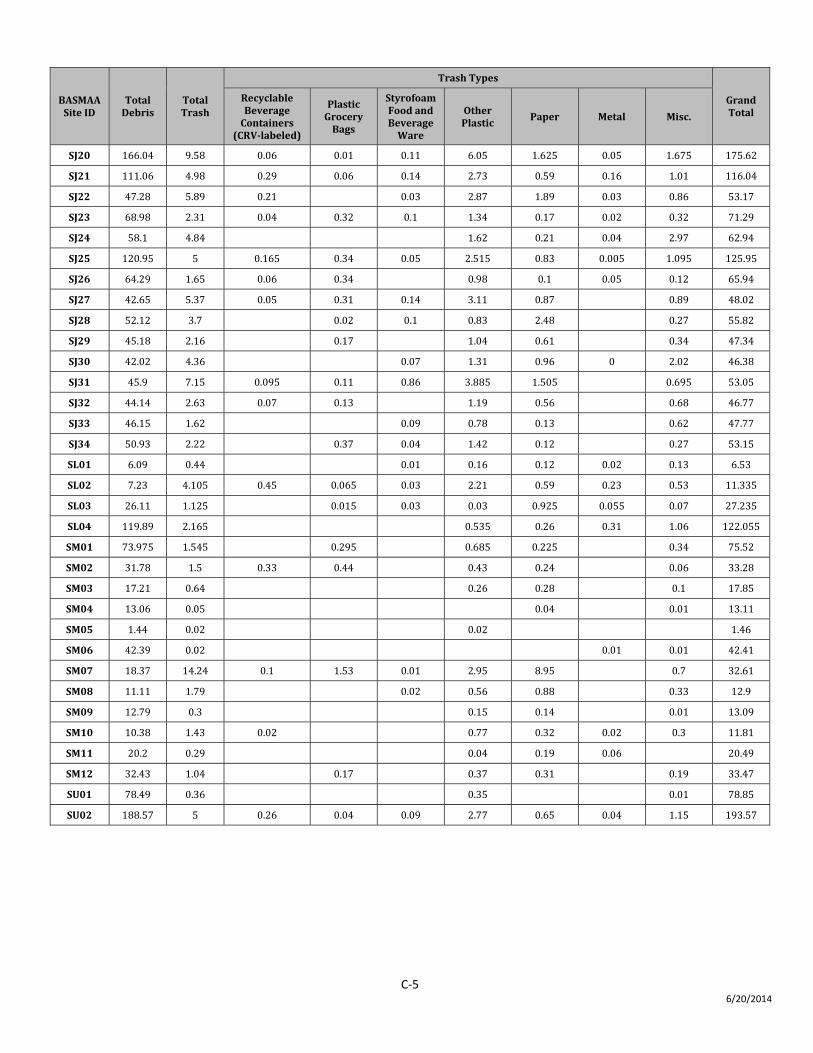
C‐5 6/20/2014
BASMAA Site ID
Total Debris
Total Trash
Trash Types
Grand Total
Recyclable Beverage Containers
(CRVlabeled)
Plastic Grocery Bags
Styrofoam Food and Beverage Ware
Other Plastic
Paper Metal Misc.
SJ20 166.04 9.58 0.06 0.01 0.11 6.05 1.625 0.05 1.675 175.62
SJ21 111.06 4.98 0.29 0.06 0.14 2.73 0.59 0.16 1.01 116.04
SJ22 47.28 5.89 0.21 0.03 2.87 1.89 0.03 0.86 53.17
SJ23 68.98 2.31 0.04 0.32 0.1 1.34 0.17 0.02 0.32 71.29
SJ24 58.1 4.84 1.62 0.21 0.04 2.97 62.94
SJ25 120.95 5 0.165 0.34 0.05 2.515 0.83 0.005 1.095 125.95
SJ26 64.29 1.65 0.06 0.34 0.98 0.1 0.05 0.12 65.94
SJ27 42.65 5.37 0.05 0.31 0.14 3.11 0.87 0.89 48.02
SJ28 52.12 3.7 0.02 0.1 0.83 2.48 0.27 55.82
SJ29 45.18 2.16 0.17 1.04 0.61 0.34 47.34
SJ30 42.02 4.36 0.07 1.31 0.96 0 2.02 46.38
SJ31 45.9 7.15 0.095 0.11 0.86 3.885 1.505 0.695 53.05
SJ32 44.14 2.63 0.07 0.13 1.19 0.56 0.68 46.77
SJ33 46.15 1.62 0.09 0.78 0.13 0.62 47.77
SJ34 50.93 2.22 0.37 0.04 1.42 0.12 0.27 53.15
SL01 6.09 0.44 0.01 0.16 0.12 0.02 0.13 6.53
SL02 7.23 4.105 0.45 0.065 0.03 2.21 0.59 0.23 0.53 11.335
SL03 26.11 1.125 0.015 0.03 0.03 0.925 0.055 0.07 27.235
SL04 119.89 2.165 0.535 0.26 0.31 1.06 122.055
SM01 73.975 1.545 0.295 0.685 0.225 0.34 75.52
SM02 31.78 1.5 0.33 0.44 0.43 0.24 0.06 33.28
SM03 17.21 0.64 0.26 0.28 0.1 17.85
SM04 13.06 0.05 0.04 0.01 13.11
SM05 1.44 0.02 0.02 1.46
SM06 42.39 0.02 0.01 0.01 42.41
SM07 18.37 14.24 0.1 1.53 0.01 2.95 8.95 0.7 32.61
SM08 11.11 1.79 0.02 0.56 0.88 0.33 12.9
SM09 12.79 0.3 0.15 0.14 0.01 13.09
SM10 10.38 1.43 0.02 0.77 0.32 0.02 0.3 11.81
SM11 20.2 0.29 0.04 0.19 0.06 20.49
SM12 32.43 1.04 0.17 0.37 0.31 0.19 33.47
SU01 78.49 0.36 0.35 0.01 78.85
SU02 188.57 5 0.26 0.04 0.09 2.77 0.65 0.04 1.15 193.57
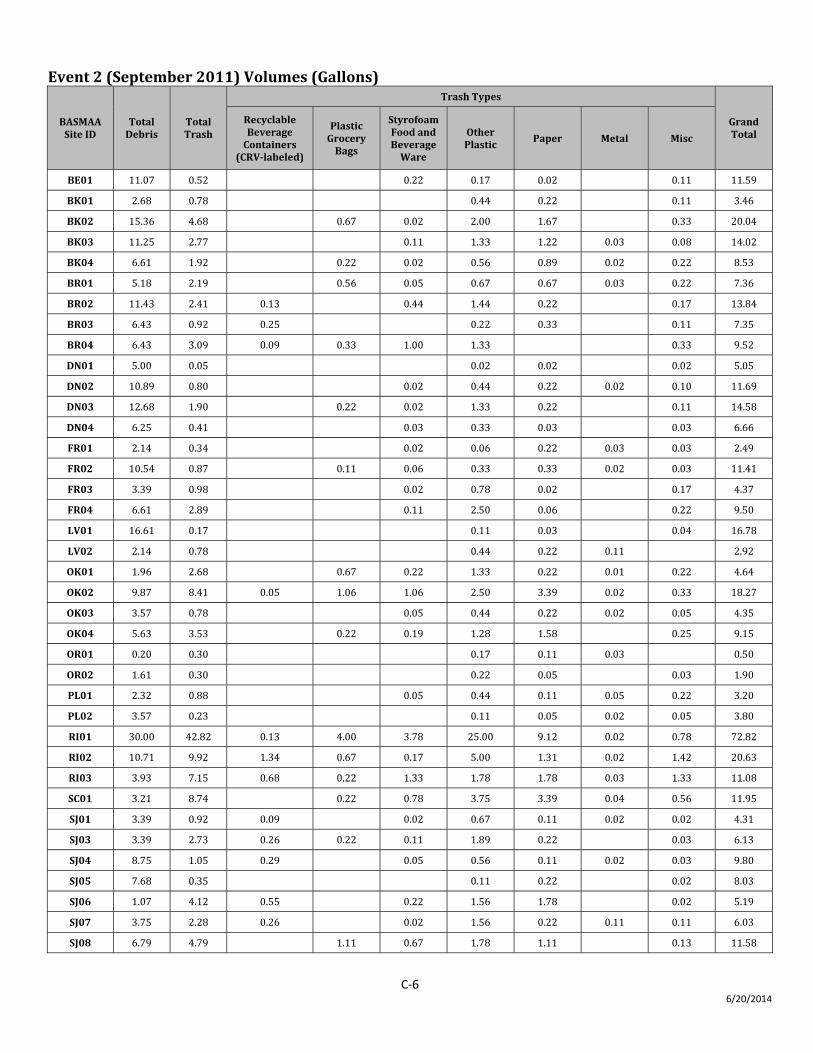
C‐6 6/20/2014
Event 2 (September 2011) Volumes (Gallons)
BASMAA Site ID
Total Debris
Total Trash
Trash Types
Grand Total
Recyclable Beverage Containers
(CRVlabeled)
Plastic Grocery Bags
Styrofoam Food and Beverage Ware
Other Plastic
Paper Metal Misc
BE01 11.07 0.52 0.22 0.17 0.02 0.11 11.59
BK01 2.68 0.78 0.44 0.22 0.11 3.46
BK02 15.36 4.68 0.67 0.02 2.00 1.67 0.33 20.04
BK03 11.25 2.77 0.11 1.33 1.22 0.03 0.08 14.02
BK04 6.61 1.92 0.22 0.02 0.56 0.89 0.02 0.22 8.53
BR01 5.18 2.19 0.56 0.05 0.67 0.67 0.03 0.22 7.36
BR02 11.43 2.41 0.13 0.44 1.44 0.22 0.17 13.84
BR03 6.43 0.92 0.25 0.22 0.33 0.11 7.35
BR04 6.43 3.09 0.09 0.33 1.00 1.33 0.33 9.52
DN01 5.00 0.05 0.02 0.02 0.02 5.05
DN02 10.89 0.80 0.02 0.44 0.22 0.02 0.10 11.69
DN03 12.68 1.90 0.22 0.02 1.33 0.22 0.11 14.58
DN04 6.25 0.41 0.03 0.33 0.03 0.03 6.66
FR01 2.14 0.34 0.02 0.06 0.22 0.03 0.03 2.49
FR02 10.54 0.87 0.11 0.06 0.33 0.33 0.02 0.03 11.41
FR03 3.39 0.98 0.02 0.78 0.02 0.17 4.37
FR04 6.61 2.89 0.11 2.50 0.06 0.22 9.50
LV01 16.61 0.17 0.11 0.03 0.04 16.78
LV02 2.14 0.78 0.44 0.22 0.11 2.92
OK01 1.96 2.68 0.67 0.22 1.33 0.22 0.01 0.22 4.64
OK02 9.87 8.41 0.05 1.06 1.06 2.50 3.39 0.02 0.33 18.27
OK03 3.57 0.78 0.05 0.44 0.22 0.02 0.05 4.35
OK04 5.63 3.53 0.22 0.19 1.28 1.58 0.25 9.15
OR01 0.20 0.30 0.17 0.11 0.03 0.50
OR02 1.61 0.30 0.22 0.05 0.03 1.90
PL01 2.32 0.88 0.05 0.44 0.11 0.05 0.22 3.20
PL02 3.57 0.23 0.11 0.05 0.02 0.05 3.80
RI01 30.00 42.82 0.13 4.00 3.78 25.00 9.12 0.02 0.78 72.82
RI02 10.71 9.92 1.34 0.67 0.17 5.00 1.31 0.02 1.42 20.63
RI03 3.93 7.15 0.68 0.22 1.33 1.78 1.78 0.03 1.33 11.08
SC01 3.21 8.74 0.22 0.78 3.75 3.39 0.04 0.56 11.95
SJ01 3.39 0.92 0.09 0.02 0.67 0.11 0.02 0.02 4.31
SJ03 3.39 2.73 0.26 0.22 0.11 1.89 0.22 0.03 6.13
SJ04 8.75 1.05 0.29 0.05 0.56 0.11 0.02 0.03 9.80
SJ05 7.68 0.35 0.11 0.22 0.02 8.03
SJ06 1.07 4.12 0.55 0.22 1.56 1.78 0.02 5.19
SJ07 3.75 2.28 0.26 0.02 1.56 0.22 0.11 0.11 6.03
SJ08 6.79 4.79 1.11 0.67 1.78 1.11 0.13 11.58
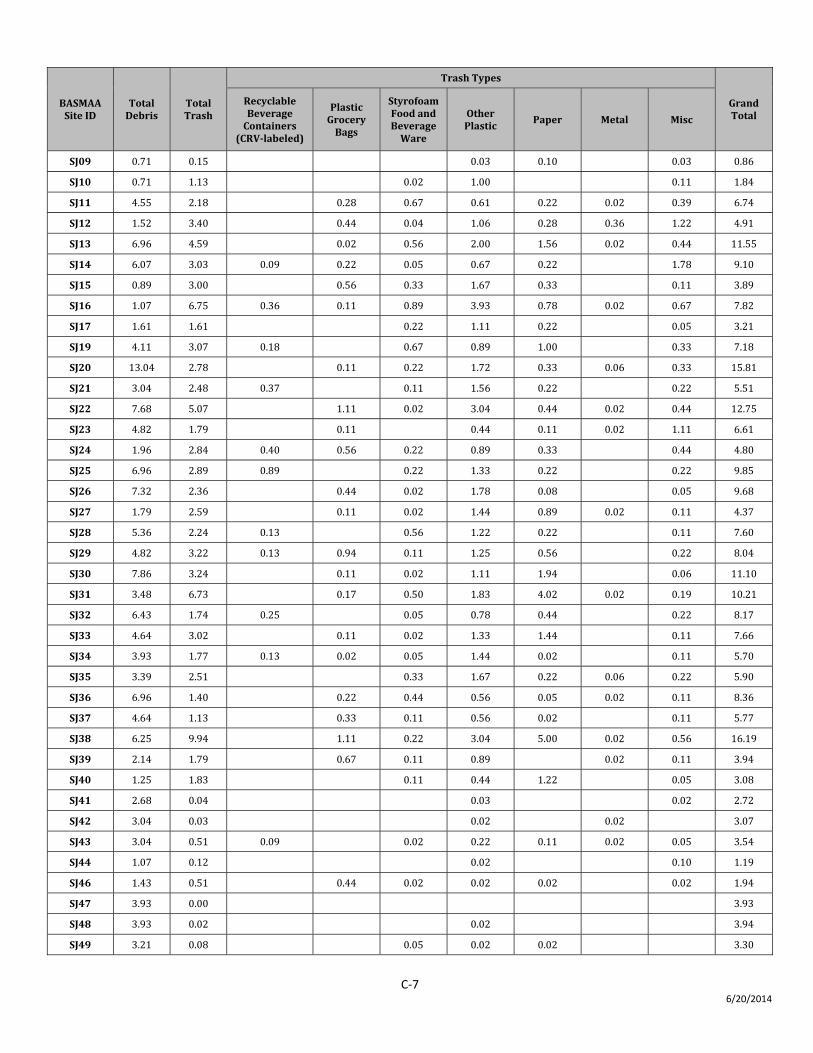
C‐7 6/20/2014
BASMAA Site ID
Total Debris
Total Trash
Trash Types
Grand Total
Recyclable Beverage Containers
(CRVlabeled)
Plastic Grocery Bags
Styrofoam Food and Beverage Ware
Other Plastic
Paper Metal Misc
SJ09 0.71 0.15 0.03 0.10 0.03 0.86
SJ10 0.71 1.13 0.02 1.00 0.11 1.84
SJ11 4.55 2.18 0.28 0.67 0.61 0.22 0.02 0.39 6.74
SJ12 1.52 3.40 0.44 0.04 1.06 0.28 0.36 1.22 4.91
SJ13 6.96 4.59 0.02 0.56 2.00 1.56 0.02 0.44 11.55
SJ14 6.07 3.03 0.09 0.22 0.05 0.67 0.22 1.78 9.10
SJ15 0.89 3.00 0.56 0.33 1.67 0.33 0.11 3.89
SJ16 1.07 6.75 0.36 0.11 0.89 3.93 0.78 0.02 0.67 7.82
SJ17 1.61 1.61 0.22 1.11 0.22 0.05 3.21
SJ19 4.11 3.07 0.18 0.67 0.89 1.00 0.33 7.18
SJ20 13.04 2.78 0.11 0.22 1.72 0.33 0.06 0.33 15.81
SJ21 3.04 2.48 0.37 0.11 1.56 0.22 0.22 5.51
SJ22 7.68 5.07 1.11 0.02 3.04 0.44 0.02 0.44 12.75
SJ23 4.82 1.79 0.11 0.44 0.11 0.02 1.11 6.61
SJ24 1.96 2.84 0.40 0.56 0.22 0.89 0.33 0.44 4.80
SJ25 6.96 2.89 0.89 0.22 1.33 0.22 0.22 9.85
SJ26 7.32 2.36 0.44 0.02 1.78 0.08 0.05 9.68
SJ27 1.79 2.59 0.11 0.02 1.44 0.89 0.02 0.11 4.37
SJ28 5.36 2.24 0.13 0.56 1.22 0.22 0.11 7.60
SJ29 4.82 3.22 0.13 0.94 0.11 1.25 0.56 0.22 8.04
SJ30 7.86 3.24 0.11 0.02 1.11 1.94 0.06 11.10
SJ31 3.48 6.73 0.17 0.50 1.83 4.02 0.02 0.19 10.21
SJ32 6.43 1.74 0.25 0.05 0.78 0.44 0.22 8.17
SJ33 4.64 3.02 0.11 0.02 1.33 1.44 0.11 7.66
SJ34 3.93 1.77 0.13 0.02 0.05 1.44 0.02 0.11 5.70
SJ35 3.39 2.51 0.33 1.67 0.22 0.06 0.22 5.90
SJ36 6.96 1.40 0.22 0.44 0.56 0.05 0.02 0.11 8.36
SJ37 4.64 1.13 0.33 0.11 0.56 0.02 0.11 5.77
SJ38 6.25 9.94 1.11 0.22 3.04 5.00 0.02 0.56 16.19
SJ39 2.14 1.79 0.67 0.11 0.89 0.02 0.11 3.94
SJ40 1.25 1.83 0.11 0.44 1.22 0.05 3.08
SJ41 2.68 0.04 0.03 0.02 2.72
SJ42 3.04 0.03 0.02 0.02 3.07
SJ43 3.04 0.51 0.09 0.02 0.22 0.11 0.02 0.05 3.54
SJ44 1.07 0.12 0.02 0.10 1.19
SJ46 1.43 0.51 0.44 0.02 0.02 0.02 0.02 1.94
SJ47 3.93 0.00 3.93
SJ48 3.93 0.02 0.02 3.94
SJ49 3.21 0.08 0.05 0.02 0.02 3.30
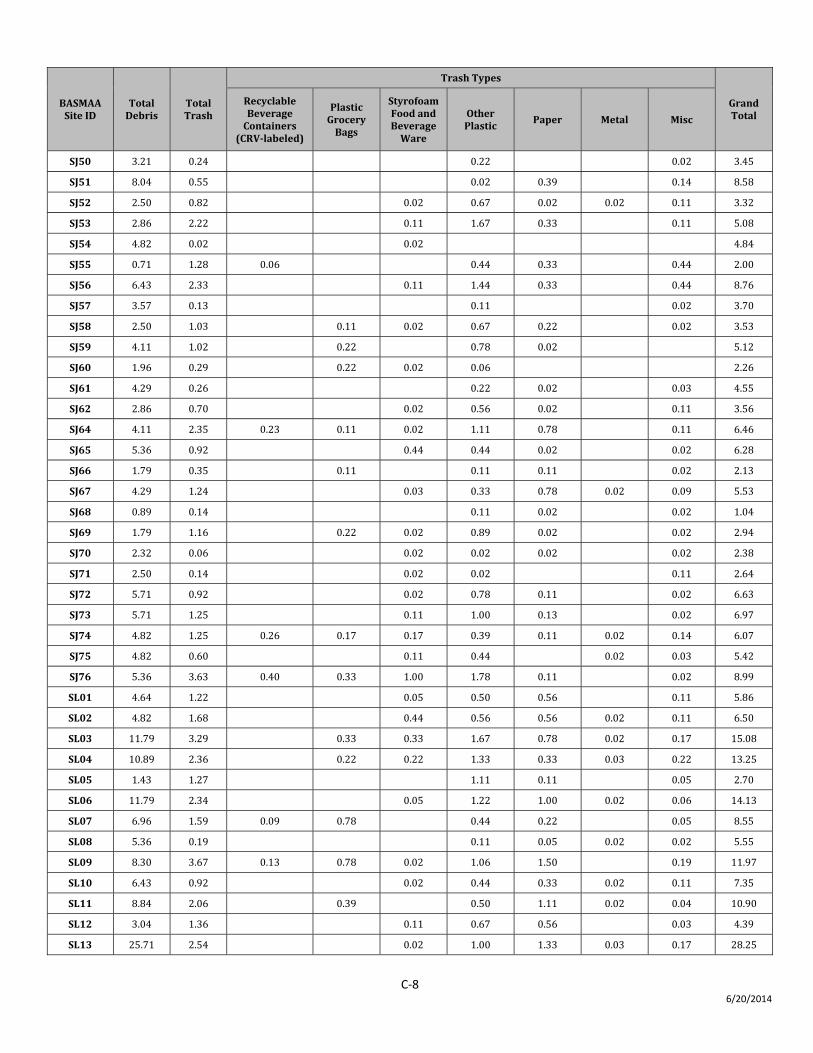
C‐8 6/20/2014
BASMAA Site ID
Total Debris
Total Trash
Trash Types
Grand Total
Recyclable Beverage Containers
(CRVlabeled)
Plastic Grocery Bags
Styrofoam Food and Beverage Ware
Other Plastic
Paper Metal Misc
SJ50 3.21 0.24 0.22 0.02 3.45
SJ51 8.04 0.55 0.02 0.39 0.14 8.58
SJ52 2.50 0.82 0.02 0.67 0.02 0.02 0.11 3.32
SJ53 2.86 2.22 0.11 1.67 0.33 0.11 5.08
SJ54 4.82 0.02 0.02 4.84
SJ55 0.71 1.28 0.06 0.44 0.33 0.44 2.00
SJ56 6.43 2.33 0.11 1.44 0.33 0.44 8.76
SJ57 3.57 0.13 0.11 0.02 3.70
SJ58 2.50 1.03 0.11 0.02 0.67 0.22 0.02 3.53
SJ59 4.11 1.02 0.22 0.78 0.02 5.12
SJ60 1.96 0.29 0.22 0.02 0.06 2.26
SJ61 4.29 0.26 0.22 0.02 0.03 4.55
SJ62 2.86 0.70 0.02 0.56 0.02 0.11 3.56
SJ64 4.11 2.35 0.23 0.11 0.02 1.11 0.78 0.11 6.46
SJ65 5.36 0.92 0.44 0.44 0.02 0.02 6.28
SJ66 1.79 0.35 0.11 0.11 0.11 0.02 2.13
SJ67 4.29 1.24 0.03 0.33 0.78 0.02 0.09 5.53
SJ68 0.89 0.14 0.11 0.02 0.02 1.04
SJ69 1.79 1.16 0.22 0.02 0.89 0.02 0.02 2.94
SJ70 2.32 0.06 0.02 0.02 0.02 0.02 2.38
SJ71 2.50 0.14 0.02 0.02 0.11 2.64
SJ72 5.71 0.92 0.02 0.78 0.11 0.02 6.63
SJ73 5.71 1.25 0.11 1.00 0.13 0.02 6.97
SJ74 4.82 1.25 0.26 0.17 0.17 0.39 0.11 0.02 0.14 6.07
SJ75 4.82 0.60 0.11 0.44 0.02 0.03 5.42
SJ76 5.36 3.63 0.40 0.33 1.00 1.78 0.11 0.02 8.99
SL01 4.64 1.22 0.05 0.50 0.56 0.11 5.86
SL02 4.82 1.68 0.44 0.56 0.56 0.02 0.11 6.50
SL03 11.79 3.29 0.33 0.33 1.67 0.78 0.02 0.17 15.08
SL04 10.89 2.36 0.22 0.22 1.33 0.33 0.03 0.22 13.25
SL05 1.43 1.27 1.11 0.11 0.05 2.70
SL06 11.79 2.34 0.05 1.22 1.00 0.02 0.06 14.13
SL07 6.96 1.59 0.09 0.78 0.44 0.22 0.05 8.55
SL08 5.36 0.19 0.11 0.05 0.02 0.02 5.55
SL09 8.30 3.67 0.13 0.78 0.02 1.06 1.50 0.19 11.97
SL10 6.43 0.92 0.02 0.44 0.33 0.02 0.11 7.35
SL11 8.84 2.06 0.39 0.50 1.11 0.02 0.04 10.90
SL12 3.04 1.36 0.11 0.67 0.56 0.03 4.39
SL13 25.71 2.54 0.02 1.00 1.33 0.03 0.17 28.25
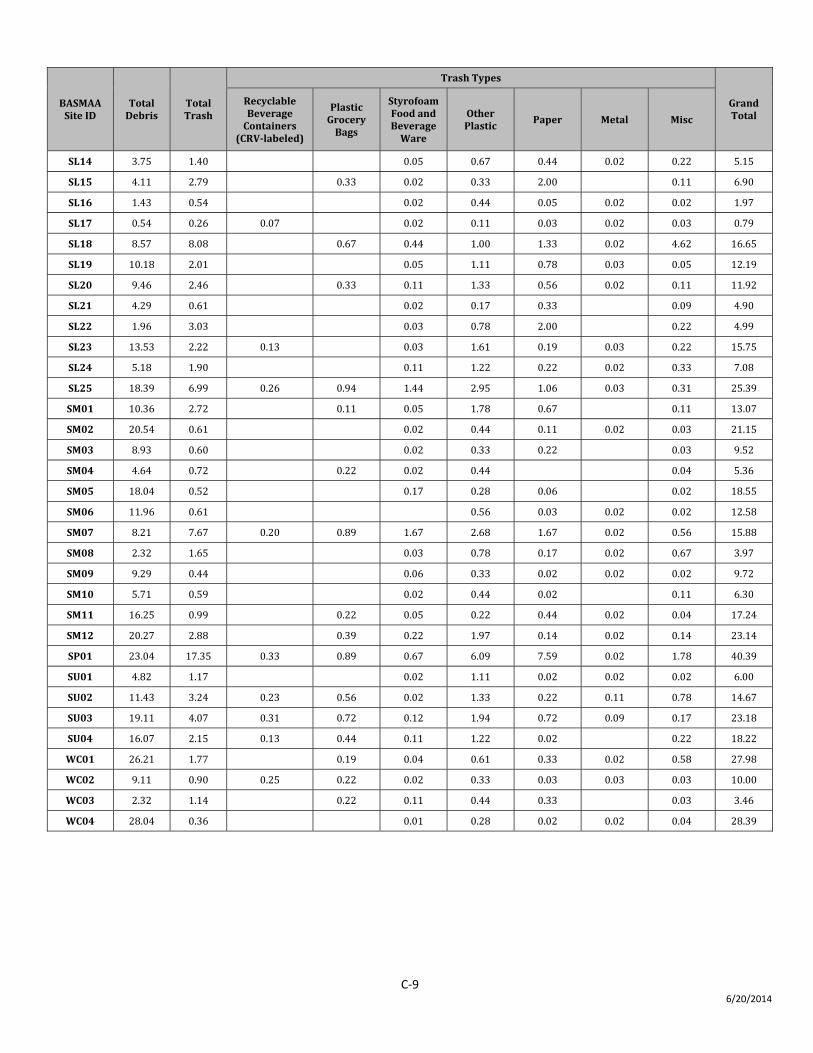
C‐9 6/20/2014
BASMAA Site ID
Total Debris
Total Trash
Trash Types
Grand Total
Recyclable Beverage Containers
(CRVlabeled)
Plastic Grocery Bags
Styrofoam Food and Beverage Ware
Other Plastic
Paper Metal Misc
SL14 3.75 1.40 0.05 0.67 0.44 0.02 0.22 5.15
SL15 4.11 2.79 0.33 0.02 0.33 2.00 0.11 6.90
SL16 1.43 0.54 0.02 0.44 0.05 0.02 0.02 1.97
SL17 0.54 0.26 0.07 0.02 0.11 0.03 0.02 0.03 0.79
SL18 8.57 8.08 0.67 0.44 1.00 1.33 0.02 4.62 16.65
SL19 10.18 2.01 0.05 1.11 0.78 0.03 0.05 12.19
SL20 9.46 2.46 0.33 0.11 1.33 0.56 0.02 0.11 11.92
SL21 4.29 0.61 0.02 0.17 0.33 0.09 4.90
SL22 1.96 3.03 0.03 0.78 2.00 0.22 4.99
SL23 13.53 2.22 0.13 0.03 1.61 0.19 0.03 0.22 15.75
SL24 5.18 1.90 0.11 1.22 0.22 0.02 0.33 7.08
SL25 18.39 6.99 0.26 0.94 1.44 2.95 1.06 0.03 0.31 25.39
SM01 10.36 2.72 0.11 0.05 1.78 0.67 0.11 13.07
SM02 20.54 0.61 0.02 0.44 0.11 0.02 0.03 21.15
SM03 8.93 0.60 0.02 0.33 0.22 0.03 9.52
SM04 4.64 0.72 0.22 0.02 0.44 0.04 5.36
SM05 18.04 0.52 0.17 0.28 0.06 0.02 18.55
SM06 11.96 0.61 0.56 0.03 0.02 0.02 12.58
SM07 8.21 7.67 0.20 0.89 1.67 2.68 1.67 0.02 0.56 15.88
SM08 2.32 1.65 0.03 0.78 0.17 0.02 0.67 3.97
SM09 9.29 0.44 0.06 0.33 0.02 0.02 0.02 9.72
SM10 5.71 0.59 0.02 0.44 0.02 0.11 6.30
SM11 16.25 0.99 0.22 0.05 0.22 0.44 0.02 0.04 17.24
SM12 20.27 2.88 0.39 0.22 1.97 0.14 0.02 0.14 23.14
SP01 23.04 17.35 0.33 0.89 0.67 6.09 7.59 0.02 1.78 40.39
SU01 4.82 1.17 0.02 1.11 0.02 0.02 0.02 6.00
SU02 11.43 3.24 0.23 0.56 0.02 1.33 0.22 0.11 0.78 14.67
SU03 19.11 4.07 0.31 0.72 0.12 1.94 0.72 0.09 0.17 23.18
SU04 16.07 2.15 0.13 0.44 0.11 1.22 0.02 0.22 18.22
WC01 26.21 1.77 0.19 0.04 0.61 0.33 0.02 0.58 27.98
WC02 9.11 0.90 0.25 0.22 0.02 0.33 0.03 0.03 0.03 10.00
WC03 2.32 1.14 0.22 0.11 0.44 0.33 0.03 3.46
WC04 28.04 0.36 0.01 0.28 0.02 0.02 0.04 28.39
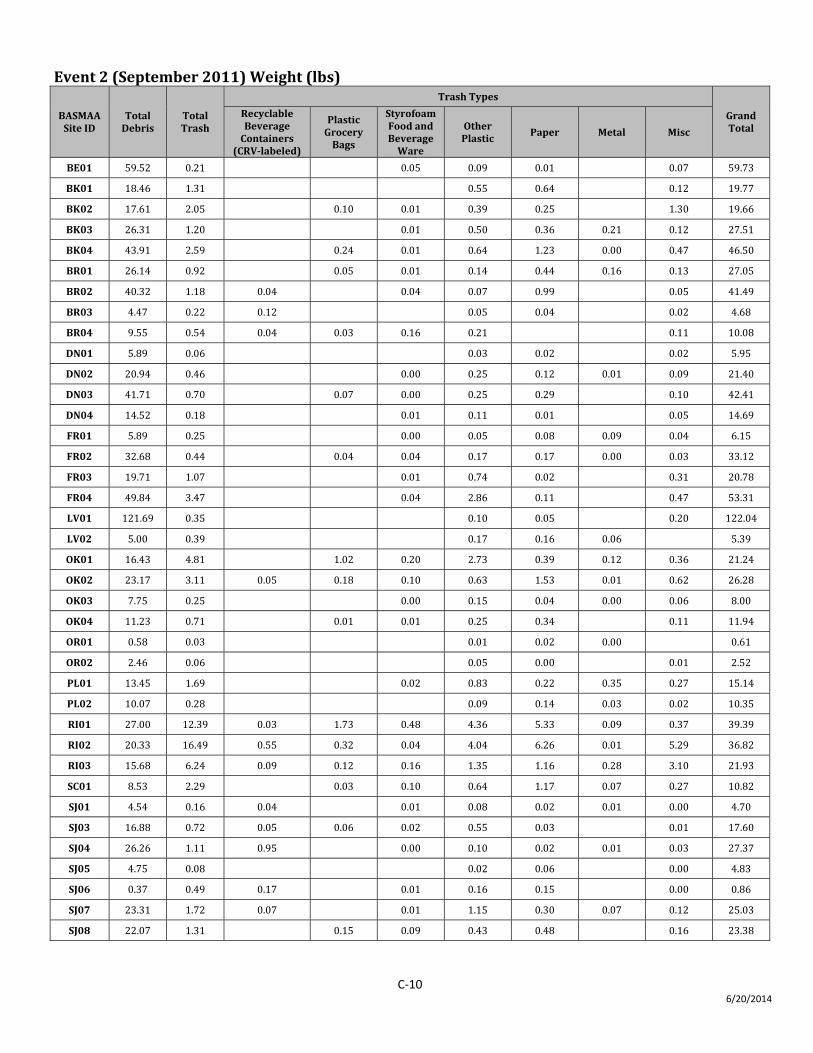
C‐10 6/20/2014
Event 2 (September 2011) Weight (lbs)
BASMAA Site ID
Total Debris
Total Trash
Trash Types
Grand Total
Recyclable Beverage Containers
(CRVlabeled)
Plastic Grocery Bags
Styrofoam Food and Beverage Ware
Other Plastic
Paper Metal Misc
BE01 59.52 0.21 0.05 0.09 0.01 0.07 59.73
BK01 18.46 1.31 0.55 0.64 0.12 19.77
BK02 17.61 2.05 0.10 0.01 0.39 0.25 1.30 19.66
BK03 26.31 1.20 0.01 0.50 0.36 0.21 0.12 27.51
BK04 43.91 2.59 0.24 0.01 0.64 1.23 0.00 0.47 46.50
BR01 26.14 0.92 0.05 0.01 0.14 0.44 0.16 0.13 27.05
BR02 40.32 1.18 0.04 0.04 0.07 0.99 0.05 41.49
BR03 4.47 0.22 0.12 0.05 0.04 0.02 4.68
BR04 9.55 0.54 0.04 0.03 0.16 0.21 0.11 10.08
DN01 5.89 0.06 0.03 0.02 0.02 5.95
DN02 20.94 0.46 0.00 0.25 0.12 0.01 0.09 21.40
DN03 41.71 0.70 0.07 0.00 0.25 0.29 0.10 42.41
DN04 14.52 0.18 0.01 0.11 0.01 0.05 14.69
FR01 5.89 0.25 0.00 0.05 0.08 0.09 0.04 6.15
FR02 32.68 0.44 0.04 0.04 0.17 0.17 0.00 0.03 33.12
FR03 19.71 1.07 0.01 0.74 0.02 0.31 20.78
FR04 49.84 3.47 0.04 2.86 0.11 0.47 53.31
LV01 121.69 0.35 0.10 0.05 0.20 122.04
LV02 5.00 0.39 0.17 0.16 0.06 5.39
OK01 16.43 4.81 1.02 0.20 2.73 0.39 0.12 0.36 21.24
OK02 23.17 3.11 0.05 0.18 0.10 0.63 1.53 0.01 0.62 26.28
OK03 7.75 0.25 0.00 0.15 0.04 0.00 0.06 8.00
OK04 11.23 0.71 0.01 0.01 0.25 0.34 0.11 11.94
OR01 0.58 0.03 0.01 0.02 0.00 0.61
OR02 2.46 0.06 0.05 0.00 0.01 2.52
PL01 13.45 1.69 0.02 0.83 0.22 0.35 0.27 15.14
PL02 10.07 0.28 0.09 0.14 0.03 0.02 10.35
RI01 27.00 12.39 0.03 1.73 0.48 4.36 5.33 0.09 0.37 39.39
RI02 20.33 16.49 0.55 0.32 0.04 4.04 6.26 0.01 5.29 36.82
RI03 15.68 6.24 0.09 0.12 0.16 1.35 1.16 0.28 3.10 21.93
SC01 8.53 2.29 0.03 0.10 0.64 1.17 0.07 0.27 10.82
SJ01 4.54 0.16 0.04 0.01 0.08 0.02 0.01 0.00 4.70
SJ03 16.88 0.72 0.05 0.06 0.02 0.55 0.03 0.01 17.60
SJ04 26.26 1.11 0.95 0.00 0.10 0.02 0.01 0.03 27.37
SJ05 4.75 0.08 0.02 0.06 0.00 4.83
SJ06 0.37 0.49 0.17 0.01 0.16 0.15 0.00 0.86
SJ07 23.31 1.72 0.07 0.01 1.15 0.30 0.07 0.12 25.03
SJ08 22.07 1.31 0.15 0.09 0.43 0.48 0.16 23.38
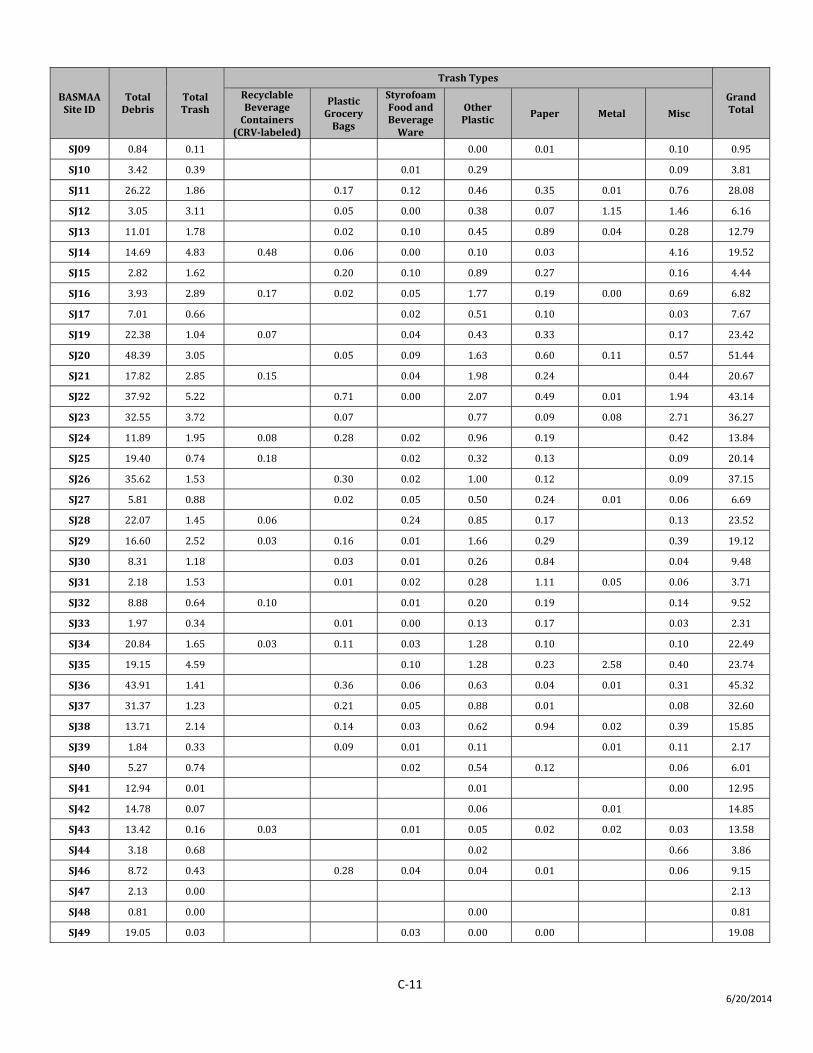
C‐11 6/20/2014
BASMAA Site ID
Total Debris
Total Trash
Trash Types
Grand Total
Recyclable Beverage Containers
(CRVlabeled)
Plastic Grocery Bags
Styrofoam Food and Beverage Ware
Other Plastic
Paper Metal Misc
SJ09 0.84 0.11 0.00 0.01 0.10 0.95
SJ10 3.42 0.39 0.01 0.29 0.09 3.81
SJ11 26.22 1.86 0.17 0.12 0.46 0.35 0.01 0.76 28.08
SJ12 3.05 3.11 0.05 0.00 0.38 0.07 1.15 1.46 6.16
SJ13 11.01 1.78 0.02 0.10 0.45 0.89 0.04 0.28 12.79
SJ14 14.69 4.83 0.48 0.06 0.00 0.10 0.03 4.16 19.52
SJ15 2.82 1.62 0.20 0.10 0.89 0.27 0.16 4.44
SJ16 3.93 2.89 0.17 0.02 0.05 1.77 0.19 0.00 0.69 6.82
SJ17 7.01 0.66 0.02 0.51 0.10 0.03 7.67
SJ19 22.38 1.04 0.07 0.04 0.43 0.33 0.17 23.42
SJ20 48.39 3.05 0.05 0.09 1.63 0.60 0.11 0.57 51.44
SJ21 17.82 2.85 0.15 0.04 1.98 0.24 0.44 20.67
SJ22 37.92 5.22 0.71 0.00 2.07 0.49 0.01 1.94 43.14
SJ23 32.55 3.72 0.07 0.77 0.09 0.08 2.71 36.27
SJ24 11.89 1.95 0.08 0.28 0.02 0.96 0.19 0.42 13.84
SJ25 19.40 0.74 0.18 0.02 0.32 0.13 0.09 20.14
SJ26 35.62 1.53 0.30 0.02 1.00 0.12 0.09 37.15
SJ27 5.81 0.88 0.02 0.05 0.50 0.24 0.01 0.06 6.69
SJ28 22.07 1.45 0.06 0.24 0.85 0.17 0.13 23.52
SJ29 16.60 2.52 0.03 0.16 0.01 1.66 0.29 0.39 19.12
SJ30 8.31 1.18 0.03 0.01 0.26 0.84 0.04 9.48
SJ31 2.18 1.53 0.01 0.02 0.28 1.11 0.05 0.06 3.71
SJ32 8.88 0.64 0.10 0.01 0.20 0.19 0.14 9.52
SJ33 1.97 0.34 0.01 0.00 0.13 0.17 0.03 2.31
SJ34 20.84 1.65 0.03 0.11 0.03 1.28 0.10 0.10 22.49
SJ35 19.15 4.59 0.10 1.28 0.23 2.58 0.40 23.74
SJ36 43.91 1.41 0.36 0.06 0.63 0.04 0.01 0.31 45.32
SJ37 31.37 1.23 0.21 0.05 0.88 0.01 0.08 32.60
SJ38 13.71 2.14 0.14 0.03 0.62 0.94 0.02 0.39 15.85
SJ39 1.84 0.33 0.09 0.01 0.11 0.01 0.11 2.17
SJ40 5.27 0.74 0.02 0.54 0.12 0.06 6.01
SJ41 12.94 0.01 0.01 0.00 12.95
SJ42 14.78 0.07 0.06 0.01 14.85
SJ43 13.42 0.16 0.03 0.01 0.05 0.02 0.02 0.03 13.58
SJ44 3.18 0.68 0.02 0.66 3.86
SJ46 8.72 0.43 0.28 0.04 0.04 0.01 0.06 9.15
SJ47 2.13 0.00 2.13
SJ48 0.81 0.00 0.00 0.81
SJ49 19.05 0.03 0.03 0.00 0.00 19.08
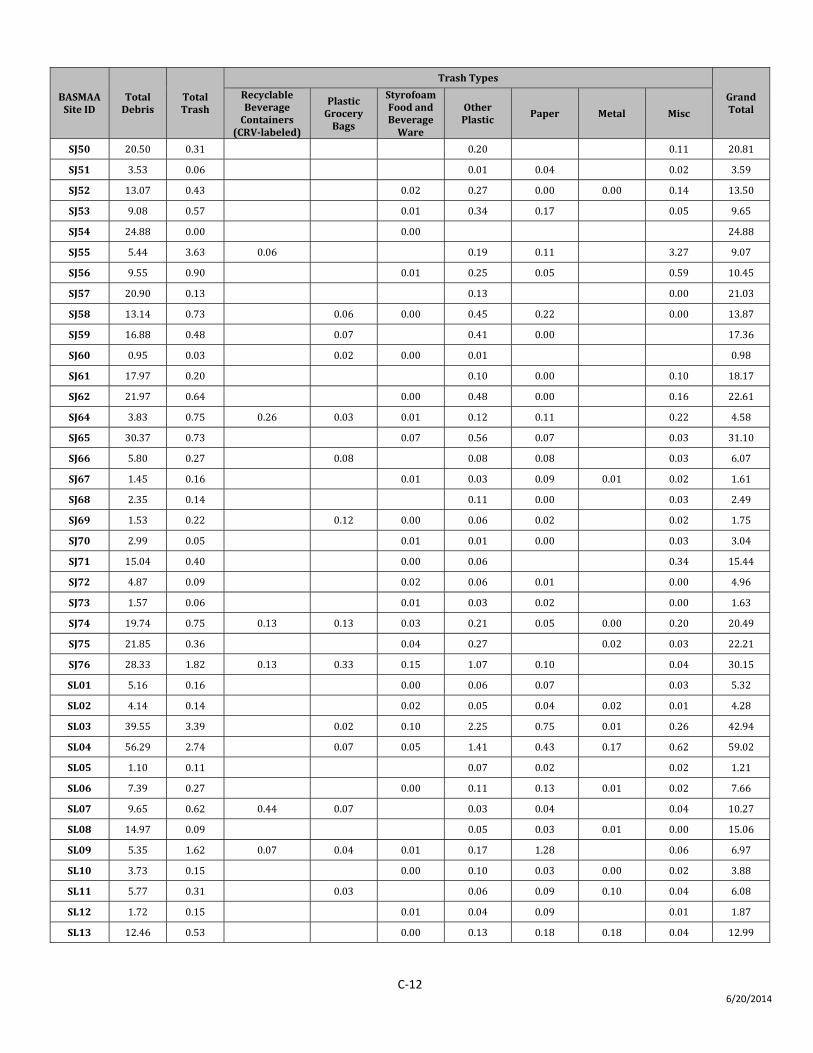
C‐12 6/20/2014
BASMAA Site ID
Total Debris
Total Trash
Trash Types
Grand Total
Recyclable Beverage Containers
(CRVlabeled)
Plastic Grocery Bags
Styrofoam Food and Beverage Ware
Other Plastic
Paper Metal Misc
SJ50 20.50 0.31 0.20 0.11 20.81
SJ51 3.53 0.06 0.01 0.04 0.02 3.59
SJ52 13.07 0.43 0.02 0.27 0.00 0.00 0.14 13.50
SJ53 9.08 0.57 0.01 0.34 0.17 0.05 9.65
SJ54 24.88 0.00 0.00 24.88
SJ55 5.44 3.63 0.06 0.19 0.11 3.27 9.07
SJ56 9.55 0.90 0.01 0.25 0.05 0.59 10.45
SJ57 20.90 0.13 0.13 0.00 21.03
SJ58 13.14 0.73 0.06 0.00 0.45 0.22 0.00 13.87
SJ59 16.88 0.48 0.07 0.41 0.00 17.36
SJ60 0.95 0.03 0.02 0.00 0.01 0.98
SJ61 17.97 0.20 0.10 0.00 0.10 18.17
SJ62 21.97 0.64 0.00 0.48 0.00 0.16 22.61
SJ64 3.83 0.75 0.26 0.03 0.01 0.12 0.11 0.22 4.58
SJ65 30.37 0.73 0.07 0.56 0.07 0.03 31.10
SJ66 5.80 0.27 0.08 0.08 0.08 0.03 6.07
SJ67 1.45 0.16 0.01 0.03 0.09 0.01 0.02 1.61
SJ68 2.35 0.14 0.11 0.00 0.03 2.49
SJ69 1.53 0.22 0.12 0.00 0.06 0.02 0.02 1.75
SJ70 2.99 0.05 0.01 0.01 0.00 0.03 3.04
SJ71 15.04 0.40 0.00 0.06 0.34 15.44
SJ72 4.87 0.09 0.02 0.06 0.01 0.00 4.96
SJ73 1.57 0.06 0.01 0.03 0.02 0.00 1.63
SJ74 19.74 0.75 0.13 0.13 0.03 0.21 0.05 0.00 0.20 20.49
SJ75 21.85 0.36 0.04 0.27 0.02 0.03 22.21
SJ76 28.33 1.82 0.13 0.33 0.15 1.07 0.10 0.04 30.15
SL01 5.16 0.16 0.00 0.06 0.07 0.03 5.32
SL02 4.14 0.14 0.02 0.05 0.04 0.02 0.01 4.28
SL03 39.55 3.39 0.02 0.10 2.25 0.75 0.01 0.26 42.94
SL04 56.29 2.74 0.07 0.05 1.41 0.43 0.17 0.62 59.02
SL05 1.10 0.11 0.07 0.02 0.02 1.21
SL06 7.39 0.27 0.00 0.11 0.13 0.01 0.02 7.66
SL07 9.65 0.62 0.44 0.07 0.03 0.04 0.04 10.27
SL08 14.97 0.09 0.05 0.03 0.01 0.00 15.06
SL09 5.35 1.62 0.07 0.04 0.01 0.17 1.28 0.06 6.97
SL10 3.73 0.15 0.00 0.10 0.03 0.00 0.02 3.88
SL11 5.77 0.31 0.03 0.06 0.09 0.10 0.04 6.08
SL12 1.72 0.15 0.01 0.04 0.09 0.01 1.87
SL13 12.46 0.53 0.00 0.13 0.18 0.18 0.04 12.99
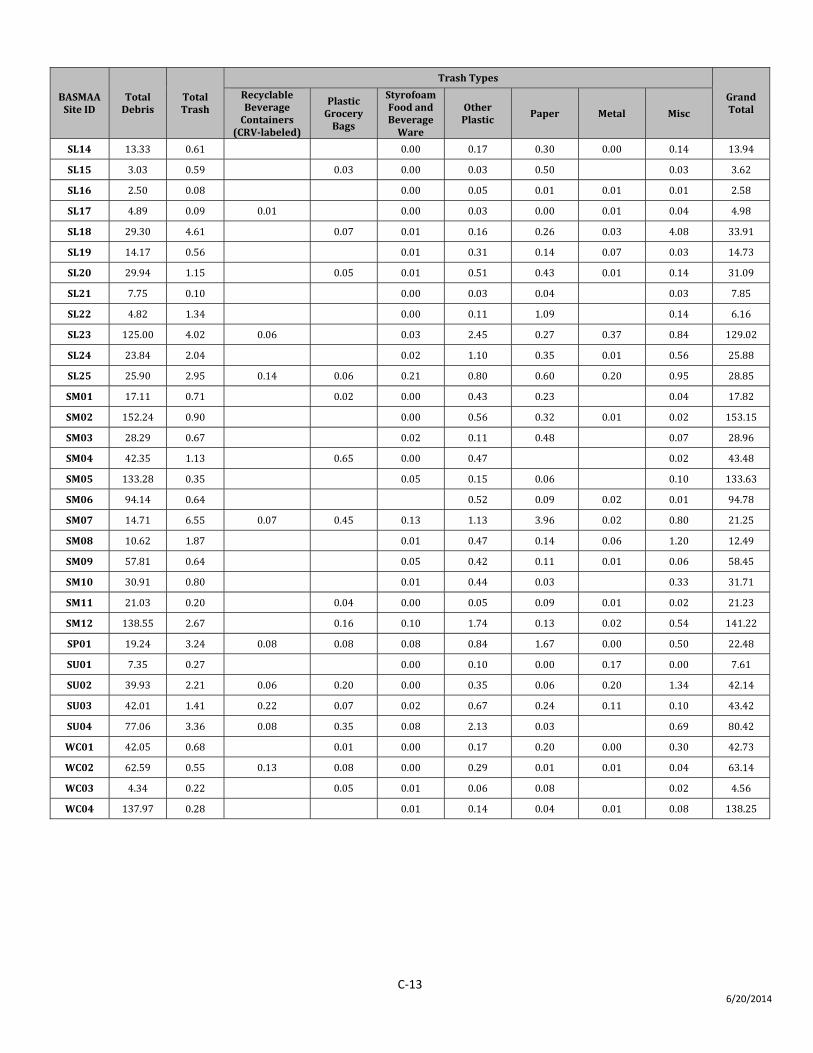
C‐13 6/20/2014
BASMAA Site ID
Total Debris
Total Trash
Trash Types
Grand Total
Recyclable Beverage Containers
(CRVlabeled)
Plastic Grocery Bags
Styrofoam Food and Beverage Ware
Other Plastic
Paper Metal Misc
SL14 13.33 0.61 0.00 0.17 0.30 0.00 0.14 13.94
SL15 3.03 0.59 0.03 0.00 0.03 0.50 0.03 3.62
SL16 2.50 0.08 0.00 0.05 0.01 0.01 0.01 2.58
SL17 4.89 0.09 0.01 0.00 0.03 0.00 0.01 0.04 4.98
SL18 29.30 4.61 0.07 0.01 0.16 0.26 0.03 4.08 33.91
SL19 14.17 0.56 0.01 0.31 0.14 0.07 0.03 14.73
SL20 29.94 1.15 0.05 0.01 0.51 0.43 0.01 0.14 31.09
SL21 7.75 0.10 0.00 0.03 0.04 0.03 7.85
SL22 4.82 1.34 0.00 0.11 1.09 0.14 6.16
SL23 125.00 4.02 0.06 0.03 2.45 0.27 0.37 0.84 129.02
SL24 23.84 2.04 0.02 1.10 0.35 0.01 0.56 25.88
SL25 25.90 2.95 0.14 0.06 0.21 0.80 0.60 0.20 0.95 28.85
SM01 17.11 0.71 0.02 0.00 0.43 0.23 0.04 17.82
SM02 152.24 0.90 0.00 0.56 0.32 0.01 0.02 153.15
SM03 28.29 0.67 0.02 0.11 0.48 0.07 28.96
SM04 42.35 1.13 0.65 0.00 0.47 0.02 43.48
SM05 133.28 0.35 0.05 0.15 0.06 0.10 133.63
SM06 94.14 0.64 0.52 0.09 0.02 0.01 94.78
SM07 14.71 6.55 0.07 0.45 0.13 1.13 3.96 0.02 0.80 21.25
SM08 10.62 1.87 0.01 0.47 0.14 0.06 1.20 12.49
SM09 57.81 0.64 0.05 0.42 0.11 0.01 0.06 58.45
SM10 30.91 0.80 0.01 0.44 0.03 0.33 31.71
SM11 21.03 0.20 0.04 0.00 0.05 0.09 0.01 0.02 21.23
SM12 138.55 2.67 0.16 0.10 1.74 0.13 0.02 0.54 141.22
SP01 19.24 3.24 0.08 0.08 0.08 0.84 1.67 0.00 0.50 22.48
SU01 7.35 0.27 0.00 0.10 0.00 0.17 0.00 7.61
SU02 39.93 2.21 0.06 0.20 0.00 0.35 0.06 0.20 1.34 42.14
SU03 42.01 1.41 0.22 0.07 0.02 0.67 0.24 0.11 0.10 43.42
SU04 77.06 3.36 0.08 0.35 0.08 2.13 0.03 0.69 80.42
WC01 42.05 0.68 0.01 0.00 0.17 0.20 0.00 0.30 42.73
WC02 62.59 0.55 0.13 0.08 0.00 0.29 0.01 0.01 0.04 63.14
WC03 4.34 0.22 0.05 0.01 0.06 0.08 0.02 4.56
WC04 137.97 0.28 0.01 0.14 0.04 0.01 0.08 138.25
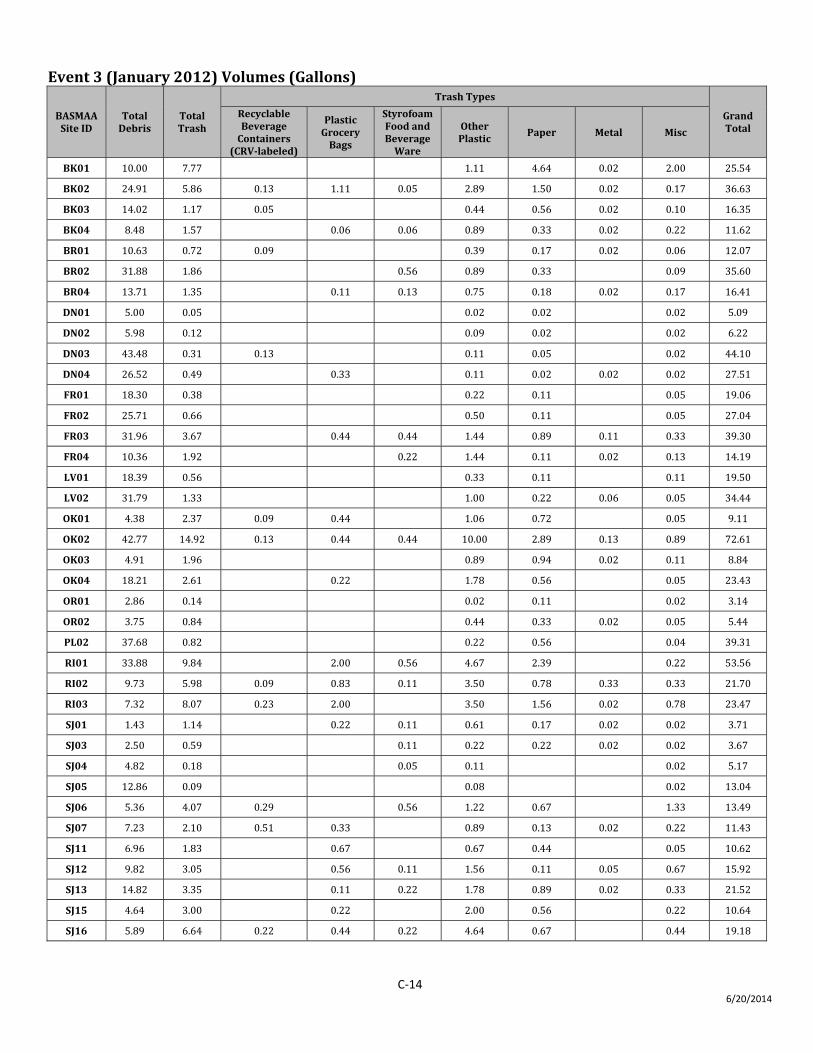
C‐14 6/20/2014
Event 3 (January 2012) Volumes (Gallons)
BASMAA Site ID
Total Debris
Total Trash
Trash Types
Grand Total
Recyclable Beverage Containers
(CRVlabeled)
Plastic Grocery Bags
Styrofoam Food and Beverage Ware
Other Plastic
Paper Metal Misc
BK01 10.00 7.77 1.11 4.64 0.02 2.00 25.54
BK02 24.91 5.86 0.13 1.11 0.05 2.89 1.50 0.02 0.17 36.63
BK03 14.02 1.17 0.05 0.44 0.56 0.02 0.10 16.35
BK04 8.48 1.57 0.06 0.06 0.89 0.33 0.02 0.22 11.62
BR01 10.63 0.72 0.09 0.39 0.17 0.02 0.06 12.07
BR02 31.88 1.86 0.56 0.89 0.33 0.09 35.60
BR04 13.71 1.35 0.11 0.13 0.75 0.18 0.02 0.17 16.41
DN01 5.00 0.05 0.02 0.02 0.02 5.09
DN02 5.98 0.12 0.09 0.02 0.02 6.22
DN03 43.48 0.31 0.13 0.11 0.05 0.02 44.10
DN04 26.52 0.49 0.33 0.11 0.02 0.02 0.02 27.51
FR01 18.30 0.38 0.22 0.11 0.05 19.06
FR02 25.71 0.66 0.50 0.11 0.05 27.04
FR03 31.96 3.67 0.44 0.44 1.44 0.89 0.11 0.33 39.30
FR04 10.36 1.92 0.22 1.44 0.11 0.02 0.13 14.19
LV01 18.39 0.56 0.33 0.11 0.11 19.50
LV02 31.79 1.33 1.00 0.22 0.06 0.05 34.44
OK01 4.38 2.37 0.09 0.44 1.06 0.72 0.05 9.11
OK02 42.77 14.92 0.13 0.44 0.44 10.00 2.89 0.13 0.89 72.61
OK03 4.91 1.96 0.89 0.94 0.02 0.11 8.84
OK04 18.21 2.61 0.22 1.78 0.56 0.05 23.43
OR01 2.86 0.14 0.02 0.11 0.02 3.14
OR02 3.75 0.84 0.44 0.33 0.02 0.05 5.44
PL02 37.68 0.82 0.22 0.56 0.04 39.31
RI01 33.88 9.84 2.00 0.56 4.67 2.39 0.22 53.56
RI02 9.73 5.98 0.09 0.83 0.11 3.50 0.78 0.33 0.33 21.70
RI03 7.32 8.07 0.23 2.00 3.50 1.56 0.02 0.78 23.47
SJ01 1.43 1.14 0.22 0.11 0.61 0.17 0.02 0.02 3.71
SJ03 2.50 0.59 0.11 0.22 0.22 0.02 0.02 3.67
SJ04 4.82 0.18 0.05 0.11 0.02 5.17
SJ05 12.86 0.09 0.08 0.02 13.04
SJ06 5.36 4.07 0.29 0.56 1.22 0.67 1.33 13.49
SJ07 7.23 2.10 0.51 0.33 0.89 0.13 0.02 0.22 11.43
SJ11 6.96 1.83 0.67 0.67 0.44 0.05 10.62
SJ12 9.82 3.05 0.56 0.11 1.56 0.11 0.05 0.67 15.92
SJ13 14.82 3.35 0.11 0.22 1.78 0.89 0.02 0.33 21.52
SJ15 4.64 3.00 0.22 2.00 0.56 0.22 10.64
SJ16 5.89 6.64 0.22 0.44 0.22 4.64 0.67 0.44 19.18
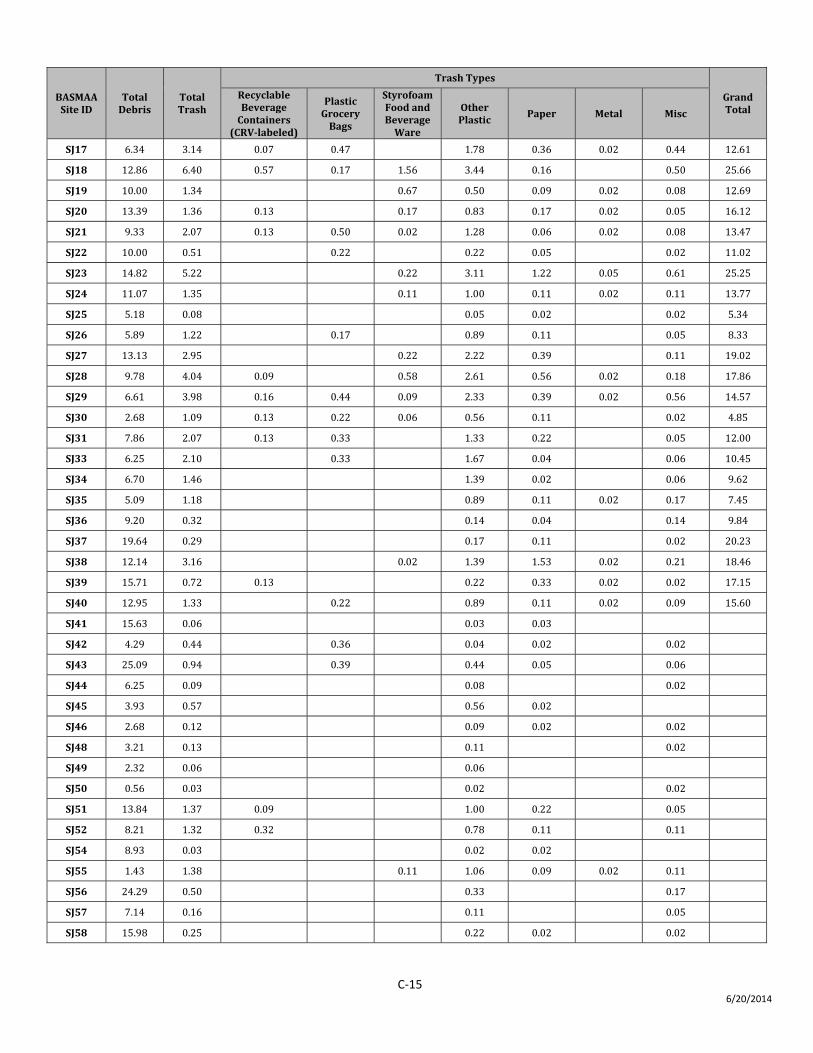
C‐15 6/20/2014
BASMAA Site ID
Total Debris
Total Trash
Trash Types
Grand Total
Recyclable Beverage Containers
(CRVlabeled)
Plastic Grocery Bags
Styrofoam Food and Beverage Ware
Other Plastic
Paper Metal Misc
SJ17 6.34 3.14 0.07 0.47 1.78 0.36 0.02 0.44 12.61
SJ18 12.86 6.40 0.57 0.17 1.56 3.44 0.16 0.50 25.66
SJ19 10.00 1.34 0.67 0.50 0.09 0.02 0.08 12.69
SJ20 13.39 1.36 0.13 0.17 0.83 0.17 0.02 0.05 16.12
SJ21 9.33 2.07 0.13 0.50 0.02 1.28 0.06 0.02 0.08 13.47
SJ22 10.00 0.51 0.22 0.22 0.05 0.02 11.02
SJ23 14.82 5.22 0.22 3.11 1.22 0.05 0.61 25.25
SJ24 11.07 1.35 0.11 1.00 0.11 0.02 0.11 13.77
SJ25 5.18 0.08 0.05 0.02 0.02 5.34
SJ26 5.89 1.22 0.17 0.89 0.11 0.05 8.33
SJ27 13.13 2.95 0.22 2.22 0.39 0.11 19.02
SJ28 9.78 4.04 0.09 0.58 2.61 0.56 0.02 0.18 17.86
SJ29 6.61 3.98 0.16 0.44 0.09 2.33 0.39 0.02 0.56 14.57
SJ30 2.68 1.09 0.13 0.22 0.06 0.56 0.11 0.02 4.85
SJ31 7.86 2.07 0.13 0.33 1.33 0.22 0.05 12.00
SJ33 6.25 2.10 0.33 1.67 0.04 0.06 10.45
SJ34 6.70 1.46 1.39 0.02 0.06 9.62
SJ35 5.09 1.18 0.89 0.11 0.02 0.17 7.45
SJ36 9.20 0.32 0.14 0.04 0.14 9.84
SJ37 19.64 0.29 0.17 0.11 0.02 20.23
SJ38 12.14 3.16 0.02 1.39 1.53 0.02 0.21 18.46
SJ39 15.71 0.72 0.13 0.22 0.33 0.02 0.02 17.15
SJ40 12.95 1.33 0.22 0.89 0.11 0.02 0.09 15.60
SJ41 15.63 0.06 0.03 0.03
SJ42 4.29 0.44 0.36 0.04 0.02 0.02
SJ43 25.09 0.94 0.39 0.44 0.05 0.06
SJ44 6.25 0.09 0.08 0.02
SJ45 3.93 0.57 0.56 0.02
SJ46 2.68 0.12 0.09 0.02 0.02
SJ48 3.21 0.13 0.11 0.02
SJ49 2.32 0.06 0.06
SJ50 0.56 0.03 0.02 0.02
SJ51 13.84 1.37 0.09 1.00 0.22 0.05
SJ52 8.21 1.32 0.32 0.78 0.11 0.11
SJ54 8.93 0.03 0.02 0.02
SJ55 1.43 1.38 0.11 1.06 0.09 0.02 0.11
SJ56 24.29 0.50 0.33 0.17
SJ57 7.14 0.16 0.11 0.05
SJ58 15.98 0.25 0.22 0.02 0.02
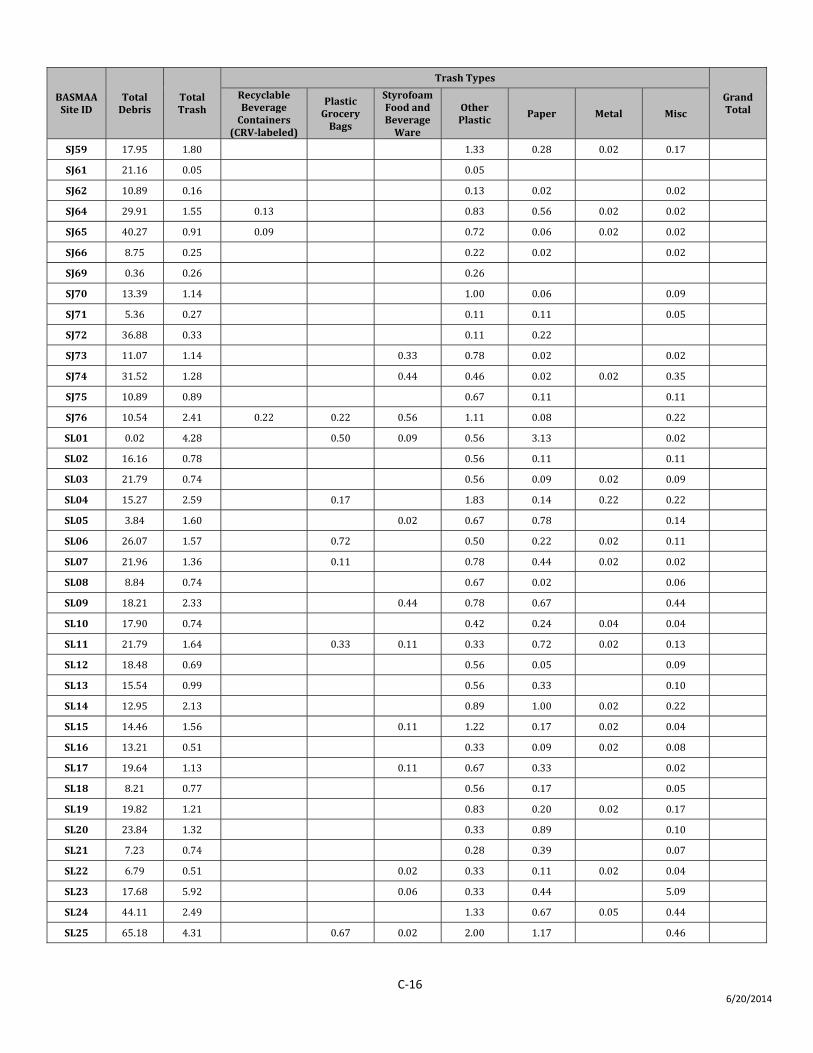
C‐16 6/20/2014
BASMAA Site ID
Total Debris
Total Trash
Trash Types
Grand Total
Recyclable Beverage Containers
(CRVlabeled)
Plastic Grocery Bags
Styrofoam Food and Beverage Ware
Other Plastic
Paper Metal Misc
SJ59 17.95 1.80 1.33 0.28 0.02 0.17
SJ61 21.16 0.05 0.05
SJ62 10.89 0.16 0.13 0.02 0.02
SJ64 29.91 1.55 0.13 0.83 0.56 0.02 0.02
SJ65 40.27 0.91 0.09 0.72 0.06 0.02 0.02
SJ66 8.75 0.25 0.22 0.02 0.02
SJ69 0.36 0.26 0.26
SJ70 13.39 1.14 1.00 0.06 0.09
SJ71 5.36 0.27 0.11 0.11 0.05
SJ72 36.88 0.33 0.11 0.22
SJ73 11.07 1.14 0.33 0.78 0.02 0.02
SJ74 31.52 1.28 0.44 0.46 0.02 0.02 0.35
SJ75 10.89 0.89 0.67 0.11 0.11
SJ76 10.54 2.41 0.22 0.22 0.56 1.11 0.08 0.22
SL01 0.02 4.28 0.50 0.09 0.56 3.13 0.02
SL02 16.16 0.78 0.56 0.11 0.11
SL03 21.79 0.74 0.56 0.09 0.02 0.09
SL04 15.27 2.59 0.17 1.83 0.14 0.22 0.22
SL05 3.84 1.60 0.02 0.67 0.78 0.14
SL06 26.07 1.57 0.72 0.50 0.22 0.02 0.11
SL07 21.96 1.36 0.11 0.78 0.44 0.02 0.02
SL08 8.84 0.74 0.67 0.02 0.06
SL09 18.21 2.33 0.44 0.78 0.67 0.44
SL10 17.90 0.74 0.42 0.24 0.04 0.04
SL11 21.79 1.64 0.33 0.11 0.33 0.72 0.02 0.13
SL12 18.48 0.69 0.56 0.05 0.09
SL13 15.54 0.99 0.56 0.33 0.10
SL14 12.95 2.13 0.89 1.00 0.02 0.22
SL15 14.46 1.56 0.11 1.22 0.17 0.02 0.04
SL16 13.21 0.51 0.33 0.09 0.02 0.08
SL17 19.64 1.13 0.11 0.67 0.33 0.02
SL18 8.21 0.77 0.56 0.17 0.05
SL19 19.82 1.21 0.83 0.20 0.02 0.17
SL20 23.84 1.32 0.33 0.89 0.10
SL21 7.23 0.74 0.28 0.39 0.07
SL22 6.79 0.51 0.02 0.33 0.11 0.02 0.04
SL23 17.68 5.92 0.06 0.33 0.44 5.09
SL24 44.11 2.49 1.33 0.67 0.05 0.44
SL25 65.18 4.31 0.67 0.02 2.00 1.17 0.46
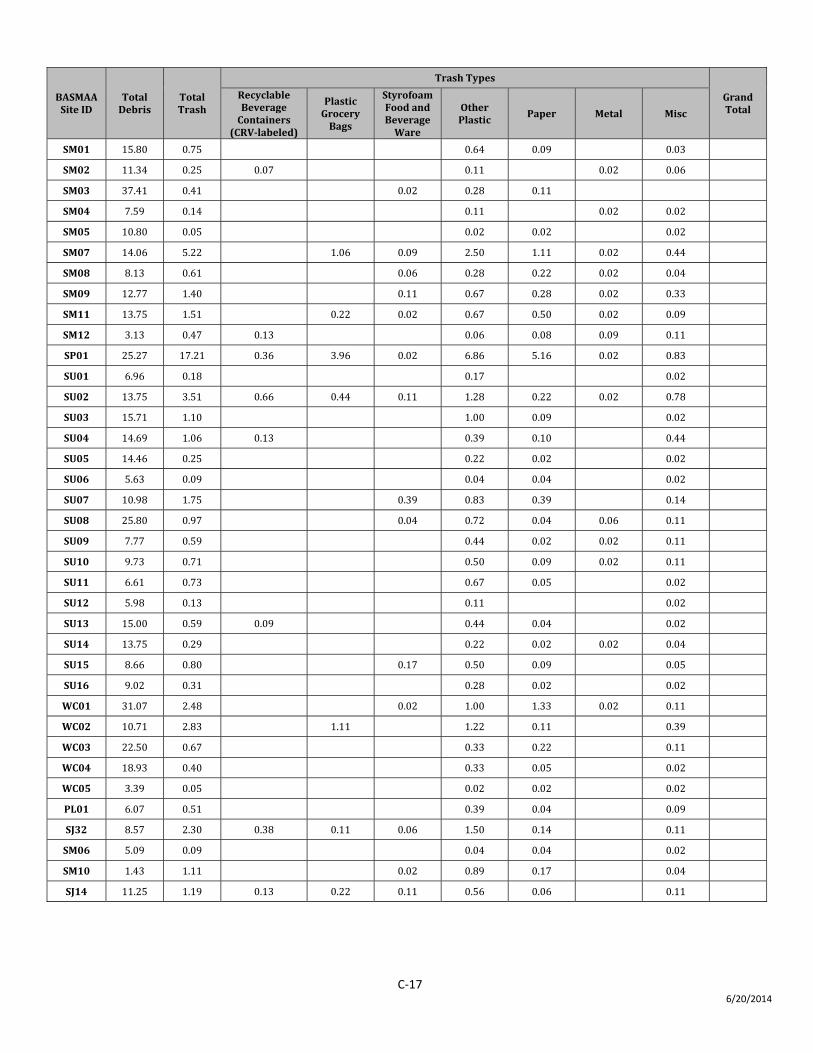
C‐17 6/20/2014
BASMAA Site ID
Total Debris
Total Trash
Trash Types
Grand Total
Recyclable Beverage Containers
(CRVlabeled)
Plastic Grocery Bags
Styrofoam Food and Beverage Ware
Other Plastic
Paper Metal Misc
SM01 15.80 0.75 0.64 0.09 0.03
SM02 11.34 0.25 0.07 0.11 0.02 0.06
SM03 37.41 0.41 0.02 0.28 0.11
SM04 7.59 0.14 0.11 0.02 0.02
SM05 10.80 0.05 0.02 0.02 0.02
SM07 14.06 5.22 1.06 0.09 2.50 1.11 0.02 0.44
SM08 8.13 0.61 0.06 0.28 0.22 0.02 0.04
SM09 12.77 1.40 0.11 0.67 0.28 0.02 0.33
SM11 13.75 1.51 0.22 0.02 0.67 0.50 0.02 0.09
SM12 3.13 0.47 0.13 0.06 0.08 0.09 0.11
SP01 25.27 17.21 0.36 3.96 0.02 6.86 5.16 0.02 0.83
SU01 6.96 0.18 0.17 0.02
SU02 13.75 3.51 0.66 0.44 0.11 1.28 0.22 0.02 0.78
SU03 15.71 1.10 1.00 0.09 0.02
SU04 14.69 1.06 0.13 0.39 0.10 0.44
SU05 14.46 0.25 0.22 0.02 0.02
SU06 5.63 0.09 0.04 0.04 0.02
SU07 10.98 1.75 0.39 0.83 0.39 0.14
SU08 25.80 0.97 0.04 0.72 0.04 0.06 0.11
SU09 7.77 0.59 0.44 0.02 0.02 0.11
SU10 9.73 0.71 0.50 0.09 0.02 0.11
SU11 6.61 0.73 0.67 0.05 0.02
SU12 5.98 0.13 0.11 0.02
SU13 15.00 0.59 0.09 0.44 0.04 0.02
SU14 13.75 0.29 0.22 0.02 0.02 0.04
SU15 8.66 0.80 0.17 0.50 0.09 0.05
SU16 9.02 0.31 0.28 0.02 0.02
WC01 31.07 2.48 0.02 1.00 1.33 0.02 0.11
WC02 10.71 2.83 1.11 1.22 0.11 0.39
WC03 22.50 0.67 0.33 0.22 0.11
WC04 18.93 0.40 0.33 0.05 0.02
WC05 3.39 0.05 0.02 0.02 0.02
PL01 6.07 0.51 0.39 0.04 0.09
SJ32 8.57 2.30 0.38 0.11 0.06 1.50 0.14 0.11
SM06 5.09 0.09 0.04 0.04 0.02
SM10 1.43 1.11 0.02 0.89 0.17 0.04
SJ14 11.25 1.19 0.13 0.22 0.11 0.56 0.06 0.11
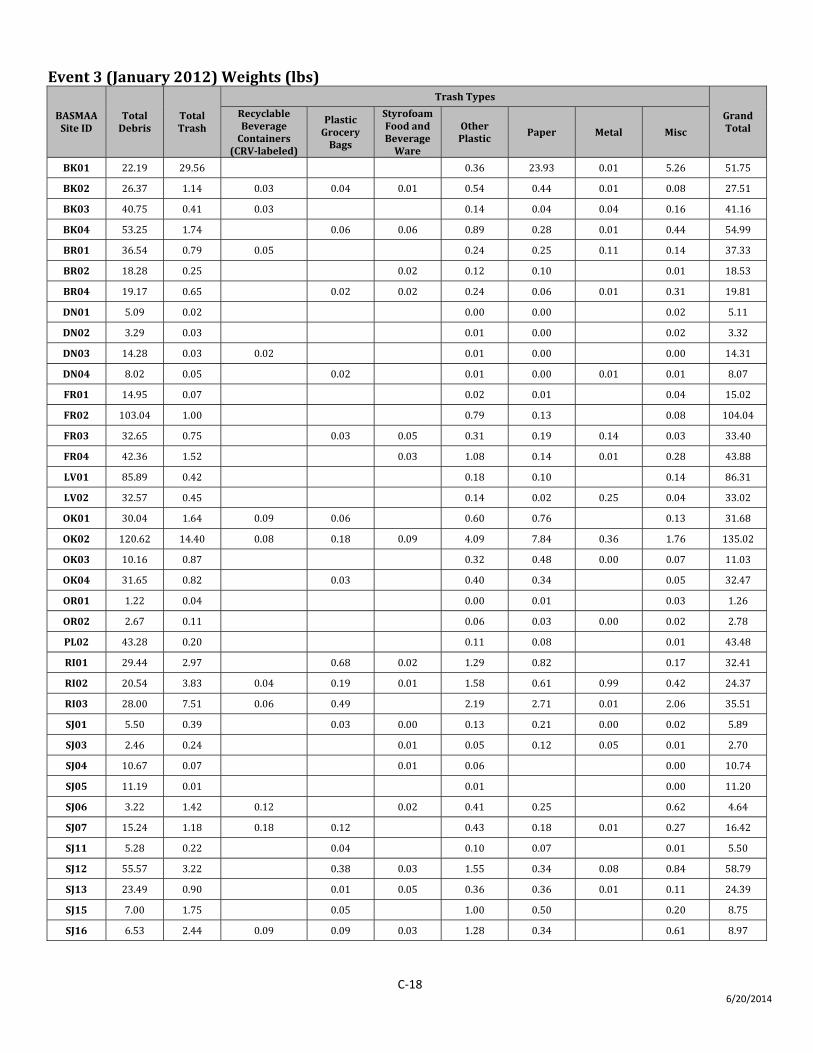
C‐18 6/20/2014
Event 3 (January 2012) Weights (lbs)
BASMAA Site ID
Total Debris
Total Trash
Trash Types
Grand Total
Recyclable Beverage Containers
(CRVlabeled)
Plastic Grocery Bags
Styrofoam Food and Beverage Ware
Other Plastic
Paper Metal Misc
BK01 22.19 29.56 0.36 23.93 0.01 5.26 51.75
BK02 26.37 1.14 0.03 0.04 0.01 0.54 0.44 0.01 0.08 27.51
BK03 40.75 0.41 0.03 0.14 0.04 0.04 0.16 41.16
BK04 53.25 1.74 0.06 0.06 0.89 0.28 0.01 0.44 54.99
BR01 36.54 0.79 0.05 0.24 0.25 0.11 0.14 37.33
BR02 18.28 0.25 0.02 0.12 0.10 0.01 18.53
BR04 19.17 0.65 0.02 0.02 0.24 0.06 0.01 0.31 19.81
DN01 5.09 0.02 0.00 0.00 0.02 5.11
DN02 3.29 0.03 0.01 0.00 0.02 3.32
DN03 14.28 0.03 0.02 0.01 0.00 0.00 14.31
DN04 8.02 0.05 0.02 0.01 0.00 0.01 0.01 8.07
FR01 14.95 0.07 0.02 0.01 0.04 15.02
FR02 103.04 1.00 0.79 0.13 0.08 104.04
FR03 32.65 0.75 0.03 0.05 0.31 0.19 0.14 0.03 33.40
FR04 42.36 1.52 0.03 1.08 0.14 0.01 0.28 43.88
LV01 85.89 0.42 0.18 0.10 0.14 86.31
LV02 32.57 0.45 0.14 0.02 0.25 0.04 33.02
OK01 30.04 1.64 0.09 0.06 0.60 0.76 0.13 31.68
OK02 120.62 14.40 0.08 0.18 0.09 4.09 7.84 0.36 1.76 135.02
OK03 10.16 0.87 0.32 0.48 0.00 0.07 11.03
OK04 31.65 0.82 0.03 0.40 0.34 0.05 32.47
OR01 1.22 0.04 0.00 0.01 0.03 1.26
OR02 2.67 0.11 0.06 0.03 0.00 0.02 2.78
PL02 43.28 0.20 0.11 0.08 0.01 43.48
RI01 29.44 2.97 0.68 0.02 1.29 0.82 0.17 32.41
RI02 20.54 3.83 0.04 0.19 0.01 1.58 0.61 0.99 0.42 24.37
RI03 28.00 7.51 0.06 0.49 2.19 2.71 0.01 2.06 35.51
SJ01 5.50 0.39 0.03 0.00 0.13 0.21 0.00 0.02 5.89
SJ03 2.46 0.24 0.01 0.05 0.12 0.05 0.01 2.70
SJ04 10.67 0.07 0.01 0.06 0.00 10.74
SJ05 11.19 0.01 0.01 0.00 11.20
SJ06 3.22 1.42 0.12 0.02 0.41 0.25 0.62 4.64
SJ07 15.24 1.18 0.18 0.12 0.43 0.18 0.01 0.27 16.42
SJ11 5.28 0.22 0.04 0.10 0.07 0.01 5.50
SJ12 55.57 3.22 0.38 0.03 1.55 0.34 0.08 0.84 58.79
SJ13 23.49 0.90 0.01 0.05 0.36 0.36 0.01 0.11 24.39
SJ15 7.00 1.75 0.05 1.00 0.50 0.20 8.75
SJ16 6.53 2.44 0.09 0.09 0.03 1.28 0.34 0.61 8.97
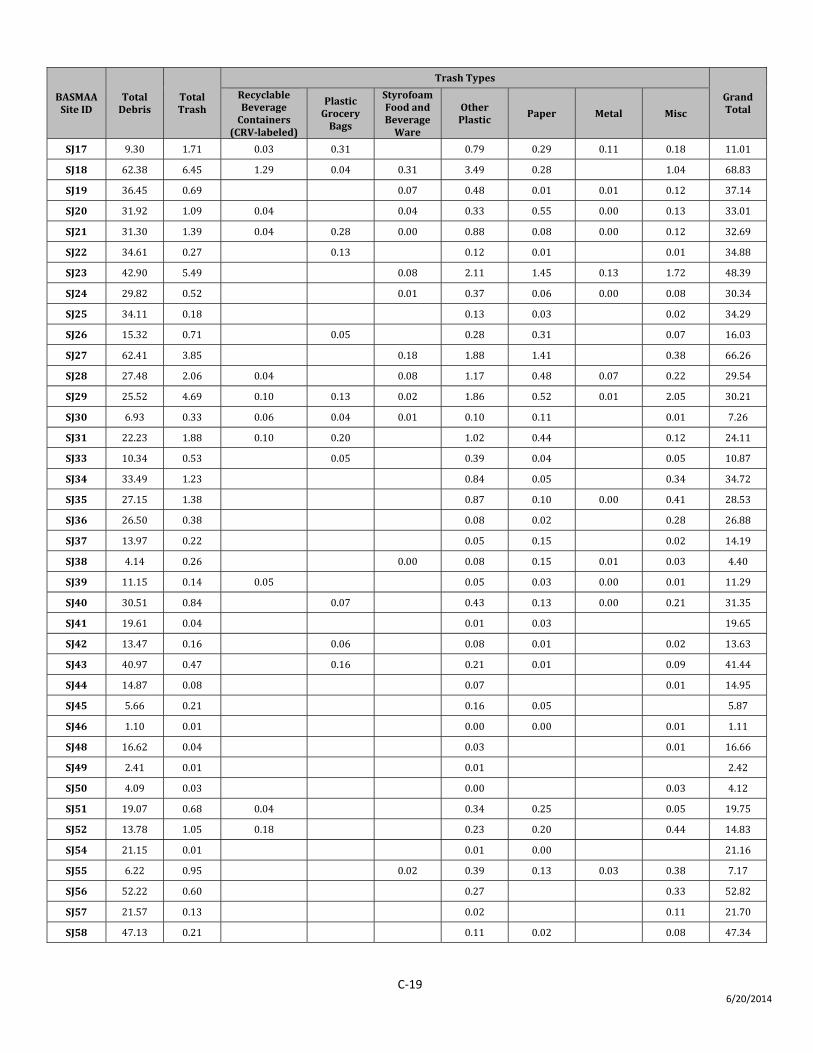
C‐19 6/20/2014
BASMAA Site ID
Total Debris
Total Trash
Trash Types
Grand Total
Recyclable Beverage Containers
(CRVlabeled)
Plastic Grocery Bags
Styrofoam Food and Beverage Ware
Other Plastic
Paper Metal Misc
SJ17 9.30 1.71 0.03 0.31 0.79 0.29 0.11 0.18 11.01
SJ18 62.38 6.45 1.29 0.04 0.31 3.49 0.28 1.04 68.83
SJ19 36.45 0.69 0.07 0.48 0.01 0.01 0.12 37.14
SJ20 31.92 1.09 0.04 0.04 0.33 0.55 0.00 0.13 33.01
SJ21 31.30 1.39 0.04 0.28 0.00 0.88 0.08 0.00 0.12 32.69
SJ22 34.61 0.27 0.13 0.12 0.01 0.01 34.88
SJ23 42.90 5.49 0.08 2.11 1.45 0.13 1.72 48.39
SJ24 29.82 0.52 0.01 0.37 0.06 0.00 0.08 30.34
SJ25 34.11 0.18 0.13 0.03 0.02 34.29
SJ26 15.32 0.71 0.05 0.28 0.31 0.07 16.03
SJ27 62.41 3.85 0.18 1.88 1.41 0.38 66.26
SJ28 27.48 2.06 0.04 0.08 1.17 0.48 0.07 0.22 29.54
SJ29 25.52 4.69 0.10 0.13 0.02 1.86 0.52 0.01 2.05 30.21
SJ30 6.93 0.33 0.06 0.04 0.01 0.10 0.11 0.01 7.26
SJ31 22.23 1.88 0.10 0.20 1.02 0.44 0.12 24.11
SJ33 10.34 0.53 0.05 0.39 0.04 0.05 10.87
SJ34 33.49 1.23 0.84 0.05 0.34 34.72
SJ35 27.15 1.38 0.87 0.10 0.00 0.41 28.53
SJ36 26.50 0.38 0.08 0.02 0.28 26.88
SJ37 13.97 0.22 0.05 0.15 0.02 14.19
SJ38 4.14 0.26 0.00 0.08 0.15 0.01 0.03 4.40
SJ39 11.15 0.14 0.05 0.05 0.03 0.00 0.01 11.29
SJ40 30.51 0.84 0.07 0.43 0.13 0.00 0.21 31.35
SJ41 19.61 0.04 0.01 0.03 19.65
SJ42 13.47 0.16 0.06 0.08 0.01 0.02 13.63
SJ43 40.97 0.47 0.16 0.21 0.01 0.09 41.44
SJ44 14.87 0.08 0.07 0.01 14.95
SJ45 5.66 0.21 0.16 0.05 5.87
SJ46 1.10 0.01 0.00 0.00 0.01 1.11
SJ48 16.62 0.04 0.03 0.01 16.66
SJ49 2.41 0.01 0.01 2.42
SJ50 4.09 0.03 0.00 0.03 4.12
SJ51 19.07 0.68 0.04 0.34 0.25 0.05 19.75
SJ52 13.78 1.05 0.18 0.23 0.20 0.44 14.83
SJ54 21.15 0.01 0.01 0.00 21.16
SJ55 6.22 0.95 0.02 0.39 0.13 0.03 0.38 7.17
SJ56 52.22 0.60 0.27 0.33 52.82
SJ57 21.57 0.13 0.02 0.11 21.70
SJ58 47.13 0.21 0.11 0.02 0.08 47.34
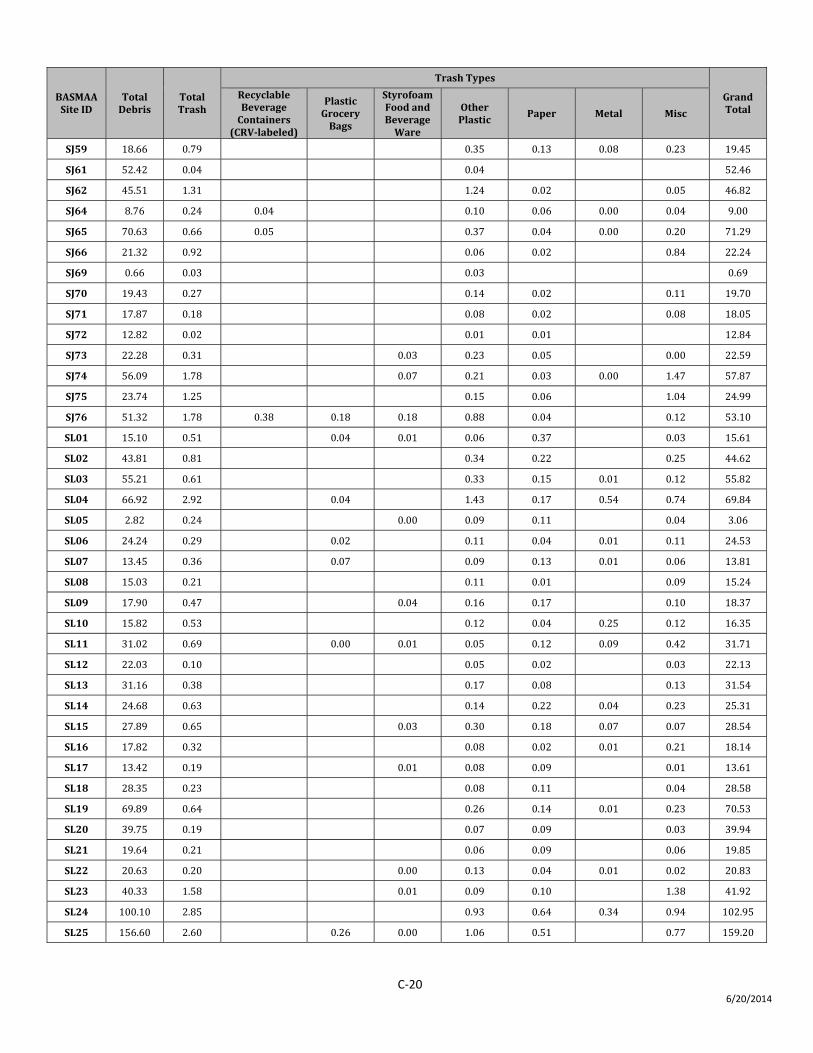
C‐20 6/20/2014
BASMAA Site ID
Total Debris
Total Trash
Trash Types
Grand Total
Recyclable Beverage Containers
(CRVlabeled)
Plastic Grocery Bags
Styrofoam Food and Beverage Ware
Other Plastic
Paper Metal Misc
SJ59 18.66 0.79 0.35 0.13 0.08 0.23 19.45
SJ61 52.42 0.04 0.04 52.46
SJ62 45.51 1.31 1.24 0.02 0.05 46.82
SJ64 8.76 0.24 0.04 0.10 0.06 0.00 0.04 9.00
SJ65 70.63 0.66 0.05 0.37 0.04 0.00 0.20 71.29
SJ66 21.32 0.92 0.06 0.02 0.84 22.24
SJ69 0.66 0.03 0.03 0.69
SJ70 19.43 0.27 0.14 0.02 0.11 19.70
SJ71 17.87 0.18 0.08 0.02 0.08 18.05
SJ72 12.82 0.02 0.01 0.01 12.84
SJ73 22.28 0.31 0.03 0.23 0.05 0.00 22.59
SJ74 56.09 1.78 0.07 0.21 0.03 0.00 1.47 57.87
SJ75 23.74 1.25 0.15 0.06 1.04 24.99
SJ76 51.32 1.78 0.38 0.18 0.18 0.88 0.04 0.12 53.10
SL01 15.10 0.51 0.04 0.01 0.06 0.37 0.03 15.61
SL02 43.81 0.81 0.34 0.22 0.25 44.62
SL03 55.21 0.61 0.33 0.15 0.01 0.12 55.82
SL04 66.92 2.92 0.04 1.43 0.17 0.54 0.74 69.84
SL05 2.82 0.24 0.00 0.09 0.11 0.04 3.06
SL06 24.24 0.29 0.02 0.11 0.04 0.01 0.11 24.53
SL07 13.45 0.36 0.07 0.09 0.13 0.01 0.06 13.81
SL08 15.03 0.21 0.11 0.01 0.09 15.24
SL09 17.90 0.47 0.04 0.16 0.17 0.10 18.37
SL10 15.82 0.53 0.12 0.04 0.25 0.12 16.35
SL11 31.02 0.69 0.00 0.01 0.05 0.12 0.09 0.42 31.71
SL12 22.03 0.10 0.05 0.02 0.03 22.13
SL13 31.16 0.38 0.17 0.08 0.13 31.54
SL14 24.68 0.63 0.14 0.22 0.04 0.23 25.31
SL15 27.89 0.65 0.03 0.30 0.18 0.07 0.07 28.54
SL16 17.82 0.32 0.08 0.02 0.01 0.21 18.14
SL17 13.42 0.19 0.01 0.08 0.09 0.01 13.61
SL18 28.35 0.23 0.08 0.11 0.04 28.58
SL19 69.89 0.64 0.26 0.14 0.01 0.23 70.53
SL20 39.75 0.19 0.07 0.09 0.03 39.94
SL21 19.64 0.21 0.06 0.09 0.06 19.85
SL22 20.63 0.20 0.00 0.13 0.04 0.01 0.02 20.83
SL23 40.33 1.58 0.01 0.09 0.10 1.38 41.92
SL24 100.10 2.85 0.93 0.64 0.34 0.94 102.95
SL25 156.60 2.60 0.26 0.00 1.06 0.51 0.77 159.20
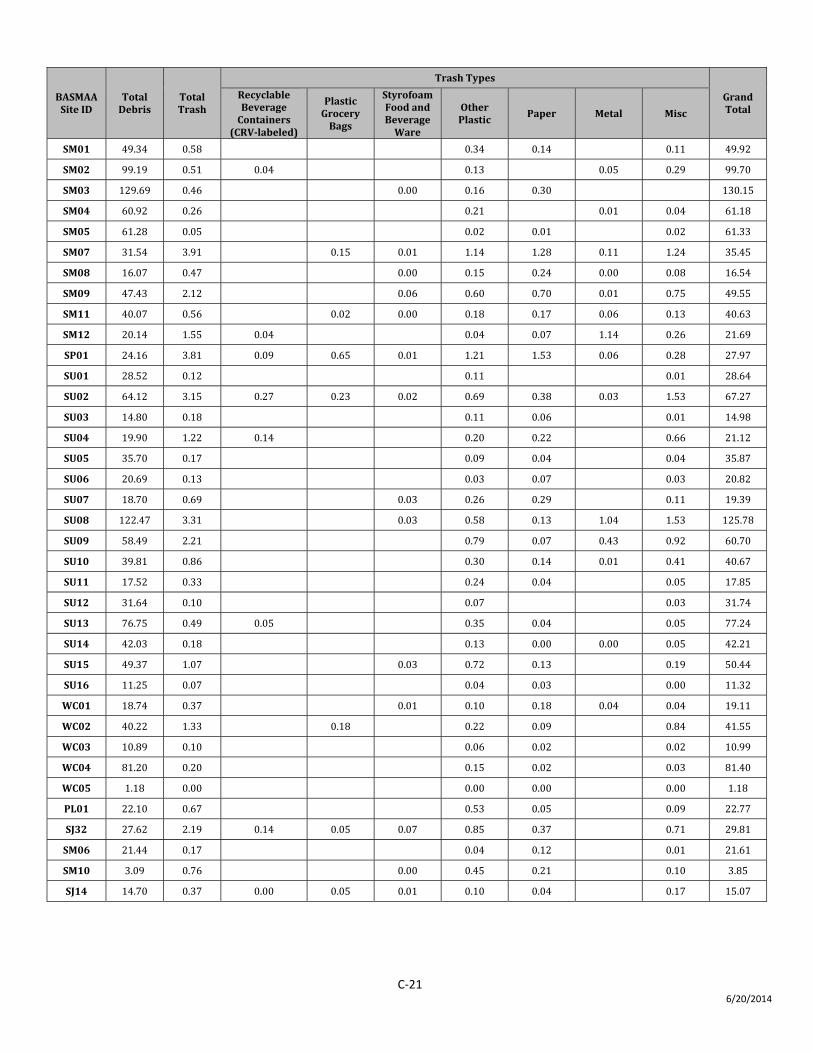
C‐21 6/20/2014
BASMAA Site ID
Total Debris
Total Trash
Trash Types
Grand Total
Recyclable Beverage Containers
(CRVlabeled)
Plastic Grocery Bags
Styrofoam Food and Beverage Ware
Other Plastic
Paper Metal Misc
SM01 49.34 0.58 0.34 0.14 0.11 49.92
SM02 99.19 0.51 0.04 0.13 0.05 0.29 99.70
SM03 129.69 0.46 0.00 0.16 0.30 130.15
SM04 60.92 0.26 0.21 0.01 0.04 61.18
SM05 61.28 0.05 0.02 0.01 0.02 61.33
SM07 31.54 3.91 0.15 0.01 1.14 1.28 0.11 1.24 35.45
SM08 16.07 0.47 0.00 0.15 0.24 0.00 0.08 16.54
SM09 47.43 2.12 0.06 0.60 0.70 0.01 0.75 49.55
SM11 40.07 0.56 0.02 0.00 0.18 0.17 0.06 0.13 40.63
SM12 20.14 1.55 0.04 0.04 0.07 1.14 0.26 21.69
SP01 24.16 3.81 0.09 0.65 0.01 1.21 1.53 0.06 0.28 27.97
SU01 28.52 0.12 0.11 0.01 28.64
SU02 64.12 3.15 0.27 0.23 0.02 0.69 0.38 0.03 1.53 67.27
SU03 14.80 0.18 0.11 0.06 0.01 14.98
SU04 19.90 1.22 0.14 0.20 0.22 0.66 21.12
SU05 35.70 0.17 0.09 0.04 0.04 35.87
SU06 20.69 0.13 0.03 0.07 0.03 20.82
SU07 18.70 0.69 0.03 0.26 0.29 0.11 19.39
SU08 122.47 3.31 0.03 0.58 0.13 1.04 1.53 125.78
SU09 58.49 2.21 0.79 0.07 0.43 0.92 60.70
SU10 39.81 0.86 0.30 0.14 0.01 0.41 40.67
SU11 17.52 0.33 0.24 0.04 0.05 17.85
SU12 31.64 0.10 0.07 0.03 31.74
SU13 76.75 0.49 0.05 0.35 0.04 0.05 77.24
SU14 42.03 0.18 0.13 0.00 0.00 0.05 42.21
SU15 49.37 1.07 0.03 0.72 0.13 0.19 50.44
SU16 11.25 0.07 0.04 0.03 0.00 11.32
WC01 18.74 0.37 0.01 0.10 0.18 0.04 0.04 19.11
WC02 40.22 1.33 0.18 0.22 0.09 0.84 41.55
WC03 10.89 0.10 0.06 0.02 0.02 10.99
WC04 81.20 0.20 0.15 0.02 0.03 81.40
WC05 1.18 0.00 0.00 0.00 0.00 1.18
PL01 22.10 0.67 0.53 0.05 0.09 22.77
SJ32 27.62 2.19 0.14 0.05 0.07 0.85 0.37 0.71 29.81
SM06 21.44 0.17 0.04 0.12 0.01 21.61
SM10 3.09 0.76 0.00 0.45 0.21 0.10 3.85
SJ14 14.70 0.37 0.00 0.05 0.01 0.10 0.04 0.17 15.07
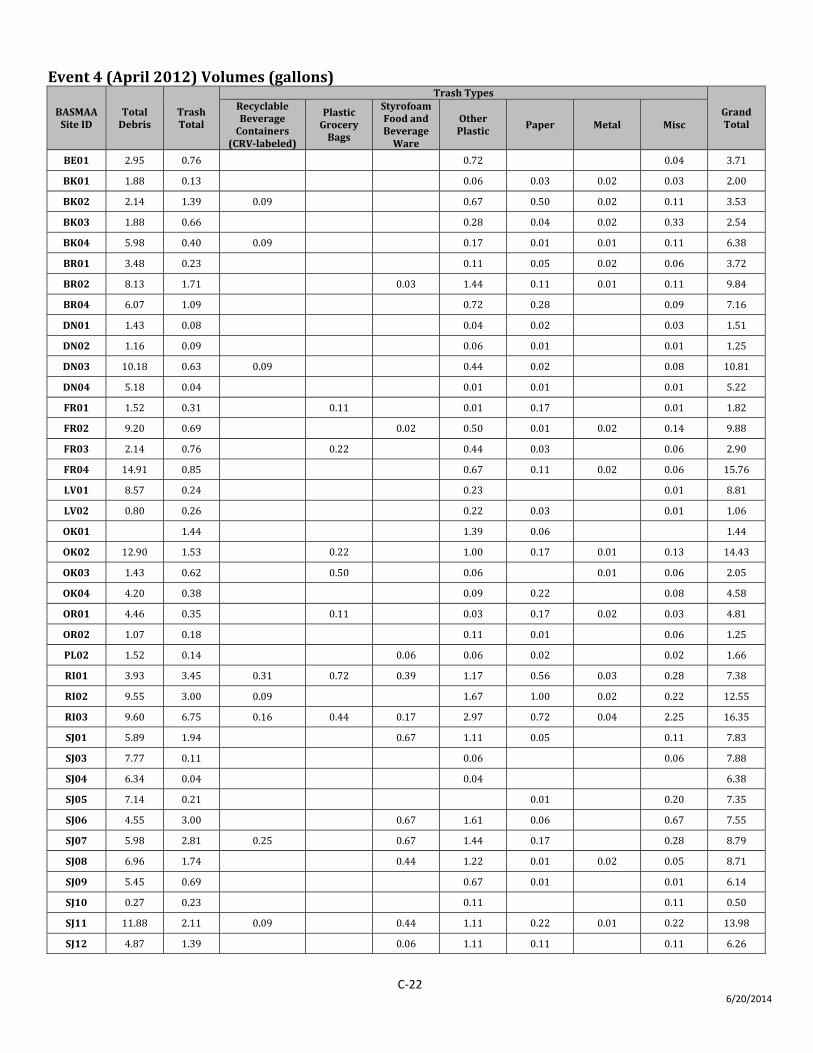
C‐22 6/20/2014
Event 4 (April 2012) Volumes (gallons)
BASMAA Site ID
Total Debris
Trash Total
Trash Types
Grand Total
Recyclable Beverage Containers
(CRVlabeled)
Plastic Grocery Bags
Styrofoam Food and Beverage Ware
Other Plastic
Paper Metal Misc
BE01 2.95 0.76 0.72 0.04 3.71
BK01 1.88 0.13 0.06 0.03 0.02 0.03 2.00
BK02 2.14 1.39 0.09 0.67 0.50 0.02 0.11 3.53
BK03 1.88 0.66 0.28 0.04 0.02 0.33 2.54
BK04 5.98 0.40 0.09 0.17 0.01 0.01 0.11 6.38
BR01 3.48 0.23 0.11 0.05 0.02 0.06 3.72
BR02 8.13 1.71 0.03 1.44 0.11 0.01 0.11 9.84
BR04 6.07 1.09 0.72 0.28 0.09 7.16
DN01 1.43 0.08 0.04 0.02 0.03 1.51
DN02 1.16 0.09 0.06 0.01 0.01 1.25
DN03 10.18 0.63 0.09 0.44 0.02 0.08 10.81
DN04 5.18 0.04 0.01 0.01 0.01 5.22
FR01 1.52 0.31 0.11 0.01 0.17 0.01 1.82
FR02 9.20 0.69 0.02 0.50 0.01 0.02 0.14 9.88
FR03 2.14 0.76 0.22 0.44 0.03 0.06 2.90
FR04 14.91 0.85 0.67 0.11 0.02 0.06 15.76
LV01 8.57 0.24 0.23 0.01 8.81
LV02 0.80 0.26 0.22 0.03 0.01 1.06
OK01 1.44 1.39 0.06 1.44
OK02 12.90 1.53 0.22 1.00 0.17 0.01 0.13 14.43
OK03 1.43 0.62 0.50 0.06 0.01 0.06 2.05
OK04 4.20 0.38 0.09 0.22 0.08 4.58
OR01 4.46 0.35 0.11 0.03 0.17 0.02 0.03 4.81
OR02 1.07 0.18 0.11 0.01 0.06 1.25
PL02 1.52 0.14 0.06 0.06 0.02 0.02 1.66
RI01 3.93 3.45 0.31 0.72 0.39 1.17 0.56 0.03 0.28 7.38
RI02 9.55 3.00 0.09 1.67 1.00 0.02 0.22 12.55
RI03 9.60 6.75 0.16 0.44 0.17 2.97 0.72 0.04 2.25 16.35
SJ01 5.89 1.94 0.67 1.11 0.05 0.11 7.83
SJ03 7.77 0.11 0.06 0.06 7.88
SJ04 6.34 0.04 0.04 6.38
SJ05 7.14 0.21 0.01 0.20 7.35
SJ06 4.55 3.00 0.67 1.61 0.06 0.67 7.55
SJ07 5.98 2.81 0.25 0.67 1.44 0.17 0.28 8.79
SJ08 6.96 1.74 0.44 1.22 0.01 0.02 0.05 8.71
SJ09 5.45 0.69 0.67 0.01 0.01 6.14
SJ10 0.27 0.23 0.11 0.11 0.50
SJ11 11.88 2.11 0.09 0.44 1.11 0.22 0.01 0.22 13.98
SJ12 4.87 1.39 0.06 1.11 0.11 0.11 6.26
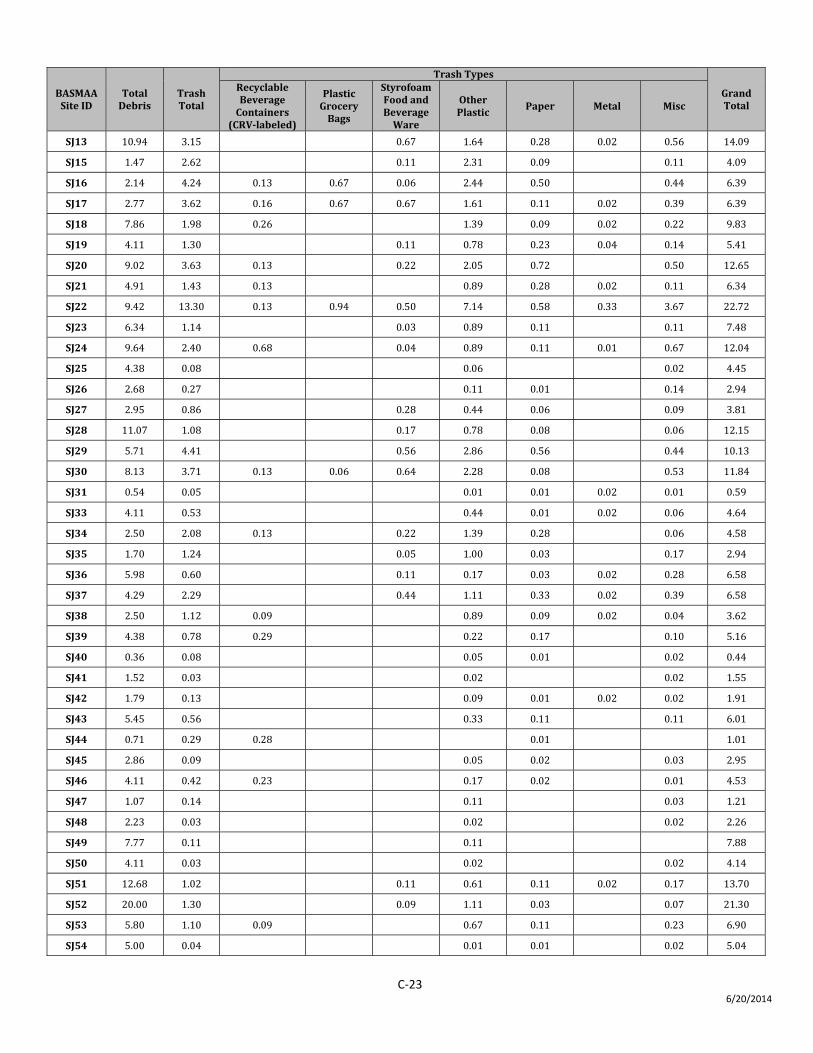
C‐23 6/20/2014
BASMAA Site ID
Total Debris
Trash Total
Trash Types
Grand Total
Recyclable Beverage Containers
(CRVlabeled)
Plastic Grocery Bags
Styrofoam Food and Beverage Ware
Other Plastic
Paper Metal Misc
SJ13 10.94 3.15 0.67 1.64 0.28 0.02 0.56 14.09
SJ15 1.47 2.62 0.11 2.31 0.09 0.11 4.09
SJ16 2.14 4.24 0.13 0.67 0.06 2.44 0.50 0.44 6.39
SJ17 2.77 3.62 0.16 0.67 0.67 1.61 0.11 0.02 0.39 6.39
SJ18 7.86 1.98 0.26 1.39 0.09 0.02 0.22 9.83
SJ19 4.11 1.30 0.11 0.78 0.23 0.04 0.14 5.41
SJ20 9.02 3.63 0.13 0.22 2.05 0.72 0.50 12.65
SJ21 4.91 1.43 0.13 0.89 0.28 0.02 0.11 6.34
SJ22 9.42 13.30 0.13 0.94 0.50 7.14 0.58 0.33 3.67 22.72
SJ23 6.34 1.14 0.03 0.89 0.11 0.11 7.48
SJ24 9.64 2.40 0.68 0.04 0.89 0.11 0.01 0.67 12.04
SJ25 4.38 0.08 0.06 0.02 4.45
SJ26 2.68 0.27 0.11 0.01 0.14 2.94
SJ27 2.95 0.86 0.28 0.44 0.06 0.09 3.81
SJ28 11.07 1.08 0.17 0.78 0.08 0.06 12.15
SJ29 5.71 4.41 0.56 2.86 0.56 0.44 10.13
SJ30 8.13 3.71 0.13 0.06 0.64 2.28 0.08 0.53 11.84
SJ31 0.54 0.05 0.01 0.01 0.02 0.01 0.59
SJ33 4.11 0.53 0.44 0.01 0.02 0.06 4.64
SJ34 2.50 2.08 0.13 0.22 1.39 0.28 0.06 4.58
SJ35 1.70 1.24 0.05 1.00 0.03 0.17 2.94
SJ36 5.98 0.60 0.11 0.17 0.03 0.02 0.28 6.58
SJ37 4.29 2.29 0.44 1.11 0.33 0.02 0.39 6.58
SJ38 2.50 1.12 0.09 0.89 0.09 0.02 0.04 3.62
SJ39 4.38 0.78 0.29 0.22 0.17 0.10 5.16
SJ40 0.36 0.08 0.05 0.01 0.02 0.44
SJ41 1.52 0.03 0.02 0.02 1.55
SJ42 1.79 0.13 0.09 0.01 0.02 0.02 1.91
SJ43 5.45 0.56 0.33 0.11 0.11 6.01
SJ44 0.71 0.29 0.28 0.01 1.01
SJ45 2.86 0.09 0.05 0.02 0.03 2.95
SJ46 4.11 0.42 0.23 0.17 0.02 0.01 4.53
SJ47 1.07 0.14 0.11 0.03 1.21
SJ48 2.23 0.03 0.02 0.02 2.26
SJ49 7.77 0.11 0.11 7.88
SJ50 4.11 0.03 0.02 0.02 4.14
SJ51 12.68 1.02 0.11 0.61 0.11 0.02 0.17 13.70
SJ52 20.00 1.30 0.09 1.11 0.03 0.07 21.30
SJ53 5.80 1.10 0.09 0.67 0.11 0.23 6.90
SJ54 5.00 0.04 0.01 0.01 0.02 5.04
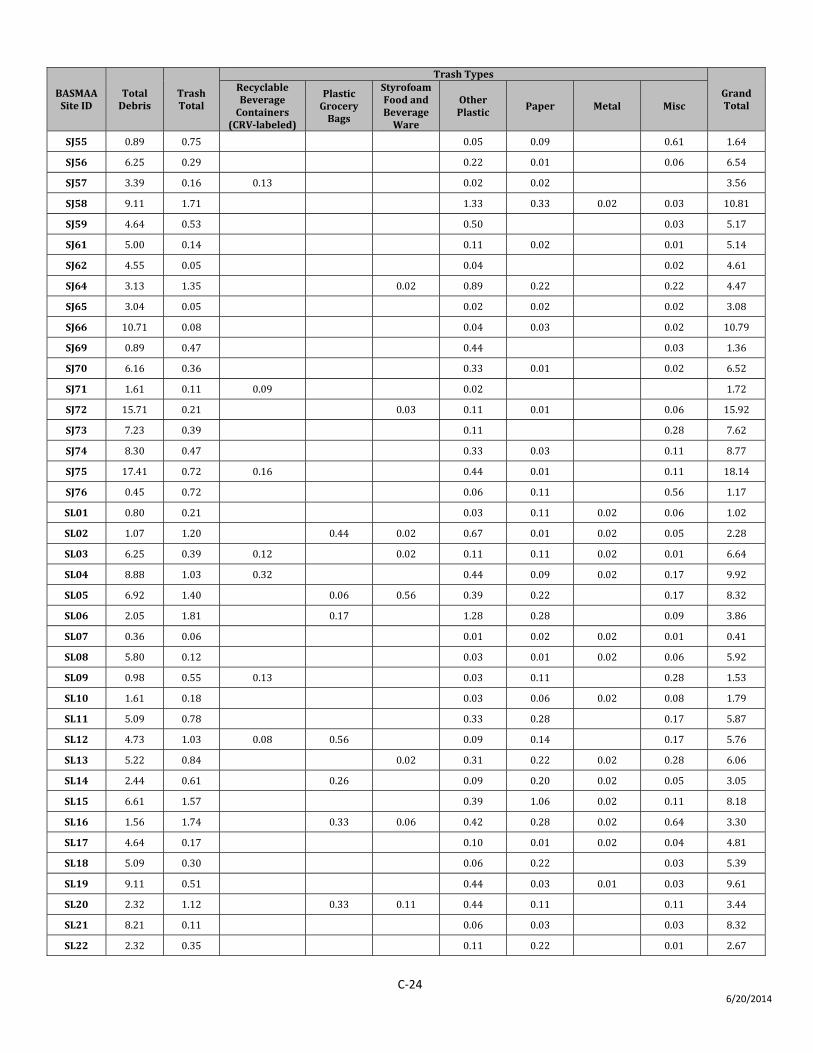
C‐24 6/20/2014
BASMAA Site ID
Total Debris
Trash Total
Trash Types
Grand Total
Recyclable Beverage Containers
(CRVlabeled)
Plastic Grocery Bags
Styrofoam Food and Beverage Ware
Other Plastic
Paper Metal Misc
SJ55 0.89 0.75 0.05 0.09 0.61 1.64
SJ56 6.25 0.29 0.22 0.01 0.06 6.54
SJ57 3.39 0.16 0.13 0.02 0.02 3.56
SJ58 9.11 1.71 1.33 0.33 0.02 0.03 10.81
SJ59 4.64 0.53 0.50 0.03 5.17
SJ61 5.00 0.14 0.11 0.02 0.01 5.14
SJ62 4.55 0.05 0.04 0.02 4.61
SJ64 3.13 1.35 0.02 0.89 0.22 0.22 4.47
SJ65 3.04 0.05 0.02 0.02 0.02 3.08
SJ66 10.71 0.08 0.04 0.03 0.02 10.79
SJ69 0.89 0.47 0.44 0.03 1.36
SJ70 6.16 0.36 0.33 0.01 0.02 6.52
SJ71 1.61 0.11 0.09 0.02 1.72
SJ72 15.71 0.21 0.03 0.11 0.01 0.06 15.92
SJ73 7.23 0.39 0.11 0.28 7.62
SJ74 8.30 0.47 0.33 0.03 0.11 8.77
SJ75 17.41 0.72 0.16 0.44 0.01 0.11 18.14
SJ76 0.45 0.72 0.06 0.11 0.56 1.17
SL01 0.80 0.21 0.03 0.11 0.02 0.06 1.02
SL02 1.07 1.20 0.44 0.02 0.67 0.01 0.02 0.05 2.28
SL03 6.25 0.39 0.12 0.02 0.11 0.11 0.02 0.01 6.64
SL04 8.88 1.03 0.32 0.44 0.09 0.02 0.17 9.92
SL05 6.92 1.40 0.06 0.56 0.39 0.22 0.17 8.32
SL06 2.05 1.81 0.17 1.28 0.28 0.09 3.86
SL07 0.36 0.06 0.01 0.02 0.02 0.01 0.41
SL08 5.80 0.12 0.03 0.01 0.02 0.06 5.92
SL09 0.98 0.55 0.13 0.03 0.11 0.28 1.53
SL10 1.61 0.18 0.03 0.06 0.02 0.08 1.79
SL11 5.09 0.78 0.33 0.28 0.17 5.87
SL12 4.73 1.03 0.08 0.56 0.09 0.14 0.17 5.76
SL13 5.22 0.84 0.02 0.31 0.22 0.02 0.28 6.06
SL14 2.44 0.61 0.26 0.09 0.20 0.02 0.05 3.05
SL15 6.61 1.57 0.39 1.06 0.02 0.11 8.18
SL16 1.56 1.74 0.33 0.06 0.42 0.28 0.02 0.64 3.30
SL17 4.64 0.17 0.10 0.01 0.02 0.04 4.81
SL18 5.09 0.30 0.06 0.22 0.03 5.39
SL19 9.11 0.51 0.44 0.03 0.01 0.03 9.61
SL20 2.32 1.12 0.33 0.11 0.44 0.11 0.11 3.44
SL21 8.21 0.11 0.06 0.03 0.03 8.32
SL22 2.32 0.35 0.11 0.22 0.01 2.67

C‐25 6/20/2014
BASMAA Site ID
Total Debris
Trash Total
Trash Types
Grand Total
Recyclable Beverage Containers
(CRVlabeled)
Plastic Grocery Bags
Styrofoam Food and Beverage Ware
Other Plastic
Paper Metal Misc
SL23 6.16 0.28 0.11 0.11 0.06 6.44
SL24 6.43 1.20 0.22 0.02 0.67 0.06 0.02 0.22 7.63
SL25 18.97 0.98 0.67 0.14 0.02 0.16 19.95
SM01 18.30 1.00 0.72 0.22 0.06 19.30
SM02 9.73 0.77 0.14 0.28 0.09 0.22 0.02 0.01 0.01 10.50
SM03 1.52 0.20 0.14 0.02 0.04 1.71
SM04 5.36 0.08 0.03 0.01 0.02 0.03 5.44
SM05 11.70 0.06 0.02 0.02 0.02 0.01 11.76
SM07 10.36 3.99 0.72 0.11 1.89 0.81 0.02 0.44 14.35
SM08 2.05 1.52 1.28 0.14 0.02 0.09 3.57
SM09 8.39 0.36 0.11 0.23 0.03 8.76
SM11 6.96 0.13 0.08 0.02 0.04 7.09
SM12 1.07 0.06 0.04 0.01 0.01 1.13
SP01 2.90 8.37 0.16 3.53 0.53 3.04 0.56 0.02 0.56 11.28
SU01 7.50 0.16 0.05 0.04 0.02 0.06 7.66
SU02 3.84 0.98 0.13 0.72 0.01 0.11 4.82
SU03 9.82 0.85 0.67 0.11 0.02 0.06 10.67
SU04 13.84 1.02 0.44 0.22 0.02 0.33 14.85
SU05 6.25 1.56 0.61 0.78 0.11 0.06 7.81
SU06 6.96 0.23 0.22 0.01 7.20
SU07 16.34 0.74 0.02 0.50 0.11 0.11 17.08
SU08 25.00 0.46 0.03 0.28 0.11 0.01 0.03 25.46
SU09 19.91 1.14 0.56 0.44 0.02 0.02 0.11 21.05
SU10 19.20 0.60 0.33 0.03 0.02 0.22 19.79
SU11 16.34 1.33 0.01 1.06 0.04 0.22 17.67
SU12 9.55 0.12 0.03 0.06 0.02 0.01 9.67
SU13 20.45 0.33 0.28 0.02 0.04 20.78
SU14 31.16 0.65 0.11 0.44 0.01 0.02 0.06 31.81
SU15 20.27 0.72 0.44 0.04 0.02 0.22 20.99
SU16 8.84 0.53 0.44 0.08 0.01 9.37
WC01 9.46 0.56 0.44 0.06 0.06 10.02
WC02 2.05 0.07 0.02 0.04 0.02 2.12
WC03 2.14 0.10 0.05 0.03 0.03 2.24
WC04 37.86 0.28 0.22 0.03 0.01 0.03 38.14
WC05 7.05 0.03 0.02 0.02 7.08

C‐26 6/20/2014
Event 4 (April 2012) Weights (lbs)
BASMAA Site ID
Debris Trash Total
Trash Types
Grand Total
Recyclable Beverage Containers
(CRVlabeled)
Plastic Grocery Bags
Styrofoam Food and Beverage Ware
Other Plastic
Paper Metal Misc.
BE01 28.87 0.63 0.38 0.25 29.50
BK01 19.88 0.63 0.13 0.30 0.02 0.18 20.51
BK02 8.89 0.98 0.04 0.19 0.22 0.01 0.52 9.87
BK03 24.15 1.15 0.40 0.15 0.01 0.59 25.30
BK04 76.37 2.55 0.48 0.65 0.13 0.04 1.25 78.92
BR01 27.75 0.61 0.27 0.10 0.01 0.23 28.37
BR02 28.18 0.82 0.01 0.39 0.19 0.01 0.22 29.00
BR04 23.81 0.67 0.18 0.35 0.14 24.48
DN01 6.33 0.14 0.06 0.00 0.08 6.47
DN02 7.24 0.10 0.06 0.01 0.03 7.34
DN03 47.96 0.51 0.07 0.27 0.01 0.16 48.47
DN04 24.19 0.08 0.03 0.03 0.02 24.27
FR01 12.20 0.10 0.02 0.02 0.04 0.02 12.30
FR02 64.14 1.66 0.00 1.02 0.03 0.05 0.56 65.80
FR03 8.30 0.63 0.16 0.20 0.06 0.21 8.92
FR04 118.92 1.72 0.81 0.60 0.02 0.29 120.64
LV01 46.78 0.14 0.11 0.03 46.92
LV02 1.06 0.11 0.09 0.01 0.01 1.17
OK01 1.34 1.24 0.10 1.34
OK02 91.50 2.57 0.20 1.09 0.60 0.34 0.35 94.07
OK03 18.55 2.07 0.82 0.36 0.11 0.78 20.62
OK04 33.57 0.46 0.06 0.31 0.09 34.03
OR01 24.24 0.57 0.16 0.00 0.37 0.00 0.03 24.81
OR02 5.77 0.29 0.13 0.05 0.11 6.06
PL02 9.48 0.23 0.01 0.18 0.03 0.01 9.71
RI01 23.59 4.71 0.10 0.31 0.09 0.86 2.63 0.02 0.70 28.31
RI02 28.40 5.76 0.03 1.05 4.21 0.00 0.47 34.16
RI03 80.49 19.17 0.08 0.12 0.04 4.87 2.80 0.05 11.22 99.66
SJ01 21.10 0.66 0.08 0.32 0.17 0.09 21.76
SJ03 34.54 0.19 0.07 0.12 34.73
SJ04 31.30 0.02 0.02 31.32
SJ05 35.68 0.20 0.01 0.19 35.88
SJ06 27.40 2.65 0.06 1.32 0.09 1.18 30.05
SJ07 41.89 2.91 0.12 0.13 1.31 0.64 0.71 44.80
SJ08 38.49 1.59 0.16 1.37 0.01 0.00 0.04 40.08
SJ09 8.31 0.12 0.10 0.01 0.02 8.43
SJ10 0.25 0.01 0.01 0.00 0.25
SJ11 102.12 4.65 0.17 0.07 2.61 0.73 0.02 1.05 106.77
SJ12 26.68 2.31 0.01 1.63 0.33 0.35 28.99
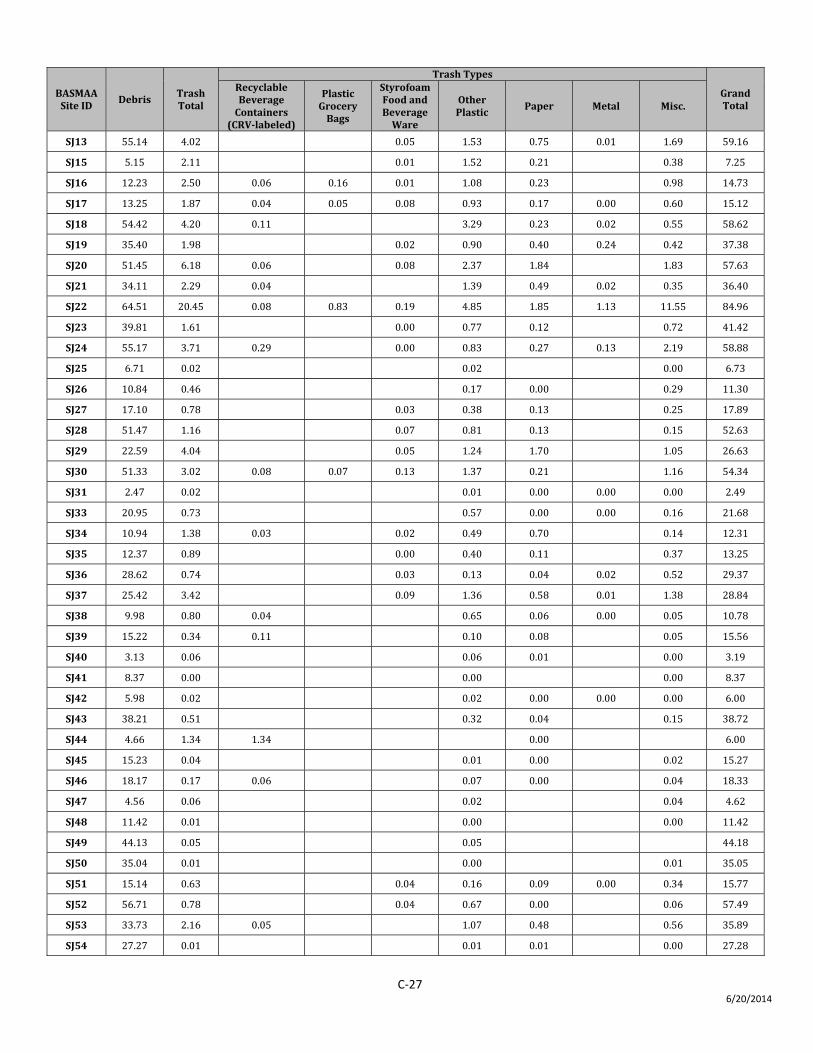
C‐27 6/20/2014
BASMAA Site ID
Debris Trash Total
Trash Types
Grand Total
Recyclable Beverage Containers
(CRVlabeled)
Plastic Grocery Bags
Styrofoam Food and Beverage Ware
Other Plastic
Paper Metal Misc.
SJ13 55.14 4.02 0.05 1.53 0.75 0.01 1.69 59.16
SJ15 5.15 2.11 0.01 1.52 0.21 0.38 7.25
SJ16 12.23 2.50 0.06 0.16 0.01 1.08 0.23 0.98 14.73
SJ17 13.25 1.87 0.04 0.05 0.08 0.93 0.17 0.00 0.60 15.12
SJ18 54.42 4.20 0.11 3.29 0.23 0.02 0.55 58.62
SJ19 35.40 1.98 0.02 0.90 0.40 0.24 0.42 37.38
SJ20 51.45 6.18 0.06 0.08 2.37 1.84 1.83 57.63
SJ21 34.11 2.29 0.04 1.39 0.49 0.02 0.35 36.40
SJ22 64.51 20.45 0.08 0.83 0.19 4.85 1.85 1.13 11.55 84.96
SJ23 39.81 1.61 0.00 0.77 0.12 0.72 41.42
SJ24 55.17 3.71 0.29 0.00 0.83 0.27 0.13 2.19 58.88
SJ25 6.71 0.02 0.02 0.00 6.73
SJ26 10.84 0.46 0.17 0.00 0.29 11.30
SJ27 17.10 0.78 0.03 0.38 0.13 0.25 17.89
SJ28 51.47 1.16 0.07 0.81 0.13 0.15 52.63
SJ29 22.59 4.04 0.05 1.24 1.70 1.05 26.63
SJ30 51.33 3.02 0.08 0.07 0.13 1.37 0.21 1.16 54.34
SJ31 2.47 0.02 0.01 0.00 0.00 0.00 2.49
SJ33 20.95 0.73 0.57 0.00 0.00 0.16 21.68
SJ34 10.94 1.38 0.03 0.02 0.49 0.70 0.14 12.31
SJ35 12.37 0.89 0.00 0.40 0.11 0.37 13.25
SJ36 28.62 0.74 0.03 0.13 0.04 0.02 0.52 29.37
SJ37 25.42 3.42 0.09 1.36 0.58 0.01 1.38 28.84
SJ38 9.98 0.80 0.04 0.65 0.06 0.00 0.05 10.78
SJ39 15.22 0.34 0.11 0.10 0.08 0.05 15.56
SJ40 3.13 0.06 0.06 0.01 0.00 3.19
SJ41 8.37 0.00 0.00 0.00 8.37
SJ42 5.98 0.02 0.02 0.00 0.00 0.00 6.00
SJ43 38.21 0.51 0.32 0.04 0.15 38.72
SJ44 4.66 1.34 1.34 0.00 6.00
SJ45 15.23 0.04 0.01 0.00 0.02 15.27
SJ46 18.17 0.17 0.06 0.07 0.00 0.04 18.33
SJ47 4.56 0.06 0.02 0.04 4.62
SJ48 11.42 0.01 0.00 0.00 11.42
SJ49 44.13 0.05 0.05 44.18
SJ50 35.04 0.01 0.00 0.01 35.05
SJ51 15.14 0.63 0.04 0.16 0.09 0.00 0.34 15.77
SJ52 56.71 0.78 0.04 0.67 0.00 0.06 57.49
SJ53 33.73 2.16 0.05 1.07 0.48 0.56 35.89
SJ54 27.27 0.01 0.01 0.01 0.00 27.28
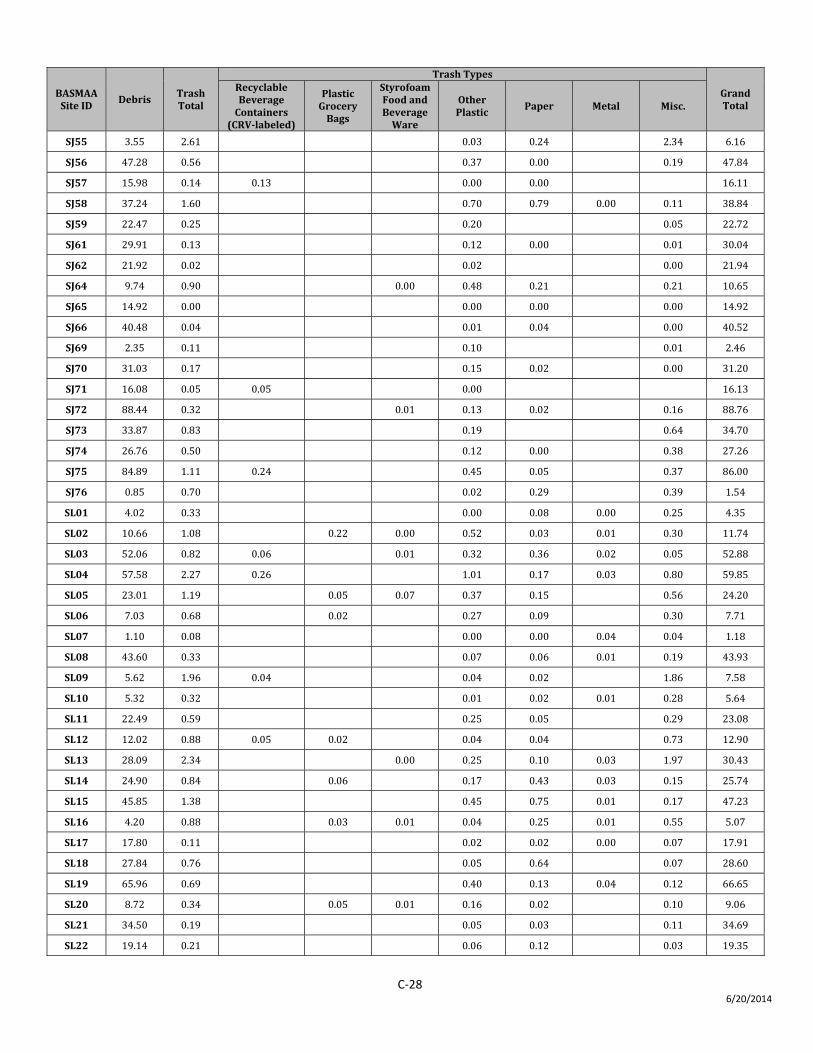
C‐28 6/20/2014
BASMAA Site ID
Debris Trash Total
Trash Types
Grand Total
Recyclable Beverage Containers
(CRVlabeled)
Plastic Grocery Bags
Styrofoam Food and Beverage Ware
Other Plastic
Paper Metal Misc.
SJ55 3.55 2.61 0.03 0.24 2.34 6.16
SJ56 47.28 0.56 0.37 0.00 0.19 47.84
SJ57 15.98 0.14 0.13 0.00 0.00 16.11
SJ58 37.24 1.60 0.70 0.79 0.00 0.11 38.84
SJ59 22.47 0.25 0.20 0.05 22.72
SJ61 29.91 0.13 0.12 0.00 0.01 30.04
SJ62 21.92 0.02 0.02 0.00 21.94
SJ64 9.74 0.90 0.00 0.48 0.21 0.21 10.65
SJ65 14.92 0.00 0.00 0.00 0.00 14.92
SJ66 40.48 0.04 0.01 0.04 0.00 40.52
SJ69 2.35 0.11 0.10 0.01 2.46
SJ70 31.03 0.17 0.15 0.02 0.00 31.20
SJ71 16.08 0.05 0.05 0.00 16.13
SJ72 88.44 0.32 0.01 0.13 0.02 0.16 88.76
SJ73 33.87 0.83 0.19 0.64 34.70
SJ74 26.76 0.50 0.12 0.00 0.38 27.26
SJ75 84.89 1.11 0.24 0.45 0.05 0.37 86.00
SJ76 0.85 0.70 0.02 0.29 0.39 1.54
SL01 4.02 0.33 0.00 0.08 0.00 0.25 4.35
SL02 10.66 1.08 0.22 0.00 0.52 0.03 0.01 0.30 11.74
SL03 52.06 0.82 0.06 0.01 0.32 0.36 0.02 0.05 52.88
SL04 57.58 2.27 0.26 1.01 0.17 0.03 0.80 59.85
SL05 23.01 1.19 0.05 0.07 0.37 0.15 0.56 24.20
SL06 7.03 0.68 0.02 0.27 0.09 0.30 7.71
SL07 1.10 0.08 0.00 0.00 0.04 0.04 1.18
SL08 43.60 0.33 0.07 0.06 0.01 0.19 43.93
SL09 5.62 1.96 0.04 0.04 0.02 1.86 7.58
SL10 5.32 0.32 0.01 0.02 0.01 0.28 5.64
SL11 22.49 0.59 0.25 0.05 0.29 23.08
SL12 12.02 0.88 0.05 0.02 0.04 0.04 0.73 12.90
SL13 28.09 2.34 0.00 0.25 0.10 0.03 1.97 30.43
SL14 24.90 0.84 0.06 0.17 0.43 0.03 0.15 25.74
SL15 45.85 1.38 0.45 0.75 0.01 0.17 47.23
SL16 4.20 0.88 0.03 0.01 0.04 0.25 0.01 0.55 5.07
SL17 17.80 0.11 0.02 0.02 0.00 0.07 17.91
SL18 27.84 0.76 0.05 0.64 0.07 28.60
SL19 65.96 0.69 0.40 0.13 0.04 0.12 66.65
SL20 8.72 0.34 0.05 0.01 0.16 0.02 0.10 9.06
SL21 34.50 0.19 0.05 0.03 0.11 34.69
SL22 19.14 0.21 0.06 0.12 0.03 19.35
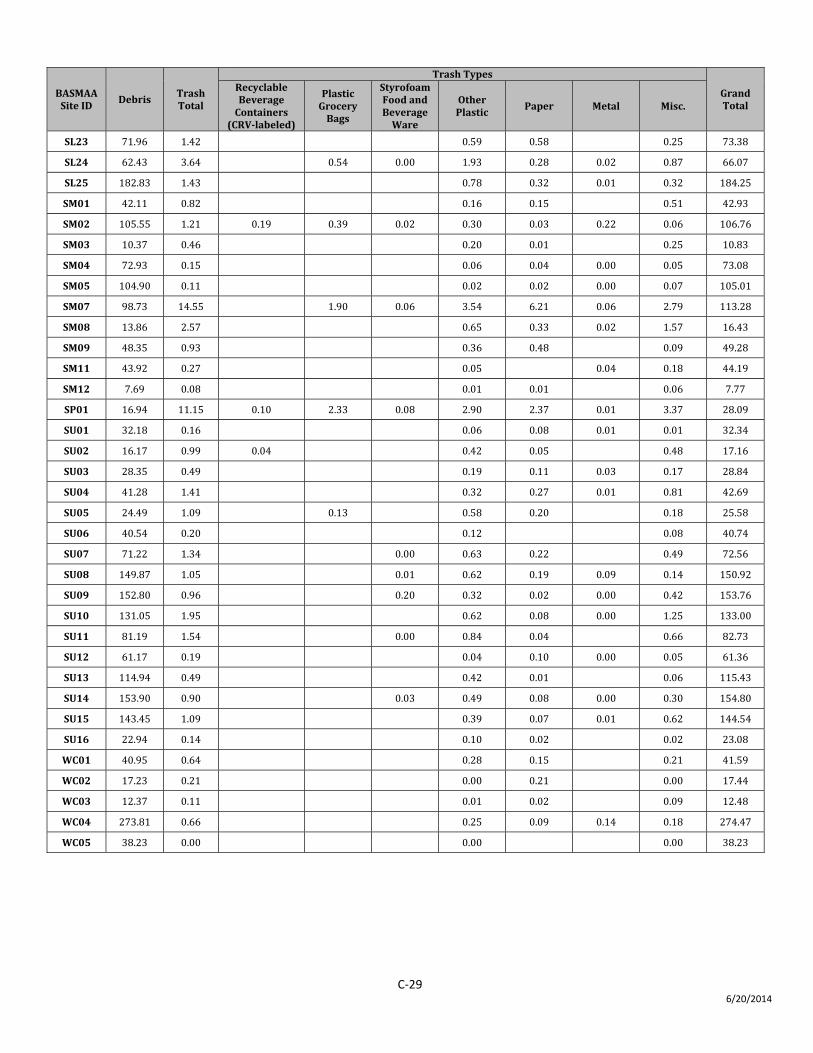
C‐29 6/20/2014
BASMAA Site ID
Debris Trash Total
Trash Types
Grand Total
Recyclable Beverage Containers
(CRVlabeled)
Plastic Grocery Bags
Styrofoam Food and Beverage Ware
Other Plastic
Paper Metal Misc.
SL23 71.96 1.42 0.59 0.58 0.25 73.38
SL24 62.43 3.64 0.54 0.00 1.93 0.28 0.02 0.87 66.07
SL25 182.83 1.43 0.78 0.32 0.01 0.32 184.25
SM01 42.11 0.82 0.16 0.15 0.51 42.93
SM02 105.55 1.21 0.19 0.39 0.02 0.30 0.03 0.22 0.06 106.76
SM03 10.37 0.46 0.20 0.01 0.25 10.83
SM04 72.93 0.15 0.06 0.04 0.00 0.05 73.08
SM05 104.90 0.11 0.02 0.02 0.00 0.07 105.01
SM07 98.73 14.55 1.90 0.06 3.54 6.21 0.06 2.79 113.28
SM08 13.86 2.57 0.65 0.33 0.02 1.57 16.43
SM09 48.35 0.93 0.36 0.48 0.09 49.28
SM11 43.92 0.27 0.05 0.04 0.18 44.19
SM12 7.69 0.08 0.01 0.01 0.06 7.77
SP01 16.94 11.15 0.10 2.33 0.08 2.90 2.37 0.01 3.37 28.09
SU01 32.18 0.16 0.06 0.08 0.01 0.01 32.34
SU02 16.17 0.99 0.04 0.42 0.05 0.48 17.16
SU03 28.35 0.49 0.19 0.11 0.03 0.17 28.84
SU04 41.28 1.41 0.32 0.27 0.01 0.81 42.69
SU05 24.49 1.09 0.13 0.58 0.20 0.18 25.58
SU06 40.54 0.20 0.12 0.08 40.74
SU07 71.22 1.34 0.00 0.63 0.22 0.49 72.56
SU08 149.87 1.05 0.01 0.62 0.19 0.09 0.14 150.92
SU09 152.80 0.96 0.20 0.32 0.02 0.00 0.42 153.76
SU10 131.05 1.95 0.62 0.08 0.00 1.25 133.00
SU11 81.19 1.54 0.00 0.84 0.04 0.66 82.73
SU12 61.17 0.19 0.04 0.10 0.00 0.05 61.36
SU13 114.94 0.49 0.42 0.01 0.06 115.43
SU14 153.90 0.90 0.03 0.49 0.08 0.00 0.30 154.80
SU15 143.45 1.09 0.39 0.07 0.01 0.62 144.54
SU16 22.94 0.14 0.10 0.02 0.02 23.08
WC01 40.95 0.64 0.28 0.15 0.21 41.59
WC02 17.23 0.21 0.00 0.21 0.00 17.44
WC03 12.37 0.11 0.01 0.02 0.09 12.48
WC04 273.81 0.66 0.25 0.09 0.14 0.18 274.47
WC05 38.23 0.00 0.00 0.00 38.23
D‐1 6/20/2014
APPENDIX D
MULTIPLE REGRESSION RESULTS
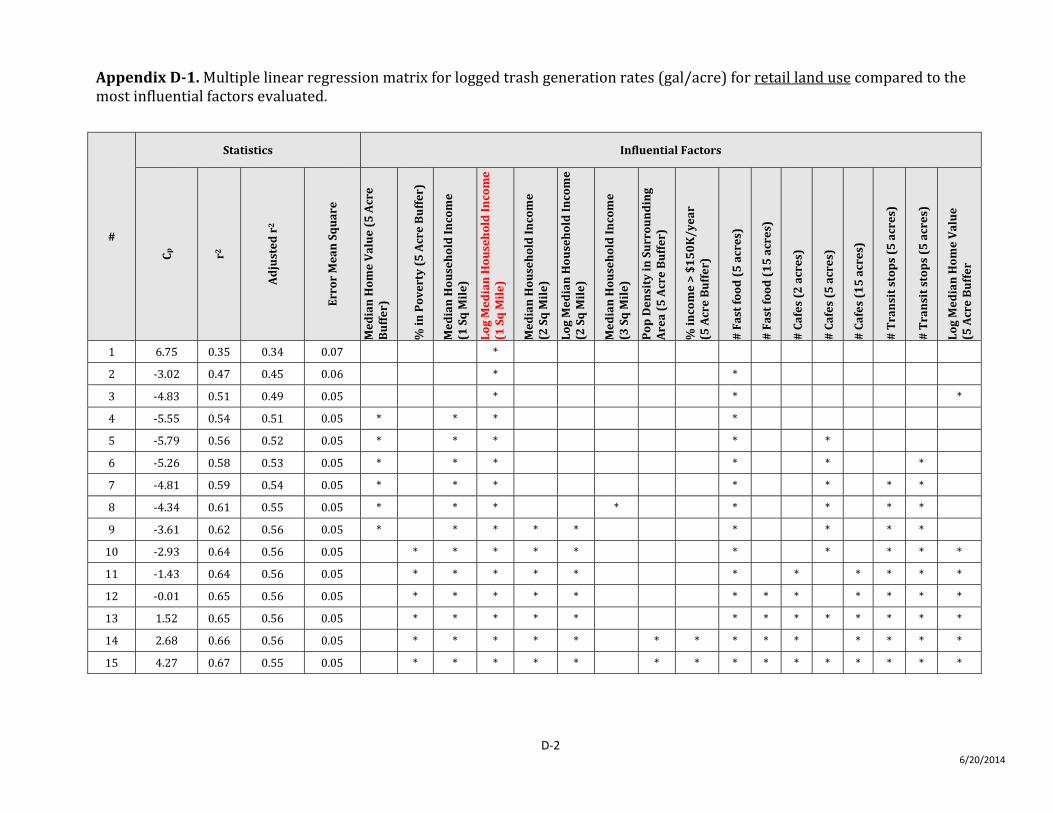
D‐2 6/20/2014
Appendix D1. Multiple linear regression matrix for logged trash generation rates (gal/acre) for retail land use compared to the most influential factors evaluated.
#
Statistics Influential Factors C p
r2
Adjusted r2
Error Mean Square
Median Hom
e Value (5 Acre
Buffer)
% in Poverty (5 Acre Buffer)
Median Household Income
(1 Sq Mile)
Log Median Household Income
(1 Sq Mile)
Median Household Income
(2 Sq Mile)
Log Median Household Income
(2 Sq Mile)
Median Household Income
(3 Sq Mile)
Pop Density in Surrounding
Area (5 Acre Buffer)
% income > $150K/year
(5 Acre Buffer)
# Fast food (5 acres)
# Fast food (15 acres)
# Cafes (2 acres)
# Cafes (5 acres)
# Cafes (15 acres)
# Transit stops (5 acres)
# Transit stops (5 acres)
Log Median Hom
e Value
(5 Acre Buffer
1 6.75 0.35 0.34 0.07 *
2 ‐3.02 0.47 0.45 0.06 * *
3 ‐4.83 0.51 0.49 0.05 * * *
4 ‐5.55 0.54 0.51 0.05 * * * *
5 ‐5.79 0.56 0.52 0.05 * * * * *
6 ‐5.26 0.58 0.53 0.05 * * * * * *
7 ‐4.81 0.59 0.54 0.05 * * * * * * *
8 ‐4.34 0.61 0.55 0.05 * * * * * * * *
9 ‐3.61 0.62 0.56 0.05 * * * * * * * * *
10 ‐2.93 0.64 0.56 0.05 * * * * * * * * * *
11 ‐1.43 0.64 0.56 0.05 * * * * * * * * * * *
12 ‐0.01 0.65 0.56 0.05 * * * * * * * * * * * *
13 1.52 0.65 0.56 0.05 * * * * * * * * * * * * *
14 2.68 0.66 0.56 0.05 * * * * * * * * * * * * * *
15 4.27 0.67 0.55 0.05 * * * * * * * * * * * * * * *
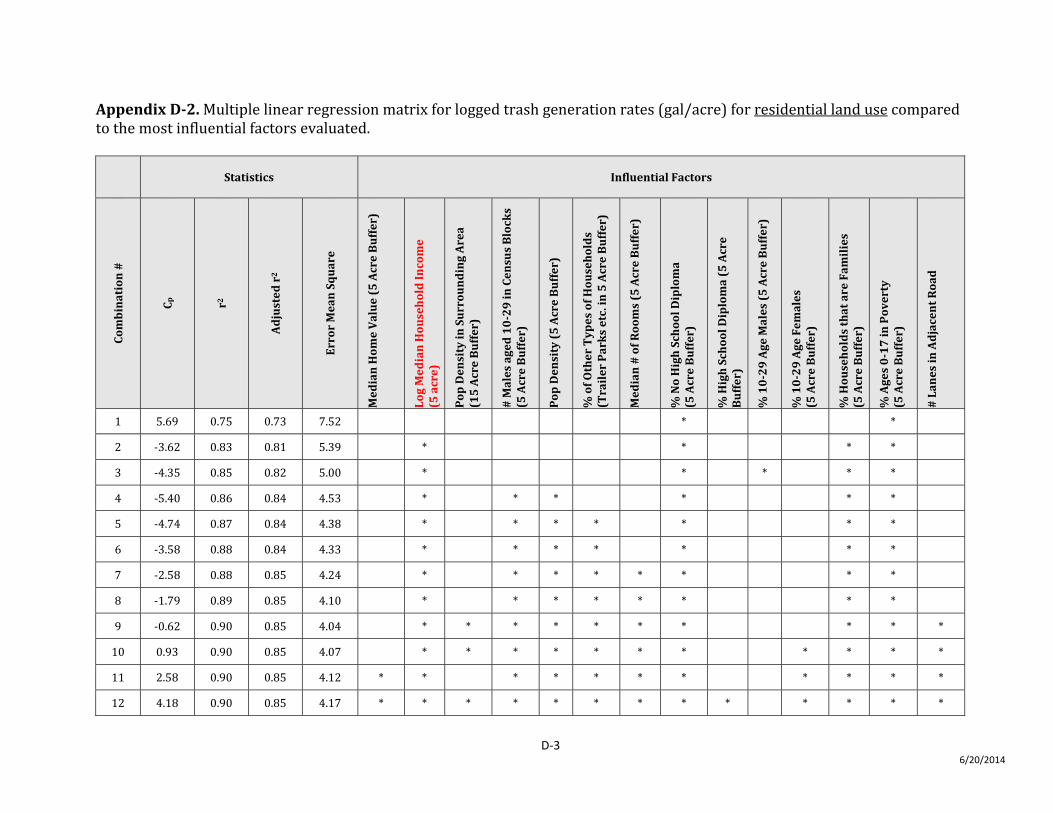
D‐3 6/20/2014
Appendix D2. Multiple linear regression matrix for logged trash generation rates (gal/acre) for residential land use compared to the most influential factors evaluated.
Statistics Influential Factors
Combination #
C p
r2
Adjusted r2
Error Mean Square
Median Hom
e Value (5 Acre Buffer)
Log Median Household Income
(5 acre)
Pop Density in Surrounding Area
(15 Acre Buffer)
# Males aged 1029 in Census Blocks
(5 Acre Buffer)
Pop Density (5 Acre Buffer)
% of Other Types of Households
(Trailer Parks etc. in 5 Acre Buffer)
Median # of Rooms (5 Acre Buffer)
% No High School Diploma
(5 Acre Buffer)
% High School Diploma (5 Acre
Buffer)
% 1029 Age Males (5 Acre Buffer)
% 1029 Age Fem
ales
(5 Acre Buffer)
% Households that are Fam
ilies
(5 Acre Buffer)
% Ages 017 in Poverty
(5 Acre Buffer)
# Lanes in Adjacent Road
1 5.69 0.75 0.73 7.52 * *
2 ‐3.62 0.83 0.81 5.39 * * * *
3 ‐4.35 0.85 0.82 5.00 * * * * *
4 ‐5.40 0.86 0.84 4.53 * * * * * *
5 ‐4.74 0.87 0.84 4.38 * * * * * * *
6 ‐3.58 0.88 0.84 4.33 * * * * * * *
7 ‐2.58 0.88 0.85 4.24 * * * * * * * *
8 ‐1.79 0.89 0.85 4.10 * * * * * * * *
9 ‐0.62 0.90 0.85 4.04 * * * * * * * * * *
10 0.93 0.90 0.85 4.07 * * * * * * * * * * *
11 2.58 0.90 0.85 4.12 * * * * * * * * * * *
12 4.18 0.90 0.85 4.17 * * * * * * * * * * * * *
Recommended