Storytelling with Esri Story Maps
Exercise 1: Exploring Story Maps
Estimated time: 10 minutes Exercise 2: Creating a Web Map and a Story Map Web Application
Estimated time: 20 minutes Exercise 3: Creating Multimedia Map Notes
Estimated time: 15 minutes
Exercise 4: Creating a Map Tour Story
Map
Estimated time: 10 minutes
Exercise 5: Adding Content to a Map
Tour Story Map
Estimated time: 10 minutes
Exercise 6: Using the Downloadable
Story Map Templates
Estimated time: 10 minutes Total time: 75 minutes


Copyright © Esri x-3
Exercises
Exercise 1: Exploring Story Maps
Estimated time: 10 minutes
Maps have been used to tell stories for thousands of years. Why? In large part, it is because
maps have always been efficient means of conveying a large amount of information in a
small amount of space. Yet as rich as those maps scrawled in the dirt, or later created on
stone, wood, paper, linen, vellum, and film were, GIS allows for even more information to
be conveyed on a map. GIS provides capabilities that allow the map reader and GIS user to
derive additional information about the place, region, issues, and phenomena under study,
using different scales, symbologies, analytical and statistical tools, multimedia, and
publishing into a wide variety of formats. ArcGIS provides a platform for those maps to be
created, modified, embedded, searched, and shared.
In this exercise, you will explore different ways to tell stories with web based GIS, and
ArcGIS Online in particular, with a focus on the Esri Story Maps capabilities and templates.
In these exercises, you will:
▪ Explore ways to tell stories with ArcGIS Online, including maps and apps. ▪ Browse the Esri Story Maps galleries.
▪ Reflect how to teach with Esri Story Maps.
▪ Understand the differences and similarities between ArcGIS Online maps, apps, and story maps.
▪ Create a map and publish it as a Story Map Web Application.
▪ Add multimedia map notes, video, and a GPS track to your web maps.
▪ Publish a Map Tour story map.
▪ Investigate how to use the Esri Story Maps templates.
Step 1: Browse Esri Story Maps Gallery
Go to http://storymaps.arcgis.com and browse the Gallery. Esri Story Maps are built on the ArcGIS
Online platform. They provide an easy and rich
way to integrate photographs, video, text, and
maps into an interactive story experience for the
user.
Step 2: Discuss 1 Map on the Story Maps Gallery
Select 1 map you like or that you find useful, and discuss-with your neighbor-what you found interesting about it and how you might use it in teaching, learning, or research.

x-4 Author: Joseph J. Kerski, Esri Copyright © Esri
Storytelling with Esri Story Maps
Question 1. Describe your chosen map and how you might use it:
-----------------------------------------------------------------------------------------------------------------
-----------------------------------------------------------------------------------------------------------------.
As you have started to think about, story maps provide a rich medium for instruction.
You can use existing Story Maps, or you can create your own. You have already
examined some Story Maps in the Gallery, but let’s now examine a few that the author of
this activity (Joseph Kerski) created.
In this exercise, you will:
▪ Examine maps that were created using the Esri Story Maps template.
▪ Discuss how you might teach and encourage student learning with these maps.
Step 3: Examine Four Story Maps and Discuss How They Were Created
Navigate to http://www.josephkerski.com. Go to Resources Web and Story Maps.
You should now be on the following page:
http://www.josephkerski.com/resources/web-maps/
Examine and discuss the Lost Detroit map as an example of a local or community story. In this case,
the story is about large public abandoned buildings in the city. Note the distribution of the points in
Detroit. Note the popup images and light gray canvas basemap. Note the connections to a story that the
students need to read all or part of for the full unit that this map is housed within.
Examine and discuss the “20 on 40” (20 points
along 40 degrees north) map as an example of a
regional or continental story. In this case, the
story is about how landforms, population,
ecoregions, water, and land use change across the
USA at 40 degrees north latitude. Note the
similarities to the Detroit map--both use the Map
Tour template. Note the different base map
(topographic). Note that the thumbnail images do
not have to be the same as the larger images, as
shown in the image at right.
Examine and discuss the “10 landscapes of
wonder and change” map. In the case of this map,
the story is anchored in geomorphology, the examination of the origins, change, and physical
characteristics of landforms. Note the similarities to the other maps--it is also using the Map Tour
template. Note the different base map (USGS topographic) and the larger scale that is set for each
frame.

Copyright © Esri x-5
Exercises
Examine and discuss the Brugge Belgium history
and geography map. In this case, the story is
about the city and region of West Flanders and
Brugge (Bruges) Belgium. Note the differences
to the other maps--this one uses the Shortlist
template. Note the different base map. The point
locations were created from spreadsheets in MS
Excel and saved as CSV files to ArcGIS Online.
Note the zones, conference site, and procession
lines and polygons. These were digitized in
ArcGIS desktop, saved as shapefiles, and shared
on ArcGIS Online. The shapefiles must contain
the same fields as the CSV files.
Part of the CSV for the landmarks appears below. Note the latitude and longitude fields:
Question 2. Describe differences and similarities between the Esri Story Maps you have examined thus far:
-----------------------------------------------------------------------------------------------------------------
-----------------------------------------------------------------------------------------------------------------.
Conclusion
You have begun to explore similarities and differences between Esri Story Maps and
have discussed how they are made. Most of the templates that these Story Maps are
created from are customizable, and you can create your own story maps from them.
You are now ready to create your own Story Maps!
Answers to Exercise 1 Questions
Question 1: Describe the Story Map you chose and how you might use it.
Answer: Answers will definitely vary, because many Story Maps and possibilities exist!
Question 2. Describe differences and similarities between the Esri Story Maps you have examined thus
far:
Answer: Answers will vary, but possible answers include: Differences: Format of page, basemap
used, theme analyzed, scale chosen, symbology, text, and so on. Similarities: Each typically has a
live web map (or more), photographs, text, and a frame structure to hold it all together.

x-6 Author: Joseph J. Kerski, Esri Copyright © Esri
Storytelling with Esri Story Maps
Exercise 2: Creating a Web Map and a Story Map Web Application
Estimated time: 20 minutes
In this exercise, you will create an ArcGIS Online map and an ArcGIS Online app.
Open a web browser and go to www.arcgis.com. Log on to ArcGIS Online with your account or an
account that your instructor provides.
Select MAP and then NEW MAP. Use the Add button to Add the following layer: state_high_points (or state_high_points owner:jjkerski). When found, Add the layer, as shown at right. After the layer has been added, select Done Adding Layers.
Show the Legend and observe the patterns. Use the Bookmarks to navigate to different areas of the map. Why are all of the high points in the Great Plains states on the western sides of those states? Do any high point locations surprise you?
Zoom to a desired location. Create a bookmark there. Zoom to the 48
contiguous USA states. Create another bookmark. Zoom to the 50 USA states. Create another
bookmark. Discuss how bookmarks provide one way of telling stories with maps.
Save your map as High Points USA EdUC 2014 <your initials >. As you always are a good metadata
steward, provide a suitable title, tags, and a summary.
Share your map with your organization.
Share your map again, and this time, make a web application, or web app, as follows. A web map, which is what you published above, uses the default ArcGIS Online tools and interface. A web app is an application that uses a specific template so that your end user will have a specific experience with your map, seeing the tools and appearance that you specify.
Copyright © Esri x-7
Exercises
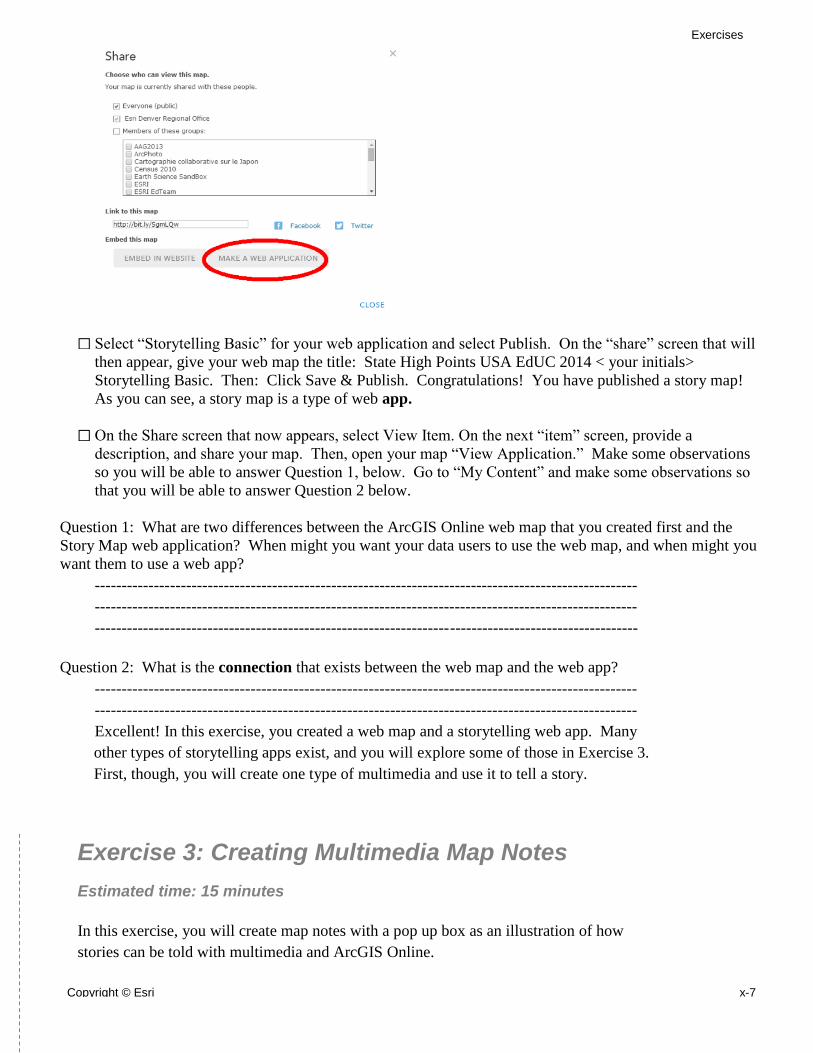
Select “Storytelling Basic” for your web application and select Publish. On the “share” screen that will
then appear, give your web map the title: State High Points USA EdUC 2014 < your initials>
Storytelling Basic. Then: Click Save & Publish. Congratulations! You have published a story map!
As you can see, a story map is a type of web app.
On the Share screen that now appears, select View Item. On the next “item” screen, provide a
description, and share your map. Then, open your map “View Application.” Make some observations
so you will be able to answer Question 1, below. Go to “My Content” and make some observations so
that you will be able to answer Question 2 below.
Question 1: What are two differences between the ArcGIS Online web map that you created first and the
Story Map web application? When might you want your data users to use the web map, and when might you
want them to use a web app?
-----------------------------------------------------------------------------------------------------
-----------------------------------------------------------------------------------------------------
-----------------------------------------------------------------------------------------------------
Question 2: What is the connection that exists between the web map and the web app?
-----------------------------------------------------------------------------------------------------
-----------------------------------------------------------------------------------------------------
Excellent! In this exercise, you created a web map and a storytelling web app. Many
other types of storytelling apps exist, and you will explore some of those in Exercise 3.
First, though, you will create one type of multimedia and use it to tell a story.
Exercise 3: Creating Multimedia Map Notes
Estimated time: 15 minutes
In this exercise, you will create map notes with a pop up box as an illustration of how
stories can be told with multimedia and ArcGIS Online.

x-8 Author: Joseph J. Kerski, Esri Copyright © Esri
Storytelling with Esri Story Maps
Open your high points map. Use Add Add Map Notes Select a point symbol and add it to your
map at one of the high points that is of interest to you.
Add the following to your popup box for that point Title, description of the high point, a photograph of
the point, and a link to a web page where you want your map readers to be routed if they click on the
photograph. The photograph needs to be one that can stand alone on the web; i.e. be opened as a separate
web page, such as this nerdy image of Joseph Kerski on the hallowed ground of Mt Sunflower, Kansas:
http://confluence.org/us/ks/n39w102v2/pic7.jpg
Also, you should get into the habit of using either your OWN images, images held in Creative Commons
licensing (such as most from Wikipedia), images from US government agencies, or other non-copyrighted
images, and not content from a commercial site such as “Bob’s Photography Inc.com.”
Exit the edit box for map notes, and test your pop up box clicking its associated point.
Save your map again. Go to your “My Content” list and open your web app again.
Question 1: Does your popup box and image appear in your web app? Why?
-----------------------------------------------------------------------------------------------------
-----------------------------------------------------------------------------------------------------
-----------------------------------------------------------------------------------------------------
Excellent! In this exercise, you learned how to create a popup box with multimedia. This is another way to tell stories with maps.
Answers to Exercise 2 and 3 Questions
Exercise 2, Question 1: What are two differences between the ArcGIS Online web map that you created first
and the Story Map web application? When might you want your data users to use the web map, and when
might you want them to use a web app?

Copyright © Esri x-9
Exercises
Answer: Though answers will vary slightly, ArcGIS Online web maps have the
full ArcGIS Online interface and functionality. Users can add and modify them
and save them into their own accounts. ArcGIS Online web apps have a reduced
or modified interface as specified by the app author. Users cannot add data to
them unless the author has allowed them to do so. Users cannot modify the
interface. They are intended to be the “end product’ for the map user.
Exercise 2, Question 2: What is the connection that exists between the web map and the web app?
Answer: The web app is based on the web map. Any changes to your web map
will be reflected on the web app. The web map has to exist for the web app to
work. If others cannot access your story map app, it is usually because the
original web map has become unshared or deleted, or the map author has added
content into the web map that is not shared properly or that is only available to
organization subscribers. Therefore, the best practice for authors is to test your
story map on a different computer, ideally from a different network than the one
used for authoring the original content. Also, test your story map when
completely logged out of ArcGIS Online if you truly want it to be available to
“everyone.” These techniques will also help you troubleshoot things like graphics
that are too large and thus affect web performance, missing photographs or
photographs that are not correctly located, and other items.
Exercise 3, Question 1: Does your popup box and image appear in your web app? Why?
Answer: Yes, your popup box and image should appear in your web app,
because, again, the web app is based on the content in your web map. Your
popup box might be very close to the location of your original high point “point
features,” and so you might see the point feature pop up box first, as 1 of 2. If so,
be sure to arrow over in the top of the popup box (to 2 of 2) so that you can see
your multimedia popup box.

x-10 Author: Joseph J. Kerski, Esri Copyright © Esri
Storytelling with Esri Story Maps
Exercise 4: Creating a Map Tour Story Map
Estimated time: 10 minutes
Now that you understand what Story Maps are, and how to create a story map app from an
ArcGIS Online map, you are now ready to a different kind of story map—a Map Tour. A
map tour is one of the most popular types of story map and one of the easiest to create.
In this exercise, you will:
▪ Create a map tour story map through incorporating geotagged photos, adding captions, and
customizing the tour.
Step 1: Create a “Map Tour” Story Map.
Log onto your ArcGIS Online account.
Go to http://storymaps.arcgis.com and select “Browse the Story Map Apps.”
Under Sequential Place-based Narratives Map Tour, select “Build a Tour.”
On the screen asking “where are your images or videos?” select Picasaweb/Google
Plus.
Then, input [email protected] in order to look up Joseph’s photos on the site, and then
select the album, “A Walk to the San Diego Airport Geotagged,” as follows:

Copyright © Esri x-11
Exercise 1B-E
A total of five photographs should be
geolocated, or geotagged. If your
photos are not geolocated, you can (1)
place the photos on their correct
locations on the map at this point, or (2)
use www.geoimgr.com or another
method to geotag your untagged
photographs ahead of time. In the
example you are working with now, the
photos were taken from a smartphone
with the GPS turned on, so they are all
geolocated.
Select “Import.”
Next, visit each photo point and add
captions as follows: Photo 1: Esri
International User Conference at the
San Diego Convention Center, Photo 2:
This is a private yacht? Woah! Photo
3: Ah! To be sailing under the tall masts. Photo 4: All that sea level oxygen.
Photo 5: Almost at the airport!

x-12 Author: Joseph J. Kerski, Esri Copyright © Esri
Storytelling with Esri Story Maps
Give your map an appropriate title and subtitle. Include “for the 2014 Esri GIS
Education Conference” in the subtitle. Save your map and close the dialog box (that
shows the bit.ly URL) that appears after you save. Share your map with your
organization (or with the public if you so desire).
Note the scale of your map as you move between the different points along your tour.
Let’s change that. Go to settings and examine the items that you can change, including
the layout, colors, and so on. Select “Extent” and change it so that your extent covers a
slightly smaller area. Scroll between your images and note the changes. Note that you
can move the location of tour points if the position is not quite correct; such as if the
position was compromised by indoor photography or the presence of tall trees or
buildings. Also take note of the Add, Organize, and Import options in “builder mode”
and make sure you understand that these tools allow you to add new tour points, change
the order of your tour points, and import new photographs.
Save your map again. Test it by opening it in a separate browser window without the
“&edit” tag on the end of its URL. You created a map tour story map. Congratulations!
Question 1: What do you think the advantages are of storing all of your photographs
for a specific story map project in a single online folder, as was done for the folder for
the San Diego airport walk that you worked with above?
-----------------------------------------------------------------------------------------------------
-----------------------------------------------------------------------------------------------------
Conclusion
You have created and published your own Map Tour Story Map! In the next exercise,
you will add other types of content to your map tour.
Exercise 5: Adding Content to a Map Tour Story Map
Estimated time: 10 minutes
Additional types of content can be added to any type of story map, such as point, line, or
polygon shapefiles, video, GPS tracks, and other items.
In this exercise, you will:
▪ Change one of the tour points from a photograph to a video.
▪ Add a GPX file from a track collected on a smartphone for the San Diego airport walk.
First, let’s change one of the tour points from a photograph to a video. To do so,
access the “tall masts” tour point. In a separate browser tab or window, access the
video: Star of India Ship, San Diego harbor, at:
https://www.youtube.com/watch?v=Q2ZhfvfaD1g

Copyright © Esri x-13
Exercise 1B-E
Go to Share, and then Embed. Copy the source code including the // as indicated
below to the clipboard:
In your map tour, at the top of the tall masts image, select Change media. Select
“Video” and paste your URL into the box. Make sure the video URL begins with
http://, and at the end of the URL, insert #isvideo, as shown below. Select Apply.
Test your video. Save your map tour. You have successfully embedded a video into
your map tour! The next activity will demonstrate how to add additional content to
your map tour.
The only content that you can add directly to the map app is what the builder mode
permits you to do. All other content, such as vector lines, points, and polygons, has to

x-14 Author: Joseph J. Kerski, Esri Copyright © Esri
Storytelling with Esri Story Maps
be added to the web map. As you know, changes in the web map will be
automatically reflected in the web app. Let’s demonstrate with a GPX file. A GPX
file is an XML file (GPS Exchange Format) that is output from a smartphone or a GPS
unit, which describes and contains the coordinates for waypoints, tracks, and routes.
Go to your “My Content” area in ArcGIS Online. You should see two items related to
“A Walk to the San Diego Airport” – a web map, and a web mapping application (your
story map). Open the web map.
Note the “map tour points”
layer that the story map builder
created. Use the Add button
and add the San Diego airport
GPX track from the location
given by your instructor. Note
that the file contains
trackpoints and a track line:
Change the symbols of your
track points to red, and change
your track line to red. Save
your map.
Access “My Content” and open your story map application. You should see your
GPX file inside your story map. Congratulations!
Question 1: Why did you add the GPX track to your web map, rather than directly to
your story map?
-----------------------------------------------------------------------------------------------------
-----------------------------------------------------------------------------------------------------
Answers to Exercise 4 and 5 Questions
Exercise 4, Question 1: What do you think the advantages are of storing all of your
photographs for a specific story map project in a single online folder, as the folder for
the San Diego airport walk that you worked with above?
Answer: Storing all of your photographs in one folder makes the creation of a map tour much more
efficient from both time and management perspectives. It eliminates the need of adding additional
photographs from other online locations.
Exercise 5, Question 1: Why did you add the GPX track to your web map, rather than
directly to your story map?

Copyright © Esri x-15
Exercise 1B-E
Answer: Web apps, including story maps, are based on at least one (and sometimes more than one,
if they are multi-frame) web map. Making changes to the web map changes the web app as well.
Thus, you only have to add content to the web map, and not to *both* the web map and the web app.
Exercise 6: Using the Downloadable Esri Story Map Templates
Estimated time: 10 minutes
Now that you have created your own Story Map web application, let’s discuss how to
make a fully customizable Story Map using the downloadable Story Map templates.
In this exercise, you will:
▪ Discuss the differences between publishing a web application Story Map vs. working with the
downloadable Story Maps template.
▪ Examine the steps involved in downloading, modifying, and uploading a Story Maps template.
Step 1: Discuss differences between publishing a web application Story Map vs. Working with the downloadable Story Maps templates.
Recall that several ways exist to publish a map as a Story Map. You have already
created a Story Map Web Application. Using another method, downloading and using
the Story Maps templates, is a bit more complex than what you did in Exercise 1D but
provides additional power and flexibility. For example, compare the map you just
made with this map: http://www.josephkerski.com/storymaps/brugge_shortlist/. This
is a map the author made with one of the downloadable Story Maps templates, in
particular, the “shortlist” template. This and other downloadable templates provide
more functionality than publishing to the web application directly from ArcGIS Online.
From http://storymaps.arcgis.com, go to the “Browse the Story Map Apps” link. You
should now be at the following page: http://storymaps.arcgis.com/en/app-list/
You do not need to know how to program in order to modify these templates, but you
do need to understand how HTML works. In addition, you do need access to a web
server to host your Story Map. You can even use the Public folder on Dropbox.com (if
you have a Dropbox account) for this purpose.
Step 2: Demonstrate how to publish a map as a Story Map Web Application
First, think about your story, your audience, your goals, and the web experience you
want your audience to have. Then think about the cartography, the scale, the
symbology, the images, and the interface you want for your Story Map. Examine this
document to think about how to tell stories with your Story Map:

x-16 Author: Joseph J. Kerski, Esri Copyright © Esri
Storytelling with Esri Story Maps
http://storymaps.esri.com/downloads/Telling%20Stories%20with%20Maps.pdf
Also, examine this document describing workflows and best practices:
http://storymaps.esri.com/downloads/Building%20Story%20Maps.pdf
This playlist of five videos that the author (Joseph Kerski) created on Story Maps
might be useful:
http://www.youtube.com/playlist?list=PLiC1i3ejK5vsOn6cQS_m4dk5YAtoEBFq0.
Alternatively, go to http://www.youtube.com/geographyuberalles --> Playlists Esri
Story Maps for Education II.
Creating a Story Map involves the following steps:
(1) Download the Story Map template that corresponds to the user interface that you
require for your story.
(2) Unzip the zip file to a location on your computer. You will now have folders such
as images, lib, and skins, and an index.html and other files. You will have dozens or
even hundreds of files, but only a few of them need to be altered for your own Story
Map. But they are all needed and must be uploaded to your server. That is the beauty
of a template: You are taking advantage of the work that someone else has done and
just modifying it, rather than creating the whole thing from scratch.
(3) Before editing anything, it is best to make a copy of everything in a separate
folder, in case you inadvertently alter something you did not mean to alter (!).
(4) Depending on the type of story map you have chosen, you will refer to the
corresponding tutorial. To create the shortlist story map, for example, you would refer
to the following tutorial: http://storymaps.arcgis.com/en/app-list/shortlist/tutorial/. No
matter what type of map you have chosen, you will do some light editing of the
index.html file. This file, as you know, is the main document that controls the look and
behavior of a web page, including story maps, which live on the web. You will be
changing the title of the web page in the HTML, the byline, the URLs for where your
photographs reside (Picasaweb/Google Plus, Flickr, etc., anywhere is fine, as long as
they are publicly accessible), the basemap, map center and zoom, and a few other
items, depending on the template you are using.
(4) Tips on photographs: (1) Make them small in physical size and in bytes so they
will be easy for your browser to draw. (2) Ideally, move them to your own web server
or to your account on a photo sharing site (Flickr, Picasaweb/Google Plus) so that you
won’t encounter any future broken links. Make sure you cite your photograph sources.
(3) Ideally, resize them to all be the same size for a more professional look and feel. (4)
Use either your OWN images, images held in Creative Commons licensing (such as
most from Wikipedia), images from US government agencies, or other non-copyrighted

Copyright © Esri x-17
Exercise 1B-E
images, and not content from a commercial site such as “Bob’s Photography Inc.com”.
(5) Create an ArcGIS Online map containing your content. This content could be
from an uploaded CSV with street address or latitude/longitude coordinate pairs, from
map notes, from an uploaded shapefile, or from other means. As you know, Story
Maps depend on your ArcGIS Online map, so that when you change your ArcGIS
Online map, your Story Map automatically updates. Save and share your ArcGIS
Online map.
(6) Point to your ArcGIS Online map in your story map documents. Upload your
edited story map documents to your own server. Test your story map with a variety of
browsers, operating systems, and devices.
Question 1. Summarize the major steps in using the Story Maps downloadable templates to publish a Story Map:
-----------------------------------------------------------------------------------------------------------------
-----------------------------------------------------------------------------------------------------------------.
Conclusion
You have examined how to use the Story Maps downloadable templates. I encourage
you to publish a Story Map soon from the downloadable templates and to share your
maps with the GIS education community.
Answers to Exercise 6 Question Question 1. Summarize the major steps in using the Story Maps downloadable templates to publish a Story Map:
Answer: Answers will vary somewhat, but should include these elements: Download template.
Modify a few lines in index.html. Organize your photos and upload them to a server. Gather and/or
create content that you need and upload it to a server. Create an ArcGIS Online map that houses
your data. Upload a Story Maps template to a server. Test your Story Map. Document your map
and story map with sufficient metadata! Publicize your story map: Embed it in blog, Tweet and
LinkedIn and Facebook about it, email the link to colleagues, send to ListServ, drop biodegradable
leaflets from dirigibles, and use other methods to let others know about and use the good work that
you have created.
Recommended