State of the Retail Sector: Challenges
and Opportunities for San Francisco’s
Neighborhood Commercial Districts
Final Report
February 15, 2018
prepared for:
San Francisco Office of Economic and Workforce
Development

February 2018 2
TABLE OF CONTENTS
TABLE OF FIGURES ................................................................................................................ 3
INTRODUCTION ....................................................................................................................... 4
ISSUE BRIEF #1: RESTRUCTURING OF THE RETAIL, RESTAURANT, AND PERSONAL SERVICES INDUSTRIES .......................................................................................................... 6
Issue Brief Summary ........................................................................................................................ 7
National Trends and Impacts on The NCDs .................................................................................... 9
ISSUE BRIEF #2: WHAT CONSTITUTES A SUCCESSFUL SAN FRANCISCO NEIGHBORHOOD COMMERCIAL DISTRICT? .......................................................................29
Issue Brief Summary ...................................................................................................................... 30
Measuring Success ........................................................................................................................ 32
Factors That Support Success ....................................................................................................... 37
ISSUE BRIEF #3: COSTS AND CHALLENGES FOR RETAIL, RESTAURANTS, AND PERSONAL SERVICES IN SAN FRANCISCO’S NEIGHBORHOOD COMMERCIAL DISTRICTS ...............................................................................................................................57
Issue Brief Summary ...................................................................................................................... 58
San Francisco’s Competitive Advantages for Retail, Restaurants, and Personal Services .......... 59
Costs and Challenges for Retail, Restaurants, and Personal Services in San Francisco’s NCDs 60
Business Adaptations ..................................................................................................................... 70
APPENDIX: INTERVIEWEES AND BIBLIOGRAPHY ..............................................................72
List of Interviewees ........................................................................................................................ 73
Bibliography ................................................................................................................................... 74

February 2018 3
TABLE OF FIGURES
Figure 1. Estimated Annual Sales of U.S. Retail and Food Services Firms: 2000-2016 .............................. 9
Figure 2. Estimated Annual Sales of U.S. Retail Firms by Type of Business: 2000-2016 ......................... 10
Figure 3. Annual Sales Tax Revenues from San Francisco Retail and Food Services Firms, 2007-2016 12
Figure 4. Annual Sales Tax Revenues from San Francisco Retail and Food Services Firms by Category, 2007-2016 ................................................................................................................................................... 12
Figure 5. National Announced Net Store Openings for Selected Retail Categories, Q1 to Q3 2017 (Announced Openings Minus Announced Closures) .................................................................................. 13
Figure 6: E-Commerce as a Percent of Revenue by Retail Category ........................................................ 16
Figure 7: Total Retail Employment in San Francisco, Alameda, San Mateo, and Santa Clara Counties, 2004-2015 ................................................................................................................................................... 28
Figure 8: Electronic Shopping* Employment in San Francisco, Alameda, San Mateo, and Santa Clara Counties, 2009-2015 ................................................................................................................................... 28
Figure 9. Average Annual Sales Tax Revenue per Establishment: Five Case Study NCDs and the Citywide Average, 2007-2016 (Not Adjusted for Inflation) ........................................................................................ 36
Figure 10. Vacant Storefronts as a Percent of Total Storefronts, 2016/2017 ............................................. 36
Figure 11. Summary of Factors Supporting Success of San Francisco Neighborhood Commercial Districts .................................................................................................................................................................... 37
Figure 12. Business Mix in Case Study NCDs, 2017* ................................................................................ 44
Figure 13. Unemployment Rate in the City of San Francisco, 1990-2017 (May of Each Year) ................. 61
Figure 14. San Francisco Labor Laws, 2017 .............................................................................................. 64

February 2018 4
INTRODUCTION
The San Francisco Office of Economic and Workforce Development (OEWD) contracted Strategic
Economics to provide a series of issue briefs about the trends affecting the City’s Neighborhood
Commercial Districts (NCDs). NCDs include most of the City’s neighborhood retail, outside of Downtown,
mid-Market, the northeastern waterfront, and Stonestown Galleria.1 This report is intended to provide
background information and analysis on changing industry trends and other conditions affecting the NCDs
that City agencies may use in exploring policy changes, programs, and other strategies to help the NCDs
adapt to changing conditions.
This report includes issue briefs on the following three topics:
1. The national restructuring of the retail, restaurant, and personal services industries.
2. Factors required to support successful San Francisco retail districts.
3. Opportunities, costs, and challenges for retail, restaurant, and personal services businesses in San
Francisco, and the adaptations that businesses are making in response to changing conditions.
An executive summary for this report is available for download on OEWD’s website. The executive
summary provides an overview of key findings from the report, as well as cross-cutting conclusions and
implications for the NCDs drawn from the three issue briefs.
The three issue briefs are based on interviews conducted in August 2017 with over a dozen San Francisco
retail brokers, business owners, staff from merchants’ associations, community benefit districts, and
business assistance providers, and other stakeholders; literature review; analysis of available data on sales
trends, employment, visitation, and other relevant indicators; and previous work conducted by Strategic
Economics. A complete list of interviewees and a bibliography are provided in the appendix.
Focus of the Study: Retail, Restaurant, Nightlife, and Personal Services Industries
This study focuses on retail, restaurant, nightlife and entertainment, and personal service uses. For the
purposes of this study, these uses are defined as follows:
• Retail Sales Establishments (referred to as “retail,” “retail stores,” or “retailers” throughout the
report) include brick-and-mortar and online stores selling physical products (such as groceries,
clothing, sports equipment, toys, etc.).
• Restaurants include establishments serving food and/or beverages for consumption on the
premises (or in some cases for take-out), generally including cafés and bars as well as fine dining,
casual, and other restaurants. Some data sources categorize these uses as “food services.”
• Nightlife and Entertainment: Restaurants, bars, clubs, theaters, and other venues open during
evening hours.
• Personal Services and Fitness include establishments providing personal services to the general
public, such as hair salons, nail salons, barber shops, gyms or other fitness centers, etc.
1 For the purposes of this study, the term “neighborhood commercial district” is used broadly to include areas zoned
Neighborhood Commercial Transit Districts.

February 2018 5
Note that these definitions are based on common usage in the literature and by real estate professionals, and
not intended to conform to the land use definitions in San Francisco’s zoning codes. Moreover, these uses
are not inclusive of all the uses found in ground floor storefronts in San Francisco’s NCDs. Other common
ground floor uses include (for example) financial services (e.g., banks and credit unions), medical services,
civic organizations, and professional services that provide services in an office-like setting directly to the
general public. While these other uses are not the focus of the study, the role of the overall mix of uses in
supporting a successful NCD is discussed throughout the study.
Issue Brief #1: Restructuring of the Retail Industry | February 2018 6
ISSUE BRIEF #1: RESTRUCTURING OF THE
RETAIL, RESTAURANT, AND PERSONAL SERVICES
INDUSTRIES

Issue Brief #1: Restructuring of the Retail Industry | February 2018 7
ISSUE BRIEF SUMMARY
Purpose and Approach
The retail, restaurant, and personal services industries are in the midst of a major transformation. Based on
discussions with local stakeholders and review of literature and data, this issue brief describes national
trends that are currently affecting these industries, and how these trends are impacting San Francisco’s
NCDs.
Key Findings
National Trends
Based on literature review and interviews, Strategic Economics identified nine trends that are driving
change in the national retail, restaurant, and personal services industries:
1. Nationally, growth in retail and restaurant sales is concentrated in a few categories. These
include non-store (online) sales, food and beverage stores, restaurants and bars, building materials
and home furnishings, and health and personal care stores.
2. Major retailers are closing stores in record numbers. This reflects a national oversupply of retail
space, increased competition with online sales, and (for some retail chains) debt obligations
associated with leveraged buyouts.
3. Online sales are driving retail growth and expanding into new categories. Nationally, non-
store retailers accounted for 40 percent of retail sales growth between 2014 and 2016, with growth
in categories including apparel, office supplies, sporting goods, toys, and groceries.
4. Technology is allowing retailers, restaurant owners, and service providers to integrate brick-
and-mortar and online sales strategies. For example, brick-and-mortar businesses are taking
advantage of online sales platforms, app-based delivery services, and online reservation services.
5. Americans are increasingly spending their money on experiences – such as dining, nightlife
and entertainment, and personal services – rather than objects. Spending on dining out, health
and wellness, and travel is increasing.
6. Retail stores are experimenting with new strategies to capitalize on increasing demand for
experiences. For example, by serving food and drinks, offering classes or events, and expanding
opportunities for customers to interact with products before purchasing.
7. In a challenging retail environment, discount stores are seeing continued growth. Discount
retailers that are adding stores include clothing stores (TJ Maxx, Marshalls), grocery stores
(Grocery Outlet, Trader Joes), warehouse and general merchandise stores (Costco, Target), and
dollar stores.
8. After many years of growth, luxury spending appears to be slowing and luxury brands are
struggling nationally.
9. E-commerce and retail industry consolidation are shifting employment patterns and driving
demand for warehousing and distribution space. Nationally, e-commerce employment is
growing even as overall retail employment remains flat. And, while there is a national oversupply
of traditional retail space, demand for “last mile” distribution space is growing.
Impacts of National Trends on San Francisco’s NCDs San Francisco’s many competitive advantages for retail and restaurants have somewhat insulated
the City’s businesses from these national trends. These include a strong local economy; a culture that

Issue Brief #1: Restructuring of the Retail Industry | February 2018 8
values shopping local and eating out; significant regional and international tourism; the attractive, walkable,
urban environment offered by many NCDs; and a limited number of malls and formula retailers. Some
reporting suggests that the national oversupply of retail is concentrated in suburban malls, particularly in
slow-growing regions, and that retailers are increasingly focusing on faster-growing, urban areas.
However, after many years of growth, San Francisco’s retail sector appears to be slowing. Sales tax
revenues slowed between 2015 and 2016. According to brokers, NCD rents have plateaued, while vacancies
in some NCDs are increasing. Retail employment in the city is growing, but relatively slowly compared to
incomes or the rest of the economy. Business owners in the NCDs report increased competition with e-
commerce and in more categories (e.g., groceries, clothing, personal care goods).
Consistent with national trends, restaurant, entertainment, and personal services uses are
increasingly driving demand for ground floor space in San Francisco neighborhoods. While demand
appears to be slowing generally, brokers report that most of the interest in ground floor space in the NCDs
is coming from restaurants and service providers (such as fitness centers and medical services). This reflects
the national trend towards increased spending on dining, services, and other experiences, and could mitigate
some of the effects on vacancy rates of any local retraction in the retail industry. As discussed in more detail
in Issue Brief #2, restaurants and personal services are also a key component of the experience provided by
neighborhood shopping districts, serving to draw foot traffic to other businesses and providing spaces to
linger and gather as a community.
Organization
The remainder of this issue brief is organized around the nine major trends listed above. For each trend, an
overview of the national context is provided, followed by discussion of how the trend is playing out in San
Francisco’s NCDs. The issue brief also includes call-out text boxes on special topics including trends in the
grocery and restaurant industries, and emerging delivery technologies.
Issue Brief #1: Restructuring of the Retail Industry | February 2018 9
NATIONAL TRENDS AND IMPACTS ON THE NCDS
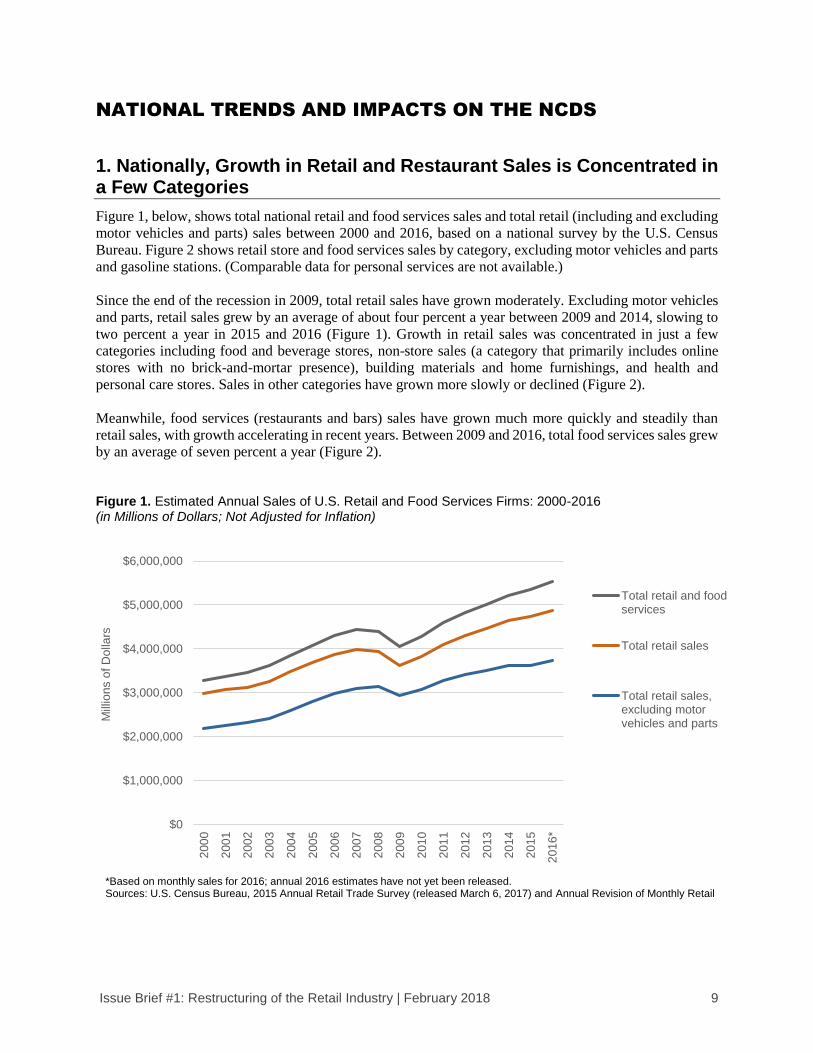
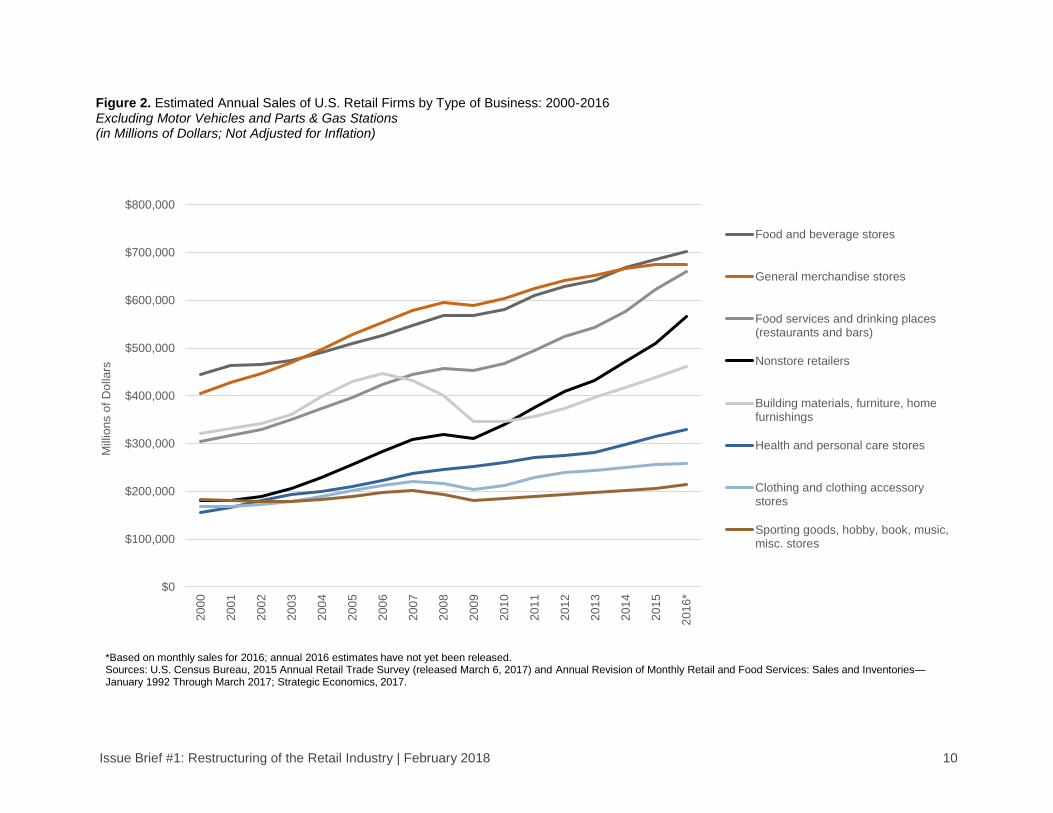
1. Nationally, Growth in Retail and Restaurant Sales is Concentrated in a Few Categories
Figure 1, below, shows total national retail and food services sales and total retail (including and excluding
motor vehicles and parts) sales between 2000 and 2016, based on a national survey by the U.S. Census
Bureau. Figure 2 shows retail store and food services sales by category, excluding motor vehicles and parts
and gasoline stations. (Comparable data for personal services are not available.)
Since the end of the recession in 2009, total retail sales have grown moderately. Excluding motor vehicles
and parts, retail sales grew by an average of about four percent a year between 2009 and 2014, slowing to
two percent a year in 2015 and 2016 (Figure 1). Growth in retail sales was concentrated in just a few
categories including food and beverage stores, non-store sales (a category that primarily includes online
stores with no brick-and-mortar presence), building materials and home furnishings, and health and
personal care stores. Sales in other categories have grown more slowly or declined (Figure 2).
Meanwhile, food services (restaurants and bars) sales have grown much more quickly and steadily than
retail sales, with growth accelerating in recent years. Between 2009 and 2016, total food services sales grew
by an average of seven percent a year (Figure 2).
Figure 1. Estimated Annual Sales of U.S. Retail and Food Services Firms: 2000-2016 (in Millions of Dollars; Not Adjusted for Inflation)
$0
$1,000,000
$2,000,000
$3,000,000
$4,000,000
$5,000,000
$6,000,0002
01
6*
201
5
201
4
201
3
201
2
201
1
201
0
200
9
200
8
200
7
200
6
200
5
200
4
200
3
200
2
200
1
200
0
Mill
ion
s o
f D
olla
rs
Total retail and foodservices
Total retail sales
Total retail sales,excluding motorvehicles and parts
*Based on monthly sales for 2016; annual 2016 estimates have not yet been released.Sources: U.S. Census Bureau, 2015 Annual Retail Trade Survey (released March 6, 2017) and Annual Revision of Monthly Retail
Issue Brief #1: Restructuring of the Retail Industry | February 2018 10
Figure 2. Estimated Annual Sales of U.S. Retail Firms by Type of Business: 2000-2016 Excluding Motor Vehicles and Parts & Gas Stations (in Millions of Dollars; Not Adjusted for Inflation)
$0
$100,000
$200,000
$300,000
$400,000
$500,000
$600,000
$700,000
$800,000
201
6*
201
5
201
4
201
3
201
2
201
1
201
0
200
9
200
8
200
7
200
6
200
5
200
4
200
3
200
2
200
1
200
0
Mill
ion
s o
f D
olla
rs
Food and beverage stores
General merchandise stores
Food services and drinking places(restaurants and bars)
Nonstore retailers
Building materials, furniture, homefurnishings
Health and personal care stores
Clothing and clothing accessorystores
Sporting goods, hobby, book, music,misc. stores
*Based on monthly sales for 2016; annual 2016 estimates have not yet been released.Sources: U.S. Census Bureau, 2015 Annual Retail Trade Survey (released March 6, 2017) and Annual Revision of Monthly Retail and Food Services: Sales and Inventories—January 1992 Through March 2017; Strategic Economics, 2017.

Issue Brief #1: Restructuring of the Retail Industry | February 2018 11
Impacts of National Trends on San Francisco’s NCDs
• Retail and restaurant sales in San Francisco have increased more quickly than the national
average, but began to plateau in 2016. Figure 3 shows San Francisco’s total sales tax revenues
from retail and food services2 from 2007 through 2016, the most recent year for which data are
available. After dipping during the recession, sales tax revenues recovered rapidly starting in 2010,
growing at an average rate of six percent a year between 2010 and 2015. However, between 2015
and 2016, sales tax revenues only increased by one percent. This may in part reflect consumers
shifting to online purchases, as the data do not include e-commerce sales.
Note that sales of nontaxable items, including food for home consumption, prescription medicines,
and services, are not included in the sales tax data. In contrast, the national data discussed above
and shown in Figures 1 and 2 are estimated gross sales based on business surveys.
• Sales at restaurants and bars are increasing especially quickly in San Francisco, reflecting
the City’s status as a regional dining and nightlife destination, and a local culture that values
dining out. Figure 4 shows San Francisco sales tax revenues from retail and food services broken
out in four categories: restaurants and hotels, food and drugs,3 building and construction, and
general consumer goods (all other goods). Restaurant and hotel sales tax revenues grew the fastest,
by an average of nine percent a year between 2010 and 2015, and continued to grow more modestly
(four percent) between 2015 and 2016. Food and drug and building and construction sales tax
revenues also continued to increase through 2016.
• After five years of growth, sales tax revenues from general consumer goods began to decline
in 2015 and 2016 (Figure 4). Other data from the State Board of Equalization (not shown) suggests
that the decline was led by a fall in sales from clothing and accessories stores and general
merchandise stores, similar to the national trends shown in Figure 2 above.
• Anecdotally, it appears that the businesses in the NCDs are experiencing a slowdown in sales.
The citywide data presented in Figure 3 include all the sales tax revenues generated in the city,
including from the NCDs as well as Union Square, Stonestown Galleria, and other commercial
areas. Issue Brief #2 provides sales tax data from selected case study NCDs and shows that sales
tax revenues declined or plateaued between 2015 and 2016 in most of the case study districts.
However, comprehensive data on sales in the NCDs are not available. Anecdotally, many
businesses and business/merchant association representatives interviewed in mid-2017 observed
that sales in the NCDs have slowed in the last 12-18 months. Potential factors cited included
reduced consumer confidence about future economic growth, uncertainty about the national
political climate, and increased competition with online sales. Restaurant and grocery store
representatives also cited increased competition with other local, brick-and-mortar food stores and
food services establishments as a challenge for individual businesses (restaurant and grocery store
trends are discussed in more detail in text boxes later in this issue brief).
2 Excluding sales tax revenues from the following categories: autos and transportation, fuel and service stations, and
business and industry (business-to-business) sales. The data do not include online sales. 3 Note that this category significantly underrepresents total food and drug sales, since food for home consumption and
prescription medicines are not taxable in California.

Issue Brief #1: Restructuring of the Retail Industry | February 2018 12
Figure 3. Annual Sales Tax Revenues from San Francisco Retail and Food Services Firms, 2007-2016 Excluding Motor Vehicles and Parts, Gas Stations, Business-to-Business, and Online Sales (in Millions of Dollars; Not Adjusted for Inflation)
Figure 4. Annual Sales Tax Revenues from San Francisco Retail and Food Services Firms by Category, 2007-2016 Excluding Motor Vehicles and Parts, Gas Stations, Business-to-Business, and Online Sales (in Millions of Dollars; Not Adjusted for Inflation)
$0
$20
$40
$60
$80
$100
$120
$140
2007 2008 2009 2010 2011 2012 2013 2014 2015 2016
An
nu
al S
ale
s T
ax R
eve
nu
e (
Mill
ion
s)
Sources: San Francisco Office of the Controller, 2017; Strategic Economics, 2017.
$0
$10
$20
$30
$40
$50
$60
2007 2008 2009 2010 2011 2012 2013 2014 2015 2016
An
nu
al S
ale
s T
ax R
eve
nu
e (
Mill
ion
s) Restaurants and
Hotels
GeneralConsumerGoods
Food andDrugs*
Building andConstruction
*Note that because food for home consumption and prescription medications are not taxable, the taxable sales data shown here significantly underrepresent gross sales at food and drug stores. Sources: San Francisco Office of the Controller, 2017; Strategic Economics, 2017.
Issue Brief #1: Restructuring of the Retail Industry | February 2018 13
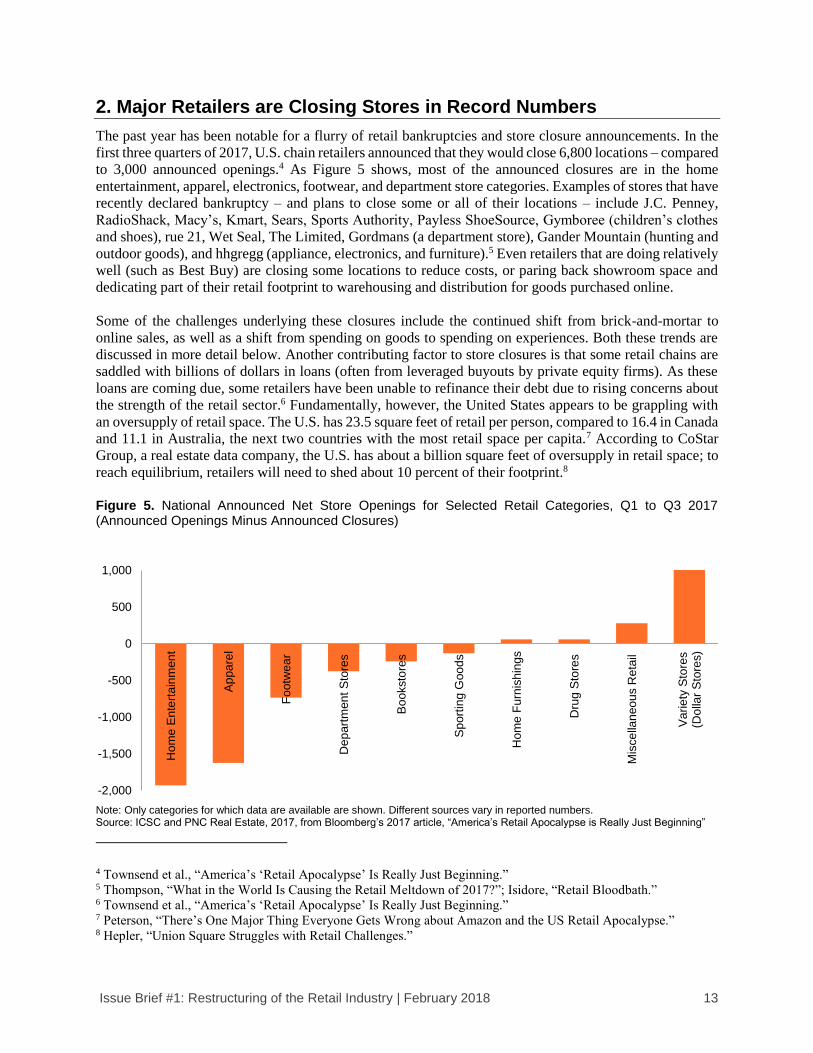
2. Major Retailers are Closing Stores in Record Numbers
The past year has been notable for a flurry of retail bankruptcies and store closure announcements. In the
first three quarters of 2017, U.S. chain retailers announced that they would close 6,800 locations – compared
to 3,000 announced openings.4 As Figure 5 shows, most of the announced closures are in the home
entertainment, apparel, electronics, footwear, and department store categories. Examples of stores that have
recently declared bankruptcy – and plans to close some or all of their locations – include J.C. Penney,
RadioShack, Macy’s, Kmart, Sears, Sports Authority, Payless ShoeSource, Gymboree (children’s clothes
and shoes), rue 21, Wet Seal, The Limited, Gordmans (a department store), Gander Mountain (hunting and
outdoor goods), and hhgregg (appliance, electronics, and furniture).5 Even retailers that are doing relatively
well (such as Best Buy) are closing some locations to reduce costs, or paring back showroom space and
dedicating part of their retail footprint to warehousing and distribution for goods purchased online.
Some of the challenges underlying these closures include the continued shift from brick-and-mortar to
online sales, as well as a shift from spending on goods to spending on experiences. Both these trends are
discussed in more detail below. Another contributing factor to store closures is that some retail chains are
saddled with billions of dollars in loans (often from leveraged buyouts by private equity firms). As these
loans are coming due, some retailers have been unable to refinance their debt due to rising concerns about
the strength of the retail sector.6 Fundamentally, however, the United States appears to be grappling with
an oversupply of retail space. The U.S. has 23.5 square feet of retail per person, compared to 16.4 in Canada
and 11.1 in Australia, the next two countries with the most retail space per capita.7 According to CoStar
Group, a real estate data company, the U.S. has about a billion square feet of oversupply in retail space; to
reach equilibrium, retailers will need to shed about 10 percent of their footprint.8
Figure 5. National Announced Net Store Openings for Selected Retail Categories, Q1 to Q3 2017 (Announced Openings Minus Announced Closures)
Note: Only categories for which data are available are shown. Different sources vary in reported numbers. Source: ICSC and PNC Real Estate, 2017, from Bloomberg’s 2017 article, “America’s Retail Apocalypse is Really Just Beginning”
4 Townsend et al., “America’s ‘Retail Apocalypse’ Is Really Just Beginning.” 5 Thompson, “What in the World Is Causing the Retail Meltdown of 2017?”; Isidore, “Retail Bloodbath.” 6 Townsend et al., “America’s ‘Retail Apocalypse’ Is Really Just Beginning.” 7 Peterson, “There’s One Major Thing Everyone Gets Wrong about Amazon and the US Retail Apocalypse.” 8 Hepler, “Union Square Struggles with Retail Challenges.”
-2,000
-1,500
-1,000
-500
0
500
1,000
Hom
e E
nte
rta
inm
en
t
Ap
pa
rel
Fo
otw
ea
r
Dep
art
men
t S
tore
s
Bo
oksto
res
Sp
ort
ing G
oo
ds
Hom
e F
urn
ish
ing
s
Dru
g S
tore
s
Mis
ce
llan
eo
us R
eta
il
Va
rie
ty S
tore
s(D
olla
r S
tore
s)
Issue Brief #1: Restructuring of the Retail Industry | February 2018 14
Impacts of National Trends on San Francisco’s NCDs
• While San Francisco has experienced some chain store closures, commercial districts in the
city – and specifically in the NCDs – may be somewhat protected from the full impact of the
national retail industry consolidation. So far, the national wave of bankruptcies and store
closures appears to include relatively few stores in San Francisco (including, for example, several
Radio Shacks throughout the city, and Macy’s locations in Stonestown Galleria and Union Square).
It is unclear how many stores in San Francisco’s NCDs will be affected, but it seems likely that the
immediate impact will be limited. Some reporting suggests that the national oversupply of retail is
concentrated in suburban malls, particularly in slow-growing regions, and that retailers are
increasingly focusing on faster-growing urban areas.9 Moreover, chain (or “formula”) retail is less
prevalent in San Francisco compared to the national average, and is largely concentrated in outside
of NCDs in Downtown, South of Market, the northeastern waterfront, and Stonestown Galleria.10
However, chain retailers often occupy some of the larger storefronts in NCDs, and previous
research has found that their closure can result in reduced foot traffic and long-term vacancies that
are challenging to fill.11 (The implications of chain or formula retail in the NCDs, as well as the
City’s formula retail controls, are discussed in more detail in Issue Brief #3.)
• Available data indicate that vacancy rates in some San Francisco’s NCDs are rising. Retail
broker reports indicate that San Francisco has one of the lowest vacancy rates for ground floor
storefronts in the nation.12 However, broker reports primarily track space in and around Union
Square and Downtown San Francisco.13 While comprehensive data on vacancies are more
challenging to obtain for the NCDs, OEWD tracks ground floor vacancy rates for 24 NCDs that
are part of San Francisco’s Invest in Neighborhood economic development program. Between 2015
and 2017, a significant number of the 24 NCDs for which OEWD survey vacancy data is available
experienced an increase in vacancy. About one-third of these NCDs saw vacancies increase by at
least 2%.14
• Brokers also report that demand for ground floor space in the NCDs appears to be slowing.
Anecdotally, local retail brokers indicate decreased demand for ground floor space in the NCDs
over the past few months to a year. In addition, after many years of sustained growth, some brokers
report that ground floor rents in the NCDs are starting to stabilize or decline. (OEWD does not
track rents and other reliable data sources are not available.) As with the anecdotal decline in sales
discussed under Trend 1 above, it is unclear why this slowdown is occurring. Possible factors could
include cooling regional economic growth and the effects of restructuring in the retail industry.
• To some extent, vacancies left by traditional retailers may be filled by other uses. While
demand appears to be slowing generally, brokers report that most of the interest in ground floor
space in the NCDs is coming from restaurants, nightlife and entertainment, and service providers
(such as fitness centers and medical services) and that this trend has intensified in the last 18 months
9 Rothstein, “Even Developers Agree The U.S. Has Way Too Much Retail Space”; Grabar, “The Retail Apocalypse
Is Suburban.” 10 Strategic Economics, “San Francisco Formula Retail Analysis.” 11 Strategic Economics. 12Cushman & Wakefield, “San Francisco Retail Marketbeat, Q1 2017.” 13 Based on discussions with San Francisco retail brokers and review of broker reports. 14 This includes properties that OEWD classifies as either “vacant” (i.e., unoccupied and currently being marketed for
a new lease) or “inactive” (i.e., unoccupied but currently under renovation or otherwise being prepared for a new lease,
and not being actively marketed).

Issue Brief #1: Restructuring of the Retail Industry | February 2018 15
or so. As discussed in more detail below, this mirrors a national trend towards restaurants, nightlife
and entertainment, and personal services filling space formerly occupied by retailers, and could
mitigate some of the effects on vacancy rates of any local retraction in the retail industry.
3. Online Sales are Driving Retail Growth and Expanding into New Categories
As discussed above and shown in Figure 2, non-store sales – a category that includes online stores without
a brick-and-mortar presence – are growing significantly faster than any other retail category. In 2016, non-
store sales accounted for 12 percent of total national retail sales. However, more than 40 percent of the
growth in total retail sales occurred at non-store retailers between 2014 and 2016.15 A single online retailer
– Amazon – appears to be driving much of the growth. One study found that 43 percent of all online retail
sales in 2016 went to Amazon, and that Amazon accounted for the majority (53 percent) of growth in e-
commerce sales for the year.16
Surveys show that consumers prefer to shop online when it saves them money and time. Consumers prefer
to shop in-person when experiencing a product in person is considered more important than price or
convenience, when they need a product immediately that is more readily available in a store (for example,
a loaf of bread or quart of milk), or when purchasing the product in-person is cheaper (for example, because
of high shipping costs).17
As delivery becomes faster and cheaper, and consumers become increasingly familiar with purchasing
products online, online shopping is moving beyond books, music, and video to a wider range of categories
including sporting goods, apparel, office supplies, and toys. Figure 6 shows e-commerce as a percent of
revenue by category. Even for categories where e-commerce accounts for a relatively high percentage of
total revenues, in-person sales still drive the majority of sales revenues. Note that Figure 6 includes non-
store sales, as well as sales that are made at stores that have an in-person as well as an online location. For
example, furniture store sales are often made in-store, through a sales representative who places a custom
order online; these sales are attributed to e-commerce.
15 U.S. Census Bureau, 2015 Annual Retail Trade Survey (released March 6, 2017) and Annual Revision of Monthly
Retail and Food Services: Sales and Inventories—January 1992 Through March 2017 (analysis by Strategic
Economics). 16 B. I. Intelligence, “Amazon Accounts for 43% of US Online Retail Sales.” 17 JLL, “Bagged or Boxed? The Future of 13 Retail Categories.”

Issue Brief #1: Restructuring of the Retail Industry | February 2018 16
Figure 6: E-Commerce as a Percent of Revenue by Retail Category
Excerpted from JLL, “Bagged or Boxed? The Future of 13 Retail Categories.”
Impacts of National Trends on San Francisco’s NCDs
• Retailers in San Francisco’s neighborhoods report that they are seeing increased competition
with online sales, and for an expanding range of products. Anecdotally, small retail businesses
(and the brokers, merchant association representatives, and business assistance providers who serve
them) report that competition with online sales has intensified in the past year, as the speed of
delivery and range of products that consumers are buying online has increased. For example,
grocery stores – which not long ago were considered relatively protected from online sales – are
now competing against meal delivery kits, restaurant delivery, and delivery from other grocery
stores.
• At the same time, small retailers, restaurants, and other businesses are also taking advantage
of online platforms to increase their sales. This is discussed in more detail under Trend 4.
4. Technology is Allowing Retailers, Restaurant Owners, and Service Providers to Integrate Brick-and-Mortar and Online Sales Strategies
To compete more efficiently with online retailers, brick-and-mortar businesses are increasingly adopting
“omnichannel strategies,” defined as the integration of brick-and-mortar and digital channels to improve
customer experience and increase sales.18 These strategies can take several forms, including:
• Integration of product sales and returns through digital and brick-and-mortar channels. This
omnichannel strategy is most commonly adopted by larger chain retailers with multiple stores, like
Target or Best Buy. Customers can browse, buy, and return products both online and in-store, at
their convenience. Some retailers have developed “click-and-collect” systems where customers can
opt to buy products online and pick them up at the store, sometimes involving smart lockers or
other systems for reducing wait times for customers collecting their orders.19 A few grocery stores,
including Kroger, Walmart, and Whole Foods, have also implemented click-and-collect systems.20
18 Sopadjieva, Dholakia, and Benjamin, “A Study of 46,000 Shoppers Shows That Omnichannel Retailing Works.” 19 Wetten, “Future of Retail.” 20 Anderson, “Click-and-Collect Continues to Evolve, but Where Is It Headed?”
Issue Brief #1: Restructuring of the Retail Industry | February 2018 17
• Intermediary, application-based services to order and deliver food and other products.
Restaurants, including small businesses without an independent online presence, are increasingly
processing to-go orders placed through third-party, application-based services. Examples include
GrubHub, Caviar, Eat24, UberEats, Postmates and DoorDash. These services provide the customer
with delivery service to their door. Some also allow customers to place an order online and pick it
up at the restaurant, which business owners value as customer walk-ins can generate more tips and
additional, incidental sales. Intermediary delivery services are also extending to other retail
categories: for example, Postmates has couriers delivering from all types of businesses, while
Instacart specializes in the delivery of groceries and other household staples.
• Intermediary online services to make reservations at restaurants and personal services
businesses. Businesses that provide services on the premises, like restaurants and salons, are
increasingly using third-party platforms to facilitate booking their services.21 While these platforms
are very convenient for customers and can reduce the cost of making reservations, they also charge
fees that can represent a burdensome cost for some low-margin businesses.
• Specialized online platforms that increase the visibility of niche businesses. Some business
owners are using online platforms dedicated to the specific type of product they sell, which
increases their visibility and can boost their sales.
Underscoring the importance of integrating brick-and-mortar and online sales, many businesses that started
online are now opening brick-and-mortar stores where customers can experience products in person. For
example, Amazon has opened several book stores across the U.S. and is scheduled to open a new one in
San José. Warby Parker, an online eyewear retailer, has opened a store in Hayes Valley. Reformation and
Everlane, two online clothing brands, are opening stores on Valencia Street in San Francisco.
Impacts of National Trends on San Francisco’s NCDs
• Third-party apps are allowing some independent retailers, restaurant owners, and service
providers to take advantage of the Internet to expand sales. Already, many restaurant owners
in San Francisco’s NCDs are seeing delivery through third-party delivery apps as an essential way
to expand sales, while some service providers are using online booking platforms. Some small
retailers are experimenting with selling online as well, either through their own websites or third-
party platforms. For example, furniture stores can list vintage furniture on the online platform
Chairish to gain a broader audience. While third-party apps do charge fees, they can also help direct
consumers to businesses (for example, through ratings and recommendations) and can provide data
on sales trends that can help businesses better deploy their resources (for instance, by expanding
staffing at certain times of day that tend to be busier). Many business owners are also taking
advantage of social media (Facebook, Instagram, Twitter) to keep customers engaged.
• Other small neighborhood businesses are struggling to maintain an online presence.
Maintaining an online presence can take staff time and may be more beneficial for businesses in
some categories (such as those selling unique or highly curated clothing or furniture) than for others
(e.g., a convenience or corner store). However, almost all businesses can benefit from maintaining
a basic online presence, such as ensuring that the accurate address and hours are listed on Google
Maps and Yelp. The challenges associated with maintaining an online presence are discussed in
more detail in Issue Brief #3.
21 “Fast-Growing Beauty and Wellness Platform Shedul.com Raises $6 Million”; Perry, “The ‘Internet of Restaurants’
Is Coming for Your Info.”
Issue Brief #1: Restructuring of the Retail Industry | February 2018 18
• Omnichannel strategies may be easier to roll out for chains than for small businesses. Large
chains already have an online presence and can benefit from economies of scale and an established
network of stores where customers can browse, pickup, and/or return products.
• It is too early to determine the full impact on NCDs of increased reliance on delivery services.
Restaurants and grocery stores often serve as anchors for NCDs, driving foot traffic to neighboring
stores. To the extent that sales of food (or other goods) shift to a delivery model, this may reduce
overall foot traffic in NCDs. However, San Francisco is on the cutting edge of delivery trends and
it is too early to determine the effects. For example, while grocery delivery appears anecdotally to
be growing in San Francisco, it seems likely that grocery stores will continue to attract significant
in-person shopping (see text box, below).
Emerging Delivery Technologies
As the market for delivery continues to grow, several companies are developing new technologies to perform deliveries faster and at a cheaper cost, such as sidewalk delivery robots1 and delivery drones.2 These innovations are close to reaching the market, and in some cases, are already piloting deliveries in cities. For instance, Starship Technologies operates sidewalk robots that deliver food in a number of cities across the U.S., including Washington, D.C., and Redwood City, California. These robots are expected to function best in urban and suburban environments where sidewalks are not saturated by a flow of pedestrians (i.e., outside of central business districts like Manhattan or Downtown San Francisco), and aim to eventually provide on-demand delivery for as low as $1 per trip. This delivery technology could extend to other uses. For example, Starship Technologies is currently partnering with a hospital to develop medical deliveries.3
Because this technology is so new, there is little indication as to how neighborhood shopping districts might be affected. On the one hand, sidewalk drones or other delivery drones could help small, local businesses compete with Amazon and other large online retailers, by reducing the cost of delivery. Delivery robots could also help make delivery more efficient, reducing the traffic generated by large delivery trucks and vans. On the other hand, small, local businesses may not have the economies of scale required to compete with larger retailers in providing on-demand delivery, and drones could prove a nuisance on the sidewalk or in the air. The effects will only become clear as these technologies come into wider use over time.
1 Glaser, “San Francisco Is Considering Legislation That Would Ban Sidewalk Delivery Robots”; Lonsdorf, “Hungry?”; Wong, “Delivery Robots.” 2 Meola, “Amazon, Domino’s and the Future Drone Delivery Market.” 3 Interview with David Catania, Counsel for Starship Technologies, August 2017.
Issue Brief #1: Restructuring of the Retail Industry | February 2018 19
Grocery Industry Trends
The grocery industry is one of the bright spots in brick-and-mortar retail, with sales continuing to expand and many brands opening new stores across the country. Although there is some speculation that the grocery boom could result in an oversupply, other studies project continued growth over the next ten years.1 Some of the trends affecting the industry include:
• Rapid expansions (and increased competition): Regional chains like Publix (in the southeast), Wegmans (in the northeast), and Trader Joe’s, Grocery Outlet, and Sprouts (in the west) are adding new locations. Meanwhile, the German discount supermarket chains Aldi and Lidl are also entering the market. These chains are competing for sales with national, middle-market grocers (like Kroger, Albertsons, and Safeway) as well as general merchandisers like Walmart and Target. Even drug stores like CVS and Walgreens have increased their grocery offerings in recent years. Organic food and discount products (including store brands) have been some of the fastest growing product lines.
• Omnichannel integration: Like other retailers, grocery stores are experimenting with online sales strategies, including delivery and click-and-collect. However, the category appears to be somewhat resistant to e-commerce. Nationally, 93 percent of consumers say they prefer to buy groceries in person, in order to select fresh produce and access goods more immediately.2 Amazon’s recent purchase of Whole Foods suggests that online retailers see great value in brick-and-mortar grocery locations; Whole Foods’ 430 existing stores (located predominantly in affluent urban areas) are expected to serve as hubs for delivery and for customers picking up pre-orders, while allowing those who prefer to pick out their produce in person to do so.
• Increased importance of fresh and prepared foods, and decreased importance of processed food and commodities: As shoppers have become more health conscious, the higher-margin products that line the edge of most stores (produce, meats, cheeses, baked goods, and prepared foods) are becoming more important, while sales of commodities and processed food in the center of the store are reportedly declining.
• Differentiation with niche products, experience, and/or value: In a crowded marketplace, stores are working to differentiate themselves by featuring niche goods (e.g., locally sourced goods), offering an enticing experience (e.g., natural light, airy layouts, more prepared foods and spaces for dining), and/or by offering deep discounts.
These trends are playing out in San Francisco’s grocery stores. Grocers in many neighborhoods are seeing increased competition; for example, Bi-Rite is now competing with Whole Foods and Gus’s Community Market for higher-end groceries in the Mission District. Traditional grocery stores are also competing with meal delivery services and restaurant delivery – a national trend, but one that may be particularly acute in San Francisco and other urban markets on the cutting edge of the app-based delivery trends. To compete with these services, stores are increasingly investing in prepared foods and spotlighting niche products and tastings.
Increased competition is affecting not just the top and middle of the market, but also convenience and corner stores. These stores are also struggling to adapt to City regulations on the sale of tobacco and alcohol, which are core products for many corner stores. While many stores are experimenting with shifting towards prepared foods, produce, and other fresh foods, competing with full-service grocery stores in these categories can be challenging. Finally, grocers of all types – like other retailers in San Francisco – are struggling to attract and maintain qualified workers. These and other costs challenges of doing business in the City will be discussed in more detail in a forthcoming issue brief.
1 Abrams, “As Amazon Enters the Market, U.S. Grocers Focus on Becoming the One-Stop Shop.” 2 JLL, “Bagged or Boxed? The Future of 13 Retail Categories.” Other sources: Widness, “Four Trends Driving the Evolution of Grocery Stores”; Abrams and Creswell, “Amazon Deal for Whole Foods Starts a Supermarket War.”

Issue Brief #1: Restructuring of the Retail Industry | February 2018 20
5. Americans are Increasingly Spending their Money on Experiences – such as Dining, Nightlife and Entertainment, and Personal Services – Rather than Objects
Examples of this trend include:
• A steady increase in the amount of money households spend on food away from home: The
amount that consumers spend on food away from home22 is reaching record levels among all age
groups.23 In 2015, food away from home accounted for 43 percent of the average Americans’
spending on food – and 52 percent of the average Bay Area residents’ food spending. 24
• Increased spending on health and wellness (i.e., gyms and fitness centers) and beauty: CoStar
reports that the number of fitness studios entering lease agreements is growing: in the first half of
2017, more than 19 fitness studio companies have absorbed more than 2.04 million square feet of
space in 232 lease signings.25
• Increased spending on travel. Hotel occupancy rates are increasing, and airlines are flying more
passengers than ever before. 26
Consistent with these national trends, San Francisco has attracted a significant increase in visitation, with
seven consecutive years of record-breaking growth in tourist numbers. In 2016, San Francisco welcomed
25.1 million visitors, a 2.3 percent increase from the previous year. These visitors brought an estimated
$9.69 billion in spending to the city.27
Impacts of National Trends on San Francisco’s NCDs
• Many of San Francisco’s NCDs may have an advantage over other (more suburban) retail
districts in continuing to attract shoppers looking for a unique experience. Indeed, mall
developers in other parts of the country are looking to replicate the type of attractive, walkable,
mixed-use environment found in San Francisco NCDs and other urban shopping districts.28
• Restaurants, nightlife and entertainment, and personal services are a key component of the
experience provided by neighborhood shopping districts, and are increasingly driving
demand for ground floor space in San Francisco neighborhoods. Brokers, business owners, and
other stakeholders interviewed for this report described restaurants and cafés as playing two key
roles in NCDs: serving as destinations or anchors that draw foot traffic to other businesses in the
NCDs, and providing spaces to linger and gather as a community. Some personal service providers,
such as hair salons, can also play this role.
22 Food away from home is defined as: “all meals (breakfast and brunch, lunch, dinner and snacks and nonalcoholic
beverages) including tips at fast food, take-out, delivery, concession stands, buffet and cafeteria, at full-service
restaurants, and at vending machines and mobile vendors. Also included are board (including at school), meals as pay,
special catered affairs, such as weddings, bar mitzvahs, and confirmations, school lunches, and meals away from home
on trips.” Source: Consumer Expenditure Survey, https://www.bls.gov/cex/csxgloss.htm. 23 Thompson, “Why Do Millennials Hate Groceries?” 24 Strategic Economics, analysis of 2015 Consumer Expenditure Survey. 25 Heschmeyer, “Wireless Stores and Discounters Among Most Active Retailers Leasing Space.” 26 Thompson, “What in the World Is Causing the Retail Meltdown of 2017?” 27 “San Francisco Travel Reports Record-Breaking Tourism in 2016.” 28 Sicola, “The Rise of Experiential Retail | NAIOP.”

Issue Brief #1: Restructuring of the Retail Industry | February 2018 21
• Anecdotally, it appears that many San Francisco districts are seeing an increase in tourism
that is helping to support neighborhood businesses. 2016 was the seventh consecutive year of
record-breaking growth for San Francisco’s tourism industry. Overnight visitors spent a total of
$9.7 billion in San Francisco in 2016, up 3.2 percent from 2015.29 A 2014 study by SF Travel found
that the average out-of-town visitor to San Francisco visited 3.4 neighborhoods. Union Square,
Fisherman’s Wharf, the Embarcadero, and Chinatown were the top neighborhoods where tourists
shopped and dined, but other common destinations included the Mission, Haight-Ashbury, North
Beach, Japantown, and the Castro. Updated data on visitation is expected to be available from SF
Travel in Spring 2018. Based on discussions with business owners and others, however, it appears
visitation to the NCDs has increased since 2014, in part driven by the growth of short-term rental
sites such as AirBnb, which disperse overnight stays (previously concentrated in hotels in and
around Downtown) throughout the neighborhoods. Interviewees for this report suggested that
increased tourism is helping to support businesses in many NCDs, but that tourism alone is rarely
sufficient to maintain a successful NCD.
29 Cushman & Wakefield, “San Francisco Retail Marketbeat, Q1 2017.”

Issue Brief #1: Restructuring of the Retail Industry | February 2018 22
Restaurant Industry Trends
Restaurant sales grew rapidly between 2009 and 2015, with San Francisco outpacing the national trend. Data from the National Restaurant Association suggest that total restaurant sales and employment continued to increase through mid-2017. Despite record sales, however, industry surveys suggest that restaurant owners feel uncertainty about future performance. Some of the national trends shaping the restaurant industry today include increased competition for consumers’ food dollars; a shortage of skilled labor; growth in certain sectors (particularly fine dining and fast casual) accompanied by a decline in others; a declining lunchtime trade; and an expansion of food delivery services. These trends are playing out nationally, but if anything, the effects are particularly acute in San Francisco and other fast-growing, urban areas. Each of these trends, including the implications for restaurants in San Francisco’s NCDs, is described in more detail below.
• Increased competition: In addition to competing with other restaurants, restaurants are competing with prepared food sections at grocery stores and meal delivery kits. Restaurants in many of San Francisco’s NCDs face especially fierce competition. In 2012, Trulia found that the Bay Area region had more restaurants and bars per capita than any other metropolitan area in the country.
• Labor shortage: Over the last several years, restaurant owners in major metropolitan areas have struggled to attract and retain workers, particularly cooks. Restaurants in San Francisco operate in a particularly tight labor market; the City’s unemployment rate was less than 3 percent in May 2017. Moreover, corporate kitchens (for example, at Google, Twitter, Facebook, and Apple) are competing with restaurants for skilled labor, and chefs in San Francisco and the Bay Area have excellent access to venture capital and other financing to help them open their own restaurants earlier in their careers. The shortage of labor and high cost of living in the Bay Area push up the wages that restaurants (as well as other businesses) need to pay to recruit and retain workers.
• Growth of fine-dining, fast casual, and fast food, accompanied by challenges at mid-tier full-service restaurants: Fast casual restaurants provide higher quality food than traditional fast food restaurants, but do not offer full table service. For example, customers may place an order at a counter or iPad, and bus the tables themselves. In part because of reduced labor costs, the fast casual sector is growing rapidly. The fine dining sector is also doing well, driven by the growth in high-income households. At the low-end, the fast food sector also continues to expand. However, mid-tier, full-service restaurants (also known as casual dining) are struggling, with same-restaurant sales falling at chains like Applebee’s, Chili’s, and Maggiano’s. These restaurants appear to be feeling the brunt of the competition with other stores and services selling prepared foods.
Continued on the following page.

Issue Brief #1: Restructuring of the Retail Industry | February 2018 23
6. Retail Stores are Experimenting with New Strategies to Capitalize on Increasing Demand for Experiences
Given the increasing demand for experiences from the U.S. consumer market, retailers are developing new
strategies to attract customers. Examples of these strategies include expanding opportunities for customers
to interact with products before making a purchase; integrating eating, drinking and wellness into traditional
retail stores; and offering community-building activities such as classes, workshops, readings, lectures, or
concerts. Successful brick-and-mortar retailers have also focused on training their staff to provide high-
quality customer service to better compete with the convenience and lower prices found online. For
instance, Best Buy has developed a dual strategy of matching online prices and hiring highly trained staff
to increase their sales. 30
Impacts of National Trends on San Francisco’s NCDs
• A number of retailers in San Francisco’s NCDs are incorporating food, drink, events, and
other entertainment uses to draw customers and diversify their revenues. Examples include:
o San Franpsycho’s 9th Avenue location (in the Inner Sunset) is part-clothing retailer, part-
pie and ice cream café. The store has periodic parties and other events to showcase new
products.31
30 Flemming, “Why the Grim Reaper of Retail Hasn’t Come to Claim Best Buy.” 31 Jackson, “A Dish Best Served Gently Warmed.”
Restaurant Industry Trends (continued)
Local observers note similar trends playing out the NCDs (including among non-chain restaurants): growth in fine dining and fast casual sectors, and challenges among mid-tier, full service restaurants. The region’s high labor costs likely exacerbate this trend. While fine dining establishments can pass higher labor costs on to diners, and the fast casual format helps reduce labor costs, full-service mid-tier restaurants have fewer options to deal with increased costs.
• The “end of lunch:” White collar workers are taking shorter lunch breaks, eating lunch at their desk, or eating in corporate cafeterias. This particularly affects restaurants that rely heavily on lunch trade, for example in San Francisco’s Financial District. To the extent that lunch traffic made up a smaller share of their revenues to begin with, restaurants in the NCDs may be somewhat less affected.
• Expansion of delivery services: One study found that app-based delivery sales account for only about 2 percent of national restaurant sales today, but are projected to grow 15 times faster than the rest of the restaurant market through 2020. Restaurants in San Francisco’s NCDs increasingly see delivery as a critical way to help expand their sales in response to higher costs. However, increased reliance on delivery can also result in reduced gratuities, and lower checks because customers may not add “extras” like beverages or dessert.
Sources: Interview with Gwyneth Borden, Golden Gate Restaurant Association; Thompson, “The Paradox of American Restaurants”; Moskin, “Not Enough Cooks in the Restaurant Kitchen”; Kolko, “Eating Towns, Drinking Towns.”

Issue Brief #1: Restructuring of the Retail Industry | February 2018 24
o Mojo Bicycle Café on Divisadero Street incorporated a café/beer/wine and a bicycle shop
for ten years. The owners recently announced that the bicycle business will be closing to
allow the bicycle shop owner to do other things, but the café will remain open.32
o RS94109 on Larkin Street is a record store, coffee shop, and beer bar that also hosts regular
live music performances.33
o Bird & Beckett in Glen Park is a book store/record store known for its live music calendar.
The bookshop also hosts poetry readings and other literary talks.34
o Royal Cuckoo is a specialty grocery store in the Mission District that also includes an 8-
seat bar with a food menu. The business was initially issued a permit to serve food and
alcohol by mistake, but recently had to obtain a change of use permit (this requirement is
discussed below).35
o Amado’s (previously Viracocha) is under construction on Valencia. The business will
include a restaurant, a basement entertainment venue, and retail in the front of the store;
with this combination of uses, the space will likely be open 16 hours a day when it
launches.36
• However, construction and permitting can be significant challenges for combining different
uses in one a space. Renovating a space to include kitchen, bar, or other facilities can cost tens of
thousands of dollars and require a significant construction period. In addition, in order to serve food
and beverages in a retail store, a change of use permit is required to reclassify retail space as a
restaurant. This process can take months. A liquor license from the California Department of
Alcoholic Beverage Control (ABC) is also required to serve alcohol. Finally, in some
neighborhoods, residents and merchants have raised concerns about the implications of serving
food or alcohol in retail stores. These challenges are discussed in more detail in Issue Brief #3.
7. In a Challenging Retail Environment, Discount Stores are Seeing Continued Growth
While brick-and-mortar retail is contracting overall, some categories are seeing continued expansion. Some
of the fastest-growing brick-and-mortar categories include:
• Off-price retailers like Ross and TJ Maxx/Marshalls (which have recently announced 70 and 65
new locations, respectively);
• Dollar stores (which are planning 1,250 new stores in the next year); and
• Discount warehouse and general merchandise stores like Costco (which plans to open 30 new
stores in 2017), Target (which plans to open 30 small-format stores in the next year), and Walmart
(which is seeing net store growth, despite some closures).
• Discount grocery stores are also expanding rapidly (see text box, above).37
32 Lee, “Bike Shop At ‘Mojo Bicycle Café’ Closing, But Eatery To Remain.” 33 Nahmod, “TL Record Store ‘RS94109’ Returns With Coffee Bar, Events & Soon Beer.” 34 “Bird & Beckett Books and Records.” 35 Pershan, “Signs at Royal Cuckoo Market Explain Bizarre Fight Over Beer and Wine License.” 36 Wenus, “Merchants Balk at Restaurant Addition to Retail (Updated).” 37 Kline, “These 8 Retailers Are Actually Opening Stores”; JLL, “Bagged or Boxed? The Future of 13 Retail
Categories.”

Issue Brief #1: Restructuring of the Retail Industry | February 2018 25
These categories have generally faced relatively little competition from e-commerce because consumers
value their low prices and the convenience of being able to shop for many brands and/or product categories
in one place.38 (However, Target and other big box discount stores are working to expand their online sales
with omni-channel strategies.) Discount stores also appeal to consumers across a broad spectrum of
incomes. For example, households with annual incomes above $100,000 account for nearly 20 percent of
the revenue at dollar store chains.39
While independent retailers can also provide discount goods, formula retailers can leverage economies of
scale to provide lower prices. In 2014, the City of San Francisco Office of Economic Analysis (OEA)
surveyed prices for a standardized basket of commodities at over 30 non-formula and formula retailers in
San Francisco. The OEA found that on average, prices were 17 percent higher at the non-formula retailers
than at the formula retailers that were surveyed.40
Impacts of National Trends on San Francisco’s NCDs
• San Francisco has attracted new discount retailers in recent years. Examples include new
smaller-format Target locations in Downtown, on Geary and Ocean Avenue, and (most recently)
in Stonestown Galleria; Grocery Outlets in the Mission, Portola, Visitacion Valley, and Outer
Richmond; and new Daiso Japan Stores in the Mission and Downtown (in addition to the long-
established store in Japantown).
• However, the availability of appropriate space and the City’s formula retail controls may
slow the spread of chain discount stores in the NCDs. These retailers generally require relatively
large footprints and may not be able to find appropriate space in some NCDs. In addition, Strategic
Economics’ 2014 analysis of the formula retail controls found that the formula retail conditional
use process creates disincentives for formula retailers to locate in San Francisco’s NCDs, and that
their willingness to do so depends on local market conditions. Formula retailers are more likely to
submit applications in neighborhoods with strong market demand for new retail, and when they
anticipate a positive community reception.41 The effects of the City’s formula retail controls are
discussed in more detail in Issue Brief #3.
8. After Many Years of Growth, Luxury Spending Appears to be Slowing and Luxury Brands are Struggling Nationally
After years of expansion following the end of the recession, luxury spending in the U.S. – the largest market
for luxury goods in the world – slowed in 2016 due to a strong dollar and a reduction in trade from foreign
tourists, especially from China. U.S. consumers also appear to be reducing discretionary spending on
clothing and other personal accessories, in reaction to uncertainty about the direction of federal government
policies.42 Decreased U.S. spending on luxury goods – combined with a challenging environment in other
countries, especially China – has created a challenging landscape for luxury brands. Many are struggling to
adapt to e-commerce and are feeling the impact of customer preference for experience spending, as opposed
38 JLL, “Bagged or Boxed? The Future of 13 Retail Categories.” 39 JLL. 40 Office of Economic Analysis, “Expanding Formula Retail Controls: Economic Impact Report.” 41 Strategic Economics, “San Francisco Formula Retail Analysis.” 42 Deloitte, “Global Powers of Luxury Goods 2017.”

Issue Brief #1: Restructuring of the Retail Industry | February 2018 26
to goods.43 Aspirational luxury brands (such as Michael Kors, Kate Spade, and Coach) appear to be
experiencing more challenges than those that cater to the very top of the market (such as Hermès or Chanel).
Impacts of National Trends on San Francisco’s NCDs
• Some of San Francisco’s NCDs (for example, Valencia, Upper Fillmore and Hayes Valley)
are well-known for luxury clothing and accessories, as well as high-end furniture, home
furnishings, and other goods. The business mix in these districts may include a few national and
international chains, but also many local, independent boutiques. Based on discussions with local
brokers and merchant associations, the market for high-end goods in these NCDs is supported by
the affluent local population, as well as visitation from other neighborhoods in the city, regional
shoppers, and national and international tourism.
• It is unclear what the national (and international) decline in luxury spending means for high-
income cities and neighborhoods. Available data on luxury spending is collected at the national
and international level, and focuses on the market for high-end clothing, accessories, and jewelry.
Anecdotally, some neighborhood shopping districts in New York City that were home to clusters
of national and international luxury stores have recently gone into decline; however, it appears that
the primary causes were poor location decisions by the brands and out-of-control real estate
speculation.44 As discussed in the following issue brief, sales tax revenues from Upper Fillmore
(one of the case studies described in Issue Brief #2) declined sharply between 2015 and 2016.
However, more comprehensive data on sales by type of product or neighborhood district are not
available.
9. E-commerce and Retail Industry Consolidation are Shifting Employment Patterns and Driving Demand for Warehousing and Distribution Space
As e-commerce sales continue to increase, demand for warehousing and distribution space is growing and
shifting. Industrial brokers report that a few years ago, there was significant demand for regional
distribution centers, often located in larger spaces at the urban periphery (e.g., Central Valley or the Inland
Empire). However, with a recent increase in next-day and same-day delivery services, brokers are now
seeing an emerging trend of businesses searching for “last-mile” distribution centers.45 These centers are
the last facility from which shipped parcels depart to reach their delivery point, and could be as close as 5
to 7 miles of the consumer in some cases.46
At the same time, employment attributed directly to e-commerce has doubled in the last five years, while
employment in retail overall has remained flat. Initial reporting suggests that this e-commerce employment
remains a relatively small share of total retail jobs, in part because e-commerce jobs are less labor intensive
than traditional retail.47 However, these counts may miss employment being created in warehousing and
distribution, an employment category that is growing rapidly and may contain the majority of fulfillment
43 Akan, “Luxury Fashion Industry Scrambling to Adjust to Millennial World”; Dennis, “Luxury Retail Hits The
Wall.” 44 Bagli, “In a Thriving City, SoHo’s Soaring Rents Keep Storefronts Empty”; Kurutz, “Bleecker Street’s Swerve
From Luxe Shops to Vacant Stores.” 45 Lane, “E-Commerce Growth A Boon – And Bust – For Local Communities.” 46 Interview with Gary Baragona and Lexi Russell, CBRE, August 2017. 47 Gebeloff and Russell, “How the Growth of E-Commerce Is Shifting Retail Jobs.”

Issue Brief #1: Restructuring of the Retail Industry | February 2018 27
center jobs.48 According to some economists, e-commerce jobs may pay better wages than the traditional
retail jobs they replace, although this claim is still being evaluated.49 There is also a risk that some e-
commerce fulfillment center jobs could be automated in the future.50
Impacts of National Trends on San Francisco’s NCDs
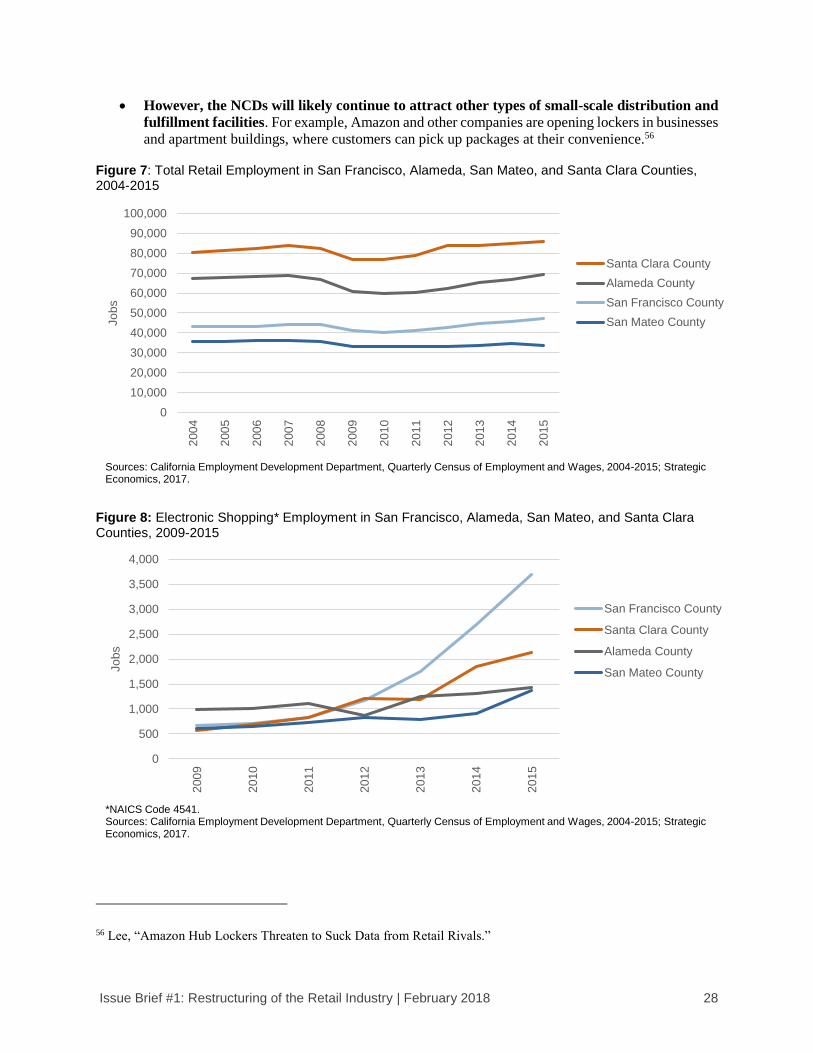
• San Francisco has seen an increase in retail jobs since 2009, but this sector is growing more
slowly than incomes or the economy overall. San Francisco added 5,800 new retail jobs between
2009 and 2015, an increase of 14 percent. This is a similar rate compared to Alameda, Santa Clara,
and San Mateo counties (Figure 7), but faster than the nine-county Bay Area overall (10 percent).
However, the total number of jobs in the city increased by 27 percent between 2009 and 2015, and
aggregate personal income increased by 25 percent over the same time period (after accounting for
inflation).51
• Slightly more than half of the city’s new retail jobs are in “electronic shopping.” Since 2009,
3,035 out of 5,800 new retail jobs in San Francisco were in electronic shopping.52 San Francisco
has attracted many more jobs in this category compared to neighboring counties (Figure 8). In the
absence of more detailed, establishment level data, it is unclear what the implications of this job
growth in electronic shopping are for land use, job type/quality, or sales tax revenues in San
Francisco. However, it appears likely that most of the jobs in electronic shopping in San Francisco
are office-based tech jobs, rather than retail fulfillment jobs.
• San Francisco has very limited employment in warehousing and distribution. Jobs in San
Francisco in the warehousing and transportation sector have declined by almost 50 percent since
2004, to just 2,840 in 2015. Within the broader region, most of the employment growth in this
sector appears to be occurring in Alameda County and the Central Valley.53
• Given the scarcity of warehousing space in San Francisco and the high cost of real estate, it
will likely be more efficient for last mile distributors to locate on the Peninsula or in the East
Bay, rather than in San Francisco itself. To date, last mile distribution facilities in the Bay Area
have primarily located in the Peninsula, Silicon Valley, and Inner East Bay, with spillover demand
occurring in Richmond, Livermore, and the Central Valley. These distributors value locations that
allow them to access as much of the Bay Area population as possible from one location.54 While
last mile distributors are less price sensitive than traditional industrial tenants,55 the limited supply
of warehousing space in San Francisco and the traffic conditions in the city suggest that last mile
distributors will continue to locate in surrounding counties, rather than in San Francisco itself.
48 Sorkin, “E-Commerce as a Jobs Engine?” 49 Mandel, “How E-Commerce Is Raising Pay and Creating Jobs around the Country”; Sorkin, “E-Commerce as a
Jobs Engine?” 50 Wright, “Where Automation in Warehousing Could Be Most Felt.” 51 Strategic Economics analysis of California Employment Development Department’s Quarterly Census of
Employment and Wages (QCEW) and Bureau of Economic Analysis (BEA) data. 52 Ibid. 53 Ibid. 54 Interview with Gary Baragona and Lexi Russell, CBRE, August 2017; JLL, “E-Commerce in the Bay Area.” 55 Ibid.
Issue Brief #1: Restructuring of the Retail Industry | February 2018 28
• However, the NCDs will likely continue to attract other types of small-scale distribution and
fulfillment facilities. For example, Amazon and other companies are opening lockers in businesses
and apartment buildings, where customers can pick up packages at their convenience.56 Figure 7: Total Retail Employment in San Francisco, Alameda, San Mateo, and Santa Clara Counties, 2004-2015
Figure 8: Electronic Shopping* Employment in San Francisco, Alameda, San Mateo, and Santa Clara Counties, 2009-2015
56 Lee, “Amazon Hub Lockers Threaten to Suck Data from Retail Rivals.”
0
10,000
20,000
30,000
40,000
50,000
60,000
70,000
80,000
90,000
100,000
200
4
200
5
200
6
200
7
200
8
200
9
201
0
201
1
201
2
201
3
201
4
201
5
Jo
bs
Santa Clara County
Alameda County
San Francisco County
San Mateo County
Sources: California Employment Development Department, Quarterly Census of Employment and Wages, 2004-2015; Strategic Economics, 2017.
0
500
1,000
1,500
2,000
2,500
3,000
3,500
4,000
200
9
201
0
201
1
201
2
201
3
201
4
201
5
Jo
bs
San Francisco County
Santa Clara County
Alameda County
San Mateo County
*NAICS Code 4541.Sources: California Employment Development Department, Quarterly Census of Employment and Wages, 2004-2015; Strategic Economics, 2017.

Issue Brief #2: Successful San Francisco NCDs | February 2018 29
ISSUE BRIEF #2: WHAT CONSTITUTES A
SUCCESSFUL SAN FRANCISCO NEIGHBORHOOD
COMMERCIAL DISTRICT?
Issue Brief #2: Successful San Francisco NCDs | February 2018 30
ISSUE BRIEF SUMMARY
Purpose and Approach
NCDs play many vital roles in San Francisco, including providing goods and services for residents,
workers, and visitors; offering spaces for community building, entertainment, recreation, and leisure
activities; providing opportunities for entrepreneurship, employment, and income creation; and generating
sales tax and other revenues to support City services. Given these varying roles, there is no one single metric
that can be used to measure the success of an NCD. However, a shared understanding of the characteristics
that successful NCDs generally share can help the City and its partners better target local economic
development initiatives and measure their impacts.
This issue brief is intended to start to create a framework for defining and tracking success that the City can
further develop and apply to a broad range of NCDs throughout San Francisco. Potential next steps could
include defining more specific, quantitative metrics for success, including tracking sales over time for all
the NCDs.
The issue brief incorporates findings from three main sources:
• Literature review. This review was aimed at identifying characteristics typically seen as
conducive to successful neighborhood or street commercial districts across the U.S., with a focus
on urban environments. The review included real estate and broker reports, academic research, and
urban planning, urban design, and economic development literature.
• Interviews with key informants. As described in the introduction to this report, Strategic
Economics conducted more than a dozen interviews in August 2017 with retail brokers; business
owners; staff from merchants’ associations, community benefit districts, and business assistance
providers; and other stakeholders.
• Selected NCD Case Studies. The issue brief also draws from case studies of five NCDs: Upper
Fillmore, Outer Geary Boulevard, Ocean Avenue, Mission Street, and Calle 24 (or Lower 24th
Street).57 Case studies of these five NCDs were completed as part of previous studies,58 and updated
for this issue brief. These NCDs represent the diversity of NCDs across the city, in terms of trade
area characteristics, business mix, physical form and built environment, transportation, and district
management capacity. Throughout the issue brief, the case studies are used to illustrate the range
of conditions in the City’s NCDs. While each of the case studies have at least some elements that
support a successful commercial district, they also face a variety of challenges. Examples from
other NCDs are also referenced throughout the brief as appropriate.
The discussion also incorporates findings from Issue Brief #1 on the national restructuring of the retail,
restaurant, and personal services industries.
57 The boundaries of the case study areas are as follows: the Upper Fillmore area encompasses Fillmore Street from
Bush Street to Jackson Street; the Outer Geary area encompasses Geary Boulevard from 14th Avenue to 28th Avenue;
the Ocean Avenue area encompasses Ocean Avenue from Phelan Avenue to Lakewood Avenue; the Mission Street
area encompasses Mission Street from Duboce Avenue to Cesar Chavez Street; the Calle 24 area encompasses 24 th
Street from Bartlett Street to Potrero Avenue. 58 Strategic Economics, “San Francisco Formula Retail Analysis”; Strategic Economics, “Calle 24 Retail Study: Final
Background Report”; Strategic Economics, “Mission Street Corridor Economic Analysis.”

Issue Brief #2: Successful San Francisco NCDs | February 2018 31
Key Findings
Quantitative measures of success from the national literature include strong business sales
performance and a healthy ground floor vacancy rate. While sources vary, a vacancy rate in the range
of five to 10 percent of storefronts is generally seen as low enough to support a vibrant corridor, but not so
low that there is no room for turnover.
However, different neighborhoods have different visions for what a successful NCD looks like, and
how to achieve this vision. Some of the more qualitative attributes that San Franciscans value in their
NCDs include cultural and historic preservation; a business mix that provides goods and services to help
meet the daily needs of residents, as well as the needs of workers and visitors; a vibrant street life, both
during the day and in the evening; opportunities for community gathering and social interaction; and
opportunities for small and independent businesses to thrive.
From the national literature, factors that contribute to successful districts include:
• Trade area spending power and other drivers of demand. Most businesses rely on the spending
power of households in the surrounding neighborhood (or trade area) to generate demand. Other
drivers of retail demand include local employers; cultural, educational, and medical institutions;
professional services, medical, and other offices. Cultural events, other special events, and public
space programming can also help draw foot traffic.
• Healthy business mix: Businesses rely on each other, and on other uses in a district, to generate
foot traffic. Customers may come to an NCD to buy groceries, eat lunch, or get a haircut, but stay
to shop at a variety of other stores. While there is no single ideal mix of uses, a healthy business
mix includes anchors (or clusters of uses) that attract foot traffic, and a diverse mix of retail and
non-retail businesses that provide destinations, needed services, and gathering spaces for potential
customers.
• Appealing physical environment: The quality of the pedestrian environment and of public spaces
can help attract (or potentially drive away) potential customers. Some of the components of a
successful commercial district include a compact layout with a sufficient concentration of
storefronts to create a critical mass; an attractive architectural character; a clean, safe, and
welcoming street environment; and appropriately designed storefronts.
• Convenient, multi-modal access: Successful urban commercial districts should be conveniently
accessible by foot, bicycle, transit, and car. Curb space should be actively managed to balance the
needs of different users.
• High-capacity district management organizations: These can include Community Benefit
Districts (CBDs), Merchant Associations, Community Development Corporations (CDCs), or other
types of management organizations.
Organization
Following this introduction, the issue brief is organized into two major sections:
• A discussion of potential ways to measure success in a retail district, including both quantitative
metrics (strong sales performance and a healthy vacancy rate) and more qualitative metrics that
reflect San Francisco’s specific context and values.

Issue Brief #2: Successful San Francisco NCDs | February 2018 32
• An exploration of the factors that help support successful retail districts, organized in five broad
categories: (1) trade area characteristics; (2) anchors and mix of uses; (3) physical form and built
environment; (4) transportation and access; and (5) district management and capacity.
Findings from the five case study NCDs are described in text boxes throughout the issue brief.
MEASURING SUCCESS
This issue brief focuses on the factors that help support successful retail districts. However, as context for
that discussion, it is important to define “success.” This section discusses some of the potential metrics that
can be used to define and measure success, including both quantitative and qualitative measures.
Quantitative Metrics
Quantitative measures that are typically used to assess the success of a retail district include:
• Strong sales performance; and
• A healthy ground floor vacancy rate.
While sales performance and vacancy rates are in theory simple to calculate, there are challenges associated
with each metric. The two metrics are discussed in more detail below.
Sales Performance
Local retail studies typically use sales tax data to assess business performance. Ideally, the average sales
per-establishment in a local commercial district can be calculated for different sales categories (e.g.,
restaurants, food and drug stores, clothing stores, general merchandise stores, etc.), and compared to
citywide averages over time to assess performance. The San Francisco Office of the Controller makes
available data on sales tax revenues for the NCDs and other defined geographies.59 Sales tax data provide
the best available information on business performance for NCDs. However, these data are subject to
several caveats:
• Nontaxable goods and services: Sales of some goods, including prescription drugs and food for
consumption at home, are nontaxable. In addition, sales of personal, financial, and other services
are not subject to sales tax in California. As a result, sales tax figures significantly undercount food
and drug sales, and do not capture sales of services at all.
• Sales at stores with more than one location in San Francisco: Stores with multiple locations in
San Francisco report their total sales in the city, but do not report sales for individual locations.
Per-store sales for individual locations are estimated by dividing the citywide total by the number
of locations citywide.
• Confidentiality protections: The state requires that sales tax data be aggregated to protect the
confidentiality of individual taxpayers. For small areas like the NCDs, confidentiality restrictions
make it difficult to report data consistently by business category.
59 Some sales tax data are publicly available at http://sfstax.hdlgov.com/geodata/; however, the data on this website
do not include sales from stores with more than one location in San Francisco and are not broken out by business
category for local areas.

Issue Brief #2: Successful San Francisco NCDs | February 2018 33
Vacancy Rates
Various local retail studies and other literature use a range of different benchmarks for what is considered
a “healthy” vacancy rate for ground floor storefronts.60 In part, the range that is considered healthy depends
on local real estate market conditions. For example, a recent retail study conducted for the City of Berkeley,
CA states that “the typical vacancy rate for a healthy commercial district is somewhere between 4 and
7%,”61 while a Detroit study found that a rate of 15 percent is acceptable.62 While few studies cite specific
data sources to justify a healthy range, one study by the Urban Land Institute used the national 20-year
retail vacancy average (9.8 percent) as a benchmark.63 In general, a rate of between five and 10 percent is
often seen as low enough to support a vibrant corridor, but not so low as to preclude business turnover.
Comprehensive data on vacancies for San Francisco’s NCDs does not exist. Reports published by national
sources like CoStar and by local real estate brokerage firms primarily track retail in and around Union
Square and Downtown San Francisco, with a focus on malls and other buildings that only include
commercial uses.64 OEWD tracks vacancy rates for 24 NCDs that are part of the Invest in Neighborhood
program (including Calle 24, Outer Geary, and Ocean Avenue). Data for Mission Street were collected by
OEWD for a previous study. However, comprehensive, up-to-date vacancy rate data are not available for
other NCDs (including Upper Fillmore).
The text box below discusses the available data on sales performance and vacancy rates from the five case
study NCDs.
Qualitative Metrics
While quantitative measures like sales performance and vacancy rates are important for assessing the health
of any retail district, San Franciscans also value more qualitative attributes of NCDs. These include:
• Cultural and historic preservation.
• A business mix that provides goods and services to help meet the daily needs of residents, as well
as the needs of workers and visitors.
• A vibrant street life, both during the day and in the evening. At minimum, this involves safety and
comfort in the public realm.
• Opportunities for community gathering and social interaction.
• Opportunities for small and independent businesses to thrive.
At the same time, it is important to recognize that different neighborhoods have different visions for what
a successful NCD looks like, and how to achieve this vision. For example, some neighborhoods (e.g.
Japantown, Chinatown, the Mission District) place great value on historic or cultural preservation and have
60 Note that OEWD distinguishes between “vacant” spaces that are currently empty and being marketed for a new
lease, and “inactive” spaces that are being remodeled or otherwise prepared for a new use and are not currently being
marketed. For the purposes of this report, vacant space is considered to include inactive space, since residents, visitors,
business owners, and other NCD stakeholders do not distinguish between vacant and inactive space. 61 City of Berkeley, Office of the City Manager to Honorable Major and Members of the City Council, “Retail
Incentives in Commercial Districts.” 62 Michigan Community Resources, “Grand River Commercial Vacancy & Market Analysis.” 63 ULI Center for Capital Markets and Real Estate, “ULI Real Estate Consensus Forecast: A Survey of Leading Real
Estate Economists/Analysts.” 64 Based on discussions with CoStar representatives and local brokers.
Issue Brief #2: Successful San Francisco NCDs | February 2018 34
significant concerns about gentrification and displacement. In these neighborhoods, there are concerns that
retail and restaurants are increasingly unaffordable to lower-income residents, and that new commercial
activity and investment could contribute to loss of cultural identity and displacement of long-time
businesses. On the other hand, some residents and businesses in other neighborhoods (e.g., in the Visitacion
Valley and Bayview NCDs) would like to see significant change and new investment, such as new
businesses offering a wider variety of goods and services offered, more active and welcoming storefronts,
or new pedestrian amenities or other changes to the public realm. Even within the same neighborhood,
stakeholders often hold different opinions about what constitutes a successful NCD.
The discussion in this issue brief is intended to be widely applicable. However, it is important to note that
public and private improvements, land use policies, economic development strategies, and metrics for
measuring success in each of San Francisco’s commercial districts must to some extent be tailored to reflect
existing conditions and specific neighborhood goals.

Issue Brief #2: Successful San Francisco NCDs | February 2018 35
Measuring Success: Sales Tax Revenues and Vacancies in the Case Study NCDs
Figures 9 and 10 on the following page show:
• Average annual sales tax revenue per establishment, for the five case study NCDs and the City, for 2007 through 2016.
• Vacant storefronts as a percent of total storefronts in four of the five case study NCDs, for 2016 and/or 2017 (as discussed above, these data were not available for Upper Fillmore and citywide data are based primarily on the Union Square/Downtown San Francisco area).
Historically, Upper Fillmore has had the highest sales tax revenues on a per-establishment basis, rivalling the citywide average (which is driven upwards by Union Square, Stonestown Galleria, and other non-NCD locations). This presumably reflects the high-end business mix, which includes many luxury clothing and accessories companies. However, between 2015 and 2016, Upper Fillmore sales declined. This may be due to the national and international slowdown in luxury sales (discussed in Issue Brief #1), or other, more local factors.
In contrast to Upper Fillmore, per-establishment sales tax revenues on Ocean Avenue have historically been lower than the citywide average. However, revenues increased rapidly over the last several years, likely reflecting the opening of a new Whole Foods in 2013 and Target Express in 2015. It is important to note that because Whole Foods and Target have multiple locations in San Francisco, the sales tax numbers for Ocean Avenue reflect the average sales tax revenues for these businesses based on all locations in the city, not the specific performance of the locations on Ocean Avenue.
Sales tax revenues per establishment on Outer Geary, Mission Street, and Calle 24 are all below the citywide average, but have grown steadily since 2009. Previous analysis shows that for Mission Street, at least, this growth was driven almost entirely by increasing restaurant sales.2 As discussed in Issue Brief #1, this reflects the national and citywide trend of restaurant sales significantly outpacing retail sales.
As discussed above, five to 10 percent is generally considered the healthy range for vacancy rates. Ocean Avenue and Calle 24 have rates that are close to 10 percent, while 14 percent of Mission Street storefronts are vacant. Although complete data is not available, based on observations and the perceptions of stakeholders, vacancies on Upper Fillmore are currently very limited.
Continued on the following page.
2 Strategic Economics, “Mission Street Corridor Economic Analysis.”

Issue Brief #2: Successful San Francisco NCDs | February 2018 36
Measuring Success: Sales Tax Revenue and Vacancy Data and the Case Study NCDs (continued) Figure 9. Average Annual Sales Tax Revenue per Establishment: Five Case Study NCDs and the Citywide Average, 2007-2016 (Not Adjusted for Inflation)
Figure 10. Vacant Storefronts as a Percent of Total Storefronts, 2016/2017
1 Some sales tax data are publicly available at http://sfstax.hdlgov.com/geodata/; however the data on this website do not
$0
$1,000
$2,000
$3,000
$4,000
$5,000
$6,000
$7,000
$8,000
$9,000
$10,000
$11,000
2007 2008 2009 2010 2011 2012 2013 2014 2015 2016
Sa
les T
ax R
eve
nu
e P
er
Esta
blis
hm
en
t
OceanAve
UpperFillmore
OuterGeary
Mission St
Calle 24
Citywide
Sources: San Francisco Office of the Controller, 2017; Strategic Economics, 2017.
0%
2%
4%
6%
8%
10%
12%
14%
16%
Ocean Avenue Outer Geary Avenue Mission Street Calle 24
Comprehensive data for Upper Fillmore are unavailable. Data for Ocean Avenue and Outer Geary are from Q1 2017. Data for Mission Street and Lower 24th Street are from 2016.Includes space categorized by OEWD as vacant, inactive, or miscellaneous.Source: City of San Francisco Invest in Neighborhoods Q1 2017; Strategic Economics, 2017.

Issue Brief #2: Successful San Francisco NCDs | February 2018 37
FACTORS THAT SUPPORT SUCCESS
This section describes the factors that can help support successful NCDs. The discussion synthesizes key
findings from the literature review65 (which was national in scope) and interviews with San Francisco
stakeholders. In general, interviewees and the literature identified a similar set of factors required to support
successful commercial districts in an urban setting. However, as discussed below, some of the factors reflect
San Francisco’s specific values and context.
Figure 11 organizes the factors that are considered supportive of NCD success into five broad categories:
(1) trade area characteristics; (2) anchors and mix of uses; (3) physical form and built environment; (4)
transportation and access; and (5) district management and capacity. The following discussion describes
the factors in each category in more detail. Under each category, examples from the five case studies are
used to provide concrete examples of how these factors play out in San Francisco.
Figure 11. Summary of Factors Supporting Success of San Francisco Neighborhood Commercial Districts
Category Factors that Support NCD Success
1 Trade Area Characteristics
• High spending power (household income and density) in the trade area
• Other drivers of demand (e.g., workers, visitors to local service providers and institutions, regional visitation, tourism)
2 Anchors and Mix of Uses • An anchor or cluster of uses that attract foot traffic
• A healthy mix of retail and non-retail uses
3 Physical Form and Built Environment
• Compact layout & sufficient concentration of storefronts
• Appealing architectural character
• Clean, safe, and welcoming street environment
• Appropriately designed storefronts
4 Transportation and Access • Convenient access by foot, bicycle, transit, and car
• Managed parking and curb space
5 District Management and Capacity
• A district management organization with sufficient capacity and resources, including a dedicated funding source
Source: Strategic Economics, 2017.
65 The main sources that informed this section include: CBRE, “Retail and Placemaking: What Is the Role of Retail in
Placemaking?”; Streetsense, “D.C. Vibrant Retail Streets Toolkit”; Easton and Owen, “Creating Walkable Neighborhood Business
Districts: An Exploration of the Demographic and Physical Characteristics Needed to Support Local Retail Services”; Easton,
Owen, and Atkinson, “Urban Centers: By the Numbers and by Design”; Ortiz, “Improving Tenant Mix: A Guide for Commercial
Practitioners”; Moudon et al., “Operational Definitions of Walkable Neighborhood”; National Trust for Historic Preservation,
“Older, Smaller, Better: Measuring How the Character of Buildings and Blocks Influences Urban Vitality”; City of New York
Department of Transportation, “Economic Benefits of Sustainable Streets”; City of New York Department of Planning, “Resilient
Retail”; Roger Brooks International, “The 20 Ingredients of an Outstanding Downtown”; Sasaki Associates, “The State of the City
Experience: What Makes a City Great?”; Grant, “Designing at Ground Level”; Slater, “Crafting Authenticity for Retail
Destinations”; Beyard, Pawlukiewicz, and Bond, “Ten Principles for Rebuilding Neighborhood Retail”; Lane and McAvey, “Retail
in Underserved Communities.”
Issue Brief #2: Successful San Francisco NCDs | February 2018 38
1. Trade Area Characteristics
A trade area is the geographic area from which most of a business’ or commercial district’s customers are
drawn. As discussed below, the size of a trade area varies depending on type of retail in question and the
local population density. In general, however, higher incomes and greater population densities support
higher sales and lower vacancies, while other sources of demand (workers, tourists, and other visitors) are
also helpful in supporting businesses. The text box at the end of this section discusses key characteristics
of the trade area for each of the five case study NCDs.
Local Trade Area Spending Power
Of all the factors discussed in this issue brief, local spending power is one of most basic elements that
businesses look for in selecting a location. There are a variety of ways of measuring local spending power
depending on the context, including:
• Average or median household income: Historically, many retailers and retail marketing firms
focused primarily on household income in selecting retail locations.
• Population and household density: Market research for new suburban shopping centers is often
based on set density guidelines. For instance, neighborhood shopping centers, typically anchored by a
grocery store and a drug store, require 10,000 to 30,000 people within a one- to three-mile radius.66
Centers selling more comparison goods (i.e., goods that consumers purchase more infrequently, and
usually only after comparing prices and quality, such as clothing, electronics, and furniture) tend to
serve much larger trade areas with significantly more population. However, the standard guidelines
generally assume lower population densities than found in most San Francisco neighborhoods.
Population densities required to support neighborhood retail in more densely populated, urban areas
are less well-established.
• Aggregate income: Researchers and retail experts over the past several decades have pointed out that
methods that focus either on household income or population/household density miss the big picture.
For this reason, some real estate professionals now assess aggregate income per square mile – an area’s
household income multiplied by its population/household density – as a more accurate measure of
neighborhood market potential and capacity to support retail.67 For example, based on household
incomes alone, a retailer might prefer a sparsely populated high-income suburban neighborhood over
a densely populated lower-income neighborhood; however, looking at aggregate income may make
the lower-income neighborhood more competitive.
Given San Francisco’s population density and incomes, Strategic Economics has found that a half-mile
radius – or roughly a ten-minute walk – appears to capture most of the trade area for the neighborhood- or
convenience-serving retail in San Francisco’s NCDs. And, as discussed in the text box on the following
page, some NCDs – such as Upper Fillmore, and to some extent Mission Street and Calle 24 – also draw
substantial customer traffic from outside of this primary local trade area.
It is possible that the amount of retail that neighborhoods can support will change as more purchases are
made online. However, no clear conclusions have been reached regarding how population density or income
thresholds might change with continued growth in e-commerce, or whether the growth in e-commerce will
66 Easton, Owen, and Atkinson, “Urban Centers: By the Numbers and by Design.” 67 Pawasarat and Quinn, “Research Brief on ETI Purchasing Power and Economic Drilldowns”; Pawasarat and Quinn,
“Exposing Urban Legends”; Social Compact Inc., “San Francisco Neighborhood Market DrillDown: Catalyzing
Business Investment in Inner City Neighborhoods.”
Issue Brief #2: Successful San Francisco NCDs | February 2018 39
affect certain neighborhoods more than others (for example, whether low-income neighborhoods will be
more affected than high-income neighborhoods).
Other Drivers of Demand
In addition to the local population, other sources of demand in many NCDs include:
• Workers: Retail and restaurants can benefit from workers who come out to eat and shop during
their lunch hour, or before or after work. NCDs include a diverse range of employers, including
hospitals, medical offices, colleges and universities, and retail stores and restaurants.
• Visitors to local service providers and institutions: Medical offices, hospitals, colleges, and
public institutions such as libraries and community centers draw clients who may stop to dine or
shop. For example, Upper Fillmore benefits from its proximity to California Pacific Medical
Center, which generates daytime customers (workers and patients).
• Regional visitation: For example, Mission Street and Calle 24 are a regional destination for dining
and nightlife, while Upper Fillmore is a regional destination for high-end fashion and furnishings.
• Tourists: As discussed in Issue Brief #1, anecdotal evidence suggests that many San Francisco
NCDs are seeing an increase in tourism. Interviewees for this report suggested that increased
tourism is helping to support businesses in many NCDs, but that tourism alone is rarely sufficient
to maintain a successful NCD.
Issue Brief #2: Successful San Francisco NCDs | February 2018 40
2. Anchors and Mix of Uses
A diverse mix of businesses and other uses can help define an NCD’s unique character, attract a steady
stream of foot traffic, and ensure that residents, workers, and visitors can access a range of products and
services. At the same time, one or more “anchor” uses are critical for driving sales in a district. This section
describes the role of anchor uses, and some of the features that characterize a healthy mix of uses. The text
box at the end of the section summarizes the anchors and mix of uses in the five case study NCDs; examples
from the case studies and other San Francisco NCDs are also incorporated throughout the text.
Note that because storefronts in the NCDs have many different property owners, it is often a challenge to
manage and coordinate the mix of uses. This issue is discussed in more detail under Factor 5 (district
management).
An Anchor or Cluster of Uses that Attract Foot Traffic
An anchor is defined as a retail store or other use that drives business to the district, including to smaller
businesses in the same commercial district. The presence of an anchor that attracts foot traffic is key to a
Factor 1: Trade Area Characteristics of the Case Study NCDs
According to some retail professionals, neighborhood retail can be categorized into three types: convenience, comparison, and destination districts.1 These categories are based primarily on the trade area and the business mix.
Convenience districts offer a limited array of goods and services that are geared towards meeting the needs of local households and workers. Customers are drawn to these districts based primarily on locational convenience. Ocean Avenue and Outer Geary are examples of NCDs that primarily provide convenience goods and services for neighborhood residents and workers. However, the local trade area for Ocean Avenue has much higher household incomes than the Outer Geary trade area.2 This may help explain why Ocean Avenue was able to attract a Whole Foods and Target Express, and why the NCD has seen a spike in sales tax revenues in recent years. In addition to serving the local trade area, the Whole Foods may also draw customers from across the City’s southwestern neighborhoods, as it is the only location south of 24th Street and is accessible from Highway 280.
Comparison districts offer some general merchandise, apparel, or other soft goods in addition to convenience goods. These districts serve a larger trade area than a convenience district. Mission Street and Calle 24 are examples of comparison districts. Historically, these districts served a local, primarily lower-income, and heavily Latino customer base. However, in recent years the Mission District has attracted more white, affluent, and highly educated residents, leading to concerns about gentrification and displacement. At the same time, the two corridors are increasingly emerging as regional destinations for restaurants, entertainment, and nightlife.
Destination districts draw customers from around the city or region for a unique and/or specialty mix of goods and services. Customers are usually willing to travel longer distances to reach a destination district. Upper Fillmore is an NCD that has emerged as a regional destination district for high-end fashion. In addition to significant regional visitation and tourism, the retail on Upper Fillmore is supported by a very affluent, densely populated trade area with small household sizes.
1 Ortiz, “Improving Tenant Mix: A Guide for Commercial Practitioners.”
2 Within a rough half-mile radius of the two NCDs, the median household income was $104,600 for Ocean Avenue in 2015, compared to $72,400 for Outer Geary.

Issue Brief #2: Successful San Francisco NCDs | February 2018 41
successful commercial district. Although anchors are typically a retail use, other uses can also be effective
in driving traffic. Examples of potential anchors include:
• Full-service grocery stores and larger chain retail stores. These larger businesses draw regular
foot traffic because customers need to shop at these locations on a recurring basis (e.g., grocery and
drug stores), or because they rely on these businesses to find a set of standard items (e.g., basic
clothing at a Gap, or general merchandise at a Target). Moreover, these larger businesses often
benefit from greater name recognition and more advertising resources compared to small
businesses, and can thus draw in more customers to the district. According to the local merchants’
association, the Whole Foods and Target Express on Ocean Avenue play this role, drawing
customers to the district who also frequent smaller stores.
• A cluster of related retail stores or restaurants. Several interviewees cited the concentration of
one type of business – such as restaurants or clothing stores – as an alternative type of anchor.
Customers are drawn to these clusters knowing they will have many options to choose from within
walking distance. Examples of clusters that serve as anchors include high-end women’s fashion
and accessory stores in the Upper Fillmore, and food and dining establishments on Calle 24 and
Mission Street.
• Civic, cultural, entertainment, or institutional uses. The presence of uses and activities that
attract people to an NCD for reasons other than shopping is a key advantage for a district.
Community centers, cultural and entertainment uses, public libraries, colleges, or hospitals all have
the potential to act as such “visitation drivers.”68 For example, Calle 24 benefits from a cluster of
murals and arts and cultural organizations that contribute to making the district a destination.
Patients and staff from San Francisco General Hospital on Potrero Avenue also help drive foot
traffic to Calle 24, while California Pacific Medical Center serves the same function for Upper
Fillmore.
To some extent, the spread of e-commerce and other retail industry trends may change the type of businesses
that can serve as anchors. As discussed in Issue Brief #1, 2017 saw a wave of closures of department stores,
clothing stores, sporting goods stores, and other types of retailers that historically anchored malls and
shopping centers throughout the United States. However, the daily needs-serving anchors like grocery
stores, drug stores, or general merchandisers (e.g., Target) that anchor many NCDs may prove more
resilient to the growth of e-commerce because customers value the convenience of accessing products
immediately and being able to shop for goods in many product categories at one place. In the future, grocery
stores, general merchandise stores, and other brick-and-mortar locations may serve as hubs for both delivery
and for customers to pick up pre-orders, while allowing those who prefer to pick out purchases in person
to do so. These trends are discussed in more detail in Issue Brief #1.
A Healthy Mix of Retail and Non-Retail Uses
The literature and interviewees agreed that a mix of uses is imperative for the health of a commercial
district, but that there is no rule of thumb for an ideal mix. In general, however, the mix should include:
• A mix of retail store types and products that both serve residents’ and workers’ daily needs,
and provide opportunities for customers to browse or comparison shop. In general,
commercial districts provide two types of goods: “convenience” goods that consumers purchase on
a daily or weekly basis (e.g., groceries, personal care products) and “comparison” goods that
68 Ortiz, “Improving Tenant Mix: A Guide for Commercial Practitioners”; Streetsense, “D.C. Vibrant Retail Streets
Toolkit.”

Issue Brief #2: Successful San Francisco NCDs | February 2018 42
consumers purchase more infrequently, and usually only after comparing prices and quality (e.g.,
clothing, electronics, furniture). Successful districts generally offer a mix of both types of retail,
but the balance can vary. As discussed in the text box under Factor 1, some districts primarily serve
a local consumer base with convenience goods, while others develop niche retail subsectors that
transform the district into a destination.
• The presence of personal services, restaurants, cafes, entertainment, and nightlife. Dining,
entertainment, and services are essential to creating a diverse and interesting district, and can
provide places for communities to gather and shoppers to linger or rest. These uses are becoming
more prevalent relative to traditional retail as e-commerce continues to grow and consumers
increasingly value unique experiences (such as a good meal in an interesting restaurant). Moreover,
certain services, such as laundromats, salons, medical centers, and fitness studios, cannot easily be
replaced by online retail options. Issue Brief #1 includes a more detailed discussion of market
trends that are supporting the growing prevalence of personal services, dining, and entertainment
uses.
• A mix of chain and small/independent businesses. Chain retailers can play an important role in
a commercial district – for example, by serving as anchors and by providing affordable goods.69
However, small and independent businesses contribute to the unique character of neighborhood
districts. San Francisco residents place a particular value on preserving and supporting independent
businesses, as evidenced by the City’s formula retail controls, which require most chain retail and
restaurants to receive a conditional use authorization to open in an NCD. Some NCDs prohibit
formula retail entirely. The impacts of the City’s formula retail controls are discussed in more detail
in Issue Brief #3.
• Ground floor uses that reflect the community’s distinctive character. Whether reflective of the
NCD’s history, culture, surrounding community, or unique physical form, the mix of ground floor
uses should embody some degree of local character. A unique combination of stores and restaurants
in an NCD contributes to a perception of a distinct, special place that tends to be more attractive to
shoppers.70 District programming and other activities (such as public concert series, art walks, or
Sunday Streets) can also help support a distinctive local culture. For example, Calle 24’s distinctive
mix of Latino-oriented food and dining establishments, specialty retail, and cultural uses contribute
to a district that is seen by many stakeholders as the Mission’s cultural heart, an area that has
retained its authenticity amidst the change that has occurred throughout the neighborhood. The
district’s thriving Latino culture and public art, especially in the form of murals, continue to draw
former Latino residents who have been priced out of the Mission District, as well many new
customers from around the region and beyond. Large events such as Carnaval further contribute to
the district’s identity.
• A subset of neighborhood-serving, affordable goods, services, and experiences. Access to
affordable goods, services, and experiences is considered essential by many San Francisco
stakeholders, especially as many neighborhoods undergo rapid demographic change. While
affordability is especially important in lower income neighborhoods, all of San Francisco’s
neighborhoods are home to households at a variety of income levels who should be able to access
goods and services at an affordable price.
69 City and County of San Francisco Office of the Controller, “Expanding Formula Retail Controls: Economic
Impact Report”; Strategic Economics, “San Francisco Formula Retail Analysis.” 70 Kent, “A Street You Go To, Not Just Through.”

Issue Brief #2: Successful San Francisco NCDs | February 2018 43
• Office and housing uses that may not be open to the general public. Healthy commercial
districts rely on non-retail on office and housing uses to help generate foot traffic and demand for
traditional retail stores. In addition, when permitted on the ground floor, these uses may help fill
vacant space. At the same time, too much ground floor office and housing may detract from a retail
district’s vibrancy. These uses may be most appropriate on upper floors, and on the ground floor at
the periphery of a commercial district or in other areas with less demand for traditional retail.
Factor 2: Anchors and Mix of Uses in The Case Study NCDs
Figure 12 below summarizes the mix of ground floor uses on Ocean Avenue, Outer Geary, Mission Street, and Calle 24 from surveys performed in 2016 and 2017 by OEWD’s Invest in Neighborhoods (IIN) program. Because Upper Fillmore is not part of the IIN program, comprehensive data are not available. As discussed below, the mix of uses in the corridors varies significantly.
Ocean Avenue and Outer Geary have a notably higher percentage of services compared to the other corridors (41 percent and 37 percent, respectively), including personal services (e.g., beauty and wellness, fitness, laundry, and dry cleaners) as well as some medical offices and professional services. In general, the retail, personal services, and restaurant uses on these corridors are convenience oriented (i.e., serving a local market). Anchors include grocery stores, general merchandisers, and restaurants: Whole Foods and Target Express on Ocean Avenue, and Grocery Outlet and a number of dim sum and other restaurants on Geary.
Continued on the following page.
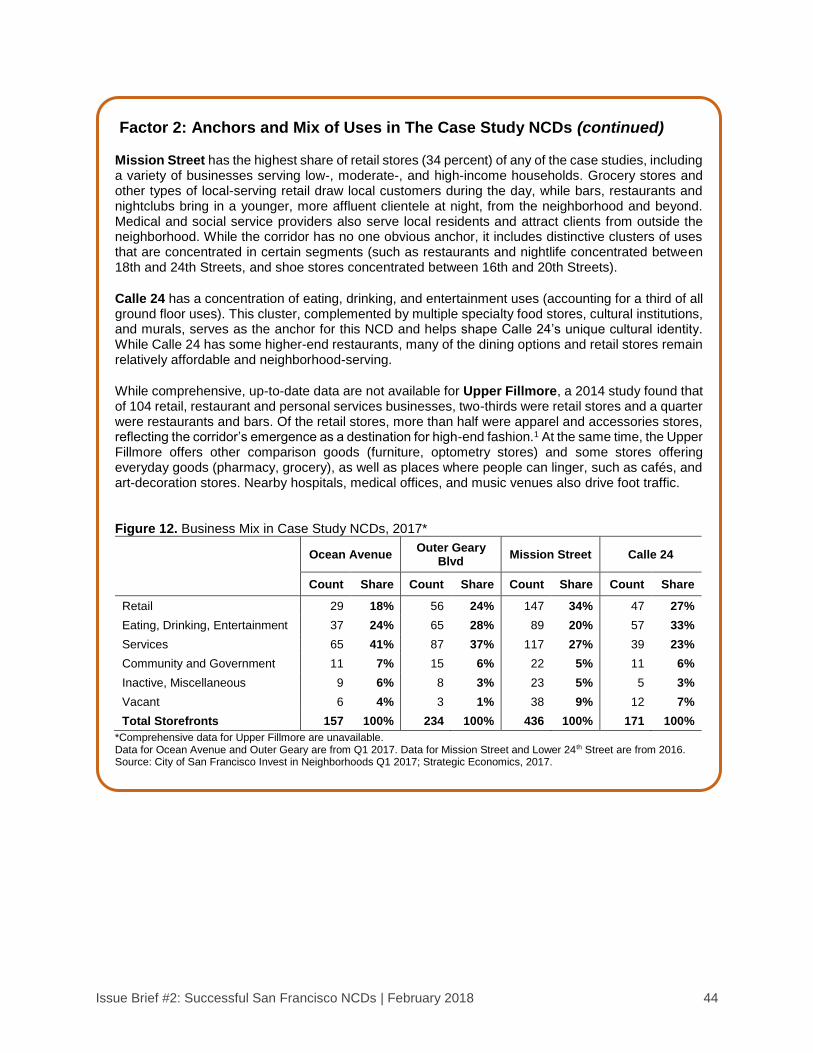
Issue Brief #2: Successful San Francisco NCDs | February 2018 44
Factor 2: Anchors and Mix of Uses in The Case Study NCDs (continued)
Mission Street has the highest share of retail stores (34 percent) of any of the case studies, including a variety of businesses serving low-, moderate-, and high-income households. Grocery stores and other types of local-serving retail draw local customers during the day, while bars, restaurants and nightclubs bring in a younger, more affluent clientele at night, from the neighborhood and beyond. Medical and social service providers also serve local residents and attract clients from outside the neighborhood. While the corridor has no one obvious anchor, it includes distinctive clusters of uses that are concentrated in certain segments (such as restaurants and nightlife concentrated between 18th and 24th Streets, and shoe stores concentrated between 16th and 20th Streets).
Calle 24 has a concentration of eating, drinking, and entertainment uses (accounting for a third of all ground floor uses). This cluster, complemented by multiple specialty food stores, cultural institutions, and murals, serves as the anchor for this NCD and helps shape Calle 24’s unique cultural identity. While Calle 24 has some higher-end restaurants, many of the dining options and retail stores remain relatively affordable and neighborhood-serving.
While comprehensive, up-to-date data are not available for Upper Fillmore, a 2014 study found that of 104 retail, restaurant and personal services businesses, two-thirds were retail stores and a quarter were restaurants and bars. Of the retail stores, more than half were apparel and accessories stores, reflecting the corridor’s emergence as a destination for high-end fashion.1 At the same time, the Upper Fillmore offers other comparison goods (furniture, optometry stores) and some stores offering everyday goods (pharmacy, grocery), as well as places where people can linger, such as cafés, and art-decoration stores. Nearby hospitals, medical offices, and music venues also drive foot traffic.
Figure 12. Business Mix in Case Study NCDs, 2017*
Ocean Avenue Outer Geary
Blvd Mission Street Calle 24
Count Share Count Share Count Share Count Share
Retail 29 18% 56 24% 147 34% 47 27%
Eating, Drinking, Entertainment 37 24% 65 28% 89 20% 57 33%
Services 65 41% 87 37% 117 27% 39 23%
Community and Government 11 7% 15 6% 22 5% 11 6%
Inactive, Miscellaneous 9 6% 8 3% 23 5% 5 3%
Vacant 6 4% 3 1% 38 9% 12 7%
Total Storefronts 157 100% 234 100% 436 100% 171 100%
*Comprehensive data for Upper Fillmore are unavailable. Data for Ocean Avenue and Outer Geary are from Q1 2017. Data for Mission Street and Lower 24th Street are from 2016. Source: City of San Francisco Invest in Neighborhoods Q1 2017; Strategic Economics, 2017.
Issue Brief #2: Successful San Francisco NCDs | February 2018 45
3. Physical Form and Built Environment
A sufficient concentration of storefronts, interesting architectural character, safe and welcoming street
environment, and well-designed storefronts are some of the physical characteristics that can help attract
business owners, residents, and visitors, encourage local shopping, and make an NCD an appealing place
for community gatherings. These factors are discussed below, with examples from the case studies and
other San Francisco NCDs. Key attributes of the physical environment for the case studies are summarized
in the text box at the end of the section.
Compact Layout & Sufficient Concentration of Storefronts
In general, a relatively high concentration of stores and compact district layout can help create a more
appealing destination, in which activity is concentrated enough to be visually interesting, and shoppers can
access multiple stores or other destinations within easy walking distance.
However, successful layouts can vary depending on what physical form a district takes. While a few NCDs
in San Francisco take the form of a small node or anchored shopping center, most are configured as linear
neighborhood shopping streets, major arterials, or corridors within a larger commercial district. The factors
that support success in each of these district layout types are discussed below.
• Urban shopping street: Urban shopping streets are generally linear in form, and serve as the “main
street” for a surrounding residential district. San Francisco’s urban shopping streets generally have
two to three traffic lanes, and tend to have lower traffic volumes and slower speeds relative to major
arterials (discussed below). Some studies have found that urban shopping streets are most
successful if retail and other active uses are concentrated within about a quarter mile (or roughly a
five-minute walk from end to end).71 To keep patrons visually engaged, studies recommend a
storefront entrance along the main corridor every 25-35 feet, with limited disruptions by non-active
uses.72 Stores and other active uses on both sides of the street also help create the feeling of a
destination with a concentration of interesting opportunities for shopping, dining, and other
activities. As discussed in the text box below, Upper Fillmore is a good example of an NCD that
generally meets the physical criteria for a successful urban shopping street.
• Major arterial: Major arterials are defined by their transportation function, serving as key routes
for cars, buses, and sometimes streetcars to traverse the city. They are often wide streets (e.g., 4-6
lanes) with relatively high traffic volumes, high speeds, and few pedestrian crossings. From a retail
perspective, heavy vehicle traffic can help attract customers; on the other hand, it can be difficult
to create a pedestrian-friendly shopping environment (the importance of the street environment is
discussed in more detail below). In order to create successful retail environments along major
arterials, experts often recommend focusing new retail development (and requirements for ground
floor retail) at key nodes, such as major intersections with good visibility and easy vehicle and
pedestrian access, where retail is likely to be most successful. Cities can help support the emergence
of successful shopping nodes along a corridor by carefully targeting streetscape improvements and
other public investments to support these nodes. As described in the text box below, Ocean and
Geary Avenues are two examples of major arterials, although they have very different
environments.
71 Beyard, Pawlukiewicz, and Bond, “Ten Principles for Rebuilding Neighborhood Retail”; Roger Brooks
International, “The 20 Ingredients of an Outstanding Downtown”; Easton and Owen, “Creating Walkable
Neighborhood Business Districts: An Exploration of the Demographic and Physical Characteristics Needed to Support
Local Retail Services.” 72 City of New York, “Active Design: Shaping the Sidewalk Experience”; Zack, “Strategies for Good Urban Retail.”

Issue Brief #2: Successful San Francisco NCDs | February 2018 46
• Corridors within a larger commercial district: Larger commercial districts include a network or
grid of multiple neighborhood shopping streets and/or arterials. For a larger commercial district to
be successful, the different corridors should be complimentary, creating a unified cohesive sense
of place. The Mission District includes commercial areas where the corridors are generally
complimentary (see text box discussion).
Appealing Architectural Character
Shoppers are drawn to areas with a diverse, distinctive architectural character. Many business owners also
prefer to locate in these neighborhoods as well. Some of the components of an attractive built environment
include:
• Distinctive architectural character:
Architectural “character,” “charm,” or
“authenticity” can help make an NCD feel unique
and attractive for shoppers. While these
characteristics are qualitative and subjective, they
are often related to a place’s historic nature, the
presence of specific architectural styles, or other
idiosyncratic details.73
• Mix of storefront sizes, architectural styles, and
building ages. A study of Washington D.C.,
Seattle, and San Francisco’s built environment
found that neighborhoods with a mix of building
styles often performed well from an economic and
retail perspective. A mix of building ages and
architectural styles creates visual diversity that
people find attractive, while a mix of large and
small storefronts allows for a diverse range of
businesses (large and small; independent and
chain; restaurants, retail, and personal services) to
locate in the district.74
Clean, Safe, and Welcoming Street Environment
In addition to a district’s architectural character, research
has found that a welcoming pedestrian environment
contributes to higher retail sales and, in some cases,
increased commercial rents.75 Some components of a
welcoming street environment include:
73 Slater, “Crafting Authenticity for Retail Destinations”; Sasaki Associates, “The State of the City Experience: What
Makes a City Great?” 74 National Trust for Historic Preservation, “Older, Smaller, Better: Measuring How the Character of Buildings and
Blocks Influences Urban Vitality.” 75 Hack, “Business Performance in Walkable Shopping Areas”; Alfonzo and Leinberger, “Walk This Way: The
Economic Promise of Walkable Places in Metropolitan Washington, D.C.”; City of New York Department of
Transportation, “Economic Benefits of Sustainable Streets.”
Storefront Size and Business Mix
A comparison of Mission Street and Calle 24 shows how different built forms can lead to different types of businesses. Calle 24 has relatively small, narrow retail spaces, with an average storefront size of 2,600 square feet. According to local brokers, these smaller spaces are easy to rent, as they are more affordable overall than larger spaces. They can serve either new, independent businesses with lower profit margins, or more established businesses that do not require much space. In comparison, Mission Street’s storefronts are generally larger, with an average size of 3,480 square feet. The larger storefronts have made the corridor more attractive for retailers and restaurants that require larger spaces to display inventory or provide seating for diners, including some formula retailers. However, some of the largest, deepest spaces on Mission Street are challenging to rent, because they appeal to a limited number of tenants and are difficult to subdivide. Some of the larger spaces also require substantial rehabilitation. Source: Strategic Economics, “Calle 24 Retail Study: Final Background Report."

Issue Brief #2: Successful San Francisco NCDs | February 2018 47
• Urban design features that contribute to a human-scale street design. Street design elements
that contribute to a safe and attractive walking environment include: relatively slow vehicular
traffic, wide sidewalks, narrow streets, and safe and frequent pedestrian crossings.76 Other urban
design features that can support a pedestrian-friendly environment include street lighting, a full tree
canopy, other landscaping, painted pavements or pedestrian crossings, street furniture, and parklets
• High-quality public spaces. High-quality public spaces can help make NCDs desirable places for
residents and visitors to spend time. In addition to creating opportunities for community gatherings,
public spaces can help attract increased foot traffic and encourage spontaneous shopping. Public
parks, plazas, and other public spaces may also host outdoor events.
• Cleanliness and safety. A clean, safe environment can make NCDs more welcoming for shoppers.
For example, business owners in some NCDs cite the presence of homeless people, mentally ill
people, and persons with substance use disorders as a challenge in attracting customers and
employees, especially for businesses that offer outdoor seating areas.
Appropriately Designed Storefronts
A successful urban retail district also requires the availability of appropriately designed retail space.
Extensive literature has documented preferred design features for retail space.77 Key features from these
reports are summarized below:
• Sufficient ground floor ceiling height. Typically, floor-to-ceiling heights of 15 feet at minimum
are preferred for ground floor retail. Higher ceilings foster visibility from the street and give light
and a sense of openness to the retail space.
• Transparent frontage and visibility from the street. One of the most frequently cited
characteristics of well-designed ground-floor retail is a transparent façade. Façade transparency
creates an interesting visual experience for pedestrians, fosters “eyes on the street,” allows
businesses to display their products and services to passers-by, and provides more natural light for
businesses. While guidelines differ from place to place, many cities prescribe ample window area
to create open and welcoming spaces for passers-by.
• Sufficient store depth and width. Typically, façade-to-rear wall depths of 60-65 feet are
considered optimal, with a minimum of 30 feet. Preferred widths are often not specified, but 18
feet is seen as a minimum required width.78 However, small, independently owned businesses may
be able to thrive in smaller spaces.
76 National Association of City Transportation Officials, NACTO Urban Street Design Guide. 77 Grant, “Designing at Ground Level”; Gehl Architects, “Public Spaces and Public Life: Recommendations”;
Alameda County, California, “Design Guidelines for Residential Mixed-Use Projects”; City of New York, “Active
Design: Shaping the Sidewalk Experience”; Kent, “A Street You Go To, Not Just Through”; City of New York
Department of Housing Preservation and Development and Design Trust for Public Space, “Laying the Groundwork:
Design Guidelines for Retail and Other Ground-Floor Uses in Mixed-Use Affordable Housing Developments”; City
of San Francisco Planning Department, “Standards for Storefront Transparency: Planning Code Requirements for
Commercial Businesses.” 78 City of New York Department of Housing Preservation and Development and Design Trust for Public Space,
“Laying the Groundwork: Design Guidelines for Retail and Other Ground-Floor Uses in Mixed-Use Affordable
Housing Developments.”

Issue Brief #2: Successful San Francisco NCDs | February 2018 48
• Appropriate signage and exterior lighting. Stores should display signs that are visible from the
street and sidewalk, legible, and interesting. Exterior lighting is often recommended to foster a
sense of safety and to keep the street inviting into the evening hours.
• Appropriate utilities, heating/cooling, and ventilation infrastructure. Different types of
businesses have different infrastructure needs. Restaurants in particular require appropriate
ventilation.
Older buildings often have lower ceilings, deeper storefronts, smaller windows, and more limited
ventilation and other infrastructure than is typically found in well-designed, modern retail spaces. Despite
these drawbacks, many business owners still find San Francisco’s older, mixed-use retail buildings
attractive because of their architecture, history, and location. However, the tenant improvements required
to make some spaces suitable for new uses can be significant. The costs associated with renovating older
storefronts are discussed in Issue Brief #3.

Issue Brief #2: Successful San Francisco NCDs | February 2018 49
Factor 3: Physical Form and Built Environment in the Case Study NCDs
The case study NCDs illustrate the range of district configurations (urban shopping street, major arterials, and multiple corridors within a broader commercial district). They also vary significantly in their architectural character and street environment. These factors are described below.
The physical form of Upper Fillmore has contributed to the NCD’s emergence as one of the most successful urban shopping streets in San Francisco, and a citywide and regional destination. The distance between Bush and Clay Streets – the heart of the district, where the concentration of retail and restaurants is the highest – is roughly a five-minute walk. The corridor includes a mix of historic Victorian buildings and newer structures, as well as smaller and larger store space, creating visual diversity. Both sides of the street are lined with active storefronts. Several establishments along the corridor have outdoor seating, which brings activity onto the sidewalk, and portions of the corridor are lined with a canopy of trees. The street is relatively narrow, with slow traffic. All these elements contribute to a welcoming, interesting, and intimate environment for foot traffic
Ocean Avenue and Outer Geary are both major, historically car-oriented arterials, with very different pedestrian environments. Ocean Avenue has three to four lanes and relatively fast-moving traffic, but the City and Ocean Avenue Association have worked together to invest in improved façades, plant sidewalk gardens and trees, add new pedestrian crossings, and widen the sidewalk, creating a welcoming pedestrian environment. Nodes of activity have emerged around key anchors, including in the few blocks around the new Ingleside Branch Library and Whole Foods Market. In contrast, Outer Geary Boulevard is wider (four to six lanes) with heavier traffic. Outer Geary attracts significant foot and vehicle traffic, but faces many physical challenges including poorly maintained sidewalks, buildings, and signage, as well as many long-term small businesses that could benefit from façade and other tenant improvements, and there are few distinct nodes of activity.
The commercial corridors within the Mission District make up a larger commercial district with a unique identity. Visitors will often spend time on multiple corridors during one trip (for example, to visit restaurants and bars on Mission and Valencia, or shop on Mission and Calle 24). Mission Street functions as the neighborhood’s commercial spine and is also a regional arterial, connecting San Francisco’s downtown to its most southern neighborhoods. Within the neighborhood, Mission Street functions as a wide boulevard with a vibrant pedestrian atmosphere, which is reinforced by the presence of two major BART stations at 16th and 24th Streets, and several major bus lines. The retail mix serves both the daily needs of resident workers, and offers comparison shopping and eclectic dining opportunities. Calle 24 is the Mission’s cultural heart, with many arts and cultural institutions as well as restaurants and retail. The street itself is narrow, with relatively narrow sidewalks and a lively pedestrian atmosphere.

Issue Brief #2: Successful San Francisco NCDs | February 2018 50
4. Transportation & Access
Accessibility is a critical component of a successful retail location. In more suburban environments,
excellent vehicle access and ease of parking are typically considered critical features of successful retail
districts. In San Francisco’s NCDs and other urban commercial districts, many customers do use private
vehicles for shopping trips, but other modes of transportation are equally – and in some cases, more –
important. The importance of convenient access by a range of transportation modes, and of managing
parking and curb space, are discussed below.
Convenient Access by Foot, Bicycle, Transit, and Car
As described in the previous section, a safe, welcoming pedestrian environment can help draw foot traffic
from the local trade area and other nearby neighborhoods, and result in increased sales. Bicycle
infrastructure (including bicycle lanes and parking) have also been shown to support increased sales and
other measures of success in urban shopping districts.79
Excellent access to BART and Muni can also support successful NCDs, helping a district draw customers
from a citywide or regional trade area. For example, the Mission Street and Calle 24 corridors benefit from
excellent accessibility both by car and from the two BART stations at 16th Street and 24th Street, which has
helped these districts emerge as regional destinations for dining and nightlife. However, other regional-
serving districts rely more on the automobile. For example, Upper Fillmore is not served by rail transit, but
draws citywide and regional customers by car (for example, from Marin County). The district is also easily
accessible from San Francisco’s northeastern neighborhoods by foot.
Managed Parking
Parking in urban commercial districts is by necessity limited, and subject to the needs of many competing
uses (including shoppers, workers, residents, and other visitors). There is no consensus on how much on-
street and off-street parking is required in urban retail streets. The topic has been written about extensively
(e.g., evaluations of the impact of replacing parking with parklets, or of new bicycle lanes on business
performance), and findings tend to vary by place and by retail environment.80 In general, places that are
centrally located with reliable and frequent transit options may not require as much off-street parking as
more auto-oriented neighborhoods.
Given the unevenness of transit accessibility across San Francisco, different NCDs likely require different
parking strategies. Even in NCDs with excellent BART or Muni access (e.g. the Mission, the Castro, Hayes
Valley, Ocean Avenue), some merchants perceive convenient customer parking as critical to their business
performance.
In general, transportation experts recommend comprehensively managing on-street and off-street parking
in urban commercial corridors, using time management and/or pricing strategies. In urban commercial
districts, best practices include treating the most desirable on-street parking spaces differently than off-
79 Drennen, “Economic Effects of Traffic Calming on Urban Small Businesses”; Kent, “A Street You Go To, Not Just
Through.” 80 Jaffe, “The Complete Business Case for Converting Street Parking Into Bike Lanes”; Jaffe, “4 Reasons Retailers
Don’t Need Free Parking to Thrive”; Beyard, Pawlukiewicz, and Bond, “Ten Principles for Rebuilding Neighborhood
Retail”; Gibbs, Principles of Urban Retail Planning and Development; McCahill and Rhodes-Conway, “Urban
Parking: Rational Policy Approaches for Cities and Towns.”
Issue Brief #2: Successful San Francisco NCDs | February 2018 51
street parking or on-street neighborhood parking located further away. For example, to encourage turnover,
prime on-street spaces can be assigned shorter time restrictions or higher hourly prices. Taking this a step
further, innovative demand-responsive priced parking has recently been implemented in cities such as New
York and San Francisco. The aim of these new technologies is to maintain parking occupancy rates steadily
at 60-80 percent.81 This outcome can support merchants, who tend to value easily accessible, convenient
parking in close proximity to their stores.82 Finally, the establishment of a parking benefit district can be an
effective complementary strategy to priced parking. This type of district redirects a share of revenues
towards improving the area’s streets and infrastructure. This is also seen as a benefit to local business
owners and merchants.83
Other Curb Space Management
In urban commercial districts, already-limited curb space and streets are needing to accommodate a growing
number of new, competing users. In addition to buses, taxis, and on-street parking, curb space users include
a proliferating number of “transportation network company” (TNC) vehicles (see text box below); delivery
vehicles (trucks and vans delivering products to stores, and private vehicles delivering goods and services
to households via companies like Caviar, UberEats, Amazon, Instacart, etc.); and employer-run buses and
shuttles. These competing needs can create conflict, especially in dense, congested areas or narrow streets
– as when TNCs or delivery trucks park in bicycle lanes, at bus stops, or in traffic lanes because of the lack
of loading zones.84 Several interviewees mentioned the need to better manage these growing conflicts in
San Francisco’s NCDs.
As these issues are emerging in response to relatively new technologies, comprehensive curb management
best practices have not yet been established.85 However, some examples of curb management strategies
include: increased on-street loading bays, “flex” on-street loading zones that vary by time of day, or
initiatives to encourage bicycle and pedestrian deliveries.86
81 McCahill and Rhodes-Conway, “Urban Parking: Rational Policy Approaches for Cities and Towns.” 82 Downing, “Castro Merchants Talk Demand-Responsive Parking Meter Pricing, Set To Roll Out Citywide In 2017”;
Shoup, “The Price of Parking on Great Streets.” 83 McCahill and Rhodes-Conway, “Urban Parking: Rational Policy Approaches for Cities and Towns”; Litman,
“Parking Management: Strategies, Evaluation, and Planning”; Shoup, “The Price of Parking on Great Streets.” 84 Urban, “With Online Shopping on the Rise, Cities Look to Address Congestion Impacts of Deliveries”; Fitzgerald
Rodriguez, “Mayor Lee to Tackle Uber, Lyft Traffic Congestion through Pilot Program.” 85 SFCTA, “TNCs Today: A Profile of San Francisco Transportation Network Company Activity (DRAFT).” 86 City of San Francisco, “Better Market Street: Loading and Delivery Management Best Practices”; Holguin-Veras
et al., “Improving Freight System Performance in Metropolitan Areas.”

Issue Brief #2: Successful San Francisco NCDs | February 2018 52
Transportation Network Companies (TNCs) and NCDs Transportation Network Companies (TNCs), such as Uber and Lyft, are emerging as an important way that some customers access San Francisco’s NCDs. Several interviewees mentioned that the increasing reliance on TNCs may reduce parking needs in NCDs, and might also facilitate visitation, especially for restaurants, bars, and venues that operate in the evening. Because the TNC companies are reluctant to distribute their data, limited research has been conducted on TNC travel patterns. Nonetheless, two recent reports provide some preliminary insights on how TNCs might impact urban retail districts.
• A survey conducted in 2016 by the American Public Transportation Association found that TNCs were most commonly used for recreation/social trips, especially on weekends and at times when transit service was less frequent or unavailable (i.e. between the hours of 10 pm and 4 am). Respondents suggested that TNCs were often the preferred mode of travel when recreation/social trips involved alcohol consumption. Respondents were less likely to use TNCS for commutes and shopping/errands trips.1
• Recent research conducted by the San Francisco County Transportation Authority provides preliminary trends of TNC usage in San Francisco.2 The study found that TNCs had a relatively wide geographic coverage in the city. The highest densities of TNC pickups/drop-offs were in central areas like Downtown (Union Square, Market/Van Ness, Transbay Terminal, Embarcadero) and South of Market, and the northeast quadrant of the city (Chinatown, North Beach). However, several other corridors also had relatively high pickup/drop-off density, including Geary Boulevard, Mission Street, Valencia Street, and smaller pockets along neighborhood streets like 19th Avenue in the Sunset, 3rd Street in Dogpatch, San Bruno Avenue, and Ocean Avenue. This report also found that TNC usage was highest on Fridays and Saturdays, especially in the afternoon and evening hours.
1 54 percent of respondents reported using TNCs for recreation/social trips, versus only 16 percent for shopping/errands. Shared-Use Mobility Center, “Shared Mobility and the Transformation of Public Transit.” 2 SFCTA. “TNCs Today: A Profile of San Francisco Transportation Network Company Activity (DRAFT).”

Issue Brief #2: Successful San Francisco NCDs | February 2018 53
Factor 4: Transportation & Access in the Case Study NCDs The Mission Street and Calle 24 corridors benefit from excellent accessibility both by car and from transit, including several bus lines and two BART stations at 16th Street and 24th Street. BART accessibility has helped the corridors emerge as regional destinations for dining and nightlife. The corridors are also very centrally located within the City, well served by bus, and easily accessible by bicycle from Downtown and the City’s relatively flat, southeastern neighborhoods. The Ocean Avenue case study area is located near a BART station and a Muni rail station, but separated from the stations by I-280 and the Community College of San Francisco campus. The local merchants’ association is working on developing stronger partnerships with BART to facilitate and accelerate improvements to the streets and infrastructure connecting the corridor to Balboa Park BART station. Upper Fillmore is not served by BART or Muni rail. However, Fillmore Street is served by the 22 Fillmore bus and the NCD is very walkable, and surrounded by high density neighborhoods from which customers can easily walk. Shoppers will also often walk in from surrounding neighborhoods such as the Fillmore District and Japantown, or take the bus from other neighborhoods in San Francisco. The corridor also sees many customers from the outside the City – especially from the North Bay, from which it is most easily accessible – arriving by car and using the nearby public parking lots. Anecdotally, the merchants’ association has also noticed increased use of TNCs, especially for customers visiting the corridor in the evening for eating, drinking and entertainment. Outer Geary is a busy arterial served by bus (but no rail transit) service. Many drivers and transit riders perceive Geary as an urban freeway, not a place to slow down, stop, and shop.1,2 Discussions of a new Bus Rapid Transit (BRT) line have been ongoing for several years, and the San Francisco Board of Supervisors approved the final environmental report in 2017. While some stakeholders are enthusiastic about the prospect of better connections to the rest of the city, others – including some business and property owners – are concerned about the impacts construction will have in the short-term, and about rent increases in the long-term. 1 City and County of San Francisco Office of Economic and Workforce Development, “Geary Boulevard: Neighborhood Profile”. 2 City and County of San Francisco Planning Department, “Supervisor District 1: Community Needs Assessment;” City and County of San Francisco Planning Department, “Supervisor District 1: Existing Conditions.”
Issue Brief #2: Successful San Francisco NCDs | February 2018 54
5. District Management and Capacity
Engaged leadership from a merchants’ association or other district management organization can make a
significant difference in the trajectory of an NCD, particularly when the organization has a dedicated
funding source (such as property or business special assessments, grants, or special event income).
District Management Organization
District management organizations are typically non-profit organizations such as merchants’ associations,
property and business improvement districts (known in San Francisco as Community Benefit Districts or
Business Improvement Districts), neighborhood economic development agencies, or community
development corporations (CDCs). Depending on their financial and staffing capacity, district management
organizations can fulfill one or more of the following roles:
• Create unity and a shared vision among tenants and property owners, and coordinate efforts around
meeting that vision. For example, this could take the form of coordinating business hours to ensure
that a majority of businesses are open at similar hours, and that those hours match the time of day
when people are likely to frequent the corridor.
• Represent and advocate on behalf of business and property owners.
• Build partnerships on behalf of the district with community groups, residents, and customers.
• Help shape the district’s business mix by working with local brokers to fill vacant storefronts.
• Program events (e.g., street fairs, concert series, movie nights).
• Market on behalf of the district.
• Improve public safety (e.g., by hiring public safety ambassadors to work with the homeless or
address other challenges).
• Provide additional street or sidewalk cleaning.
• Advocate for and/or fund landscaping and streetscape improvements.
• Provide small business assistance.
Many of these efforts require significant capacity, including a dedicated revenue source and staff. In San
Francisco, potential funding mechanisms for these activities include Community Benefit District (CBD) or
Business Improvement District (BIDs) special assessments; grants funded by the City, banks, or
foundations; and other self-generated funds such as special events. An ongoing, reliable revenue stream can
be of significant assistance to neighborhoods that wish to fund improvements in their NCDs,87 although
even district management organizations with dedicated funding may not have sufficient financial or staffing
resources to meet all identified needs. The following section discusses the role of CBDs and BIDs in more
detail.
Dedicated Funding Source
One of the key funding mechanisms for many district management organizations is a CBD or BID. CBDs
or BIDs are public/private partnerships in which commercial property owners and/or business owners agree
87 Ortiz, “Improving Tenant Mix: A Guide for Commercial Practitioners.”

Issue Brief #2: Successful San Francisco NCDs | February 2018 55
(by majority vote) to pay a special assessment. Revenue from the special assessment creates an ongoing
funding source for the provision of economic development activities and services such as street cleaning,
public safety, beautification, streetscape improvements, marketing, and advocacy. CBDs are managed by
non-profit organizations, formed by representatives of the business and property owners who pay the
assessment. In addition to collecting assessments, these non-profit organizations are also able to receive
donations and grants, and to generate additional funds through special events and other activities.
Establishing a CBD typically requires a multi-year effort to build support among businesses and property
owners, and develop district boundaries, budgets, and management plans, among other steps. San Francisco
currently has 15 CBDs in place, including in Ocean Avenue, the Castro, and Japantown.
The formation of CBD/BIDs has generally been shown to have positive economic and community impacts
on commercial districts, including higher property values,88 lower crime rates,89 and improved community
satisfaction with the area. A study led in 2013 by San Francisco’s OEWD compared equivalent CBD and
non-CBD corridors, and found that CBD-corridors had higher levels of cleanliness and experienced less
sales revenue loss and lower commercial vacancy rates during the 2007-2009 recession, compared to similar
non-CBD corridors.90
88 Furman Center for Real Estate & Urban Policy, “The Benefits of Business Improvement Districts: Evidence from
New York City.” 89 Han, “Impacts of Business Improvement Districts on Crime Outcomes in the City of Philadelphia: Dynamic Panel
Data Analysis”; MacDonald et al., “Neighborhood Effects on Crime and Youth Violence: The Role of Business
Improvement Districts in Los Angeles.” 90 City of San Francisco OEWD, “Impact Analysis of Community Benefit Districts.”
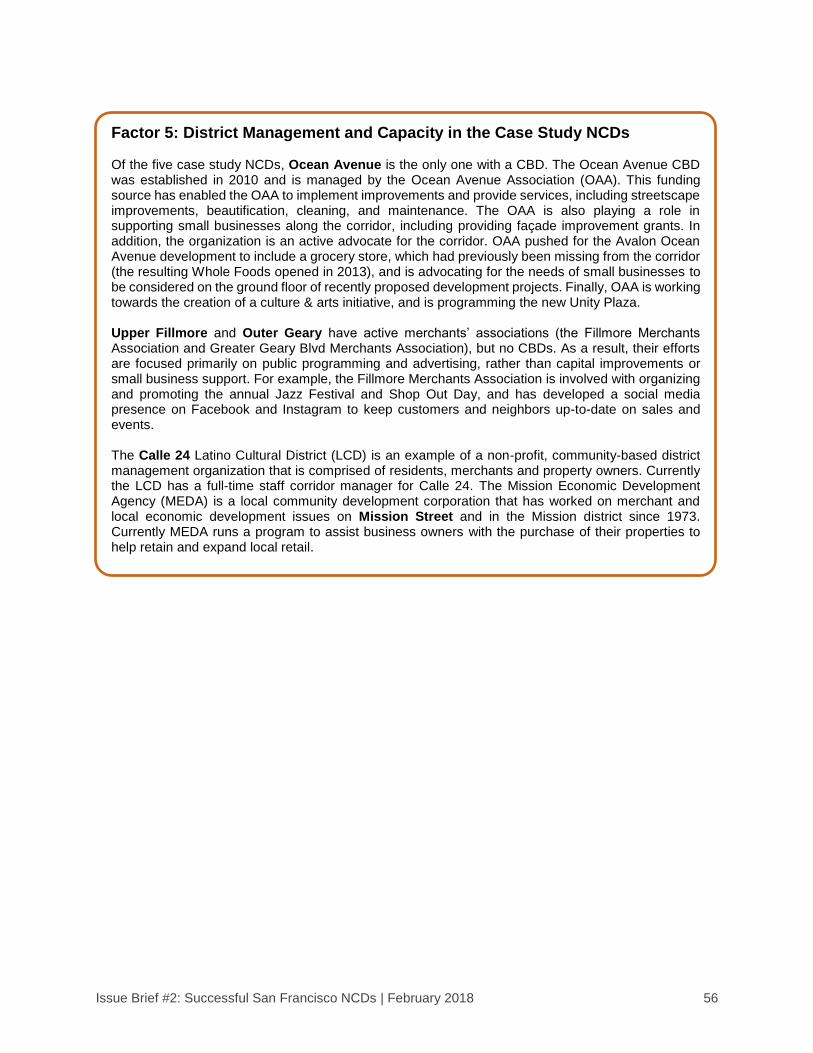
Issue Brief #2: Successful San Francisco NCDs | February 2018 56
Factor 5: District Management and Capacity in the Case Study NCDs Of the five case study NCDs, Ocean Avenue is the only one with a CBD. The Ocean Avenue CBD was established in 2010 and is managed by the Ocean Avenue Association (OAA). This funding source has enabled the OAA to implement improvements and provide services, including streetscape improvements, beautification, cleaning, and maintenance. The OAA is also playing a role in supporting small businesses along the corridor, including providing façade improvement grants. In addition, the organization is an active advocate for the corridor. OAA pushed for the Avalon Ocean Avenue development to include a grocery store, which had previously been missing from the corridor (the resulting Whole Foods opened in 2013), and is advocating for the needs of small businesses to be considered on the ground floor of recently proposed development projects. Finally, OAA is working towards the creation of a culture & arts initiative, and is programming the new Unity Plaza. Upper Fillmore and Outer Geary have active merchants’ associations (the Fillmore Merchants Association and Greater Geary Blvd Merchants Association), but no CBDs. As a result, their efforts are focused primarily on public programming and advertising, rather than capital improvements or small business support. For example, the Fillmore Merchants Association is involved with organizing and promoting the annual Jazz Festival and Shop Out Day, and has developed a social media presence on Facebook and Instagram to keep customers and neighbors up-to-date on sales and events. The Calle 24 Latino Cultural District (LCD) is an example of a non-profit, community-based district management organization that is comprised of residents, merchants and property owners. Currently the LCD has a full-time staff corridor manager for Calle 24. The Mission Economic Development Agency (MEDA) is a local community development corporation that has worked on merchant and local economic development issues on Mission Street and in the Mission district since 1973. Currently MEDA runs a program to assist business owners with the purchase of their properties to help retain and expand local retail.

Issue Brief #3: Costs and Challenges for NCD Businesses | February 2018 57
ISSUE BRIEF #3: COSTS AND CHALLENGES FOR
RETAIL, RESTAURANTS, AND PERSONAL
SERVICES IN SAN FRANCISCO’S NEIGHBORHOOD
COMMERCIAL DISTRICTS

Issue Brief #3: Costs and Challenges for NCD Businesses | February 2018 58
ISSUE BRIEF SUMMARY
Purpose and Approach
This issue brief explores the specific opportunities, costs, and challenges for retail, restaurants, and personal
service businesses located in San Francisco’s NCDs, and summarizes adaptations that businesses are
making in response to these challenges and the broader industry trends discussed in Issue Brief #1. The
findings in this issue brief are based primarily on interviews conducted for this study, including discussions
with San Francisco retail brokers, business owners, staff from merchants’ associations, community benefit
districts, business assistance providers, and other stakeholders. Findings from recent news articles and other
literature, as well as other relevant data, are also incorporated where appropriate.
Key Findings
While San Francisco has many competitive advantages for retail, restaurants, and personal services,
businesses located in the city also face many challenges. These include:
• Employee recruitment and retention challenges associated with low regional unemployment
rates, high local and regional housing costs, and competition with other industries offering better
compensation or more flexible hours.
• High cost of doing business. These include high labor costs related to competition for labor, high
cost of living, and the unintended consequences of San Francisco’s progressive labor laws; and
high rents, including lease structures with automatic rent escalations.
• Lengthy and complex permitting process that can add significant cost and time to the process of
opening a new business. In addition, some laws intended to protect traditional retail by limiting
other uses may limit retailers’ flexibility to adapt to changing economic conditions (e.g., by serving
food and beverage), or restrict complementary uses that could drive foot traffic to businesses (e.g.,
restaurants, personal services, professional services, or medical or office uses).
• Challenges adapting to a changing market, such as the loss of long-time customer base due to
demographic change, and increasing competition from other brick-and-mortar locations (such as
the proliferation of grocery stores and restaurants) as well as e-commerce. For some business
owners, these challenges are compounded by a lack of technical expertise or financial resources to
adopt new technologies, or invest in capital improvements or new inventory to appeal to a changing
clientele.
• Public realm challenges, including real and perceived issues around cleanliness, order, and safety,
which may deter customers; and long-term vacancies, which contribute to a sense of disinvestment.
In response to national trends and local challenges, some businesses are adopting creative and varied
strategies to survive. These strategies generally aim to expand sales (for example, by selling products
online or expanding online marketing); reduce costs or pass costs on to customers; and/or diversify revenue
streams (for example, by serving food or alcohol at stores and galleries).
While adopting these types of strategies will help some businesses continue to thrive, change is
challenging, and some businesses will not be able to adapt to a changing market. Policies and programs
may support business owners by providing technical expertise or financial resources, but cannot force
change on an unwilling business owner, or overcome fundamental challenges (e.g., lack of sufficient market
demand for products or services).
Issue Brief #3: Costs and Challenges for NCD Businesses | February 2018 59
Organization
The issue brief is organized in three sections:
• A brief review of San Francisco’s main competitive advantages for retail and restaurants;
• A discussion of the major costs and challenges that businesses in retail, restaurant, and personal
service industries in San Francisco face, based on findings from the interviews; and
• A summary of the diverse ways that businesses are adapting to the challenges discussed in this
issue brief, as well as to the broader industry trends and other factors discussed in previous issue
briefs.
SAN FRANCISCO’S COMPETITIVE ADVANTAGES FOR RETAIL,
RESTAURANTS, AND PERSONAL SERVICES
The City of San Francisco remains a prime location for retail, restaurants, and personal services due to its
unique competitive advantages. As discussed in Issue Brief #1, retail and restaurant sales in San Francisco
have grown rapidly since the end of the recession, and the City’s retail sector appears to have been protected
(at least until recently) from some of the challenges affecting the retail industry nationally.
The opportunities for retail, restaurants, and personal service businesses in San Francisco include:
• Strong economy, high household incomes, and low unemployment rates. San Francisco has
seen rapid job growth since the end of the last recession, driven by the expansion of the tech
industry. The City’s unemployment rate reached a low of 2.7 percent in May 2017, substantially
lower than the state and national rates.91 Citywide, the median income was $81,000 in 2015, with
over one third of households making over $125,000.92 The City is also densely populated in many
neighborhoods. These factors translate into overall high spending power and significant demand
for retail, restaurants, and personal services.
• Significant regional and international tourism. As discussed in Issue Brief #1, San Francisco
benefits from significant regional, national, and international visitation, as well as travel for
conventions and trade.93 Many visitors come to shop and dine: a recent survey of tourists found that
“restaurants and cuisine” was one of the top reasons for visiting San Francisco, while “dining in
restaurants” and “shopping” were the top two activities of visitors.94 Union Square is considered
one of the most successful retail districts in the country,95 while visitation to the NCDs appears to
be increasing as well.
• A local culture that values shopping local and eating out. While difficult to quantify, many
aspects of San Francisco culture support neighborhood retail, including a desire for unique urban
experiences, the value that many residents’ place on supporting small and local businesses, and a
“foodie” culture that places great significance on dining out.
91 California Employment Development Department, 2017. 92 U.S. Census ACS 5-year estimates, 2011-2015. 93 San Francisco Travel Association, “San Francisco Fact Sheet.” 94 San Francisco Travel Association, “San Francisco Fact Sheet.” 95 Buxton, “Top 10 Most Sought-After U.S. Retail Streets”; JLL, “City Retail: Understanding North America’s Prime
Urban Corridors.”

Issue Brief #3: Costs and Challenges for NCD Businesses | February 2018 60
• The quality of the built environment in many of San Francisco’s NCDs: Many of the City’s
NCDs have interesting and diverse architecture, historic buildings, and pedestrian-oriented streets.
As discussed in Issue Brief #2, these factors are conducive to more successful urban retail.
COSTS AND CHALLENGES FOR RETAIL, RESTAURANTS, AND
PERSONAL SERVICES IN SAN FRANCISCO’S NCDS
The opportunities described above provide a strong economic foundation for businesses in the retail,
restaurant, and services industries in San Francisco. At the same time, however, businesses located (or
searching for a location) in San Francisco face many challenges. This section focuses on the challenges that
are specific to economic, regulatory, and socioeconomic conditions in San Francisco, but also references
some of the challenges associated with the broader industry trends described in Issue Brief #1.
These challenges are organized in the following eight categories:
1. Employee recruitment and retention;
2. San Francisco labor laws;
3. Land use regulations and permitting requirements;
4. Real estate conditions;
5. Increasing competition with online sales and other sources;
6. Demographic changes;
7. Lack of technical expertise or capital; and
8. Public realm challenges.
1. Employee Recruitment and Retention
The difficulty of recruiting and retaining appropriately qualified employees was consistently brought up by
interviewees as one of the top challenges that San Francisco businesses face. This trend, which appears to
have accentuated in recent years, appears to be related to a variety of local and regional economic
conditions, including:
• Low unemployment rates. Very low unemployment rates are creating challenges for Bay Area
employers in many industries. As shown in Figure 13, San Francisco’s unemployment rate has
steadily declined since recovery from the Great Recession, reaching a low of 2.7 percent in May
2017. The Bay Area’s unemployment rate was at just 3.3 percent in July 2017, compared to 5.4
percent for California and 4.6 percent for the nation. It is important to note that unemployment is
cyclical, and that the labor shortage is related to the strong city and regional economy.
• Growing competition from industries offering higher pay or more flexible hours. The retail,
restaurant, and service industries generally offer relatively low-wage jobs, although some business
owners report offering higher wages to attract and retain workers. Nonetheless, in a tight labor
market, workers may have other options, including in the growing freelance, gig, and sharing
economy. Other industries may offer higher-wages or more appealing work conditions including
more flexible hours, schedules that employees control, and/or easier commutes. For example, a few
interviewees speculated that driving for Uber/Lyft – a very flexible type of work that can be picked
up easily full-time or part-time, and where workers can set their own hours – was becoming a

Issue Brief #3: Costs and Challenges for NCD Businesses | February 2018 61
source of employment for workers who might otherwise be employed in the retail, restaurant, or
personal services industries.
• High cost of living. As rents have increased dramatically over the last several years, low and even
middle-income households are increasingly struggling to afford living in San Francisco. Business
owners report that many of their workers are commuting long distances to reach jobs in San
Francisco and end up seeking employment closer to home. The limitations of the transportation
system (i.e., BART does not run late at night or in the early morning) adds to the challenge of filling
very early or late shifts. Business owners also indicated that some long-term employees have left
the Bay Area entirely because of the cost of living.
Figure 13. Unemployment Rate in the City of San Francisco, 1990-2017 (May of Each Year)
*Data is displayed for the month of May of each year. Source: California EDD, 2017.
Note that labor recruitment and retention challenges affect different firms in different ways. For example,
in addition to the general challenges described above, restaurants are also dealing with a shortage of chefs
and other skilled labor related to a variety of industry specific factors (described in Issue Brief #1). The
labor shortage is driving the industry to shift towards less labor-intensive business models. On the other
hand, some very small businesses are insulated from the labor shortage either because they exclusively
employ family members, or because they have a few, long-term workers and have not experienced
significant employee turnover.
2. San Francisco’s Labor Laws
Businesses operating in San Francisco must abide by the City’s progressive labor laws, which are generally
aimed at “improving pay, access to health care, and paid sick leave for all workers, particularly lower-wage
workers.”96 Figure 14 summarizes the laws currently in effect.
The City’s minimum wage applies to all workers in San Francisco, except for individuals who are the
parents, spouses, domestic partners, or children of the employer. Other laws impose different requirements
96 Reich, Jacobs, and Dietz, When Mandates Work: Raising Labor Standards at the Local Level.
3.2%
6.5%
3.9%
8.5%
2.7%
0%
1%
2%
3%
4%
5%
6%
7%
8%
9%
2000 2001 2002 2003 2004 2005 2006 2007 2008 2009 2010 2011 2012 2013 2014 2015 2016 2017
Une
mp
loym
en
t R
ate
*

Issue Brief #3: Costs and Challenges for NCD Businesses | February 2018 62
on businesses depending on the number of workers they employ. For example, the Paid Sick Leave
Ordinance applies to all employees, but employees at firms with 10 or more workers can accrue more hours
of sick leave. The Health Care Security Ordinance and Family Friendly Workplace Ordinance both apply
only to firms with 20 or more workers nationwide, and larger firms are required to provide more generous
health care benefits.
Previous studies of minimum wage increases have found that in cities and regions with low unemployment,
high incomes, and a high cost of living, minimum wage increases do not generally lead to job losses or
fewer hours worked. Rather, the increased cost of labor associated with a minimum wage increase is
typically passed on to customers through higher prices on goods and services, recouped in savings from
reduced worker turnover, or absorbed by businesses in the form of reduced profits. While some businesses
with low profit margins may close due to higher costs, the resulting job losses may be absorbed by other
businesses expanding (see additional discussion of findings from the literature in the text box below).
Anecdotally, many interviewees report that San Francisco retail, restaurant, and service businesses have
increased employee wages and benefits in recent years. However, interviewees almost universally agreed
that the increase in compensation has occurred primarily in response to the tight labor market, the high cost
of living, and competition from other industries – rather than in direct response to the City’s increasing
minimum wage or other labor laws. That said, some interviewees believed that the City’s minimum wage
still results in higher wages, especially for the lowest paid workers. In addition, complying with the City’s
labor laws can require significant time and effort.
It is important to note that increased labor costs – whether they result from economic conditions or
regulations – affect different types of businesses differently. Businesses with high profit margins, or with
customers who are not particularly price sensitive, may be able to pass the costs on to consumers relatively
easily. On the other hand, low-margin businesses with price-sensitive customers may be affected more
significantly. Compliance costs can also be particularly burdensome for smaller and lower-margin
businesses, which often have no human resources staff. For example, these dynamics appear to be playing
out in the restaurant industry: fine dining establishments have reportedly been able to pass increased labor
costs on to diners, often in the form of a surcharge (i.e., a charge that is added at the end of a transaction
and is not reflected in the prices for individual items). In contrast, lower- and middle-tier establishments
have struggled more with the rising cost of labor. Increased labor costs also appear to be one factor driving
the restaurant industry towards less labor-intensive business models, such as fast casual concepts.
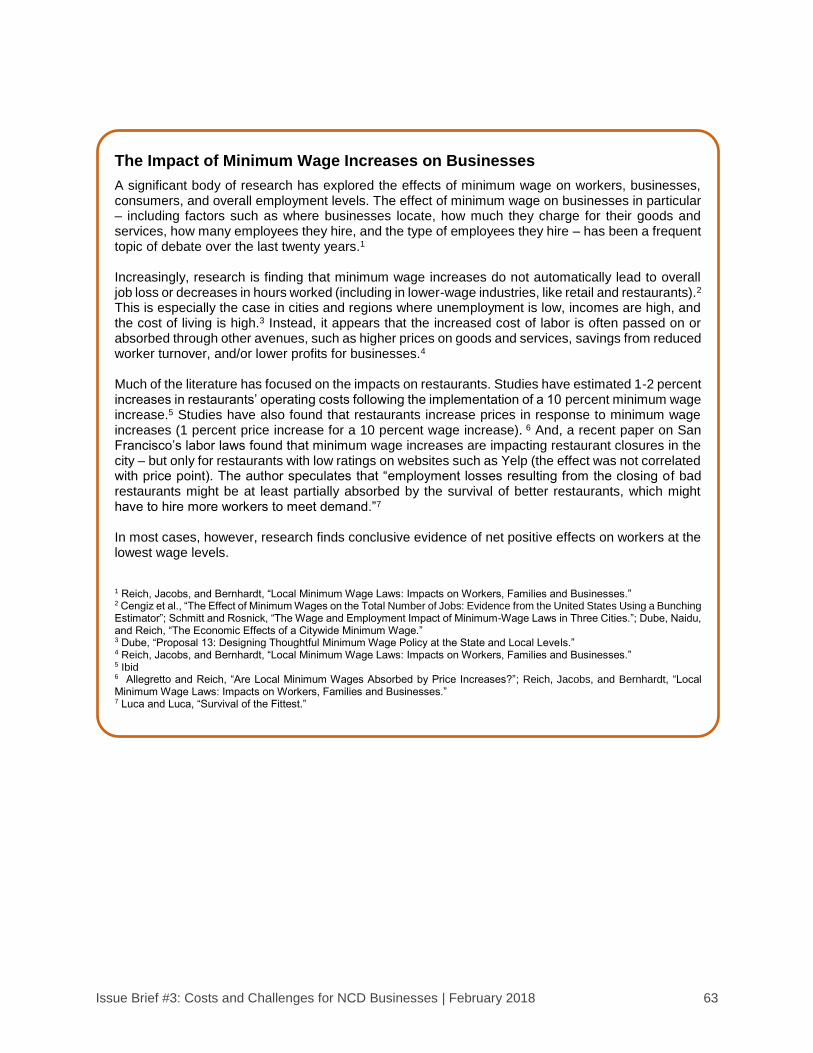
Issue Brief #3: Costs and Challenges for NCD Businesses | February 2018 63
The Impact of Minimum Wage Increases on Businesses
A significant body of research has explored the effects of minimum wage on workers, businesses, consumers, and overall employment levels. The effect of minimum wage on businesses in particular – including factors such as where businesses locate, how much they charge for their goods and services, how many employees they hire, and the type of employees they hire – has been a frequent topic of debate over the last twenty years.1 Increasingly, research is finding that minimum wage increases do not automatically lead to overall job loss or decreases in hours worked (including in lower-wage industries, like retail and restaurants).2 This is especially the case in cities and regions where unemployment is low, incomes are high, and the cost of living is high.3 Instead, it appears that the increased cost of labor is often passed on or absorbed through other avenues, such as higher prices on goods and services, savings from reduced worker turnover, and/or lower profits for businesses.4 Much of the literature has focused on the impacts on restaurants. Studies have estimated 1-2 percent increases in restaurants’ operating costs following the implementation of a 10 percent minimum wage increase.5 Studies have also found that restaurants increase prices in response to minimum wage increases (1 percent price increase for a 10 percent wage increase). 6 And, a recent paper on San Francisco’s labor laws found that minimum wage increases are impacting restaurant closures in the city – but only for restaurants with low ratings on websites such as Yelp (the effect was not correlated with price point). The author speculates that “employment losses resulting from the closing of bad restaurants might be at least partially absorbed by the survival of better restaurants, which might have to hire more workers to meet demand.”7 In most cases, however, research finds conclusive evidence of net positive effects on workers at the lowest wage levels. 1 Reich, Jacobs, and Bernhardt, “Local Minimum Wage Laws: Impacts on Workers, Families and Businesses.” 2 Cengiz et al., “The Effect of Minimum Wages on the Total Number of Jobs: Evidence from the United States Using a Bunching Estimator”; Schmitt and Rosnick, “The Wage and Employment Impact of Minimum-Wage Laws in Three Cities.”; Dube, Naidu, and Reich, “The Economic Effects of a Citywide Minimum Wage.” 3 Dube, “Proposal 13: Designing Thoughtful Minimum Wage Policy at the State and Local Levels.” 4 Reich, Jacobs, and Bernhardt, “Local Minimum Wage Laws: Impacts on Workers, Families and Businesses.” 5 Ibid 6 Allegretto and Reich, “Are Local Minimum Wages Absorbed by Price Increases?”; Reich, Jacobs, and Bernhardt, “Local Minimum Wage Laws: Impacts on Workers, Families and Businesses.” 7 Luca and Luca, “Survival of the Fittest.”

Issue Brief #3: Costs and Challenges for NCD Businesses | February 2018 64
Figure 14. San Francisco Labor Laws, 2017
Law Description
Minimum Wage
Ordinance
All employees who work in San Francisco more than two hours per week, including
part-time and temporary workers, are entitled to the San Francisco minimum wage*
($14.00 per hour as of July 2017). The minimum wage has been increasing gradually
since voters approved the ordinance in 2014 and is scheduled to reach $15.00 an hour
in July 2018. After 2018, the minimum wage will increase annually with the Consumer
Price Index.
Paid Sick Leave
Ordinance
All employees who work in San Francisco, including part-time and temporary workers,
are entitled to paid time off from work when they are sick or need medical care, and to
care for their family members or designated person when those persons are sick or
need medical care. Employers with 10 or more employees must allow workers to
accrue more sick leave.
Lactation in the
Workplace Ordinance
(effective January 2018)
All employers are required to provide employees breaks and a location for lactation
and must have a policy regarding lactation in the workplace that specifies a process by
which an employee will make a request for accommodation.
Consideration of Salary
History Ordinance
(effective July 2018)
All employers, including City contractors and subcontractors, are prohibited from
considering current or past salary of an applicant in determining whether to hire an
applicant or what salary to offer the applicant. The ordinance prohibits employers from
asking applicants about their current or past salary or disclosing a current or former
employee’s salary history without that employee’s authorization, unless the salary
history is publicly available.
Health Care Security
Ordinance
Employers with 20 or more employees (in any location), as well as and non-profit
employers with 50 or more employees, must spend a minimum amount set by law on
health care for each employee who works eight or more hours per week in San
Francisco.
Family Friendly
Workplace Ordinance
Employers with 20 or more employees (in any location) are required to consider
employees' requests for flexible or predictable work arrangements to assist with
caregiving responsibilities.
Fair Chance Ordinance Employers with 20 or more employees (in any location) are required to follow new
rules regarding applicants’ and employees’ criminal history.
Paid Parental Leave
Ordinance
Employers are required to provide up to 6 weeks of supplemental compensation to
employees who receive California Paid Family Leave benefits, including part-time and
temporary workers. This currently applies to employers with 35 or more employees
worldwide (and as of January 1, 2018, to employers with 20 or more employees).
Formula Retail
Employee Rights
Ordinances
Formula retail establishments must follow two new laws on scheduling, hours, and
retention of employees.**
* The San Francisco Minimum Wage Ordinance does not cover individuals who are the parents, spouses, domestic partners, or
children of the employers.
** Also known as the “Retail Workers Bill of Rights.” Full details on the ordinance is available here: http://sfgov.org/olse/formula-
retail-employee-rights-ordinances. Example of these requirements include: employers must offer any extra work hours to current
qualified part-time employees before hiring new employees or using contractors or staffing agencies; if the establishment is sold,
successor employer must retain employees, who worked for the former employer for at least six months, for at least 90 more days
after sale; employers must provide employees with their schedules two weeks in advance; etc.
Source: City and County of San Francisco Labor Standards Enforcement, 2017.

Issue Brief #3: Costs and Challenges for NCD Businesses | February 2018 65
3. Land Use Regulations and Permitting Requirements
Nearly every interviewee commented on the impact of land use regulations and permitting requirements,
both on business start-up and operations, and on the overall economic health and sustainability of NCDs.
Some of the challenges associated with the City’s land use and permitting requirements for individual
businesses include:
• Significant time and cost associated with opening a new business. Depending on the
combinations of permits and renovations required, the time and cost of opening a new business in
San Francisco can be very significant. Depending on the lease agreement between the property
owner (landlord) and the business (tenant), the tenant may be required to pay rent during the
permitting process. Brokers, developers, and business assistance providers cited examples of
permitting processes that took six to nine months, sometimes resulting in the applicant going
bankrupt before they could open.
Businesses can face an especially time-consuming process if they are required to obtain a change
of use permit (for example, a new restaurant going into a space formerly occupied by a retail store),
obtain a conditional use authorization (required, for example, for new formula retail uses), or
comply with historic preservation requirements. The challenges associated with navigating the
permitting process can also be particularly acute for small businesses, especially if they do not
utilize technical assistance resources. One business assistance provider noted that OEWD’s Small
Business Acceleration Program (Open in SF) can substantially shorten the process for businesses
that receive assistance.
• Costs and disruptions to existing businesses associated with the soft-story retrofit program.
San Francisco’s Mandatory Soft Story Retrofit Program (MSSP) requires seismic retrofit for “older,
wood-framed, multi-family buildings with a soft-story condition.”97 The renovation costs
associated with this program can be very high, and depending on lease terms, may be passed on to
tenants. Extended renovations can also have a financial impact on businesses if they lead to
temporary closures or decreased foot traffic. The number of businesses affected by the MSSRP is
unknown.
• Limited flexibility to adapt to changing economic conditions. As described in Issue Brief #1,
many retailers are experimenting with creative strategies such as co-locating with other businesses,
combining multiple uses within a single business (e.g., serving food or drinks), or offering more
events, classes, or other experiences to draw customers. The City’s regulations can sometimes get
in the way of this experimentation.
For example, the San Francisco zoning code was only recently updated to allow retail uses to be
combined with production, distribution, and repair (PDR) uses in NCDs.98 Retailers seeking to
serve food and/or drinks have also faced a number of hurdles, including the need for a new use
permit, confusion over the type of permit required, and the time and cost associated with obtaining
permits. In some cases, neighborhood residents and merchants have opposed retailers seeking to
serve food and beverages.99 In addition to the permitting challenge, renovating a retail space to
include kitchen or bar facilities can be costly and require a long construction period
97 City of San Francisco Department of Building Inspection, “Mandatory Soft Story Retrofit Program | Department of
Building Inspection.” 98 Grant, “Designing at Ground Level.” 99 Recent controversial examples include Amado’s and the Royal Cuckoo Market in the Mission, which are discussed
in Issue Brief #1.

Issue Brief #3: Costs and Challenges for NCD Businesses | February 2018 66
• Specific restrictions on alcohol: To serve alcohol, a liquor license from the California Department
of Alcoholic Beverage Control (ABC) is required. However, ABC limits the number of licenses
available in each county. In general, the agency is not issuing new licenses in San Francisco, so
businesses wishing to serve alcohol must find one to buy from an existing licensee. Resale values
can run between $250,000 and $300,000, especially for a liquor license that allows for hard liquor
in addition to wine and beer. Some neighborhoods also have enacted additional local restrictions
on liquor stores and licenses.100
In 2017, ABC began issuing a limited number of new licenses for exclusive use within specific
neighborhoods, including San Bruno Avenue, Ocean Avenue, Third Street in the Bayview, Mission
Street in Excelsior, Taraval Street, Noriega Street, and areas of Visitacion Valley. The new licenses
were made available under a new state law, with the intent of attracting economic development to
these neighborhoods. OEWD is also providing technical assistance to help retain and attract full
service restaurants to the corridors.
The effect of land use and permitting regulations on the overall health of the NCDs is controversial. For
example, some stakeholders see significant value in conditional use authorization, discretionary review,
and other processes that allow residents to limit certain unwanted uses or obtain specific concessions from
developers. Others see these processes as expensive and time consuming and argue that the lengthy process
for opening new businesses may contribute to long-term vacancies. Some interviewees also cited
regulations on non-retail uses as being potentially problematic for the health of NCDs. For example, the
City’s zoning code does not allow office uses that do not directly serve the public to locate in NCDs (even
on the second floor). Under this regulation, uses like medical or law offices that are considered open to the
public are allowed, while uses like co-working spaces are not. Some brokers and other stakeholders argue
that co-working spaces and other office uses could generate significant daytime foot traffic for retail,
restaurants, and personal services, and help fill vacancies in the NCDs.
100 City of San Francisco Planning Department, “Mission Alcoholic Beverage Special Use District.”

Issue Brief #3: Costs and Challenges for NCD Businesses | February 2018 67
San Francisco’s Formula Retail Regulations
Since the 2000s, San Francisco has regulated formula retail, defined as “a type of retail sales activity or retail sales establishment that has eleven or more other retail sales establishments […] located anywhere in the world” and maintains certain standardized features. In most NCDs, formula retail is required to obtain a conditional use authorization; in some NCDs, formula retail (or certain types of formula retail) are prohibited. The regulations are intended to protect San Francisco’s “diverse retail base” and the “distinct neighborhood retailing personalities” of the city’s different neighborhood commercial districts.1 A 2014 study by Strategic Economics2 assessed the impacts of formula retail and the formula retail regulations on San Francisco’s NCDs. Some of the key findings from the study are summarized below.
• The concentration of formula retail in the NCDs is relatively low compared to national averages. This suggests that the controls are successfully limiting the amount of formula retail, although other factors may also be at play.
• While formula retail can contribute to a “cookie cutter” feel, it can also have positive effects on the NCDs. For example, formula retail can serve as an anchor for an NCD, drawing foot traffic to small businesses; provide more affordable goods compared to independent retail;3 and provide employment.
• The impact of formula retail and the formula retail controls on rents in the NCDs is unclear. The study did not find a consistent relationship between the approval of a new formula retail conditional use application and the subsequent direction of local rents and vacancies. Anecdotally, the study did find that in some highly desirable NCDs, such as Upper Fillmore, formula retailers may be willing and able to pay higher rents compared to independently owned businesses. On the other hand, the formula retail regulations may create an incentive for national or international businesses that do not yet meet the definition of formula retail, but anticipate rapid expansion, to locate in San Francisco as quickly as possible (i.e., before they reach the threshold of eleven or more worldwide locations) – contributing to higher rents.
• In some neighborhoods, formula retail regulations may contribute to long-term vacancies by making it more difficult to lease spaces, particularly larger storefronts. Formula retailers can generally fill more floor space than independent retailers, and can more often afford to make needed tenant improvements and pay the rents required to lease larger storefronts. Brokers report that large, deep spaces may sit empty for extended periods of time if a formula retail CU application is disapproved or withdrawn. The conditional use authorization process also discourages some formula retailers from even proposing to locate in the NCDs. However, while the formula retail controls may make leasing some spaces more challenging, obsolete building designs, significant maintenance needs, and challenging locations also likely contribute to long-term vacancies in many cases.
1 Ordinance Number 62-04, Board File 031501, available online at: http://sfgov.legistar.com/LegislationDetail.aspx?ID=473759&GUID=A83D3A84-B457-4B93-BCF5- 11058DDA5598&Options=ID|Text|&Search=62-04 2 Strategic Economics, “San Francisco Formula Retail Analysis.” 3 Office of the Controller, “Expanding Formula Retail Controls: Economic Impact Report.”

Issue Brief #3: Costs and Challenges for NCD Businesses | February 2018 68
4. Real Estate Conditions
Many challenges mentioned by interviewees related to the age and quality of storefronts, rents and lease
agreements, and to broader issues of neighborhood vacancies.
Age and Quality of the Physical Space
San Francisco’s older building stock, including many historic buildings, is attractive for many business
owners as well as customers. However, the cost of building improvements can be very high. Substantial
upgrades to gas, electric, water, and sewer utilities, as well as to a space’s ventilation and light, are often
required to meet the needs of modern retail or restaurants. The cost of internet connections and other IT
needs can also be significant. Under most lease agreements, businesses pay for these tenant improvements
themselves. Additional costs are incurred when landlords require tenants to use union labor. The limited
availability of contractors to do the work can be a challenge for completing improvements and contributes
to high construction costs.
Tenant improvements can represent a particular cost hurdle for new restaurants, which often require
upgraded kitchen facilities and new or improved ventilation systems (in part because the City prohibits
external ventilation). Restaurants and bars that require kitchens often prefer spaces that have already been
renovated for food and beverage preparation, and do not require extensive work.
Rents & Lease Agreements
Several interviewees listed high rents as a central challenge that businesses are facing in NCDs. Reliable,
longitudinal data on rents in NCDs is not available. Brokers interviewed for this study observed that after
rising steadily rents since the last recession, rents have begun to stabilize or decline in the past few months
to a year. However, most lease agreements are at least five years in length (often with an option for a five-
to ten-year extension), so any decrease in rents is unlikely to benefit existing tenants in the short-term.
Lease agreements in San Francisco’s NCDs are typically structured to include automatic rent escalations
(usually 2-3 percent a year). This type of lease structure requires tenants to increase sales annually in order
to keep up with rent escalation. As discussed above, leases generally require businesses to cover the costs
of tenant improvements, and often to pay rent during renovations (prior to opening). Under this lease
structure, permitting or other delays can create a substantial challenge for small businesses with limited
capital. Some of these terms may be negotiable; however, small businesses in particular may not have the
experience required to negotiate a favorable lease unless they take advantage of small business assistance
services.
Long-Term Vacancies
A healthy vacancy rate (in the range of 8-10 percent) allows for turnover and expansions. As discussed in
Issue Brief #1 and #2, the vacancy rate in most San Francisco NCDs is low (less than 10 percent), and some
spaces that appear vacant are actually undergoing renovation for a new use. However, long-term vacancies
can affect the success of neighboring businesses, and the overall health of NCDs, by creating a sense of
disinvestment or blight. Some interviewees noted that long-term vacancies are a problem in some NCDs,
and described the following factors as possible contributors to these vacancies:
• Mismatch between storefront layout and current market demand. For example, this includes
larger, deeper storefronts that once functioned as department stores, theaters, or other uses, but now
appeal to a limited number of tenants and are challenging to subdivide.
• Buildings that require substantial rehabilitation, including buildings that are subject to historic
preservation restrictions.

Issue Brief #3: Costs and Challenges for NCD Businesses | February 2018 69
• New ground floor retail space that is poorly designed for tenant needs. In some neighborhoods,
merchants and neighborhood activists have observed that ground floor retail space in new buildings
sits empty because it is designed with larger storefronts that meet the needs of national retailers,
but are too large for smaller, local businesses.
• Landlords holding space vacant while waiting for higher rents or specific tenants.
Neighborhood organizers, merchants, and some recent articles101 have observed that some long-
standing vacancies are caused by landlords holding out for higher rents or a desired type of tenant.
In some cases, property owners may have to plan for a certain rent in order to obtain financing, and
may risk going into default or being required to put additional equity into the building if they accept
less than the projected rent.102 Alternatively, financing for a mixed-use project may not assume any
retail rent revenue at all, which limits the incentive for the property owner to find a tenant. However,
it is unclear whether landlords being unwilling to rent their properties is limited to a few highly
visible cases. Brokers interviewed for this study do not believe this trend is widespread, if it happens
at all.
• Time-consuming and expensive permitting processes. As discussed above, the length,
complexity, and cost of obtaining permits may contribute to long-term vacancies by making it more
difficult to open a business.
5. Increasing Competition from E-Commerce and Other Sources
As discussed in Issue Brief #1, business owners in many sectors are facing increased competition from
online sales and – in some cases – from other brick-and-mortar locations. For example, grocery stores and
restaurants in many San Francisco NCDs are seeing more competition from a proliferation of brick-and-
mortar locations (many of which offer delivery), as well as meal delivery kits. The clothing industry is
another example of a sector dealing with more competition, including from online stores (e.g. Amazon
Prime Wardrobe and Zappos), hybrid online companies that also have brick-and-mortar locations (e.g.
Reformation, on Valencia Street), and companies offering digital personalized shopping services (e.g.
Stitch Fix delivers personalized and free-return items to subscribers; Le Tote delivers rental clothing to be
worn by subscribers, with the option to return or purchase the items after a set period of time).103 In some
cases, brick-and-mortar stores may also be competing with mobile vendors (e.g., food trucks competing
with restaurants).
6. Demographic Change
Many San Francisco neighborhoods are experiencing significant demographic change, including an influx
of upper-income households. In general, higher spending power supports increased sales for retail,
restaurants, and personal services businesses. However, in some neighborhoods, long-standing businesses
are struggling to adapt to changes in their customer base. For instance, in the Mission District, long-standing
businesses and mom-and-pop retail shops that historically served the predominantly Latino population have
reported challenges in adapting as the neighborhood’s demographic becomes wealthier and whiter.104 The
101 Park and Downing, “It’s A Fact.” 102 This dynamic has been observed in New York’s SoHo neighborhood; see Bagli, Charles V. “In a Thriving City,
SoHo’s Soaring Rents Keep Storefronts Empty.” The New York Times, August 23, 2017.
https://www.nytimes.com/2017/08/23/nyregion/soho-empty-storefronts.html. 103 McKinsey & Company, “The State of Fashion 2017.” 104 Strategic Economics, “Mission Street Corridor Economic Analysis”; Strategic Economics, “Calle 24 Retail Study:
Final Background Report,” 24.

Issue Brief #3: Costs and Challenges for NCD Businesses | February 2018 70
Castro is facing a similar issue, with a seemingly growing number of lesbian, gay, bisexual, and transgender
(LGBT) bars and other institutions closing in response to changing demographics.105
7. Lack of Technical Expertise or Capital
In some cases, small business owners lack the technical expertise or financial resources required to help
them adapt to a changing market. For example, the small business assistance providers interviewed for this
report noted that some long-standing business owners have operated for many years without a business
plan. The lack of a business plan can be a particular barrier when a business seeks new space; a business
plan is essential both for helping the business owner determine how much they can afford to pay in rent,
and for negotiating a reasonable rate with the property owner. In other cases, small business assistance
providers have observed entrepreneurs who choose locations based primarily on the rent, without doing
sufficient research on local consumer characteristics or building conditions. In some cases, these businesses
may end up in in spaces with very high tenant improvement costs, or in neighborhoods where there is too
much competition or not enough of a market to sustain a viable business.
Some small businesses are also struggling to expand their marketing. While some small businesses in San
Francisco’s NCDs have a robust online presence, with daily posts on Instagram or Facebook, this kind of
marketing strategy requires dedicated staff time. Some small businesses struggle to maintain a basic
presence on websites such as Yelp, Facebook, and Trip Advisor. For example, fewer than half of businesses
on the Calle 24 corridor currently have hours of operation clearly posted either on their storefront or
online.106 Performing needed tenant or façade improvements is another challenge for many cash-strapped
businesses.
San Francisco’s Office of Economic and Workforce Development, and the small business assistance
providers that the City funds, offer technical assistance, grants, and loans that can help businesses with
many of these activities, including creating business and marketing plans, negotiating leases, and investing
in façade or other capital improvements. Some of these services (such as capital funding assistance) are
targeted to specific neighborhoods and are not available citywide.
8. Public Realm Challenges
As discussed in Issue Brief #2, an attractive, clean, and safe environment is considered a key factor for
supporting successful urban retail. An attractive public realm helps position an NCD as a retail destination,
especially for customers from outside the neighborhood. Business owners in some NCDs believe that
customers are deterred by concerns around cleanliness, disorder, and safety. For example, business owners
cited the presence of homeless people, mentally ill people, and persons with substance use disorders as a
challenge in attracting customers and employees, especially for businesses that offer outdoor seating areas.
BUSINESS ADAPTATIONS
As discussed throughout this and previous issue briefs, many businesses are adopting creative strategies in
response to the challenges discussed above. These include strategies to reduce costs or pass costs on to
105 Bowles and Levin, “San Francisco’s Tech Bros Told: Quit Changing the Gayborhood”; James, “There Goes the
Gayborhood.” 106 Strategic Economics, “Calle 24 Retail Study: Final Background Report,” 24.

Issue Brief #3: Costs and Challenges for NCD Businesses | February 2018 71
customers; expand sales of current products; and diversify their revenue streams. Examples of these
strategies are summarized below.
• Strategies to reduce costs or pass additional costs on to customers include:
o Adopting less labor-intensive business models. For example, fast casual dining is
expanding in San Francisco in part because it uses less labor than restaurants that provide
traditional table serve. Some businesses are also experimenting with automation to further
reduce labor costs, such as self-checkout kiosks at grocery stores or automats (like Eatsa).
o Making do with fewer employees, or employing family members (who are not subject to
the same labor laws as other workers.
o Making do with less space, by renting smaller spaces or co-locating with other businesses.
o Relocating to lower-cost areas either within San Francisco, or in some cases outside of
the City.
o Increasing prices, or in the case of restaurants, adding surcharges to the final bill to reflect
the high cost of doing businesses.
• Strategies for expanding sales of existing products include:
o Taking advantage of online apps and marketplaces. Many restaurant owners in San
Francisco’s NCDs see delivery through third-party delivery apps as an essential way to
expand sales, while some service providers are using online booking platforms. Some small
retailers are experimenting with selling online as well, either through their own websites
or third-party platforms.
o Developing a stronger presence on social media. In addition to maintaining a presence
on Google Maps and Yelp, many business owners take advantage of social media
(Facebook, Instagram, Twitter) to keep customers engaged.
o Hosting events to draw in foot traffic, such as tastings, classes, workshops, or lectures.
• Strategies for diversifying revenue streams include:
o Expanding or adjusting range of products to be more competitive and appeal to new
customers. For example, this could include a small grocery or corner store adding new local
and organic produce.
o Combining uses, such as serving food or alcohol at stores and galleries, or combining PDR
and retail space.
o Subleasing part of their space to other retailers.
In some cases, policies or programs can help facilitate these kinds of adaptations. For example, land use
policies may need to be modified to provide retailers more flexibility in experimenting with combining uses
and expanding services (e.g., serving food and beverages or incorporating “maker” or PDR space). Some
businesses may benefit from increased technical and financial support in expanding their online presence
or adjusting their inventories for a changing customer base. However, it is important to recognize that
change is challenging, and some businesses will not be able to adapt to a changing market. Policies and
programs cannot force change on an unwilling business owner or overcome fundamental challenges such
as a lack of sufficient market demand for products or services.

February 2018 72
APPENDIX: INTERVIEWEES AND BIBLIOGRAPHY

February 2018 73
LIST OF INTERVIEWEES
This study was informed in part by interviews with the following experts and stakeholders, conducted in
August 2017:
• Carol Gilbert, CGI
• Chris Foley, Polaris Pacific
• Christine Johnson, SPUR
• Chris Wright, Planning Association for the Richmond
• Dan Safier, Prado Group
• Dan Weaver, Ocean Avenue Association
• David Catania, Greenberg Traurig LLP (counsel for Starship Technologies)
• Gwyneth Borden, Golden Gate Restaurant Association
• Iris Lee, Working Solutions
• Lexi Russell and Gary Baragona, CBRE
• Miriam Zouzounis, Arab American Grocer’s Association
• Pam Mendolsohn, Cushman Wakefield
• Sam Mogannam and Calvin Tsay, Bi-Rite
• Tom Radulovich, Livable City
• Valerie Camarda, Marketing Sense
• Vas Kiniris, Fillmore Merchants Association
• Vikrum Aiyer and Summet Marwaha, Postmates
The study was also informed by interviews conducted with business owners on 24th Street and Mission
Street, and real estate brokers representing properties in the Mission District, for studies conducted for
OEWD in 2016 and 2017.107
107 Strategic Economics, “Mission Street Corridor Economic Analysis”; Strategic Economics, “Calle 24 Retail Study:
Final Background Report.”
February 2018 74
BIBLIOGRAPHY
Abrams, Amanda. “As Amazon Enters the Market, U.S. Grocers Focus on Becoming the One-
Stop Shop.” Urban Land Magazine, August 28, 2017.
https://urbanland.uli.org/development-business/amazon-enters-market-u-s-grocers-focus-
becoming-one-stop-shop/.
Abrams, Rachel, and Julie Creswell. “Amazon Deal for Whole Foods Starts a Supermarket War.”
The New York Times, June 16, 2017, sec. Business Day.
https://www.nytimes.com/2017/06/16/business/whole-foods-walmart-amazon-grocery-
stores.html.
Akan, Emel. “Luxury Fashion Industry Scrambling to Adjust to Millennial World.” The Epoch
Times, August 3, 2017. http://www.theepochtimes.com/n3/2275579-luxury-fashion-
industry-scrambling-to-adjust-to-millennial-world-2/.
Alameda County, California. “Design Guidelines for Residential Mixed-Use Projects,” 2015.
https://www.acgov.org/cda/planning/design.htm.
Alfonzo, Mariela, and Christopher B. Leinberger. “Walk This Way: The Economic Promise of
Walkable Places in Metropolitan Washington, D.C.” Brookings Institution, 2012.
https://www.brookings.edu/research/walk-this-waythe-economic-promise-of-walkable-
places-in-metropolitan-washington-d-c/.
Allegretto, Sylvia, and Michael Reich. “Are Local Minimum Wages Absorbed by Price Increases?
Estimates from Internet-Based Restaurant Menus.” ILR Review, June 22, 2017,
19793917713735. https://doi.org/10.1177/0019793917713735.
Anderson, Keith. “Click-and-Collect Continues to Evolve, but Where Is It Headed?” Supermarket
News, April 8, 2016. http://www.supermarketnews.com/blog/click-and-collect-continues-
evolve-where-it-headed.
Bagli, Charles V. “In a Thriving City, SoHo’s Soaring Rents Keep Storefronts Empty.” The New
York Times, August 23, 2017, sec. N.Y. / Region.
https://www.nytimes.com/2017/08/23/nyregion/soho-empty-storefronts.html.
B. I. Intelligence. “Amazon Accounts for 43% of US Online Retail Sales.” Business Insider.
Accessed July 6, 2017. http://www.businessinsider.com/amazon-accounts-for-43-of-us-
online-retail-sales-2017-2.
Beyard, Michael D., Michael Pawlukiewicz, and Alex Bond. “Ten Principles for Rebuilding
Neighborhood Retail.” Washington D.C.: Urban Land Institute, 2003. http://uli.org/wp-
content/uploads/2012/07/TP_NeighborhoodRetail.ashx_1.pdf.
“Bird & Beckett Books and Records.” Accessed August 25, 2017. http://www.birdbeckett.com/.
Bowles, Nellie, and Sam Levin. “San Francisco’s Tech Bros Told: Quit Changing the
Gayborhood.” The Guardian, February 2, 2016.
http://www.theguardian.com/world/2016/feb/02/san-francisco-gay-bars-shut-down-lgbt-
tenderloin-castro-district.
Buxton. “Top 10 Most Sought-After U.S. Retail Streets.” Buxton, 2015.
https://www.buxtonco.com/blog/top-10-most-sought-after-u.s.-retail-streets.
CBRE. “Retail and Placemaking: What Is the Role of Retail in Placemaking?” Retail Science from
CBRE, December 2016. https://www.cbre.us/research-and-reports/United-States-of-
America-Major-Report---The-Science-Behind-Placemaking-in-an-Omnichannel-World-
May-2016.

February 2018 75
Cengiz, D., A. Dube, A. Lindner, and B. Zipperer. “The Effect of Minimum Wages on the Total
Number of Jobs: Evidence from the United States Using a Bunching Estimator.” Working
Paper, April 30, 2017. http://www.sole-jole.org/17722.pdf.
City and County of San Francisco Office of the Controller. “Expanding Formula Retail Controls:
Economic Impact Report,” 2014.
http://sfcontroller.org/sites/default/files/FileCenter/Documents/5119-
130788_economic_impact_final.pdf.
City and County of San Francisco Planning Department. “Supervisor District 1: Community Needs
Assessment.” Richmond District Strategy, 2016. http://sf-planning.org/richmond-district-
strategy.
City of Berkeley, Office of the City Manager. Letter to Honorable Major and Members of the City
Council. “Retail Incentives in Commercial Districts,” October 6, 2015.
https://www.cityofberkeley.info/Clerk/City_Council/2015/10_Oct/Documents/2015-10-
06_Item_09_Retail_Incentives.aspx.
City of New York. “Active Design: Shaping the Sidewalk Experience,” 2013.
https://www1.nyc.gov/assets/planning/download/pdf/plans-studies/active-design-
sidewalk/active_design.pdf.
City of New York Department of Housing Preservation and Development, and Design Trust for
Public Space. “Laying the Groundwork: Design Guidelines for Retail and Other Ground-
Floor Uses in Mixed-Use Affordable Housing Developments,” 2015.
http://www1.nyc.gov/assets/hpd/downloads/pdf/developers/laying-the-groundwork-retail-
design-guidelines.pdf.
City of New York Department of Planning. “Resilient Retail,” 2015.
http://www1.nyc.gov/site/planning/plans/resilient-retail/resilient-retail.page.
City of New York Department of Transportation. “Economic Benefits of Sustainable Streets,”
2014. http://www.nyc.gov/html/dot/downloads/pdf/dot-economic-benefits-of-sustainable-
streets.pdf.
City of San Francisco. “Better Market Street: Loading and Delivery Management Best Practices,”
2011. http://www.bettermarketstreetsf.org/docs/BMS_P2-4_BestPractices_12072011.pdf.
City of San Francisco Department of Building Inspection. “Mandatory Soft Story Retrofit Program
| Department of Building Inspection,” 2017. http://sfdbi.org/softstory.
City of San Francisco OEWD. “Impact Analysis of Community Benefit Districts,” 2013.
http://sfmayor.org/article/mayor-lee-celebrates-positive-impact-community-benefit-
districts.
City of San Francisco Office of Economic and Workforce Development. “Geary Boulevard
Neighborhood Profile.” Invest in Neighborhoods, 2013. http://investsf.org/wordpress/wp-
content/uploads/2014/03/Neighborhood-Profile-GEARY-RICHMOND.pdf.
City of San Francisco Planning Department. “Mission Alcoholic Beverage Special Use District.”
Text. Planning Code Summary, 2011.
http://default.sfplanning.org/legislative_changes/new_code_summaries/110767_Mission_
Alcohol_RUD.pdf.
———. “Standards for Storefront Transparency: Planning Code Requirements for Commercial
Businesses,” 2013.
http://default.sfplanning.org/publications_reports/Guidelines_Storefront_Transparency-
112513.pdf.
February 2018 76
City of San Francisco Planning Department, District 1 Supervisor’s Office, and City of San
Francisco Office of Economic and Workforce Development. “Supervisor District 1:
Existing Conditions Report.” Richmond District Strategy, 2015. http://sf-
planning.org/richmond-district-strategy.
Cushman & Wakefield. “San Francisco Retail Marketbeat, Q1 2017,” n.d.
Deloitte. “Global Powers of Luxury Goods 2017.” Accessed August 24, 2017.
https://www2.deloitte.com/content/dam/Deloitte/global/Documents/consumer-industrial-
products/gx-cip-global-powers-luxury-2017.pdf.
Dennis, Steven. “Luxury Retail Hits The Wall.” Forbes, March 7, 2017.
https://www.forbes.com/sites/stevendennis/2017/03/07/luxury-retail-hits-the-wall/.
Downing, Shane. “Castro Merchants Talk Demand-Responsive Parking Meter Pricing, Set To Roll
Out Citywide In 2017.” Hoodline, October 20, 2016. http://hoodline.com/2016/10/castro-
merchants-talk-demand-responsive-parking-meter-pricing-set-to-roll-out-citywide-in-
2017.
Drennen, Emily. “Economic Effects of Traffic Calming on Urban Small Businesses.” San
Francisco State University, 2003.
https://www.sfbike.org/download/bikeplan/bikelanes.pdf.
Dube, A. “Proposal 13: Designing Thoughtful Minimum Wage Policy at the State and Local
Levels.” The Brookings Institution: The Hamilton Project, 2014.
https://www.brookings.edu/wp-
content/uploads/2016/06/state_local_minimum_wage_policy_dube.pdf.
Dube, Arindrajit, Suresh Naidu, and Michael Reich. “The Economic Effects of a Citywide
Minimum Wage.” ILR Review 60, no. 4 (July 1, 2007): 522–43.
https://doi.org/10.1177/001979390706000404.
Easton, Gregory, and John Owen. “Creating Walkable Neighborhood Business Districts: An
Exploration of the Demographic and Physical Characteristics Needed to Support Local
Retail Services.” MAKERS Architecture and Urban Design, 2009.
http://www.makersarch.com/wp-
content/uploads/2016/04/Creating_Walkable_Neighborhood_Districts_2009.pdf.
Easton, Gregory, John Owen, and Stephen Atkinson. “Urban Centers: By the Numbers and by
Design.” presented at the American Planning Association National Planning Conference
2016, Phoenix, 2016. media2.planning.org/media/npc2016/presentation/s482.pdf.
“Fast-Growing Beauty and Wellness Platform Shedul.com Raises $6 Million.” MarketWatch, June
9, 2017. http://www.marketwatch.com/story/fast-growing-beauty-and-wellness-platform-
shedulcom-raises-6-million-2017-06-09-7203451.
Fitzgerald Rodriguez, Joe. “Mayor Lee to Tackle Uber, Lyft Traffic Congestion through Pilot
Program.” The San Francisco Examiner, May 15, 2017.
http://www.sfexaminer.com/mayor-lee-tackle-uber-lyft-traffic-congestion-pilot-program/.
Flemming, Jack. “Why the Grim Reaper of Retail Hasn’t Come to Claim Best Buy.” Los Angeles
Times, July 17, 2017. http://www.latimes.com/business/la-fi-agenda-best-buy-20170717-
htmlstory.html.
Furman Center for Real Estate & Urban Policy. “The Benefits of Business Improvement Districts:
Evidence from New York City,” 2007.
http://furmancenter.org/files/publications/FurmanCenterBIDsBrief.pdf.
February 2018 77
Gebeloff, Robert, and Karl Russell. “How the Growth of E-Commerce Is Shifting Retail Jobs.”
The New York Times, July 6, 2017, sec. Business Day.
https://www.nytimes.com/interactive/2017/07/06/business/ecommerce-retail-jobs.html.
Gehl Architects. “Public Spaces and Public Life: Recommendations.” City of Seattle, 2009.
https://www.seattle.gov/dpd/cs/groups/pan/@pan/documents/web_informational/s048431
.pdf.
Gibbs, Robert J. Principles of Urban Retail Planning and Development. John Wiley & Sons, 2012.
Glaser, April. “San Francisco Is Considering Legislation That Would Ban Sidewalk Delivery
Robots.” Recode, May 16, 2017. https://www.recode.net/2017/5/16/15648324/san-
francisco-legislation-ban-autonomous-delivery-robots-sidewalks.
Grabar, Henry. “The Retail Apocalypse Is Suburban.” Slate, April 18, 2017.
http://www.slate.com/articles/business/metropolis/2017/04/the_retail_apocalypse_is_sub
urban.html.
Grant, Benjamin. “Designing at Ground Level.” SPUR The Urbanist, June 2014.
http://www.spur.org/publications/urbanist-article/2014-06-03/designing-ground-level.
Hack, G. “Business Performance in Walkable Shopping Areas.” Princeton, NJ: Active Living
Research, a National Program of the Robert Wood Johnson Foundation, 2013.
http://activelivingresearch.org/business-performance-walkable-shopping-areas.
Han, Sehee. “Impacts of Business Improvement Districts on Crime Outcomes in the City of
Philadelphia: Dynamic Panel Data Analysis.” Doctor of Philosophy, Pennsylvania State
University, 2016. https://etda.libraries.psu.edu/files/final_submissions/12664.
Hepler, Lauren. “Union Square Struggles with Retail Challenges.” San Francisco Business Times,
June 22, 2017. https://www.bizjournals.com/sanfrancisco/news/2017/06/22/sf-strux-2017-
unionsquare-retailing-real-estate.html.
Holguin-Veras, José, Johanna Amaya-Leal, Jeffrey Wojtowicz, Miguel Jaller, Carlos González-
Calderón, Iván Sánchez-Díaz, Xiaokun Wang, et al. “Improving Freight System
Performance in Metropolitan Areas: A Planning Guide.” NCFRP Report, no. 33 (2015).
https://trid.trb.org/view.aspx?id=1351370.
Isidore, Chris. “Retail Bloodbath: Bankruptcy Filings Pile up.” CNNMoney, June 13, 2017.
http://money.cnn.com/2017/06/13/news/companies/retail-bankruptcies/index.html.
Jackson, Stephen. “A Dish Best Served Gently Warmed: Revenge Pies Opens At Inner Sunset’s
San Franpsycho.” Hoodline (blog), February 23, 2017. http://hoodline.com/2017/02/a-
dish-best-served-gently-warmed-revenge-pies-opens-at-inner-sunset-s-san-franpsycho.
Jaffe, Eric. “4 Reasons Retailers Don’t Need Free Parking to Thrive.” CityLab, 2012.
http://www.theatlanticcities.com/jobs-and-economy/2012/11/4-reasons-retailers-dont-
need-free-parking-thrive/3978/.
———. “The Complete Business Case for Converting Street Parking Into Bike Lanes.” CityLab,
2015. http://www.citylab.com/cityfixer/2015/03/the-complete-business-case-for-
converting-street-parking-into-bike-lanes/387595/.
James, Scott. “There Goes the Gayborhood.” The New York Times, June 21, 2017.
https://www.nytimes.com/2017/06/21/us/gay-pride-lgbtq-gayborhood.html.
JLL. “Bagged or Boxed? The Future of 13 Retail Categories.” Retail Research Point of View,
2017. http://img04.en25.com/Web/JLLAmericas/%7B88537be6-f837-429d-b8ee-
6c702f665056%7D_JLL_Retail_POV_Screens_to_Stores_Report_FNL_LR.pdf.
———. “City Retail: Understanding North America’s Prime Urban Corridors,” 2017.
http://link.jll.com/retail-cities-national.

February 2018 78
———. “E-Commerce in the Bay Area,” Year End 2016.
Kent, Joshua. “A Street You Go To, Not Just Through: Principles for Fostering Streets as Places.”
Project for Public Spaces, 2016. https://www.pps.org/reference/8-principles-streets-as-
places/.
Kline, Daniel B. “These 8 Retailers Are Actually Opening Stores.” The Motley Fool, April 3,
2017. https://www.fool.com/investing/2017/04/03/these-8-retailers-are-actually-opening-
stores.aspx.
Kolko, Jed. “Eating Towns, Drinking Towns.” Huffington Post (blog), August 1, 2012.
http://www.huffingtonpost.com/jed-kolko/eating-towns-drinking-towns_b_1729283.html.
Kurutz, Steven. “Bleecker Street’s Swerve From Luxe Shops to Vacant Stores.” The New York
Times, May 31, 2017, sec. Fashion & Style.
https://www.nytimes.com/2017/05/31/fashion/bleecker-street-shopping-empty-
storefronts.html.
Lane, Bridget, and Maureen McAvey. “Retail in Underserved Communities.” Washington D.C.:
Urban Land Institute, 2014. http://uli.org/wp-content/uploads/ULI-
Documents/Underserved2014f.pdf.
Lane, Charles. “E-Commerce Growth A Boon – And Bust – For Local Communities.” WSHU
Public Radio. WSHU, July 13, 2017. http://wshu.org/post/e-commerce-growth-boon-and-
bust-local-communities.
Lee, Fiona. “Bike Shop At ‘Mojo Bicycle Café’ Closing, But Eatery To Remain.” Hoodline (blog),
June 25, 2017. http://hoodline.com/2017/06/bike-shop-at-mojo-bicycle-cafe-closing-but-
eatery-to-remain.
Lee, Thomas. “Amazon Hub Lockers Threaten to Suck Data from Retail Rivals.” San Francisco
Chronicle, August 9, 2017. http://www.sfchronicle.com/business/article/Amazon-Hub-
lockers-threaten-to-suck-data-from-11745509.php.
Litman, Todd. “Parking Management: Strategies, Evaluation, and Planning.” Victoria Transport
Policy Institute, September 2016. http://www.vtpi.org/park_man.pdf.
Lonsdorf, Kat. “Hungry? Call Your Neighborhood Delivery Robot.” NPR.org, March 23, 2017.
http://www.npr.org/sections/alltechconsidered/2017/03/23/520848983/hungry-call-your-
neighborhood-delivery-robot.
Luca, Dara Lee, and Michael Luca. “Survival of the Fittest: The Impact of the Minimum Wage on
Firm Exit,” April 11, 2017. http://www.hbs.edu/faculty/Pages/item.aspx?num=52552.
MacDonald, J., Bluthental, Kofner, Stokes, Sehgal, Fain, and Beletsky. “Neighborhood Effects on
Crime and Youth Violence: The Role of Business Improvement Districts in Los Angeles.”
RAND Corporation, 2009.
https://www.rand.org/dam/rand/pubs/technical_reports/2009/RAND_TR622.pdf.
Mandel, Michael. “How E-Commerce Is Raising Pay and Creating Jobs around the Country.”
Forbes, April 3, 2017. https://www.forbes.com/sites/realspin/2017/04/03/how-e-
commerce-is-raising-pay-and-creating-jobs-around-the-country/.
McCahill, Chris, and Satya Rhodes-Conway. “Urban Parking: Rational Policy Approaches for
Cities and Towns.” Mayors Innovation Project, 2015.
http://www.mayorsinnovation.org/images/uploads/pdf/SURDNA_Parking_brief.pdf.
McKinsey & Company. “The State of Fashion 2017,” 2017.
https://images.businessoffashion.com/site/uploads/2016/11/The_State_of_Fashion_2017.
pdf.
February 2018 79
Meola, Andrew. “Amazon, Domino’s and the Future Drone Delivery Market.” Business Insider,
July 18, 2017. http://www.businessinsider.com/delivery-drones-market-service-2017-7.
Michigan Community Resources. “Grand River Commercial Vacancy & Market Analysis,”
September 2013. Michigan Community Resources.
Moskin, Julia. “Not Enough Cooks in the Restaurant Kitchen.” The New York Times, October 20,
2015, sec. Food. https://www.nytimes.com/2015/10/21/dining/restaurant-kitchen-chef-
shortage.html.
Moudon, Anne Vernez, Chanam Lee, Allen D. Cheadle, Cheza Garvin, Donna Johnson, Thomas
L. Schmid, Robert D. Weathers, and Lin Lin. “Operational Definitions of Walkable
Neighborhood: Theoretical and Empirical Insights.” Journal of Physical Activity & Health
3 (2006): S99.
Nahmod, David-Elijah. “TL Record Store ‘RS94109’ Returns With Coffee Bar, Events & Soon
Beer.” Hoodline (blog), February 9, 2017. http://hoodline.com/2017/02/tl-record-store-
rs94109-returns-with-coffee-bar-events-soon-beer.
National Association of City Transportation Officials. NACTO Urban Street Design Guide. 2nd
Edition. Island Press, 2013.
National Trust for Historic Preservation. “Older, Smaller, Better: Measuring How the Character
of Buildings and Blocks Influences Urban Vitality.” National Trust for Historic
Preservation, 2014. http://forum.savingplaces.org/act/pgl/older-smaller-better.
Office of Economic Analysis. “Expanding Formula Retail Controls: Economic Impact Report.”
City and County of San Francisco Office of the Controller, February 12, 2014.
Ortiz, Larisa. “Improving Tenant Mix: A Guide for Commercial Practitioners.” International
Council of Shopping Centers, 2014. https://www.icsc.org/uploads/gpp/ICSC-Guide-for-
Improving-Tenant-Mix.pdf.
Park, Jessica, and Shane Downing. “It’s A Fact: The Castro’s Retail Vacancy Problem Has Gotten
Even Worse.” Hoodline. Accessed September 22, 2017.
http://hoodline.com/2017/03/castro-retail-vacancy-rising.
Pawasarat, John, and Lois Quinn. “Exposing Urban Legends: The Real Purchasing Power of
Central City Neighborhoods, Prepared for The Brookings Institution.” ETI Publications,
January 1, 2002. http://dc.uwm.edu/eti_pubs/115.
———. “Research Brief on ETI Purchasing Power and Economic Drilldowns.” University of
Wisconsin Milwaukee: Employment and Training Institute, 2016.
http://dc.uwm.edu/cgi/viewcontent.cgi?article=1195&context=eti_pubs.
Perry, David M. “The ‘Internet of Restaurants’ Is Coming for Your Info.” Pacific Standard, July
25, 2017. https://psmag.com/economics/your-favorite-restaurants-are-surveilling-you.
Pershan, Caleb. “Signs at Royal Cuckoo Market Explain Bizarre Fight Over Beer and Wine
License.” Eater SF, June 6, 2017. https://sf.eater.com/2017/6/6/15750238/royal-cuckoo-
market-saloon-meda-beer-wine-license-fight.
Peterson, Hayley. “There’s One Major Thing Everyone Gets Wrong about Amazon and the US
Retail Apocalypse.” Business Insider Australia, July 23, 2017.
https://www.businessinsider.com.au/amazon-shouldnt-be-blamed-for-retail-apocalypse-
2017-7.
Reich, M., K. Jacobs, and A. Bernhardt. “Local Minimum Wage Laws: Impacts on Workers,
Families and Businesses.” Institute for Research on Labor and Employment, 2014.
http://irle.berkeley.edu/files/2014/Local-Minimum-Wage-Laws.pdf.

February 2018 80
Reich, Michael, Ken Jacobs, and Miranda Dietz, eds. When Mandates Work: Raising Labor
Standards at the Local Level, 2014.
http://www.ucpress.edu/book.php?isbn=9780520278141.
Roger Brooks International. “The 20 Ingredients of an Outstanding Downtown,” 2013.
https://www.rogerbrooksinternational.com/20_Ingredients_Handout.pdf.
Rothstein, Ethan. “Even Developers Agree The U.S. Has Way Too Much Retail Space.” Forbes
(blog), April 5, 2017. https://www.forbes.com/sites/bisnow/2017/04/05/even-developers-
agree-the-u-s-has-way-too-much-retail-space/.
San Francisco Travel Association. “San Francisco Fact Sheet.” San Francisco Travel, 2017.
http://www.sftravel.com/sites/sftraveldev.prod.acquia-
sites.com/files/San%20Francisco%20Fact%20Sheet%202017.pdf.
Sasaki Associates. “The State of the City Experience: What Makes a City Great?,” 2014.
http://www.sasaki.com/media/files/cities_survey_final-1.pdf.
Schmitt, J., and D. Rosnick. “The Wage and Employment Impact of Minimum-Wage Laws in
Three Cities.” Center for Economic and Policy Research, 2011. http://www. cepr.
net/documents/publications/min-wage-2011-03. pdf.
Sciacca, Annie. “Why Getting a Liquor License Can Cost so Much for a San Francisco
Restaurant.” San Francisco Business Times, November 7, 2015.
https://www.bizjournals.com/sanfrancisco/blog/2015/11/cost-liquor-license-restaurant-
open-san-francisco.html.
SFCTA. “TNCs Today: A Profile of San Francisco Transportation Network Company Activity
(DRAFT).” San Francisco County Transportation Authority, June 2017.
http://www.sfcta.org/sites/default/files/content/Planning/TNCs/TNCs_Today_061317.pdf
.
Shared-Use Mobility Center. “Shared Mobility and the Transformation of Public Transit.”
American Public Transportation Association, March 2016.
http://www.apta.com/resources/reportsandpublications/Documents/APTA-Shared-
Mobility.pdf.
Shoup, Donald. “The Price of Parking on Great Streets.” University of California Transportation
Center UCTC-FR-2011-26 (September 1, 2011).
http://escholarship.org/uc/item/1mc080gg.
Sisto, Carrie. “State To Issue 5 New Neighborhood-Specific Liquor Licenses.” Hoodline, August
16, 2017. http://hoodline.com/2017/08/state-to-issue-5-new-neighborhood-specific-
liquor-licenses.
Slater, Sean. “Crafting Authenticity for Retail Destinations.” Urban Land: Magazine of the Urban
Land Institute, July 2015. https://urbanland.uli.org/planning-design/crafting-authenticity-
retail-destinations/.
Social Compact Inc. “San Francisco Neighborhood Market DrillDown: Catalyzing Business
Investment in Inner City Neighborhoods,” March 2008. http://sfmohcd.org/san-francisco-
neighborhood-market-drilldown.
Sopadjieva, Emma, Utpal M. Dholakia, and Beth Benjamin. “A Study of 46,000 Shoppers Shows
That Omnichannel Retailing Works.” Harvard Business Review, January 3, 2017.
https://hbr.org/2017/01/a-study-of-46000-shoppers-shows-that-omnichannel-retailing-
works.
February 2018 81
Sorkin, Andrew Ross. “E-Commerce as a Jobs Engine? One Economist’s Unorthodox View.” The
New York Times, July 10, 2017, sec. DealBook.
https://www.nytimes.com/2017/07/10/business/dealbook/e-commerce-jobs-retailing.html.
Strategic Economics. “Calle 24 Retail Study: Final Background Report.” San Francisco Office of
Economic and Workforce Development, August 2016.
———. “Mission Street Corridor Economic Analysis.” San Francisco Office of Economic and
Workforce Development, August 30, 2017.
———. “San Francisco Formula Retail Analysis.” San Francisco Planning Department, June
2014.
Streetsense. “D.C. Vibrant Retail Streets Toolkit.” Washington D.C. Office of Planning, 2013.
https://planning.dc.gov/publication/dc-vibrant-retail-streets-toolkit-final.
Thompson, Derek. “The Paradox of American Restaurants.” The Atlantic, June 20, 2017.
https://www.theatlantic.com/business/archive/2017/06/its-the-golden-age-of-restaurants-
in-america/530955/.
———. “What in the World Is Causing the Retail Meltdown of 2017?” The Atlantic, April 10,
2017. https://www.theatlantic.com/business/archive/2017/04/retail-meltdown-of-
2017/522384/.
Townsend, Matt, Jenny Surane, Emma Orr, and Christopher Cannon. “America’s ‘Retail
Apocalypse’ Is Really Just Beginning.” Bloomberg.com. Accessed December 6, 2017.
https://www.bloomberg.com/graphics/2017-retail-debt/.
ULI Center for Capital Markets and Real Estate. “ULI Real Estate Consensus Forecast: A Survey
of Leading Real Estate Economists/Analysts,” April 2017. https://uli.org/wp-
content/uploads/ULI-Documents/ULIConsensusForecastSpring17.pdf.
Urban, Angela. “With Online Shopping on the Rise, Cities Look to Address Congestion Impacts
of Deliveries.” Mobility Lab, April 13, 2017. https://mobilitylab.org/2017/04/13/role-of-
deliveries-in-congestion/.
Wenus, Laura. “Merchants Balk at Restaurant Addition to Retail (Updated).” MissionLocal (blog),
May 11, 2017. https://missionlocal.org/2017/05/merchants-balk-at-retail-to-restaurant-
addition-to-retail-and-entertainment-venue/.
Wetten, Rebecca. “Future of Retail.” Raconteur, June 25, 2017.
Widness, Brett. “Four Trends Driving the Evolution of Grocery Stores.” Urban Land Magazine,
March 21, 2017. http://urbanland.uli.org/economy-markets-trends/four-trends-driving-
evolution-grocery-stores/.
Wong, Julia Carrie. “Delivery Robots: A Revolutionary Step or Sidewalk-Clogging Nightmare?”
The Guardian, April 12, 2017, sec. Technology.
http://www.theguardian.com/technology/2017/apr/12/delivery-robots-doordash-yelp-
sidewalk-problems.
Wright, Joshua. “Where Automation in Warehousing Could Be Most Felt.” Emsi (blog),
September 29, 2016. http://www.economicmodeling.com/2016/09/29/automation-
warehousing-metros-suspectible/.
Zack, Dan. “Strategies for Good Urban Retail.” Smart Growth Voice Online, 2015.
http://smartgrowth.org/strategies-for-good-urban-retail/.
Recommended