MICROPOLLUTANTS AND MICROPLASTICS IN THE AQUATIC ENVIRONMENT
State of the art in the analysis of brominated flame retardantsin biota and sediment: insights from the characterisation of two newcertified reference materials
Marina Ricci1 & Penka Shegunova1 & Katrin Vorkamp2
Received: 19 February 2020 /Accepted: 17 April 2020# The Author(s) 2020
AbstractThe Joint Research Centre (JRC) of the European Commission has recently released two new Certified Reference Materials(CRMs) for the analysis of brominated flame retardants (BFRs): the freshwater sediment ERM-CC537a and the fish tissue ERM-CE102. The production of these CRMs responds to the need of expanding the offer of quality assurance/quality control tools forthe analysis of BFRs in the fields of environmental analysis and food control, especially for compliance purposes. The sedimentERM-CC537a carries certified values for polybrominated diphenyl ethers (PBDEs) and hexabromocyclododecane (HBCDD)diastereoisomers in the μg/kg range (dry mass), while the fish tissue ERM-CE102 is certified for PBDEs in the ng/kg range (wetweight). ERM-CC537a is the first reference material ever available with certified values for α-, β- and γ-HBCDD. Theassignment of the certified values was performed via an intercomparison of expert laboratories. The evaluation of the dataconfirms the improving trend, observed in recent years, regarding the comparability of PBDE measurement results. The relativestandard deviation (RSD) among laboratories is slightly better for the fish material (8–11%) compared to the sediment (9–15%),despite lower mass fractions in the biota matrix. The RSD of HBCDD data (17%) reveals that they are more challenging analytes.The average measurement uncertainty declared by the participants is about 30%, but an in-depth analysis of their performancereveals that it should be feasible to reduce the uncertainty budget.
Keywords Polybrominated diphenyl ethers (PBDEs) . Hexabromocyclododecanes (HBCDDs) . Fish . Quality assurance andcontrol . Environmental monitoring . Food safety .Measurement uncertainty . Interlaboratory comparison
Introduction
Flame retardants are chemical additives used in a large varietyof inflammable commercial products (e.g. electronic equip-ment, construction materials, furnishings and textiles), withthe purpose of preventing the start and/or slowing the spread
of fire. Polybrominated diphenyl ethers (PBDEs) andhexabromocyclododecanes (HBCDDs) belong to theadditive-type brominated flame retardants (BFRs) which,due to the absence of covalent bonds to the polymer, are moreeasily released from the products than reactive flame retar-dants (Xu et al. 2009; Osako et al. 2004). PBDEs were pro-duced in the three commercial mixtures Penta-, Octa- andDecaBDE. The production and use of all three technical prod-ucts has been severely restricted in the EU since 2003 (EC2003; EC 2002 repealed by EC 2011a). In addition, HBCDDsand DecaBDE are regulated under the EU RegulationRegistration, Evaluation, Authorisation and Restriction ofChemicals (REACH) (EC 2006; EC 2017a). Penta- andOctaBDE, HBCDDs and DecaBDE were added to theStockholm Convention on Persistent Organic Pollutants in2009, 2013 and 2017, respectively (UN, StockholmConvention http://www.pops.int, Accessed 6 April 2020).Despite their restrictions and bans, BFRs continue to remainubiquitous in the environment, owing to their persistence,
Responsible Editor: Ester Heath
Electronic supplementary material The online version of this article(https://doi.org/10.1007/s11356-020-08950-7) contains supplementarymaterial, which is available to authorized users.
* Marina [email protected]
1 European Commission, Joint Research Centre (JRC), Retieseweg111, 2440 Geel, Belgium
2 Aarhus University, Department of Environmental Science,Frederiksborgvej 399, 4000 Roskilde, Denmark
Environmental Science and Pollution Researchhttps://doi.org/10.1007/s11356-020-08950-7

long-range atmospheric transport (Okonski et al. 2014), bio-accumulation and biomagnification (HELCOM 2018; Maet al. 2013). Due to their high octanol-water partition coeffi-cients (log Kow) (Braekevelt et al. 2003), they typically adsorbonto suspended and bed sediments and partition into lipids inorganisms (Wenning et al. 2011; Zegers et al. 2003; de Boeret al. 2003). Exposure to BFRs, both via the environment, thefood chain and from indoor sources, is a risk for human health.Besides the recognised endocrine-disruptive effects of thePBDEs, evidences on neurodevelopmental toxicity and indi-cations of cancer have emerged (Lilienthal et al. 2006;Hoffman et al. 2017). Toxic effects in animals have beenfound for HBCDDs (Guo et al. 2019; Lyche et al. 2015).
The monitoring of BFRs in environmental and food sam-ples is an ongoing task for analytical laboratories all over theworld. In Europe, PBDEs and HBCDDs are included in thelist of priority substances of the EU Water FrameworkDirective (WFD) with defined environmental quality stan-dards (EQS) in water and biota (EC 2013). They also haveto be monitored in fish and seafood (among other foodstuff)following the Commission Recommendation 2014/118/EU(EC 2014). Monitoring of BFRs in biota and sediment is alsoforeseen in other programmes, for example the CoordinatedEnvironmental Monitoring Programme (CEMP) of the Oslo-Paris Commission (OSPAR) or the Arctic Monitoring andAssessment Programme (AMAP). The reliability of measure-ment results is imperative, especially for compliance pur-poses. For control and monitoring laboratories, the appliedanalytical methodologies should be validated in accordancewith the requirements listed in ISO/IEC 17025 or similar stan-dards. The analysis of certified reference materials (CRMs) isan essential component in this context, both in environmentaland food-related legislation, and recommended in the light ofensuring quality and comparability of data (EC 2009; EC2017b).
This study presents the development of two CRMs recentlyreleased by the Joint Research Centre (JRC) of the EuropeanCommission in Geel, Belgium. The freshwater sedimentERM-CC537a, certified for PBDEs and HBCDDs, and thefish tissue ERM-CE102, certified for PBDEs only, were bothprepared from naturally contaminated material to ensure theircommutability and suitability for routine analyses. Thecommutability (or similarity of analytical behaviour to routinesamples) is particularly pronounced in the case of ERM-CE102, whose matrix is a wet paste. In addition, the certifiedvalues are assigned relative to wet weight, making its use forcompliance check towards legal limits established on a wetweight basis (e.g. WFD EQS, limit of quantification in thefood control sector) more straightforward and possibly lessbiased than in the case of freeze-dried materials. The primaryaim of this study was the assignment of certified values.However, it also presents interesting insights into the achiev-able analytical quality of state-of-the-art PBDE and HBCDD
analysis conducted by expert laboratories in charge of routinemeasurements in the field of food control and environmentalmonitoring. In this frame, a more extensive discussiontargeting the evaluation of the measurement uncertainty ispresented.
Materials and methods
Sampling and processing of the CRMs
ERM-CC537a Freshwater sediment was sampled in November2011 from a small Belgian river included in the Flemish sed-im e n t mo n i t o r i n g n e tw o r k (VMM , V l a am s eMilieumaatschappij https://www.vmm.be, Accessed 6 April2020). About 700 kg of top layer sediment (about 20 cmdepth) was collected in high-density polyethylene containersand transported to the JRC processing laboratories in Geel.
The wet sediment was subjected to air-drying at 35 °C forabout 1 week in ventilated drying cabinets (Hereaus, modelUT 6760, Langenselbold, DE). Subsequently, the sedimentwas manually crushed and sieved over a 1-mm stainless steelsieve (Russel Finex, London, UK). After about 1 month ofstorage at room temperature, the bulk sediment was jet-milled(Alpine, Augsburg, DE) and further sieved using a 125-μmstainless steel sieve (Russel Finex, London, UK). The homog-enisation was carried out using a Dynamix-200 CM mixer(WAB, CH) for about 2 h and finally the sediment was dis-pensed through a cone mixer in portions of about 40 g into60-mL amber glass bottles with screw caps having an alumin-ium disc as insert (Fig. 1). Sterilisation of the material wasperformed by γ-irradiation using a dose between 7 and12.5 kGy. Afterwards, ERM-CC537a was stored at + 4 °Cawaiting further tests. A total of 1500 units of ERM-CC537awere produced.
ERM-CE102 Two fish species were employed as starting mate-rials, rainbow trout (Oncorhynchus mykiss) locally sourcedfrom a Belgian aquaculture farm, and wild Wels catfish(Silurus glanis) originating from the area of the Flix reservoirof the Ebro river (Spain), caught in spring 2011 and storedfrozen at the JRC laboratory. Both starting fish materials wereanalysed for BFRs levels prior to CRM preparation: BFRswere detected in the catfish, but not in the trout. Thus, themass fractions in the catfish served as the basis for the pro-cessing scheme and, in order to reach the desired BFRs levelsin the candidate CRM, the two fish species were mixed ac-cording to a mass ratio trout:catfish = 98:2.
About 100 kg of trout and about 1.8 kg of catfish weresliced into fillets (removing bones and skin). The fillets werecut in small cubes, shock-frozen in liquid nitrogen and cryo-genically milled using a Palla VM-KT cryogenic vibratingmill (KHD, Köln, DE), separately for the two species. The
Environ Sci Pollut Res

resulting pastes were first stored at − 20 °C and then allowedto thaw at + 4 °C, before pre-cooking in glass jars at 85 °C inan autoclave JBTC AR092 pilot retort (JBT, Sint-Niklaas,BE). After this pre-heating step, the catfish and trout batcheswere first separately homogenised in a Stephan UM12 mixer(Hameln, DE), followed by a step-wise mixing scheme usinga Stephan UM200 mixer, during which the catfish batch wasdiluted with batches of blank trout until obtaining a wellhomogenised fish paste. Approximately 40 g of the fish pastewas filled into 60-mL glass jars using a Unifiller machine(Lörrach, DE). The jars were closed with twist-off lids usinga Lenssen twist-off machine (Sevenum, NL) inside a chamberfilled with steam. The under-pressure created in the head-space over the paste after cooling down ensures that the sensorof the lid remains pressed-down as long as the seal is notbroken. Upon opening, the click of the lid will indicate thatthe sample is not compromised. The filled jars were sterilisedin an autoclave at 121 °C (JBT, Sint-Niklaas, BE). After la-belling, each jar was placed into a pre-labelled multilayerpouch which was thermo-sealed using a DAKLA sealing ma-chine (Daklapak, Kortrijk, BE) and stored at + 4 °C awaitingfurther tests (Fig. 1). Approximately 1400 units of ERM-CE102 were produced.
Homogeneity and stability of the CRMs
Homogeneity
A key requirement for any reference material aliquoted inunits is the equivalence between those units, i.e. ensuring thatthe certified values of the CRM are valid for all units, withinthe stated uncertainties. ISO 17034 requires RM producers toquantify the between-unit variation. Quantification ofbetween-unit inhomogeneity (as standard deviation, to be in-troduced as a component in the final certified uncertainty) wascarried out by analysis of variance (ANOVA) on a number ofunits selected using a random stratified sampling scheme cov-ering the whole batch. Besides the between-unit homogeneity,quantification of within-unit inhomogeneity (i .e.microhomogeneity) is necessary to determine the minimum
sample intake of the CRM. The within-unit inhomogeneitywas established by comparison of variances obtained usingthe F-test for equality of two-sample variances at a confidencelevel of 95%.
ERM-CC537a Ten bottles of ERM-CC537a were selected. Fourindependent samples of at least 750 mg were analysed fromeach selected unit under repeatability conditions by gas chro-matography with electron capture negative ionization low res-olution mass spectrometry (GC-ECNI-LRMS) for BDE28,47, 99, 100, 153, 154, 183 and 209 and by high-performance liquid chromatography with tandem mass spec-trometry (HPLC-MS/MS) for HBCDDs. The data were eval-uated with respect to analytical trends (and corrected whenneeded) and for outliers (only excluded in case of technicalreasons). For the microhomogeneity, a minimum of eight in-dependent replicate analyses were performed per sample in-take for the following decreasing sample intakes: 750 mg,500 mg and 200 mg.
ERM-CE102 Between eight and sixteen units were selected.Three independent samples from each selected unit wereanalysed for BDE28, 47, 49, 99, 100, 153, 154, 183 and 209by GC with high-resolution mass spectrometry (GC-HRMS).The sample preparations had to be split over several days;therefore, day-to-day effects were addressed and data normal-ised, if needed, to detect the presence of trends and outliers. Inthe case of BDE49, an outlier was detected and the between-unit inhomogeneity was modelled as a rectangular distributionlimited by the outlying unit mean. For the microhomogeneity,nine independent replicates were analysed per sample intakefor the following decreasing sample intakes: 8 g, 5 g and 2 g.
Stability
Stability testing is necessary to establish the conditions forstorage (long-term stability) as well as the conditions for dis-patch of the materials to the customers (short-term stability).The influences of time and temperature were regarded as rel-evant for these CRMs and the stability studies were carried out
Fig. 1 ERM-CC537a (left) andERM-CE102 (right) CRM units
Environ Sci Pollut Res

using an isochronous design (Lamberty et al. 1998). Afterevaluation for analytical trends and outliers, the data wereplotted as mass fraction against storage time and the slopesof the obtained regression lines were tested for statistical sig-nificance, evidencing potential increasing/decreasing trendsof the target analytes over time. The uncertainties of stabilityduring dispatch and storage (to be included in the final uncer-tainty budget of the certified value) were estimated as de-scribed in Linsinger et al. (Linsinger et al. 2001).
ERM-CC537a For the short-term stability study, samples werestored at + 18 °C and + 60 °C for 0, 1, 2 and 4 weeks (refer-ence temperature set to − 20 °C). From each of the two unitsselected per storage time, three sub-samples were analysed byGC-HRMS for PBDEs (see sub-section "Homogeneity") andultra-performance liquid chromatography with tandem massspectrometry (UPLC-MS/MS) for HBCDDs. For none of theparameters, trends were statistically significant (95% confi-dence level) at + 18 °C. However, the slopes of the regressionlines were significantly different from zero on at least a 95%confidence level at + 60 °C for BDE28, 47, 153, 154, 183,209, α- and γ-HBCDD. ERM-CC537a must be thereforeshipped under cooled conditions (not exceeding + 18 °C).
For the long-term stability study, samples were stored at +4 °C and + 18 °C for 0, 8, 16 and 24 months (reference tem-perature set to − 20 °C). From each of the two units selectedper storage time, three sub-samples were analysed by GC-ECNI-LRMS for PBDEs and HPLC-MS/MS for HBCDDs.No significant trend was detected for any of the analytes (95%confidence level), except for β-HBCDD at + 4 °C (but not at+ 18 °C). ERM-CC537a will therefore be stored at + 18 °C.
ERM-CE102 For the short-term stability study, samples werestored at + 18 °C and + 60 °C for 0, 1, 2 and 4 weeks (refer-ence temperature set to +4 °C). From each of the two unitsselected per storage time, three sub-samples were analysed byGC-HRMS for BDE28, 47, 99, 100, 153, 154, 183, 209). Fornone of the parameters, trends were statistically significant(95% confidence level) at + 18 °C. A statistically significantpositive trend (95% confidence level) was observed forBDE154 at + 60 °C. This was regarded as a statistical artefactbecause other possible reasons were ruled out, such as degra-dation of the matrix (which would result in a positive trend forall PBDEs, which was not the case) or dehalogenation ofBDE209 (no decreasing trend was observed in the mass frac-tion of this congener). However, a conservative approach waschosen and it was decided to ship the material under cooledconditions (not exceeding + 18 °C).
For the long-term stability study, samples were stored at +4 °C and + 18 °C (reference temperatures set to − 20 °C and +4 °C, respectively) for 0, 8, 16 and 24 months. From each ofthe two units selected per storage time, three sub-sampleswere analysed by GC-HRMS for PBDEs. No significant trend
was detected for any of the analytes (95% confidence level) at+ 4 °C, while at + 18 °C, positive significant trends (regardedas statistical artefacts) were detected for BDE49 and BDE183.ERM-CE102 will therefore be stored at + 4 °C.
Characterisation by interlaboratory comparison
Design of the characterisation studies
The material characterisation, i.e. the process of determin-ing the property values of a reference material, was basedon an interlaboratory comparison of expert laboratoriesapplying different measurement procedures to demon-st ra te the absence of a measurement bias . Theinterlaboratory comparisons took place betweenNovember 2016 and March 2017 for ERM-CC537a andfrom September to December 2018 for ERM-CE102. Thelaboratories were selected based on criteria that comprisedboth technical competence and quality management as-pects. Each participant was required to operate a qualitysystem and to deliver documented evidence of its profi-ciency in the analysis of PBDEs and HBCDDs in sedi-ment (for ERM-CC537a) and PBDEs in biota (for ERM-CE102) or similar matrices, by submitting results ofinterlaboratory comparison exercises and/or method vali-dation data. Having a formal accreditation was not man-datory, but meeting the requirements of ISO/IEC 17025was obligatory. The participation required the applicationof validated methods.
The analysis protocol to be respected in the characterisationstudy included the following points: (1) sample preparationsand measurements had to be spread over at least 2 days toensure intermediate precision conditions of analysis, (2) freshcalibration solutions had to be prepared for each day of mea-surement, (3) each participant had to analyse a sample ofNIST SRM 1944 New York/New Jersey WaterwaySediment (in the case of ERM-CC537a) and NIST SRM1946 Lake Superior Fish Tissue (in the case of ERM-CE102) as a blind method quality control sample alongsidethe CRM samples.
Laboratories were also requested to give estimations of theexpanded uncertainties of the mean value of the measurementresults. No approach for the estimation was prescribed, i.e.top-down and bottom-up approaches were regarded as equallyvalid procedures.
ERM-CC537a Thirteen laboratories (for a total of fourteendatasets for PBDEs, one laboratory providing twodatasets, and nine datasets for the HBCDDs) were se-lected. For each dataset, laboratories received two unitsof ERM-CC537a and had to report six independent re-sults (three per unit) for PBDEs and HBCDD isomerson a dry mass basis. The water and volatiles’ content
Environ Sci Pollut Res

had to be determined on each unit in duplicate (accord-ing to a prescribed oven-drying procedure).
ERM-CE102 Twelve laboratories (for a total of fourteendatasets, two laboratories providing two datasets) were select-ed. For each dataset, laboratories received two or three units ofERM-CE102 and had to report six independent results (threeor two per unit, respectively) relative to wet weight.
Analytical methods
ERM-CC537a Avariety of extraction procedures [e.g. Soxhlet,accelerated solvent extraction (ASE) and solid-phase extrac-tion (SPE)] and clean-up methods [e.g. alumina and acidicsilica gel columns, gel permeation chromatography (GPC)]with different instrumental determination techniques (GC-LRMS, GC-HRMS, GC-MS/MS, HPLC-MS/MS, UPLC-MS/MS) were applied by the participants (Tables S1 and S2in Online Resource).
Two analytical methods for the analysis of PBDEs insediment [(GC-ECNI-MS and GC with elect ronionization-isotope dilution tandem MS (GC-EI-IDMS/MS)] were validated in-house at the JRC for participatingin the characterisation study of ERM-CC537a (L12S andL13S in Table S1, Online Resource). The sample prepa-ration applied was the same in both methods: 2 g of sed-iment was mixed with approximately 5 g of a Cu/Na2SO4
mixture (1/3, w/w), loaded in an 11-mL ASE thimble(containing a filter at the bottom) and spiked with50 μL (by weight) of the internal standard solution. Theextraction was carried out with an ASE 200 system(Dionex™, Thermo Scientific™, Sunnyvale, CA, USA),applying the following conditions: pressure 1500 psi, tem-perature 120 °C, pre-heating time 5 min, heating time6 min, static time 10 min, flush volume 150%, purge time120 s, static cycles 3, solvent hexane/acetone (1/1). Theextract was dried over Na2SO4 and evaporated til ~ 1 mL.Further clean-up was performed by SPE (Gilson SPE-GX-274ASREC™, Middleton, WI, USA) using a Bond ElutePCB cartridge (1 g, 3 mL, ChromTech, Apple Valley,MN, USA), eluting with 4 mL of hexane, (flow speed ~1 mL/min). Before instrumental analysis (details reportedin the Online Resource), the extract was concentrated un-der a gentle steam of nitrogen (VLM EC1/VLM Eva2–Nitrogen concentrator).
ERM-CE102 Several extraction procedures [e.g. ASE, Soxhlet,organic solvent(s) extraction, liquid-liquid extraction (LLE)]and clean-up methods [e.g. carbon, alumina and multilayer(acidic, basic and neutral) silica gel columns, GPC and a com-bination thereof] with different instrumental determinationtechniques [GC-LRMS both in EI and ECNI modes, GC-
HRMS and GC-MS/MS in EI mode] were applied (Table S3in Online Resource).
Technical and statistical evaluation of the characterisationresults
The technical evaluation of the submitted datasets included (1)compliance to the analysis protocol, (2) critical screening ofvalues reported as below limit of detection (LOD) or limit ofquantification (LOQ), (3) agreement of the measurement re-sults with the assigned values of the blind quality controlsamples (NIST SRMs) and (4) coherence of the repeatabilityevinced from the characterisation dataset with the one de-clared by the laboratory according to their method validation.Based on these criteria, between a minimum of two and amaximum of six non-compliant datasets were excluded fromthe value assignment of certified properties.
For the statistical evaluation, results were tested for normal-ity, outlying means (Grubbs test) and outlying standard devi-ations (Cochran test) at a 99% confidence level. Standarddeviations within and between laboratories were calculatedusing one-way ANOVA.
All data and information related to the certification ofERM-CC537a and ERM-CE102 are available in the respec-tive certification reports and certificates, to be found at https://crm.jrc.ec.europa.eu/.
Results and discussion
CRMs characterisation and fitness for purpose
The homogeneity and stability of ERM-CC537a and ERM-CE102 were ascertained as fit for purpose (Tables S4 and S5in Online Resource).
The unweighted means of the means of the accepteddatasets were assigned as certified value for each parameter(Figs. 2 and 3, Table S6 in Online Resource). The uncer-tainties of the certified values are composed by contributionsrelated to the characterisation by the expert laboratories, po-tential between-unit inhomogeneity, potential degradationduring transport and long-term storage and expanded by anappropriate coverage factor k (the different contributions aresummarised in Tables S4, S5 and S7 in Online Resource).
The certified values of the PBDEs and HBCDDs in thefreshwater sediment ERM-CC537a are in the range of μg/kgexcept for BDE209 (7.8 mg/kg) and reflect well the levelsgenerally found in similar matrices in the environment al-though regional differences may exist (Law et al. 2008;Yogui and Sericano 2009; Hong et al. 2010; Ramu et al.2010; Law et al. 2014; Rüdel et al. 2017).
The ∑PBDEs (28, 47, 99, 100, 153, 154, 183) in ERM-CC537a amounts to 68.09 μg/kg and rises up to
Environ Sci Pollut Res

7868.09 μg/kg (dry mass) when BDE209 is included, whichindicates a relatively highly contaminated site in Belgium, asinformed by the Flemish sediment monitoring network(VMM, Vlaamse Milieumaatschappij https://www.vmm.be,Accessed 6 April 2020), before the sampling for the CRMwas carried out. Heavily industrialised areas can show evenhigher levels of contamination, with value of ΣPBDEs up to14,000 μg/kg (Eljarrat et al. 2007).
The distribution pattern of the PBDEs in ERM-CC537a(Fig. 2) evidences the dominance of BDE47 and BDE99 overthe other lower brominated congeners, and the heavy presenceof BDE209. This could indicate a past more extensive use ofthe PentaBDE and DecaBDE technical mixtures in compari-son to the OctaBDE in the area of the CRM sampling. SimilarPBDEs patterns can be found in reports on PBDE contamina-tion in the European environment but also elsewhere (Lawet al. 2008; Yogui and Sericano 2009; Hellar-Kihampa 2013;Song et al. 2004; Verhaert et al. 2013).
ERM-CC537a presents similar PBDEs levels (mostly with-in a factor of 10) to NIST SRM 1944 New York/New JerseyWaterway Sediment, with the exception of BDE209, which is100 times higher in ERM-CC537a than in SRM 1944. It isworth to note that NIST SRM1944 carries only reference (andnot certified) values for this class of brominated flame retar-dants (Ricci et al. 2016).
The ∑HBCDDs in ERM-CC537a, amounting to70.6 μg/kg dry mass, additionally confirms the sampling siteas being relatively contaminated when compared to literaturerecords from Europe and Asia (Rüdel et al. 2017; Law et al.2006; Wang et al. 2017; Zhang et al. 2018). The relativeamounts of the three diastereoisomers translate into approxi-mately 12%, 3% and 85% for α-, β-, and γ-HBCDD, respec-tively, and correspond well to what is generally found in mostsuspended particular matters and sediments (and similar tocommercial HBCDD formulations) (Rüdel et al. 2017). It isworth to mention that ERM-CC537a is the first ever RM car-rying certified values for the HBCDD diastereoisomers (e.g.
Fig. 2 PBDEs and HBCDDs inERM-CC537a: certified valuesand uncertainties expressed inμg/kg (in mg/kg for BDE209)
Fig. 3 PBDEs in ERM-CE102:certified/indicative values anduncertainties (converted to ng/kgfor a clearer view of the data)
Environ Sci Pollut Res

in NIST SRM 1944 New York/New Jersey waterway sedi-ment, α-, β- and γ-HBCDD have indicative values withoutassigned uncertainty).
ERM-CE102 is certified for PBDE mass fractions in therange of ng/kg, with a total of 647.7 ng/kg wet weight for∑PBDEs (28, 47, 49, 99, 100, 153, 154, 183), more matchingthe lower end of the contamination spectrum reported in theliterature for fish (EC 2011; Eljarrat and Barceló 2018; Chenet al. 2013). ERM-CE102 complements the availability of fishCRMs for PBDE analysis by providing a material with certi-fied values at mass fractions roughly hundred times lower thanthe NIST SRM 1946 (Lake Superior Fish Tissue) and SRM1947 (Lake Michigan fish tissue). In addition, while the NISTSRMs are deep-frozen materials that need to be stored at −80 °C, the ERM-CE102 is a fish paste to be stored at + 4 °C(Poster et al. 2003). The PBDE quantities in ERM-CE102were obtained by mixing two fish starting materials (one con-taminated and one ‘blank’) and they mirror naturally occur-ring levels, while not representing one particular species orlocation. The assignment of a certified value for BDE138was not possible because all measurement results were belowthe LOD.
An EQS of 0.0085μg/kgwet weight was set for biota (fish)under the WFD in 2013 (EC 2013) for the sum of BDEs 28,47, 99, 100, 153 and 154, while an LOQ of 0.01 μg/kg wetweight is required by the 2014 Commission Recommendation(EC 2014) for the analytical methods employed in the moni-toring of BDEs 28, 47, 49, 99, 100, 138, 153, 154, 183 and209 in fish (among other food commodities). These values arevery low and challenging, even for the most advanced analyt-ical chemistry techniques to date. The assignment of a certi-fied value at this mass fraction level is still an unmet achieve-ment and, in the view of the authors, presently unreachable,because the related uncertainty would become extremelylarge, undermining the usefulness of the certified value. InERM-CE102, the WFD ∑PBDEs (28, 47, 99, 100, 153,154) amounts to 0.5977 μg/kg wet weight, i.e. almost twoorders of magnitude higher than the EQS, notwithstandingthe lowering of the natural contamination levels occurring inthe processing of this CRM. The certification of BDE28 at amass fraction of 0.0077μg/kg, thus matching the EQS, was sodifficult that only an indicative value could be assigned. Theapplicability of the PBDEs EQS value, calculated to protecthuman consumers based on observed effects of one singlecongener (BDE99) on rats and including very large safetyfactors (Yang et al. 2015), is an ongoing subject of discussionby the monitoring laboratories community. The reality seesmuch higher levels of PBDEs present in the environment,often 100 to 1000 times the EQS (EC 2011b). In this respect,ERM-CE102 is to be considered as an appropriate referencematerial to be used as a quality control tool in the routinemonitoring of environmental samples.
The levels of the individual PBDEs in ERM-CE102 matchthose reported in the literature (Fig. 3): the dominance ofBDE47 followed by BDE99 is consistent with the generalpattern in biota samples, confirming the commutability ofthe CRM (Verhaert et al. 2013; Yang et al. 2015; Miegeet al. 2012; Peng et al. 2007). In these references, the averageratio BDE47/BDE99 in biotic sample is generally between 3and 6, while in ERM-CE102, it is 1.8. It is well-known thatreductive debromination is a significant degradation mecha-nism for BDE99, 183 and 209 in certain fish species. A sig-nificant amount of BDE99 is transformed in the gut of com-mon carp to BDE47, readily assimilated in the fish tissues(Stapleton et al. 2006; Stapleton et al. 2004). One of the ini-tially targeted PBDEs for certification in ERM-CE102 wasBDE209. Unfortunately, unsatisfactory results obtained dur-ing the certification process, especially with regard to the ho-mogeneity evaluation (Table S4 in Online Resource), broughtus to the decision of not proceeding with the assignment of acertified value for this congener (more details are available inthe certification report). Nevertheless, the mass fraction ofBDE209 was repeatedly measured in several occasions, in-cluding the homogeneity and stability studies, and reportedas approximately 600 ng/kg (wet weight). The presence of arelatively high level of BDE209 was surprising, especiallytaking into account the ‘dilution’ of the catfish with blanktrout during the processing of the CRM. BDE209 is generallypresent at much lower mass fractions in fish because ofdebromination mechanisms and possibly lower bioavailability(Miege et al. 2012; Viganò et al. 2011; Noyes et al. 2011;Pulkrabová et al. 2007). The BDE209 mass fraction measuredin ERM-CE102 might be an indication of an exceptionallyheavy BDE209 pollution in the Flix reservoir of the Ebro riverwhere the catfish was collected (Eljarrat and Barceló 2008).Polder et al. (Polder et al. 2014) also reported high mass frac-tions of BDE209 in tilapia fish (168 ng/g lipid weight) fromLake Victoria in Tanzania, possibly explained by a constantrelease of this congener into the water of the lake by nearbyindustrial areas.
The successful outcome of the characterisation study addi-tionally confirms the commutability, i.e. comparability of an-alytical behaviour to ‘real world’ samples, of these CRMs viathe agreement of results obtained from measurement proce-dures based on different principles and routinely applied forthe analysis of BFRs in environmental and food samples. Inparticular for ERM-CE102, the commutability to fresh routinesamples is enhanced by its consistency as wet paste: measure-ment results can be directly compared to EQS values(expressed as wet weight) avoiding the application of dry/wet mass fraction conversion factors.
Environ Sci Pollut Res

Interlaboratory comparability
Following the first reports on interlaboratory comparability onPBDEs (de Boer and Cofino 2002; de Boer andWells 2006), afew other studies have been published presenting results frominterlaboratory comparisons for BFRs in solution, sediment(or similar matrix) and biota (Bremnes et al. 2019). The agree-ment among laboratories seems to have improved over time,especially for BDE209, reaching coefficients of variation(CVs) of 20% and less (Duffek et al. 2008). For HBCDDs, adifferent situation must be flagged with a recent intercompar-ison on test solution showing CVs > 50% (Melymuk et al.2015).
The analysis and comparison of the characterisationdatasets of ERM-CC537a and ERM-CE102 provide interest-ing insights in the present state-of-the-art for the determinationof PBDEs and HBCDDs in environmental samples and con-firms the improving trend mentioned previously.
Considering the set of laboratories whose measurementswere used in the assignment of the PBDE values, the relativestandard deviation (RSD) among the laboratories in ERM-CC537a ranged between 9 and 15% (n = number of datasetsbetween 9 and 12, with the exception of n = 6 for BDE209)while for ERM-CE102, the RSD ranged between 8 and 11%(5 < n < 11) (Table 1). A higher RSD of 18%was observed forBDE28 in the sediment sample (present at a very low massfraction, close to the LOQ for some laboratories, see Table S1and Table S6 in Online Resource) and BDE183 in the fishsample (only 4 datasets valid for value assignment, Table 1).The narrow range of RSDs obtained among datasets confirmsthe importance of selecting only expert laboratories meeting
the requirements of ISO/IEC 17025 and exclusively applyingvalidated methods. The overall performance of the laborato-ries seems slightly better in the case of the fish than of thesediment sample. One would expect a more difficult clean-upin the case of the fatty biota rich in co-extractives (lipid con-tent of 6.9 m/m %) in comparison with an abiotic sample. Inaddition, the fish material was characterised by much lowerPBDE mass fractions than the sediment (difference of twoorders of magnitude for the certified PBDEs, Table S6 inOnline Resource). However, sulphur, other sediment compo-nents and a generally more massive presence of additionalorganic pollutants could also interfere with the BFR determi-nation in sediments (Webster et al. 2009).
The average RSD among laboratories observed for theanalysis of HBCDD diastereoisomers in the sediment, ≈17%, seems to confirm that they are presently still more chal-lenging analytes than the PBDEs. This is also indicated by thelower number of laboratories available for the certification ofHBCDDs which mirrors the lower number of valid datasetsused in the value assignment.
The satisfactory RSDs obtained in the interlaboratory stud-ies for the PBDEs helped in keeping the uncertainty contribu-tion of the characterisation (estimated as the relative standarderror of the laboratories’ mean) for both CRMs down to anaverage of ≤ 4% (Table S7 in Online Resource). This contrib-uted to the successful outcome of the PBDEs certification forboth CRMs, with average expanded certified uncertainties of12.8% for ERM-CC537a and 11.5% for ERM-CE102, respec-tively. The results are different for the HBCDD diastereoiso-mers, for which the average certified uncertainty was 22.6%,signalling greater difficulty of certification for thesecompounds.
The uncertainties of the certified values are, for all PBDEcongeners, lower in ERM-CE102 than in ERM-CC537a.Considering the pool of PBDE congeners certified in bothmaterials (47, 99, 100, 153, 154), the average certified uncer-tainty is 9.6% for ERM-CE102 against 12.1% for ERM-CC537a (Table S6 in Online Resource). The cause of thisdifference is to be found in the higher uncertainty contributionrelated to homogeneity for ERM-CC537a compared to ERM-CE102, an average of 2.5% against 0.9%, while the averageuncertainty contributions related to long-term stability andcharacterisation show very similar or even equal values forboth materials (Tables S4 and S5 in Online Resource). Thehigher uncertainty contribution related to homogeneity in thecase of the sediment ERM-CC537a can be attributed to thehigher variability in relation to repeatability of the analyticalmethod applied in the homogeneity study, compared to theone used for the fish ERM-CE102, rather than indicating areal worse homogeneity of the material. The average RSD ofthe measurements for the homogeneity (considering the poolof PBDEs certified in both CRMs) equals to 5.6% for theERM-CC537a against 1.2% for the ERM-CE102.
Table 1 Relative standard deviation (RSD) among laboratories in thecertification exercises of ERM-CC537a and ERM-CE102
RSD among laboratories %
ERM-CC537aFreshwater sediment
ERM-CE102Fish tissue
BDE28 18 (n = 11) 11 (n = 5)
BDE47 13 (n = 10) 9 (n = 8)
BDE49 – 11 (n = 7)
BDE99 12 (n = 11) 11 (n = 11)
BDE100 9 (n = 10) 11 (n = 10)
BDE153 15 (n = 12) 8 (n = 10)
BDE154 12 (n = 9) 8 (n = 9)
BDE183 12 (n = 9) 18 (n = 4)
BDE209 9 (n = 6) –
α-HBCD 16 (n = 6) –
β-HBCD 16 (n = 6) –
γ-HBCD 18 (n = 5) –
n, number of datasets
Environ Sci Pollut Res
Measurement uncertainty
Measurement uncertainty evaluation
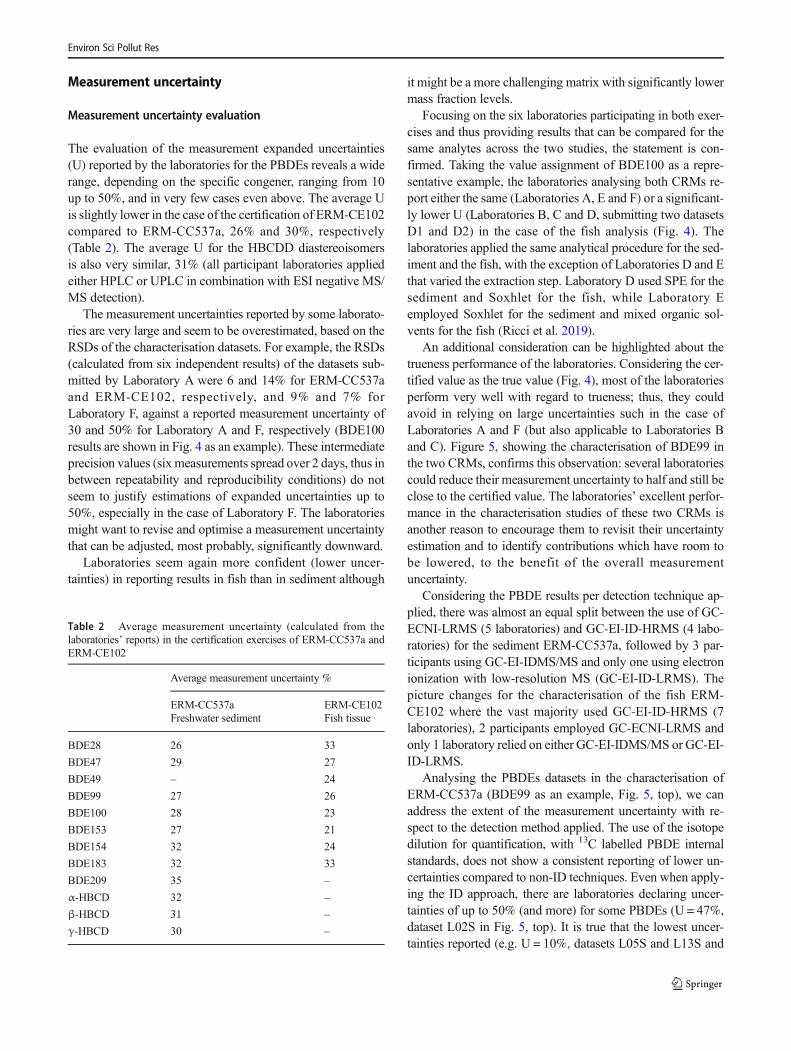
The evaluation of the measurement expanded uncertainties(U) reported by the laboratories for the PBDEs reveals a widerange, depending on the specific congener, ranging from 10up to 50%, and in very few cases even above. The average Uis slightly lower in the case of the certification of ERM-CE102compared to ERM-CC537a, 26% and 30%, respectively(Table 2). The average U for the HBCDD diastereoisomersis also very similar, 31% (all participant laboratories appliedeither HPLC or UPLC in combination with ESI negative MS/MS detection).
The measurement uncertainties reported by some laborato-ries are very large and seem to be overestimated, based on theRSDs of the characterisation datasets. For example, the RSDs(calculated from six independent results) of the datasets sub-mitted by Laboratory A were 6 and 14% for ERM-CC537aand ERM-CE102, respectively, and 9% and 7% forLaboratory F, against a reported measurement uncertainty of30 and 50% for Laboratory A and F, respectively (BDE100results are shown in Fig. 4 as an example). These intermediateprecision values (sixmeasurements spread over 2 days, thus inbetween repeatability and reproducibility conditions) do notseem to justify estimations of expanded uncertainties up to50%, especially in the case of Laboratory F. The laboratoriesmight want to revise and optimise a measurement uncertaintythat can be adjusted, most probably, significantly downward.
Laboratories seem again more confident (lower uncer-tainties) in reporting results in fish than in sediment although
it might be a more challenging matrix with significantly lowermass fraction levels.
Focusing on the six laboratories participating in both exer-cises and thus providing results that can be compared for thesame analytes across the two studies, the statement is con-firmed. Taking the value assignment of BDE100 as a repre-sentative example, the laboratories analysing both CRMs re-port either the same (Laboratories A, E and F) or a significant-ly lower U (Laboratories B, C and D, submitting two datasetsD1 and D2) in the case of the fish analysis (Fig. 4). Thelaboratories applied the same analytical procedure for the sed-iment and the fish, with the exception of Laboratories D and Ethat varied the extraction step. Laboratory D used SPE for thesediment and Soxhlet for the fish, while Laboratory Eemployed Soxhlet for the sediment and mixed organic sol-vents for the fish (Ricci et al. 2019).
An additional consideration can be highlighted about thetrueness performance of the laboratories. Considering the cer-tified value as the true value (Fig. 4), most of the laboratoriesperform very well with regard to trueness; thus, they couldavoid in relying on large uncertainties such in the case ofLaboratories A and F (but also applicable to Laboratories Band C). Figure 5, showing the characterisation of BDE99 inthe two CRMs, confirms this observation: several laboratoriescould reduce their measurement uncertainty to half and still beclose to the certified value. The laboratories’ excellent perfor-mance in the characterisation studies of these two CRMs isanother reason to encourage them to revisit their uncertaintyestimation and to identify contributions which have room tobe lowered, to the benefit of the overall measurementuncertainty.
Considering the PBDE results per detection technique ap-plied, there was almost an equal split between the use of GC-ECNI-LRMS (5 laboratories) and GC-EI-ID-HRMS (4 labo-ratories) for the sediment ERM-CC537a, followed by 3 par-ticipants using GC-EI-IDMS/MS and only one using electronionization with low-resolution MS (GC-EI-ID-LRMS). Thepicture changes for the characterisation of the fish ERM-CE102 where the vast majority used GC-EI-ID-HRMS (7laboratories), 2 participants employed GC-ECNI-LRMS andonly 1 laboratory relied on either GC-EI-IDMS/MS or GC-EI-ID-LRMS.
Analysing the PBDEs datasets in the characterisation ofERM-CC537a (BDE99 as an example, Fig. 5, top), we canaddress the extent of the measurement uncertainty with re-spect to the detection method applied. The use of the isotopedilution for quantification, with 13C labelled PBDE internalstandards, does not show a consistent reporting of lower un-certainties compared to non-ID techniques. Even when apply-ing the ID approach, there are laboratories declaring uncer-tainties of up to 50% (and more) for some PBDEs (U = 47%,dataset L02S in Fig. 5, top). It is true that the lowest uncer-tainties reported (e.g. U = 10%, datasets L05S and L13S and
Table 2 Average measurement uncertainty (calculated from thelaboratories’ reports) in the certification exercises of ERM-CC537a andERM-CE102
Average measurement uncertainty %
ERM-CC537aFreshwater sediment
ERM-CE102Fish tissue
BDE28 26 33
BDE47 29 27
BDE49 – 24
BDE99 27 26
BDE100 28 23
BDE153 27 21
BDE154 32 24
BDE183 32 33
BDE209 35 –
α-HBCD 32 –
β-HBCD 31 –
γ-HBCD 30 –
Environ Sci Pollut Res

11% dataset L06S in Fig. 5, top), down to 8%, belong todatasets acquired applying ID, but the use of GC-ECNI-LRMS does not decree per se significantly higher uncer-tainties. Among the GC-ECNI-LRMS datasets, one laboratorydeclares U as low as 10–14% for some PBDEs congeners(data not shown, but in Fig. 5, top, the same laboratory, datasetLO3S, reported U = 17%). This finds confirmation in thedatasets of the characterisation of ERM-CE102, where anoth-er laboratory applying GC-ECNI-LRMS estimated its mea-surement uncertainty as low as 9% in the determination ofBDE99 (dataset L05F in Fig. 5, bottom) and 14% for quanti-fication of BDE100 (Fig. 4, bottom, Lab D2). Beside the lowuncertainty reported, it is worth to add here that this laboratoryused fluorinated-BDEs as internal standards obtaining verygood results also in terms of accuracy (closeness to the certi-fied ‘true’ value).
Estimation of reliable measurement uncertainties:the example of the JRC
The outcome of the Key Comparison CCQM-K102‘Polybrominated diphenyl ethers in sediment’, coordinated
by the JRC and run under the auspices of the OrganicAnalysis Working Group of the Comité Consultatif pour laQuantité de Matière (CCQM) in 2015, clearly shows the fea-sibility of lowering the uncertainty budget for this kind ofanalysis (Ricci et al. 2017). Quantification of BDE47, 99and 153 at the μg/kg low-middle range in an environmentalabiotic matrix (like sediment) was successful for more than70% of the participating laboratories with expanded measure-ment uncertainties below 15%.
The JRC participated in the PBDE characterisation ofERM-CC537a, with both GC-ECNI-LRMS (using BDE77as the internal standard, L12S in Fig. 5) and GC-EI-MS/MS(applying ID with 13C-PBDEs, L13S in Fig. 5), as describedin the sub-section “Analytical methods”. The two methodswere validated in-house using the ERM-CC537a as sample(replicate measurements performed over 5 days) and providedwith a full measurement uncertainty budget. The methodswere based on the same extraction and clean-up procedures(Shegunova et al. 2017).
The measurement uncertainty was estimated for bothmethods via a top-down approach based on the validationdata, taking into account uncertainty contributions coming
1
3
5
7
9
11
mas
s fra
c�on
μg/
kg
ERM-CC537a, BDE100
Lab A Lab B Lab C Lab D Lab E Lab F
0.02
0.04
0.06
0.08
0.10
0.12
mas
s fra
c�on
μg/
kg
ERM-CE102, BDE100
Lab A Lab D1 Lab C Lab B Lab E Lab FLab D2
Fig. 4 Comparison of reportedmeasurement uncertainties forBDE100 in the characterisationstudy for ERM-CC537a (top) andERM-CE102 (bottom); certifiedvalue (solid line) ± expanded un-certainty (dashed lines)
Environ Sci Pollut Res

from the repeatability, intermediate precision and trueness(Eq. 1 in Online Resource). The uncertainty contribution ofthe calibration (from the weighing and the purity of the stan-dards used) was for both methods < 0.3%, thus negligible. Itshould be noted that, to keep this contribution negligible or atleast to a minimum, CRMs or standards whose purity is prop-erly assessed should be employed. Repeatability and interme-diate precision were estimated using the candidate ERM-CC537a as sample and they span between 1.3 and 12%: dur-ing the validation of a method, the use of a reference materialcan help in keeping these contributions as low as possible. Ifan in-house QC material is employed, efforts should be madeto ensure its homogeneity, so that repeatability contributionsare only accounting for the variability of the analytical methodand not for any kind of inhomogeneity of the material. Theuncertainty contribution of trueness was estimated via a stan-dard addition experiment to a blank material at three differentlevels. The latter is not the preferable approach, the availabil-ity of a fit-for-purpose CRM (with regard to the analyte-matrixcombination as well as to the magnitude of the certified value
and uncertainty) would ensure a more accurate estimation ofthe trueness of the method (Linsinger 2019). In this case, it is
Fig. 5 Characterisation datasetsof BDE99 in the sediment ERM-CC537a (top) and in the fishERM-CE102 (bottom). The bluedots are the measurement resultsand the error bars represent theexpanded measurement uncer-tainty reported by the laborato-ries; certified value (solid line) ±expanded uncertainty (dashedlines)
Table 3 Expanded relative uncertainty for the JRCmeasurement resultsof PBDEs in the characterisation of ERM-CC537a (6 replicates over2 days)
BDE Uncertainty budget %
GC-ECNI-LRMS
GC-EI-IDMS/MS
28 9.4 n.a.
47 3.7 10.8
100 15.6 11.1
99 20.1 10.4
154 24.1 13.2
153 25.6 13.9
209 n.a. 7.8
n.a., not available
Environ Sci Pollut Res

fundamental that the uncertainty of the CRM is sufficientlysmall, because it adds up as contribution to the overall true-ness uncertainty estimation, with a risk of bringing it to largevalues.
The uncertainties of the PBDEs measurement results sub-mitted by the JRC for the characterisation of ERM-CC537aare reported in Table 3 (corresponding to six replicates per-formed over 2 days, as required by the design of the charac-terisation study). The expanded uncertainties obtained for theGC-EI-IDMS/MS method were generally lower than the onesof the GC-ECNI-LRMS (with the exception of BDE47). Itseems that the uncertainties for the GC-ECNI-LRMS methodare larger mainly due to higher repeatability and intermediateprecision contributions, in the range of 3.3–7.4% and 1.3–12% compared to 3.2–5% and 1.3–4.4% for the GC-EI-IDMS/MS method. Trueness uncertainty contributions are,on the other hand, higher for the GC-EI-IDMS/MS method,spanning between 4 and 6%, while for the GC-ECNI-LRMS,they are between 1 and 4.5%. The trueness uncertainty esti-mation was carried out for both methods following the sameapproach of standard addition; thus, it is difficult to under-stand the reason of such difference.
These results show that, for the analysis of PBDEs in sed-iment, uncertainty budgets on average smaller than 20% (de-pending on the method applied) are attainable and, even whenisotope dilution is not available, acceptable uncertainties (<25%) can be achieved.
Conclusions
JRC Geel enlarged its portfolio of matrix CRMs for organiccontaminants with the successful certification of the sedimentERM-CC537a and the biota ERM-CE102 for brominatedflame retardants, to support the work of environmental mon-itoring and food control laboratories. ERM-CC537a has cer-tified values for the WFD PBDEs and it is the first CRMavailable for α-,β- and γ-HBCDD diastereoisomers. The fishtissue ERM-CE102 is certified for BDE47, 49, 99, 100, 153and 154 (while carrying indicative values for BDE28 and183). The commutability of ERM-CE102 is enhanced by itspresentation as a wet paste, with certified values assignedrelative to wet weight, directly comparable to established legallimits set on wet weight basis. The mass fractions of the cer-tified BFRs reflect well the levels generally found in routinelyanalysed samples; thus, these CRMs can be useful for methodvalidation but also as fit-for-purpose quality control tools inthe measurement results for regulatory compliance. The in-depth analysis of the characterisation datasets seems to indi-cate that the general performance of the expert laboratoriesdealing with the determination of BFRs is satisfactory, withindications of better performances for PBDEs than forHBCDD diastereoisomers. On the other hand, it also
highlights that laboratories should aim at a more accurate es-timation of their measurement uncertainties. The quality of themeasurement results depends not only on the trueness of thedata but relies also very much on the confidence level that canbe attributed to them.
Acknowledgements The authors would like to thank all laboratories par-ticipating in the certification studies and M. Magini, H. Emteborg, J.Seghers, M. Dabrio, B. Sejeroe-Olsen and A. Held from JRC Geel fortechnical and scientific support. Furthermore, a special thanks goes to W.de Cooman (VMM, Belgium) and Prof. S. Lacorte (IIQAB-CSIC, Spain)for the support during the sampling campaigns and to S. Wise and S.Choquette (NIST, USA) for providing the SRM units.
Author contributions Marina Ricci: conceptualisation, project adminis-tration, methodology, formal analysis, data curation, visualisation,writing—original draft, writing—review and editing. Penka Shegunova:investigation, methodology, validation, writing—original draft, writing—review and editing. Katrin Vorkamp: conceptualisation, writing—originaldraft, writing—review and editing.
Compliance with ethical standards
Conflict of interest The authors declare that they have no conflict ofinterest.
Open Access This article is licensed under a Creative CommonsAttribution 4.0 International License, which permits use, sharing,adaptation, distribution and reproduction in any medium or format, aslong as you give appropriate credit to the original author(s) and thesource, provide a link to the Creative Commons licence, and indicate ifchanges weremade. The images or other third party material in this articleare included in the article's Creative Commons licence, unless indicatedotherwise in a credit line to the material. If material is not included in thearticle's Creative Commons licence and your intended use is notpermitted by statutory regulation or exceeds the permitted use, you willneed to obtain permission directly from the copyright holder. To view acopy of this licence, visit http://creativecommons.org/licenses/by/4.0/.
References
Braekevelt E, Tittlemier SA, Tomy GT (2003) Direct measurement ofoctanol-water partition coefficients of some environmentally rele-vant brominated diphenylether congeners. Chemosphere 51:563–567
Bremnes N, Kbalem H, Haug L, Thomsen C (2019) Interlaboratory com-parison on POPs in food-2019. Retrieved from https://www.fhi.no/
Chen CY, Tien CJ, SunYM, Hsieh CY, Lee CC (2013) Influence of waterquality parameters on occurrence of polybrominated diphenyl etherin sediment and sediment to biota accumulation. Chemosphere 90:2420–2427
de Boer J, Cofino WP (2002) First worldwide interlaboratory study onpolybrominated diphenyl ethers (PBDEs). Chemosphere 46:625–633
de Boer J, Wells DE (2006) Pitfalls in the analysis of brominated flameretardants in environmental, human and food samples—includingresults of three international interlaboratory studies. Trends AnalChem 25:364–372
de Boer J, Wester PG, van der Horst A, Leonards PEG (2003)Polybrominated diphenyl ethers in influents, suspended particulate
Environ Sci Pollut Res

matter, sediments, sewage treatment plant and effluents and biotafrom the Netherlands. Environ Pollut 122:63–74
Duffek A, Leonards PEG, Lepom P (2008) Interlaboratory study ondecaBDE analysis in environmental samples involving routine lab-oratories. Organohalogen Compd 70:2025-2028
EC 2002 Directive 2002/95/EC of the European Parliament and of theCouncil of 27 January 2003 on the restriction of the use of certainhazardous substances in electrical and electronic equipment. OJL37/19–23
EC 2003 Directive 2003/11/EC of the European Parliament and of theCouncil of 6 February 2003 amending for the 24th time councildirective 76/669/EEC relating to restrictions on the marketing anduse of certain dangerous substances and preparations(pentabromodiphenyl ether, octabromodiphenyl ether) OJ L42/45–46
EC 2006 Regulation (EC) No 1907/2006 of the European Parliament andof the Council of 18 December 2006 concerning the Registration,Evaluation, Authorisation and Restriction of Chemicals (REACH),establishing a European Chemical Agency. OJ L396/1-850
EC 2009Directive 2009/90/EC of 31 July 2009 paying down, pursuant toDirective 2000/60/EC of the European Parliament and of theCouncil, technical specifications for chemical analysis and monitor-ing of water status. OJ L201/36-38
EC 2011a Directive 2011/65/EU of the European Parliament and of theCouncil of 8 June 2011 on the restriction of the use of certain haz-ardous substances in electrical and electronic equipment. OJ L 174:88–110
EC 2011b Retrieved from PBDE EQS dossier: https://circabc.europa.eu/sd/d/d07ed9f5-0760-4561-b642-04bc1e4a580e/PBDE%20EQS%20dossier%202011.pdf
EC 2013 Directive 2013/39/EU of the European Parliament and of theCouncil of 12 August 2013 amending Directives 2000/60/EC and2008/105/EC as regards priority substances in the field of waterpolicy. OJ L226:1–17
EC 2014 Commission Recommendation 2014/118/EU of 3 March 2014on the monitoring of traces of brominated flame retardants in food.OJ L65/39-40
EC 2017a Regulation (EU) 2017/227 amending Annex XVII toRegulation (EC) 1907/2006 of teh European Parliament and of theC o u n c i l c o n c e r n i n g R E A C H a s r e g a r d s b i s(pentabromophenyl)ether. OJ L35/6-9
EC 2017b Regulation (EC) 2017/625 of the European Parliament and ofthe Council of 15 March 2017 on official controls and other officialactivities performed to ensure the application of food and feed law,rules on animal health and welfare, plant health and plant protectionproducts OJ L95/1-142
Eljarrat E, Barceló D (2008) Occurrence, fate, and behavior of brominat-ed flame retardants in Ebro River Basin (Spain). In: KB.Mehmetli E(ed). Springer, Dordrecht
Eljarrat E, Barceló D (2018) How do measured PBDE and HCBD levelsin river fish compare to the European Environmental QualityStandards? Environ Res 160:203–211
Eljarrat E, Labandeira A, Marsh G, Raldua D, Barceló D (2007)Decabrominated diphenyl ether in river fish and sediment samplescollected downstream an industrial park. Chemosphere 69:1278–1286
Guo Z, Zhang L, Lui X et al (2019) The enrichment and purification ofhexabromocyclododecanes and its effects on thyroid in zebrafish.Ecotoxicol Environ Saf 185:109690
HELCOM (2018) HELCOM core indicator report polybrominateddiphenyl ethers (PBDEs). Retrieved from http://www.helcom.fi
Hellar-Kihampa H (2013) Another decade of water quality assessmentstudies in Tanzania: status, challenges and future prospects. Sci TotalEnviron 447:186–197
HoffmanK, Lorenzo A, Butt CM et al (2017) Exposure to flame retardantchemicals and occurrence and severity of papillary thyroid cancer: acase-control study. Environ Int 107:235–242
Hong SH, Kannan N, Jin Y, Won JH, Han GM, Shim WJ (2010)Temporal trend, spatial distribution, and terrestrial sources ofPBDEs and PCBs in Masan Bay, Korea. Mar Pollut Bull 60:1836–1841
Lamberty A, Schimmel H, Pauwels J (1998) The study of the stability ofreference materials by isochronous measurements. Fresenius J AnalChem 360:359–361
Law RJ, Covaci A, Harrad S et al (2014) Levels and trends of PBDEs andHBCDs in the global environment: status at the end of 2012.Environ Int 65:147–158
Law RJ, Herzke D, Harrad S, Morris S, Bersuder P, Allchin CR (2008)Levels and trends of HBCD and BDEs in the European and Asianenvironments, with some information for other BFRs. Chemosphere73:223–241
Law RJ, Allchin CR, de Boer J et al (2006) Levels and trends of bromi-nated flame retardants in the European environment. Chemosphere64:187–208
Lilienthal H, Hack A, Roth-Härer A, Wichert Grande S, Talsness CE(2006) Effects of developmental exposure to 2,2′,4,4′,5-pentabromodiphenyl ether (PBDE-99) on sex steroids, sexual devel-opment, and sexually dimorphic behavior in rats. Environ HealthPerspect 114:194–201
Linsinger TPJ, Pauwels J, Lamberty A, Schimmel H, van der Veen AMH,Siekmann L (2001) Estimating the uncertainty of stability for matrixCRMs. Fresenius J Anal Chem 370:183–188
Linsinger TPJ (2019) ERM Application Note 1: comparison of a mea-surement result with the certified value. Retrieved from https://ec.europa.eu/jrc/en/reference-materials/application-notes
Lyche JL, Rosseland C, Berge G, Polder A (2015) Human health riskassociated with brominated flame-retardants (BFRs). Environ Int74:170-180
Ma X, Zhang H, Yao Z et al (2013) Bioaccumulation and trophic transferof polybrominated diphenyl ethers (PBDEs) in a marine food webfrom Liaodong Bay, North China. Mar Pollut Bull 74:110–115
Melymuk L, Goosey E, Riddell N, Diamond M (2015) Interlaboratorystudy of novel halogenated flame retardants: INTERLAB. AnalBioanal Chem 407:6759–6769
Miege C, Peretti A, Labadie P et al (2012) Occurrence of priority andemerging organic compounds in fishes from the Rhone River(France). Anal Bioanal Chem 404:2721–2735
Noyes PD, Hinton DE, Stapleton HM (2011) Accumulation anddebromination of decabromodiphenyl ether (BDE-209) in juvenilefathead minnows (Pimephales promelas) induces thyroid disruptionand liver alterations. Toxicol Sci 122(2):265–274
Okonski K, Degrendele C, Melymuk L et al (2014) Particle size distribu-tion of halogenated flame retardants and implications for atmospher-ic deposition and transport. Environ Sci Technol 48:14426–14434
Osako M, Kim YJ, Sakai S (2004) Leaching of brominated flame retar-dants in leachate landfills in Japan. Chemosphere 57:1571–1579
Peng JH, Huang CW, Weng YM, Yak HK(2007) Determination fopolybrominated diphenyl etehrs (PBDEs) in fish samples from riv-ers and estuaries in Taiwan. Chemosphere 66:1990–1997
Polder A, Müller MB, Lyche JL et al (2014) Levels and patterns ofpersistent organic pollutants (POPs) in tilapia (Oreochromis sp.)from four different lakes in Tanzania: geographical differences andimplication for human health. Sci Total Environ 488-489:252–260
Poster LD, Kucklick RJ, Schantz MM, Porter BJ, Leigh SD, Wise SA(2003) Determination of polychlorinated biphenyl congeners andchlorinated pesticides in a fish tissue standard reference material.Anal Bioanal Chem 375:223–241
Pulkrabová J, Hajslová J, Poustka J, Kazda R (2007) Fish as biomonitorsof polybrominated diphenyl ethers and hexabromocyclododecane in
Environ Sci Pollut Res

Czech aquatic ecosystems: pollution of the Elbe River basin.Environ Health Perspect 115(1):28–34
Ramu K, Isobe T, Takahashi S, Kim EY, Min BY, Web SU, Tanabe S(2010) Spatial distribution of polybrominated diphenyl ethers andhexabromocyclododecanes in sediments from coastal waters ofKorea. Chemosphere 79:713–719
Ricci M, Shegunova P, Conneely P et al (2017) CCQM-K102:polybrominated diphenyl ethers in sediment. Metrologia 54(1A):08026
RicciM, Lava R, Koleva B (2016)Matrix certified reference materials forenvironmental monitoring under the EU Water FrameworkDirective: an update. Trends Anal Chem 76:194–202
Ricci M, Vorkamp K, Magini M, Shegunova P (2019) Widening thechoice of quality assurance/quality control tools for the analysis ofbrominated flame retardants: recent examples of sediment and fishcertified reference materials. 17th International Conference onChemistry and the Environment, Thessaloniki
Rüdel H, Müller J, Nowak J, Ricking M, Klein R, Kotthoff M (2017)Hexabromocyclododecane diastereoisomers in fish and suspendedparticulate matter from selected European waters—trendmonitoringand environmental quality standards compliance. Environ Sci PollutRes 24:18048–18062
Shegunova P, Ricci M, Sejerøe-Olsen B (2017) Comparison of the per-formance of two GC methods for quantification of PBDEs in sedi-ment. Euroanalysis, Stockholm
Song W, Ford JC, Li A, Mills WJ, Buckley DR, Rockne KJ (2004)Polybrominated diphenyl ethers in the sediments of the GreatLakes. 1. Lake Superior. Environ Sci Technol 38:3286–3293
Stapleton HM, Brazil B, Holbrook RD, Mitchelmore CL, Benedict R,Konstantinov A, Potter D (2006) In vivo and in vitro debrominationof decabromodiphenyl ether (BDE-209) by juvenile rainbow troutand common carp. Environ Sci Technol 40:4653–4658
Stapleton HM, Letcher RJ, Baker JE (2004) Debromination ofpolybrominated diphenyl ether congeners BDE 99 and BDE 183in the intestinal tract of thecommoncarp (Cyprinus carpio).Environ Sci Technol 38:1054–1061
UN, Stockholm Convention http://www.pops.int. Accessed 6 Apr 2020.http://www.pops.int/TheConvention/ThePOPs/AllPOPs/tabid/2509/Default.aspx
Verhaert V, Covaci A, Bouillon S et al (2013) Baseline levels and trophictransfer of persistent organic pollutants in sediments and biota fromthe Congo River Basin (DR Congo). Environ Int 59:290–302
Viganò L, Roscioli C, Guzzella L (2011) Decabromodiphenyl ether(BDE-209) enters the food web of the river Po and is metabolicallydebrominated in resident cyprinid fishes. Sci Total Environ 409:4966–4972
VMM, Vlaamse Milieumaatschappij https://www.vmm.be . Accessed 6Apr 2020
Wang L, ZhangM, Lou Y, Ke R, ZhengM (2017) Levels and distributiono f t r i s - ( 2 , 3 - d i b r o m o p r o p y l ) i s o c y a n u r a t e a n dhexabromocyclododecanes in surface sediments from the YellowRiver Delta wetland of China. Mar Pollut Bull 114(1):577–582
Webster L, Tronczynski J, Bersuder P, Vorkamp K, Lepom P (2009)Determination of polybrominated diphenyl ethers (PBDEs) in sedi-ment and biota ICES. Techniques Marine Environ Sci 46
Wenning RJ, Martello L, Prusak-Daniel A (2011) Dioxins, PCBs, andPBDEs in aquatic organisms in environmental contaminants in biota– interpreting tissues concentrations, 2nd edn. CRC Press, BocaRaton
Xu J, Gao Z, Xian Q, Yu H, Feng J (2009) Levels and distribution ofpolybrominated diphenyl ethers (PBDEs) in the freshwater environ-ment surrounding a PBDE manufacturing plant in China. EnvironPollut 157(6):1911-1916
Yang S, Fu Q, Teng M, Yang J (2015) Polybrominated diphenyl ethers(PBDEs) in sediment and fish tissues from Lake Chaohu, centraleastern China. Arch Environ Prot 41:12–20
Yogui GT, Sericano JL (2009) Polybrominated diphenyl ether flame re-tardants in the U.S. marine environment: a review. Environ Int 35:655–666
Zegers BN, Lewis WE, Booij K, Smittenberg HR, Boer W, de Boer J,Boon JP (2003) Levels of polybrominated diphenyl ether flameretardants in sediment cores from Western Europe. Environ SciTechnol 37:3803–3807
Zhang Y, Zheng M, Wang L, Lou Y, Shi L, Ke R, Wang B (2018) Highlevel of tris-(2,3-dibromopropyl) isocyanurate (TBC) andhexabromocyclododecanes (HBCDs) in sediments from the intertid-al zone of New River Estuary—a polluted and degraded wetland.Mar Pollut Bull 130:287–292
Publisher’s note Springer Nature remains neutral with regard to jurisdic-tional claims in published maps and institutional affiliations.
Environ Sci Pollut Res
Recommended