Spectral multiplexing method for digitalsnapshot spectral imaging
Michael A. Golub,1,* Menachem Nathan,1 Amir Averbuch,2 Eitan Lavi,2
Valery A. Zheludev,2 and Alon Schclar2
1Department of Physical Electronics, Faculty of Engineering, Tel Aviv University, Ramat Aviv 69978, Israel2School of Computer Science, Faculty of Exact Sciences, Tel Aviv University, Ramat Aviv 69978, Israel
*Corresponding author: [email protected]
Received 27 October 2008; revised 5 February 2009; accepted 6 February 2009;posted 13 February 2009 (Doc. ID 103259); published 4 March 2009
We propose a spectral imaging method for piecewise “macropixel” objects, which allows a regular digitalcamera to be converted into a digital snapshot spectral imager by equipping the camera with only adisperser and a demultiplexing algorithm. The method exploits a “multiplexed spectrum” intensity pat-tern, i.e., the superposition of spectra from adjacent different image points, formed on the imagesensor of the digital camera. The spatial image resolution is restricted to a macropixel level in orderto acquire both spectral and spatial data (i.e., an entire spectral cube) in a single snapshot. Resultsof laboratory experiments with a special macropixel object image, composed of small, spatially uniformsquares, provide to our knowledge a first verification of the proposed spectral imaging method. © 2009Optical Society of America
OCIS codes: 110.4234, 300.6190, 260.2030.
1. Introduction
Spectral imaging (SI) provides a two-dimensional(2D) image of a polychromatic object or scene, sepa-rately in several bands of the spectrum [1]. Mosaicspectral filter arrays on an image sensor [2] leadto unacceptable light gathering losses and involvetechnological difficulties. The most straightforwardway to perform SI is to use a removable set of narrowbandpass filters [3] or dynamic spectral filters [4].High quality SI systems exploit “staring” or “push-broom” imagers [5]. Neither provides a “snapshot”SI mode for fast changing objects with an unpredict-able development along the time scale, where theentire spectral cube needs to be acquired simulta-neously and instantaneously in one “shot.” Snapshotspectral imagers are usually based either on non-scanning computed tomographic imaging spectro-meter (CTIS) designs [6–12] or on coded aperturespectral imager designs [13,14] and require a field
stop and additional intermediate image formationoptics.
A wide class of SI applications naturally involvesobjects with a piecewise structure composed of a setof “macropixels,” all of which have the same uniformor another repeatable local spatial intensity distribu-tion, whose wavelength spectrum varies from macro-pixel to macropixel. Examples of macropixel objectsinclude images of reticle and wafer inspection equip-ment in the semiconductor industry, digitally printedpatterns in the printing industry, and microwellarray plates [15] and biochip microarrays [16,17]in chemistry and biology.
In this paper we show that snapshot spectral ima-ging of a piecewise macropixel object may beachieved by an exchange between spatial and spec-tral resolution using a regular digital camera. Forthis purpose, the digital camera needs to be equippedwith a disperser whose entire chromatic dispersionmatches the spatial extent of a single macropixel.We show theoretically and experimentally that theentire spectral cube may be obtained by applying di-gital demultiplexing algorithms to the multiplexed
0003-6935/09/081520-07$15.00/0© 2009 Optical Society of America
1520 APPLIED OPTICS / Vol. 48, No. 8 / 10 March 2009
spectrum intensity pattern acquired in a single snap-shot. Results of laboratory experiments with amacropixel object composed of small spatially uni-form squares provide a proof of concept for our pro-posed method.
2. Nondispersed Macropixel Image
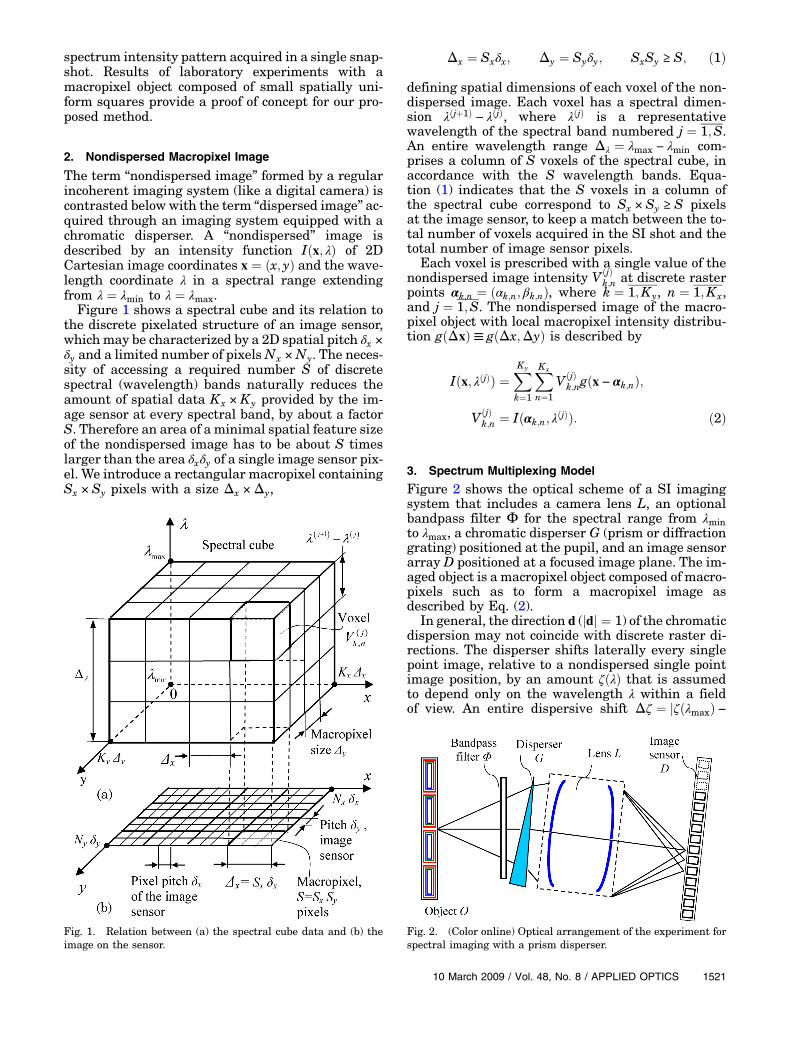
The term “nondispersed image” formed by a regularincoherent imaging system (like a digital camera) iscontrasted below with the term “dispersed image” ac-quired through an imaging system equipped with achromatic disperser. A “nondispersed” image isdescribed by an intensity function Iðx; λÞ of 2DCartesian image coordinates x ¼ ðx; yÞ and the wave-length coordinate λ in a spectral range extendingfrom λ ¼ λmin to λ ¼ λmax.Figure 1 shows a spectral cube and its relation to
the discrete pixelated structure of an image sensor,which may be characterized by a 2D spatial pitch δx ×δy and a limited number of pixelsNx ×Ny. The neces-sity of accessing a required number S of discretespectral (wavelength) bands naturally reduces theamount of spatial data Kx ×Ky provided by the im-age sensor at every spectral band, by about a factorS. Therefore an area of a minimal spatial feature sizeof the nondispersed image has to be about S timeslarger than the area δxδy of a single image sensor pix-el. We introduce a rectangular macropixel containingSx × Sy pixels with a size Δx ×Δy,
Δx ¼ Sxδx; Δy ¼ Syδy; SxSy ≥ S; ð1Þ
defining spatial dimensions of each voxel of the non-dispersed image. Each voxel has a spectral dimen-sion λðjþ1Þ − λðjÞ, where λðjÞ is a representativewavelength of the spectral band numbered j ¼ 1;S.An entire wavelength range Δλ ¼ λmax − λmin com-prises a column of S voxels of the spectral cube, inaccordance with the S wavelength bands. Equa-tion (1) indicates that the S voxels in a column ofthe spectral cube correspond to Sx × Sy ≥ S pixelsat the image sensor, to keep a match between the to-tal number of voxels acquired in the SI shot and thetotal number of image sensor pixels.
Each voxel is prescribed with a single value of thenondispersed image intensity V ðjÞ
k;n at discrete rasterpoints αk;n ¼ ðαk;n; βk;nÞ, where k ¼ 1;Ky, n ¼ 1;Kx,and j ¼ 1;S. The nondispersed image of the macro-pixel object with local macropixel intensity distribu-tion gðΔxÞ≡ gðΔx;ΔyÞ is described by
Iðx; λðjÞÞ ¼XKy
k¼1
XKx
n¼1
VðjÞk;ngðx − αk;nÞ;
VðjÞk;n ¼ Iðαk;n; λðjÞÞ: ð2Þ
3. Spectrum Multiplexing Model
Figure 2 shows the optical scheme of a SI imagingsystem that includes a camera lens L, an optionalbandpass filter Φ for the spectral range from λminto λmax, a chromatic disperser G (prism or diffractiongrating) positioned at the pupil, and an image sensorarray D positioned at a focused image plane. The im-aged object is a macropixel object composed of macro-pixels such as to form a macropixel image asdescribed by Eq. (2).
In general, the direction d (jdj ¼ 1) of the chromaticdispersion may not coincide with discrete raster di-rections. The disperser shifts laterally every singlepoint image, relative to a nondispersed single pointimage position, by an amount ζðλÞ that is assumedto depend only on the wavelength λ within a fieldof view. An entire dispersive shift Δζ ¼ jζðλmaxÞ −
Fig. 1. Relation between (a) the spectral cube data and (b) theimage on the sensor.
Fig. 2. (Color online) Optical arrangement of the experiment forspectral imaging with a prism disperser.
10 March 2009 / Vol. 48, No. 8 / APPLIED OPTICS 1521
ζðλminÞj provides a straight-line “rainbow” of a dis-persed point image.The entire dispersed polychromatic image at the
image sensor plane has a “multiplexed spectrum” in-tensity in the sense that data of different voxels arefound at several adjacent spatial locations of the im-age plane. A “monochromatic mode” image sensorproduces at a point x a signal proportional to the in-tegral of the dispersed image intensity over all wave-lengths
JðxÞ ¼Zλmax
λmun
χðλÞI½x − ζðλÞd; λ�dλ
≅XSj¼1
χðjÞI½x − ζðλðjÞÞd; λðjÞ�; ð3Þ
where ηðλÞ is a spectral response of the disperser,which in the case of a prism is just the transmittancecoefficient and in the case of a diffraction grating isthe diffraction efficiency of a performing diffractionorder, κðλÞ is the spectral sensitivity of the image sen-sor, χðλÞ ¼ κðλÞηðλÞ is the combined spectral responseof the dispersive element and the image sensor, andχðjÞ ¼ χðλðjÞÞ½λðjþ1Þ − λðjÞ� is a sampled version of χðλÞdλ.Combining Eqs. (2) and (3) yields a multiplexedspectrum image of the macropixel object
JðxÞ ¼XKy
k¼1
XKx
n¼1
XSj¼1
χðjÞV ðjÞk;ng½x − αk;n − ζðλðjÞÞd�: ð4Þ
Note that function JðxÞ of Eq. (4) may be expressedas a 2D spatial convolution J ¼ Γ ⊗ g of the localmacropixel intensity distribution gðΔxÞ and of a“multichannel spectrometer” image ΓðxÞ composedof nonoverlapping point sources δ½x − αk;n − ζðλðjÞÞd�,with intensity χðjÞVðjÞ
k;n directly providing readingsproportional to the spectral cube data V ðjÞ
k;n in appro-priately arranged spatial positions ½αk;n þ ζðλðjÞÞd�.Whereas function ΓðxÞ and spectral cube data V ðjÞ
k;nare not directly available in an experiment, an ap-proximating function Γ̂ðxÞ may be restored fromthe single snapshot JðxÞ by a “demultiplexing proce-dure” exploiting an appropriate deconvolution algo-rithm, under necessary restrictions on the signal-to-noise (SNR) ratio. This means that equipping adigital imaging system (camera) with a disperserand digital demultiplexing software indeed convertsit into a snapshot SI system for macropixel images.
4. Row-wise Multiplexing and DemultiplexingProcedure
In a “row-wise” case in which the disperser’s direc-tion d of the chromatic dispersion coincides with axisx at the image sensor plane, macropixels extend onlyin a row direction, and there is no interaction be-
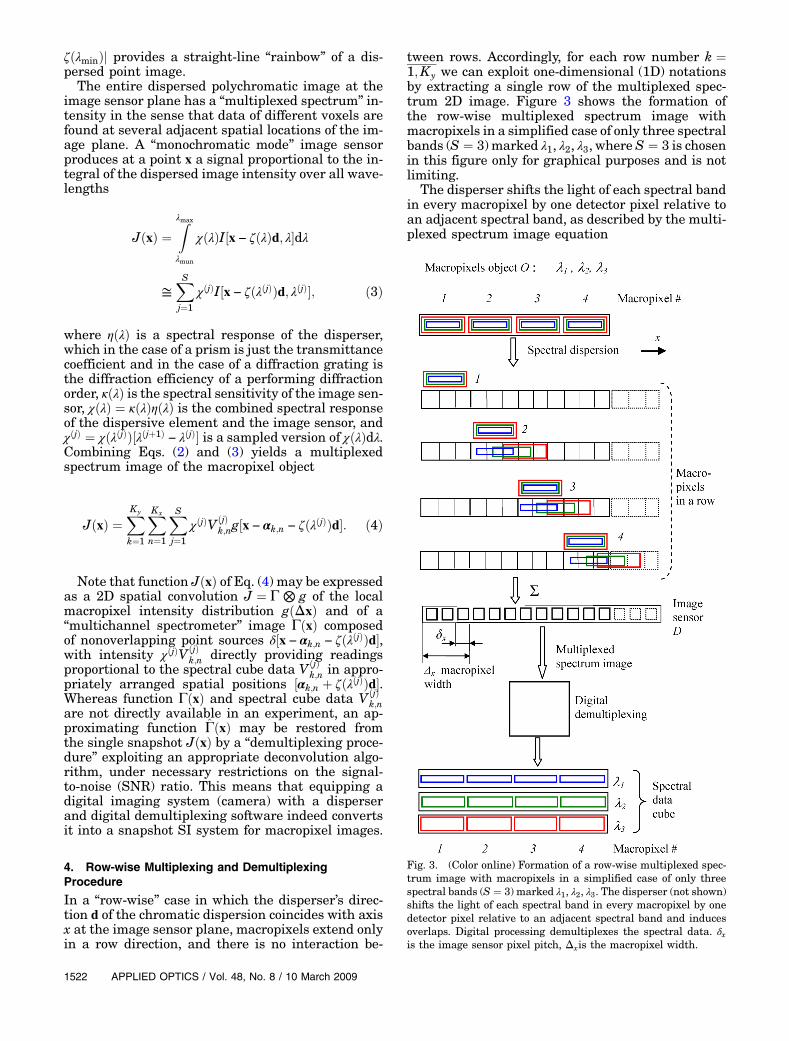
tween rows. Accordingly, for each row number k ¼1;Ky we can exploit one-dimensional (1D) notationsby extracting a single row of the multiplexed spec-trum 2D image. Figure 3 shows the formation ofthe row-wise multiplexed spectrum image withmacropixels in a simplified case of only three spectralbands (S ¼ 3) marked λ1, λ2, λ3, where S ¼ 3 is chosenin this figure only for graphical purposes and is notlimiting.
The disperser shifts the light of each spectral bandin every macropixel by one detector pixel relative toan adjacent spectral band, as described by the multi-plexed spectrum image equation
Fig. 3. (Color online) Formation of a row-wise multiplexed spec-trum image with macropixels in a simplified case of only threespectral bands (S ¼ 3) marked λ1, λ2, λ3. The disperser (not shown)shifts the light of each spectral band in every macropixel by onedetector pixel relative to an adjacent spectral band and inducesoverlaps. Digital processing demultiplexes the spectral data. δxis the image sensor pixel pitch, Δxis the macropixel width.
1522 APPLIED OPTICS / Vol. 48, No. 8 / 10 March 2009
JðxÞ ¼XKx
n¼1
XSj¼1
χðjÞV ðjÞk;ngfx − ½j1 þ Sxðn − 1Þ þ j�δxg;
ð5Þ
which may be derived from Eq. (4) with
αn ¼ ½Sxðn − 1Þ þ 1�δx; ζðλðjÞÞ ¼ ½j1 þ ðj − 1Þ�δx;ð6Þ
where j1 defines a dispersive image shift j1δx at thefirst wavelength λð1Þ. The spectral shift described inEq. (5) is similar to that considered in CTIS [9], butthe local macropixel intensity distribution gðΔxÞ isspecific to our method.The index Sxðn − 1Þ þ j in Eq. (5) provides a linear
ordering for successive spectra macropixels
ΓSxðn−1Þþj ¼ χðjÞVðjÞk;n; n ¼ 1;Kx;
j ¼ 1;S; k ¼ 1;Ky; ð7Þ
such that each spectrum occupies the spatial extentof its macropixel. The entire dispersive shift of Δζ ¼Sδx must not exceed the macropixel dimensionΔx ¼ Sxδx, to avoid macropixel spectra overlaps.An optimal match is S ¼ Sx, which makes the num-ber of image sensor pixels within a macropixel equalto the number of wavelength ranges that need to beresolved in SI, and which leads to Nx ¼ ðKx þ 1ÞS.Equation (5) indicates that pixels Jm and gΔm ofJðxÞ and gðΔxÞ are related by a discrete aperiodic1D convolution
Jm ¼XKx Sx
~m¼1
gm− ~mΓ ~m; m ¼ 1;Nx; k ¼ 1;Ky;
ð8Þ
with a narrow kernel gΔm extending by S ≪ Nxpixels.The proposed digital demultiplexing procedure
consists of two main stages, repeatedly applied toeach row k of the multiplexed spectrum imagefJmg. First we restore fΓ̂mg from fJmg of Eq. (8) usinga 1D deconvolution algorithm accounting for the ef-fects of noise, for example, the Lucy–Richardson algo-rithm [18,19]. Then, the spectral cube voxels fVðjÞ
k;ngare calculated by sorting and normalization as
VðjÞk;n ¼ Γ̂Sxðn−1Þþj
χðjÞ; k ¼ 1;Ky;
n ¼ 1;Kx; j ¼ 1;S: ð9Þ
Note that each single value VðjÞk;n participates about S
times in the Sx equations for the image sensor pixels.We consider this amain reason for the single snapshotimage being sufficient for acquiring the entire spec-
tral cube in our method, whereas other methods[6,12] require several images.
The proposed spectral multiplexing method of SI isrestricted to macropixel objects such that macropixelsizes are properly matched to the dispersion and im-age magnification by a right design of the spectralimaging device, i.e., by adapting the prism, zoomof the camera, and distances for an application.There are important applications where a need forsuch adaptation is not restricting. For example, mi-croarray plates used in enzyme-linked immunosor-bent assay (ELISA) tests [15], DNA chips, andbiochips with spotted microarrays [16,17] have onlya few standard pitches but definitely provide a verywide class of macropixel objects in chemical andbiological applications. Their optical reading canbe easily adapted to snapshot spectral imaging asdescribed here.
5. Experimental Results
Spectral imaging experiments were performedwith macropixel objects created on a LCD monitorand composed of 24 × 19 small colored squares withspatially uniform intensities within each square. Wetargeted S ¼ 32 spectral bands for each macropixel.
The optical arrangement of the experiment, shownschematically in Fig. 2, included a commercial CanonEOS 30D digital camera equipped with a standardlens having a focal length of 18–55mm and a stan-dard 11°220 wedge BK7 prism disperser positionedat a 1:9m distance from the object. The prism disper-sion in the visible spectrum range was chosen tomatch a macropixel width of Sx ¼ 32 image sensorpixels and to follow the direction of rows at the digitalimage. All experiments included spectral imaging ofthe objects, extraction of a 1D intensity array by ver-tical averaging of several strings within each of the19 rows, digital data demultiplexing as describedabove, and subsequent comparison of the resultswith reference data. The latter was obtained from ad-ditional multiple-point slitlike objects that had thincolored vertical lines spaced at the same pitch as thatof the macropixels so as to exclude any overlap of thespectrum from different slits. Therefore, the spectralimaging arrangement of Fig. 2, in a case of a slitlikeobject, served as a simple multichannel prism spec-trometer, which provided direct measurements of aspectrum in a number of channels equal to the num-ber of macropixels in the object.
The Canon EOS 30D digital cameras have goodsignal-to-noise characteristics and offer a mono-chrome black-and-white (B/W) mode that was usedto collect the data in our experiments. As the camerapixels have red-green-blue (RGB) spectral filters andthe algorithm of conversion from RGB to B/W is notknown, we performed a direct measurement of theB/W mode image intensity depending on the object’sintensity level. For that, we considered additional ca-libration patterns composed of 18 vertically arrangedrectangles of about macropixel size having differentlevels of intensity, as seen on the left-hand side of
10 March 2009 / Vol. 48, No. 8 / APPLIED OPTICS 1523
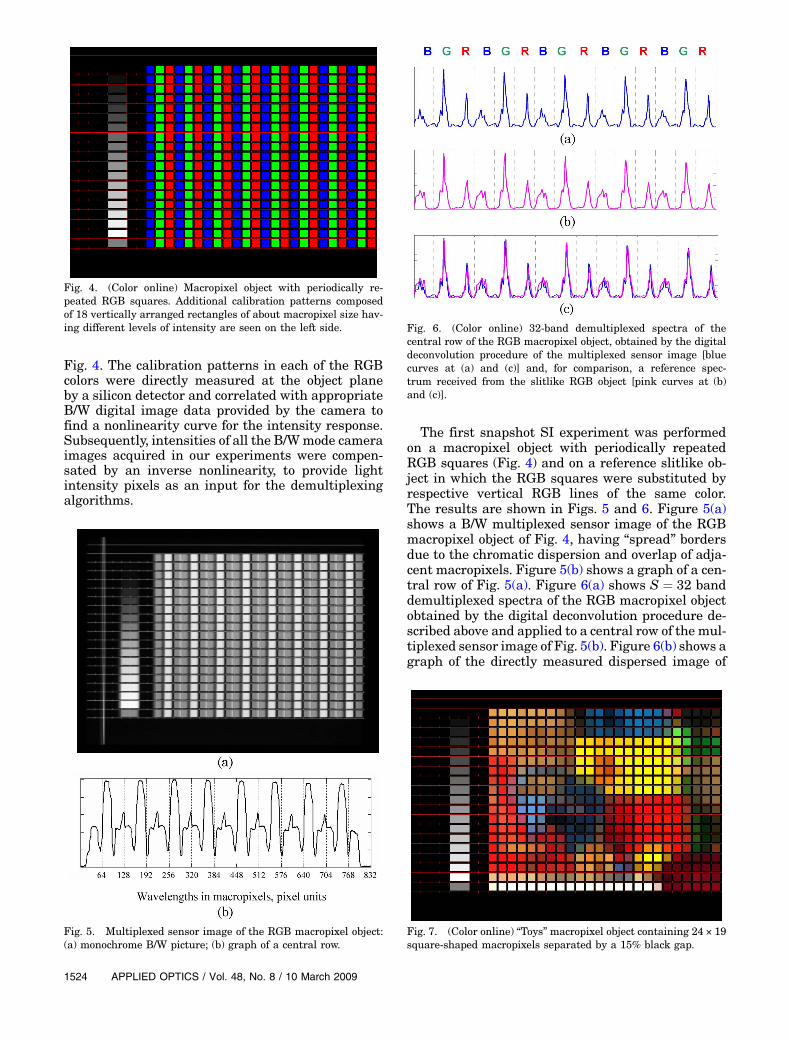
Fig. 4. The calibration patterns in each of the RGBcolors were directly measured at the object planeby a silicon detector and correlated with appropriateB/W digital image data provided by the camera tofind a nonlinearity curve for the intensity response.Subsequently, intensities of all the B/Wmode cameraimages acquired in our experiments were compen-sated by an inverse nonlinearity, to provide lightintensity pixels as an input for the demultiplexingalgorithms.
The first snapshot SI experiment was performedon a macropixel object with periodically repeatedRGB squares (Fig. 4) and on a reference slitlike ob-ject in which the RGB squares were substituted byrespective vertical RGB lines of the same color.The results are shown in Figs. 5 and 6. Figure 5(a)shows a B/W multiplexed sensor image of the RGBmacropixel object of Fig. 4, having “spread” bordersdue to the chromatic dispersion and overlap of adja-cent macropixels. Figure 5(b) shows a graph of a cen-tral row of Fig. 5(a). Figure 6(a) shows S ¼ 32 banddemultiplexed spectra of the RGB macropixel objectobtained by the digital deconvolution procedure de-scribed above and applied to a central row of the mul-tiplexed sensor image of Fig. 5(b). Figure 6(b) shows agraph of the directly measured dispersed image of
Fig. 4. (Color online) Macropixel object with periodically re-peated RGB squares. Additional calibration patterns composedof 18 vertically arranged rectangles of about macropixel size hav-ing different levels of intensity are seen on the left side.
Fig. 5. Multiplexed sensor image of the RGB macropixel object:(a) monochrome B/W picture; (b) graph of a central row.
Fig. 6. (Color online) 32-band demultiplexed spectra of thecentral row of the RGB macropixel object, obtained by the digitaldeconvolution procedure of the multiplexed sensor image [bluecurves at (a) and (c)] and, for comparison, a reference spec-trum received from the slitlike RGB object [pink curves at (b)and (c)].
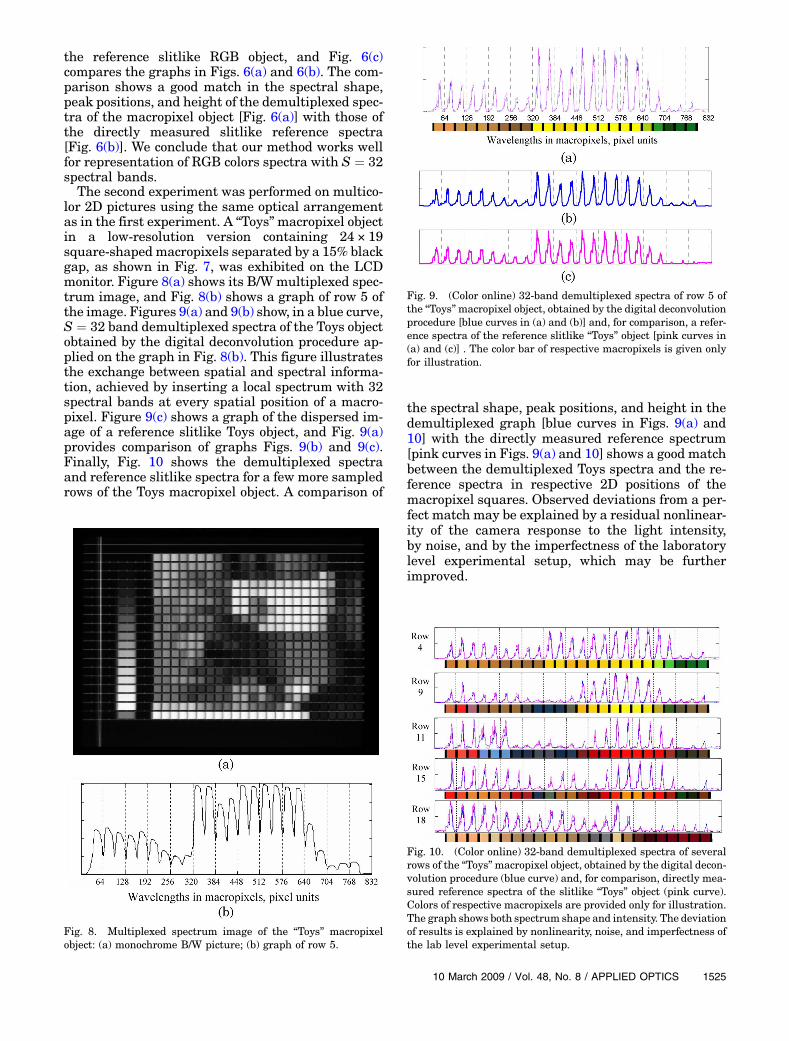
Fig. 7. (Color online) “Toys” macropixel object containing 24 × 19square-shaped macropixels separated by a 15% black gap.
1524 APPLIED OPTICS / Vol. 48, No. 8 / 10 March 2009
the reference slitlike RGB object, and Fig. 6(c)compares the graphs in Figs. 6(a) and 6(b). The com-parison shows a good match in the spectral shape,peak positions, and height of the demultiplexed spec-tra of the macropixel object [Fig. 6(a)] with those ofthe directly measured slitlike reference spectra[Fig. 6(b)]. We conclude that our method works wellfor representation of RGB colors spectra with S ¼ 32spectral bands.The second experiment was performed on multico-
lor 2D pictures using the same optical arrangementas in the first experiment. A “Toys”macropixel objectin a low-resolution version containing 24 × 19square-shaped macropixels separated by a 15% blackgap, as shown in Fig. 7, was exhibited on the LCDmonitor. Figure 8(a) shows its B/W multiplexed spec-trum image, and Fig. 8(b) shows a graph of row 5 ofthe image. Figures 9(a) and 9(b) show, in a blue curve,S ¼ 32 band demultiplexed spectra of the Toys objectobtained by the digital deconvolution procedure ap-plied on the graph in Fig. 8(b). This figure illustratesthe exchange between spatial and spectral informa-tion, achieved by inserting a local spectrum with 32spectral bands at every spatial position of a macro-pixel. Figure 9(c) shows a graph of the dispersed im-age of a reference slitlike Toys object, and Fig. 9(a)provides comparison of graphs Figs. 9(b) and 9(c).Finally, Fig. 10 shows the demultiplexed spectraand reference slitlike spectra for a few more sampledrows of the Toys macropixel object. A comparison of
the spectral shape, peak positions, and height in thedemultiplexed graph [blue curves in Figs. 9(a) and10] with the directly measured reference spectrum[pink curves in Figs. 9(a) and 10] shows a good matchbetween the demultiplexed Toys spectra and the re-ference spectra in respective 2D positions of themacropixel squares. Observed deviations from a per-fect match may be explained by a residual nonlinear-ity of the camera response to the light intensity,by noise, and by the imperfectness of the laboratorylevel experimental setup, which may be furtherimproved.
Fig. 8. Multiplexed spectrum image of the “Toys” macropixelobject: (a) monochrome B/W picture; (b) graph of row 5.
Fig. 9. (Color online) 32-band demultiplexed spectra of row 5 ofthe “Toys”macropixel object, obtained by the digital deconvolutionprocedure [blue curves in (a) and (b)] and, for comparison, a refer-ence spectra of the reference slitlike “Toys” object [pink curves in(a) and (c)] . The color bar of respective macropixels is given onlyfor illustration.
Fig. 10. (Color online) 32-band demultiplexed spectra of severalrows of the “Toys”macropixel object, obtained by the digital decon-volution procedure (blue curve) and, for comparison, directly mea-sured reference spectra of the slitlike “Toys” object (pink curve).Colors of respective macropixels are provided only for illustration.The graph shows both spectrum shape and intensity. The deviationof results is explained by nonlinearity, noise, and imperfectness ofthe lab level experimental setup.
10 March 2009 / Vol. 48, No. 8 / APPLIED OPTICS 1525
6. Conclusions and Discussion
The spectrum multiplexing SI method proposed inthis paper permits the conversion of a digital camerainto a snapshot spectral imager by adding a disperserat the pupil of the imaging lens and by using appro-priate data-demultiplexing algorithms. The methodis applicable for objects that have a macropixel struc-ture composed of small rectangles with an identicallocal spatial intensity distribution in every rectangle.The size of the macropixel is correlated with the com-promise between the image spatial resolution and thenumber of spectral bands used in the spectral ima-ging. The lateral dispersive power of the disperserneeds to match the macropixel size.We would like to note that, in addition to multi-
plexing spectra on an image sensor and demultiplex-ing the result to recover a spectral image, our methodhas the following features that distinguish it fromother SI methods.
a. The multiplexing is regular, with no aperturecoding or randomization involved.b. Our method does not require several projec-
tions of the spectral cube, field stop, or image relay,but directly exchanges spectral and spatial reso-lution.c. The multiplexing corresponds to the macro-
pixel structure of the image.d. The multiplexing is done optically just by a
disperser, and demultiplexing is done digitally.e. The dispersion range needs to fit the size of the
macropixel and image magnification.f. The multiplexing and demultiplexing “pair”
are carefully selected.g. The resulting spectra are naturally arranged
in a sequence matching exact positions of respectivemacropixels, so demultiplexing is contributed by op-tics, not only by digital processing.h. The method works and provided 32 bands in a
real experiment.
Our snapshot SI method is not limited to a parti-cular region of the radiation spectrum but is applic-able to any part of the spectrum that can be sensedwith image sensor arrays, in particular the entirespectrum from the deep UV to the far IR. The ab-sence of a slit provides increased light gathering ef-ficiency, a very important advantage. Anotherimportant advantage is that the method does not re-quire any moving or dynamic optical elements suchas a rotating prism, filters scanning arrangements,or relay optics that inherently increase the size ofan imager and restrict its speed. Consequently, SIsystems based on this method are expected to benaturally amenable to miniaturization and low costproduction for relevant applications.
The authors acknowledge Gershon Belitsky forsupport in carrying out the experiments.
References
1. Y. Garini, I. T. Young, and G. McNamara, “Spectral imaging:principles and applications,” Cytometry A 69, 735–747(2006).
2. M. Brown, Advanced Digital Photography (Media Publishing,2004).
3. R. L. Long, K. B. Walsh, and C. V. Greensill, “Sugar “imaging”of fruit using a low cost charge-coupled device camera,” J.Near Infrared Spectrosc. 13, 177–186 (2005).
4. M. A. López-Álvarez, J. Hernández-Andrés, and J. Romero,“Developing an optimum computer-designed multispectralsystem comprising a monochrome CCD camera and aliquid-crystal tunable filter,” Appl. Opt. 47, 4381–4390 (2008).
5. M. F. Carlsohn, “Spectral image processing in real-time,” J.Real Time Image Process. 1, 25–32 (2006).
6. M. Descour and E. L. Dereniak, “Computed-tomographyimaging spectrometer: experimental calibration and recon-struction results,” Appl. Opt. 34, 4817–4826 (1995).
7. M. R. Descour, C. E. Volin, E. L. Dereniak, K. J. Thome, A. B.Schumacher, D.W.Wilson, and P. D.Maker, “Demonstration ofa high-speed nonscanning imaging spectrometer,” Opt. Lett.22, 1271–1273 (1997).
8. N. Hagen and E. L. Dereniak, “Analysis of computedtomographic imaging spectrometers. I. Spatial and spectralresolution,” Appl. Opt. 47, F85–F95 (2008).
9. W. R. Johnson, D. W. Wilson, and G. Bearman, “Spatial spec-tral modulating snapshot hyperspectral imager,” Appl. Opt.45, 1898–1908 (2006).
10. J. Hartke and E. L. Dereniak, “Snapshot dual-band visiblehyperspectral imaging spectrometer,” Opt. Eng. 46,013201 (2007).
11. W. R. Johnson, D. W. Wilson, and W. Fink, “Snapshot hyper-spectral imaging in ophthalmology,” J. Biomed. Opt. 12,0140361 (2007).
12. J. M. Mooney, V. E. Vickers, M. An, and A. K. Brodzik, “High-throughput hyperspectral infrared camera,” J. Opt. Soc. Am. A14, 2951–2961 (1997).
13. M. E. Gehm, R. John, R. Willett, T. Schultz, and D. Brady,“Single-shot compressive spectral imaging with a dual disper-ser architecture,” Opt. Express 15, 14013–14027 (2007).
14. A. Wagadarikar, R. John, R. Willett, and D. Brady, “Single dis-perser design for coded aperture snapshot spectral imaging,”Appl. Opt. 47, B44–B51 (2008).
15. D. Filippini, K. Tejle, and I. Lundstrom, “ELISA test for anti-neutrophil cytoplasm antibodies detection evaluated by acomputer screen photo-assisted technique,” Biosens. Bioelec-tron. 21, 266–272 (2005).
16. H. Zhu, J. F. Klemic, S. Chang, P. Bertone, A. Casamayor, K. G.Klemic, D. Smith, M. Gerstein, M. A. Reed, and M. Snyder,“Analysis of yeast protein kinases using protein chips,” Nat.Genet. 26, 283–289 (2000).
17. P. O. Brown, “The full yeast genome on a chip,” http://cmgm.stanford.edu/pbrown/yeastchip.html.
18. W. H. Richardson, “Bayesian-based iterative method of imagerestoration,” J. Opt. Soc. Am. 62, 55–59 (1972).
19. L. B. Lucy, “An iterative technique for the rectification ofobserved distributions,” Astron. J. 79, 745–754 (1974).
1526 APPLIED OPTICS / Vol. 48, No. 8 / 10 March 2009
Recommended