
Solutions for Biopharmaceuticals Analysis
C10G-E039
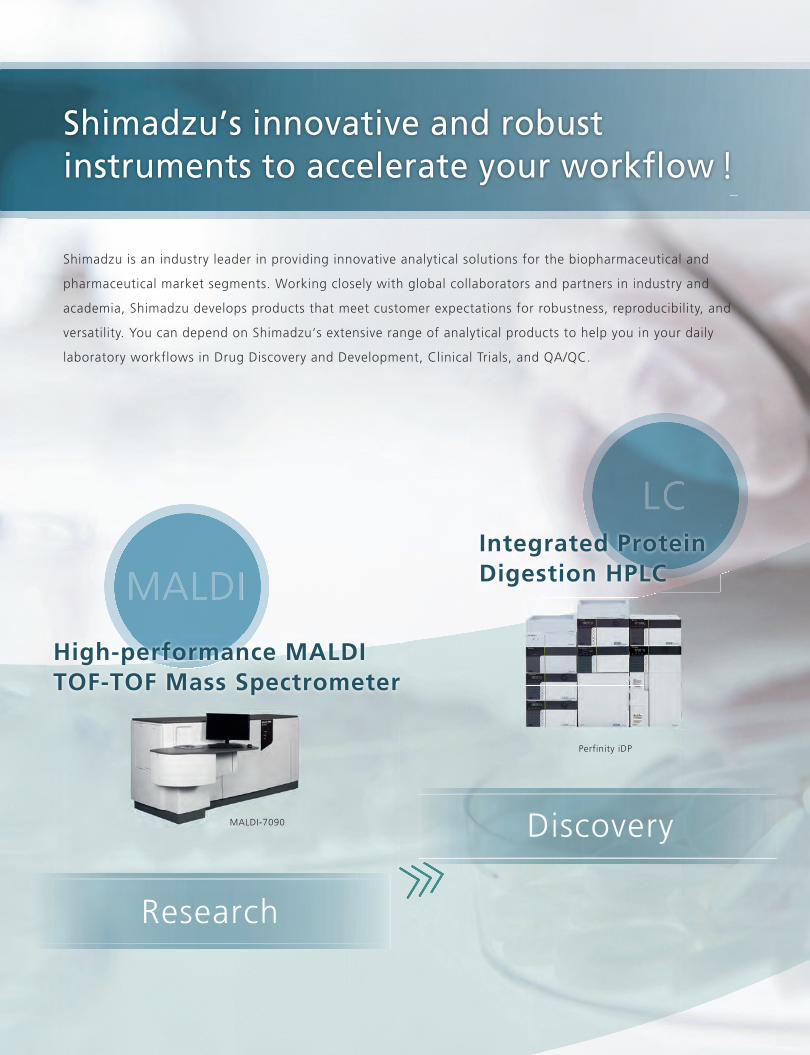
Shimadzu’s innovative and robust instruments to accelerate your workflow !
Discovery
Perfinity iDP
Integrated Protein Digestion HPLC
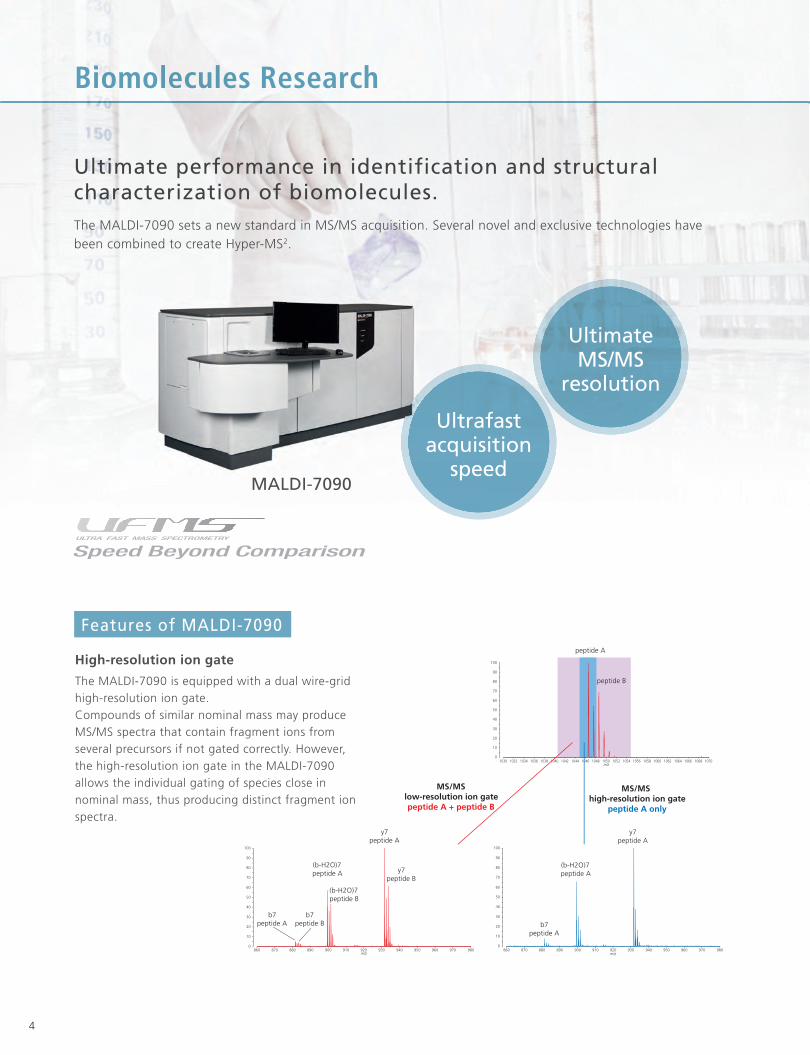
MALDI-7090
High-performance MALDI TOF-TOF Mass Spectrometer
Research
Shimadzu is an industry leader in providing innovative analytical solutions for the biopharmaceutical and
pharmaceutical market segments. Working closely with global collaborators and partners in industry and
academia, Shimadzu develops products that meet customer expectations for robustness, reproducibility, and
versatility. You can depend on Shimadzu‘s extensive range of analytical products to help you in your daily
laboratory workflows in Drug Discovery and Development, Clinical Trials, and QA/QC.
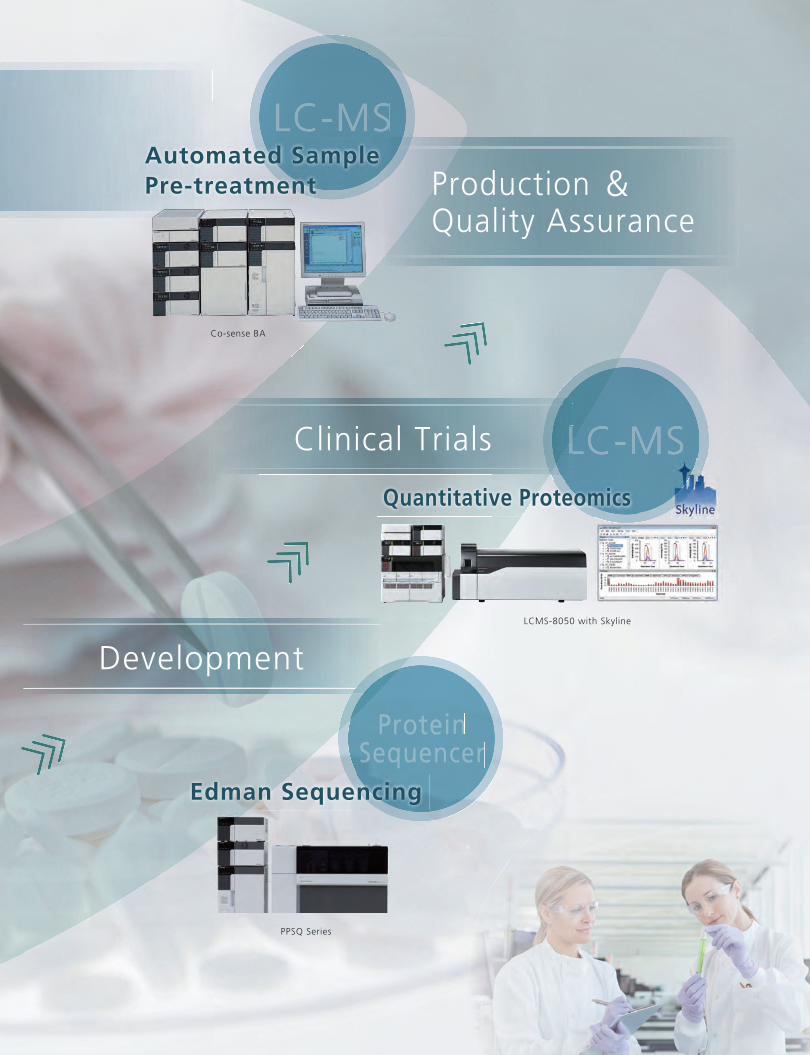
Development
Clinical Trials
Production &Quality Assurance
Quantitative Proteomics
LCMS-8050 with Skyline
Co-sense BA
Automated SamplePre-treatment
ProteinSSSSSSequencer
Edman Sequencing
PPSQ Series
4
The MALDI-7090 sets a new standard in MS/MS acquisition. Several novel and exclusive technologies have been combined to create Hyper-MS2.
The MALDI-7090 is equipped with a dual wire-grid high-resolution ion gate.Compounds of similar nominal mass may produce MS/MS spectra that contain fragment ions from several precursors if not gated correctly. However, the high-resolution ion gate in the MALDI-7090 allows the individual gating of species close in nominal mass, thus producing distinct fragment ion spectra.
High-resolution ion gate
Ultimate performance in identification and structural characterization of biomolecules.
0
10
20
30
40
50
60
70
80
90
100
m/z860 870 880 890 900 910 920 930 940 950 960 970 980
0
10
20
30
40
50
60
70
80
90
100
m/z860 870 880 890 900 910 920 930 940 950 960 970 980
0
10
20
30
40
50
60
70
80
90
100
m/z1030 1032 1034 1036 1038 1040 1042 1044 1046 1048 1050 1052 1054 1056 1058 1060 1062 1064 1066 1068 1070
MS/MSlow-resolution ion gatepeptide A + peptide B
MS/MS high-resolution ion gate
peptide A only
y7 peptide A
(b-H2O)7 peptide A
b7 peptide A
y7 peptide A
(b-H2O)7 peptide A
b7 peptide A
y7 peptide B
(b-H2O)7 peptide B
b7 peptide B
peptide A
peptide B
Features of MALDI-7090
Ultrafastacquisition
speedMALDI-7090
UltimateMS/MS
resolution
Biiioooomolleeecules Research
5
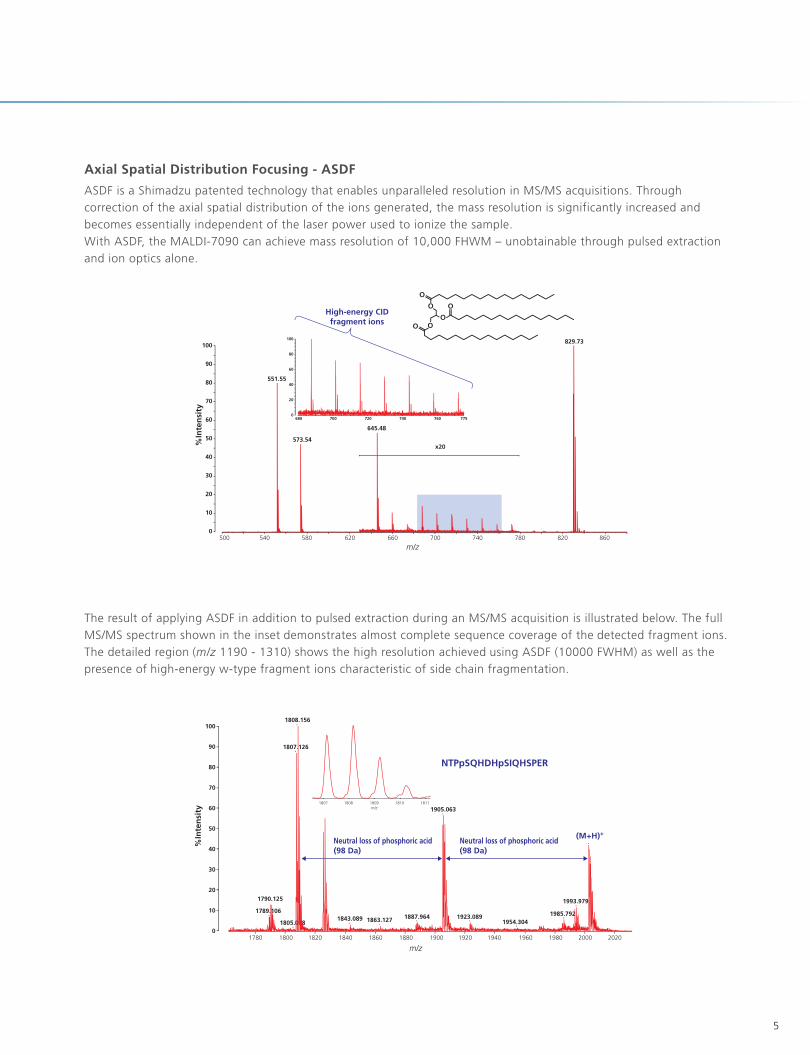
The result of applying ASDF in addition to pulsed extraction during an MS/MS acquisition is illustrated below. The full MS/MS spectrum shown in the inset demonstrates almost complete sequence coverage of the detected fragment ions. The detailed region (m/z 1190 - 1310) shows the high resolution achieved using ASDF (10000 FWHM) as well as the presence of high-energy w-type fragment ions characteristic of side chain fragmentation.
551.55
573.54
645.48
829.73
x20
100
80
60
40
20
0680 700 720 740 760 775
O
O
OOO
O
%In
ten
sity
100
90
80
70
60
50
40
30
20
10
0500 540 580 620 660 700 740 780 820 860
m/z
High-energy CIDfragment ions
1807 1808 1809m/z
1810 1811
NTPpSQHDHpSIQHSPER
(M+H)+Neutral loss of phosphoric acid
1780 1800 1820 1840 1860 1880 1900 1920 1940 1960 1980 2000 2020
m/z
%In
ten
sity
100
90
80
70
60
50
40
30
20
10
0
1808.156
1807.126
1905.063
1790.125
1789.106
1805.0081843.089 1863.127 1887.964 1923.089
1954.304
1993.979
1985.792
(98 Da)Neutral loss of phosphoric acid(98 Da)
ASDF is a Shimadzu patented technology that enables unparalleled resolution in MS/MS acquisitions. Through correction of the axial spatial distribution of the ions generated, the mass resolution is significantly increased and becomes essentially independent of the laser power used to ionize the sample.With ASDF, the MALDI-7090 can achieve mass resolution of 10,000 FHWM – unobtainable through pulsed extraction and ion optics alone.
Axial Spatial Distribution Focusing - ASDF
6
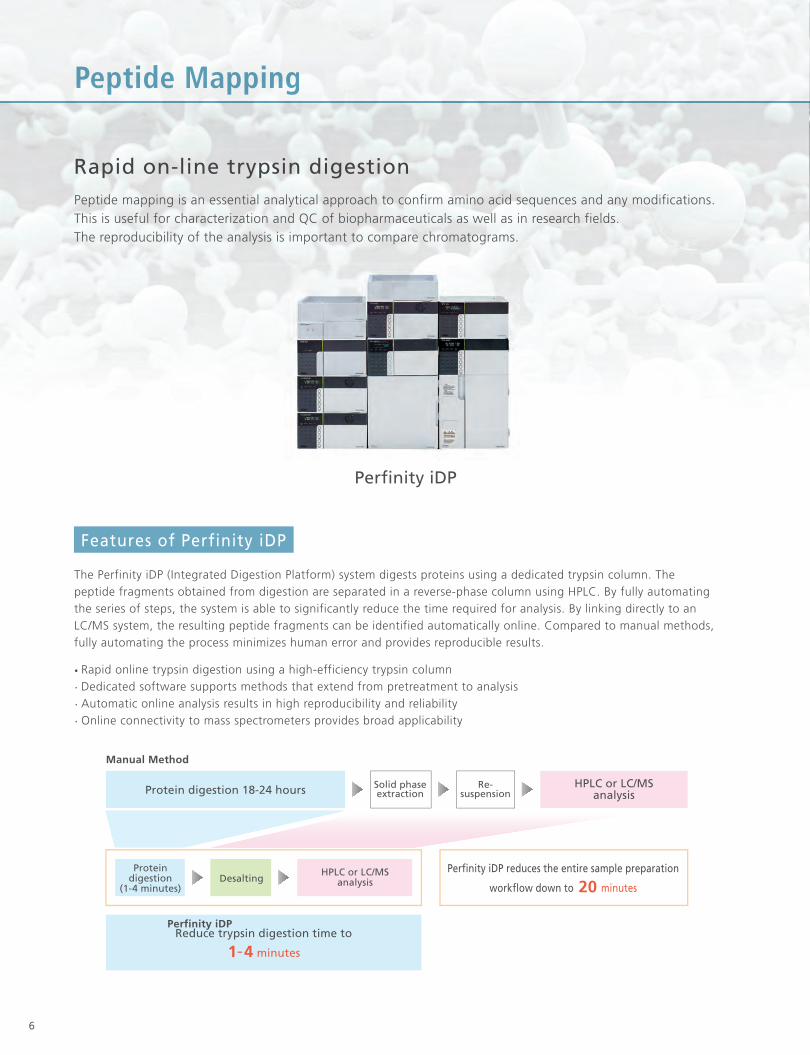
The Perfinity iDP (Integrated Digestion Platform) system digests proteins using a dedicated trypsin column. The peptide fragments obtained from digestion are separated in a reverse-phase column using HPLC. By fully automating the series of steps, the system is able to significantly reduce the time required for analysis. By linking directly to an LC/MS system, the resulting peptide fragments can be identified automatically online. Compared to manual methods, fully automating the process minimizes human error and provides reproducible results.
·· Rapid online trypsin digestion using a high-efficiency trypsin column· Dedicated software supports methods that extend from pretreatment to analysis· Automatic online analysis results in high reproducibility and reliability· Online connectivity to mass spectrometers provides broad applicability
Perfinity iDP
Manual Method
Protein digestion 18-24 hours HPLC or LC/MSanalysis
Solid phaseextraction
Re-suspension
HPLC or LC/MSanalysisDesalting
Proteindigestion
(1-4 minutes)
Perfinity iDP reduces the entire sample preparation
workflow down to minutes20
Reduce trypsin digestion time to
minutes1-4
Perfinity iDP
PPeeppttiiddee MMaappppiinngg
Peptide mapping is an essential analytical approach to confirm amino acid sequences and any modifications. This is useful for characterization and QC of biopharmaceuticals as well as in research fields.The reproducibility of the analysis is important to compare chromatograms.
Rapid on-line trypsin digestion
Features of Perfinity iDP
7
·
·
·
·
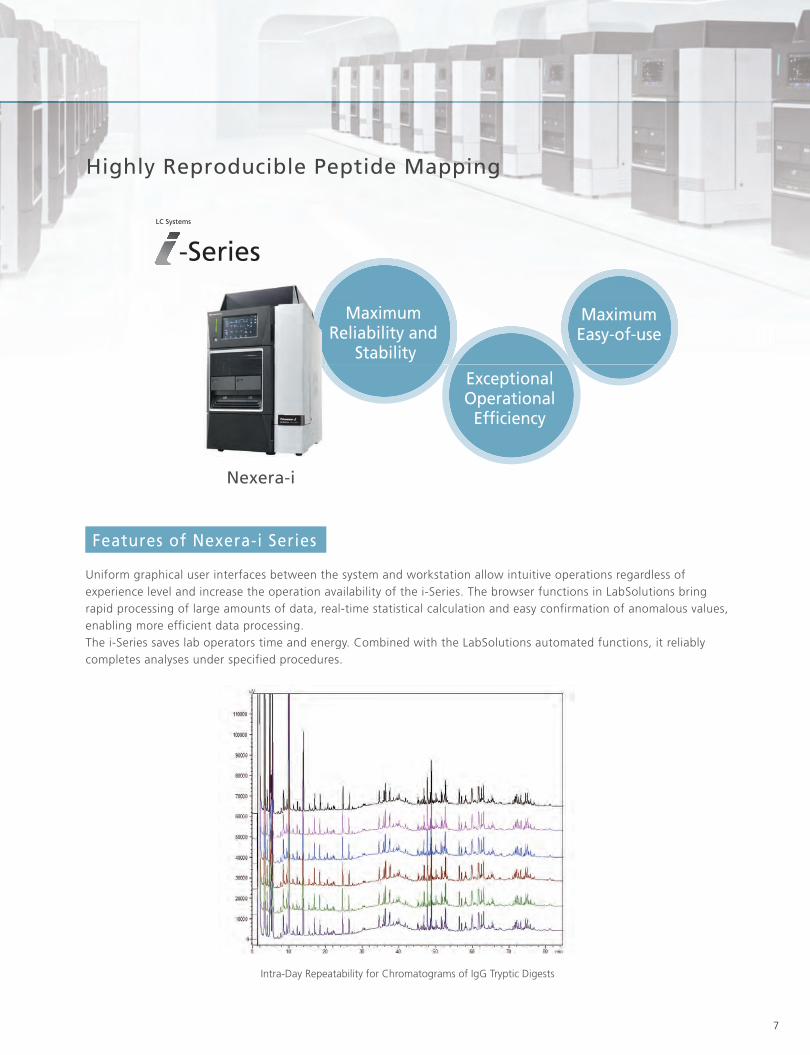
Highly Reproducible Peptide Mapping
LC Systems
Maximum Reliability and
Stability
ExceptionalOperational
Efficiency
MaximumEasy-of-use
Nexera-i
Uniform graphical user interfaces between the system and workstation allow intuitive operations regardless of experience level and increase the operation availability of the i-Series. The browser functions in LabSolutions bring rapid processing of large amounts of data, real-time statistical calculation and easy confirmation of anomalous values, enabling more efficient data processing.The i-Series saves lab operators time and energy. Combined with the LabSolutions automated functions, it reliably completes analyses under specified procedures.
Features of Nexera-i Series
Intra-Day Repeatability for Chromatograms of IgG Tryptic Digests
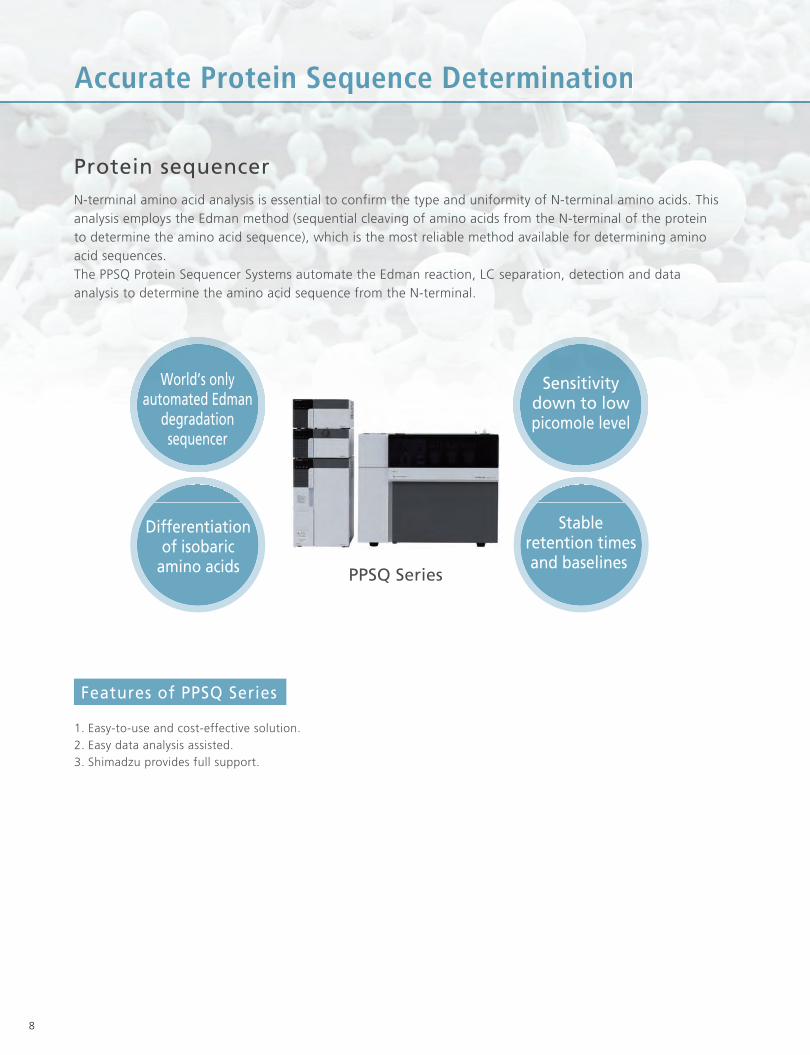
Sensitivitydown to lowpicomole level
World’s onlyautomated Edman
degradationsequencer
Stableretention timesand baselines
Differentiationof isobaric
amino acids PPSQ Series
AAccccuurraattee PProoteeiinn SSeeqquueennccee DDeetteermiinnaattiioonn
N-terminal amino acid analysis is essential to confirm the type and uniformity of N-terminal amino acids. This analysis employs the Edman method (sequential cleaving of amino acids from the N-terminal of the protein to determine the amino acid sequence), which is the most reliable method available for determining amino acid sequences.The PPSQ Protein Sequencer Systems automate the Edman reaction, LC separation, detection and data analysis to determine the amino acid sequence from the N-terminal.
Protein sequencer
8
1. Easy-to-use and cost-effective solution. 2. Easy data analysis assisted. 3. Shimadzu provides full support.
Features of PPSQ Series
Thr (cycle 5)
Leu (cycle 2)
Met (cycle 4)
Val (cycle 3)
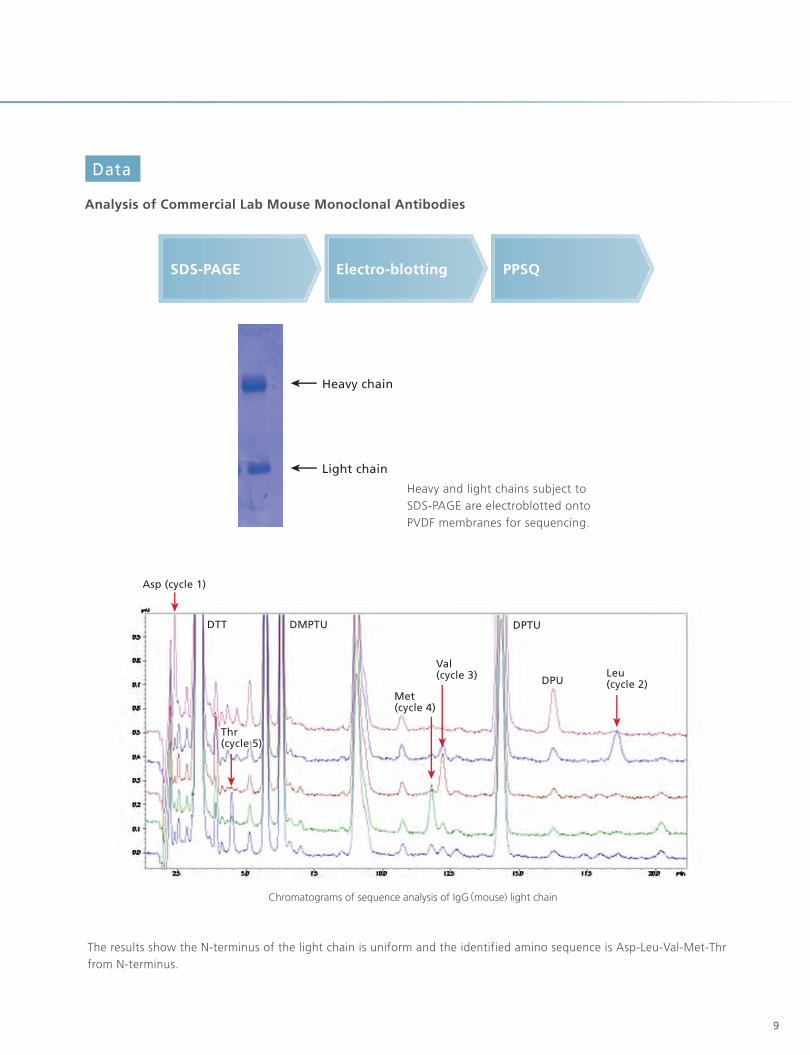
Chromatograms of sequence analysis of IgG(mouse) light chain
9
The results show the N-terminus of the light chain is uniform and the identified amino sequence is Asp-Leu-Val-Met-Thr from N-terminus.
Data
Analysis of Commercial Lab Mouse Monoclonal Antibodies
Heavy chain
SDS-PAGE Electro-blotting PPSQ
Light chain
Asp (cycle 1)
Thr (cycle 5)Thr (cycle 5)
DTT DMPTU
DPU
DPTU
Leu (cycle 2)Leu (cycle 2)
Met (cycle 4)Met (cycle 4)
Val (cycle 3)Val (cycle 3)
Heavy and light chains subject to SDS-PAGE are electroblotted onto PVDF membranes for sequencing.
10
Combinationwith
SkylineUltrafast
MRM
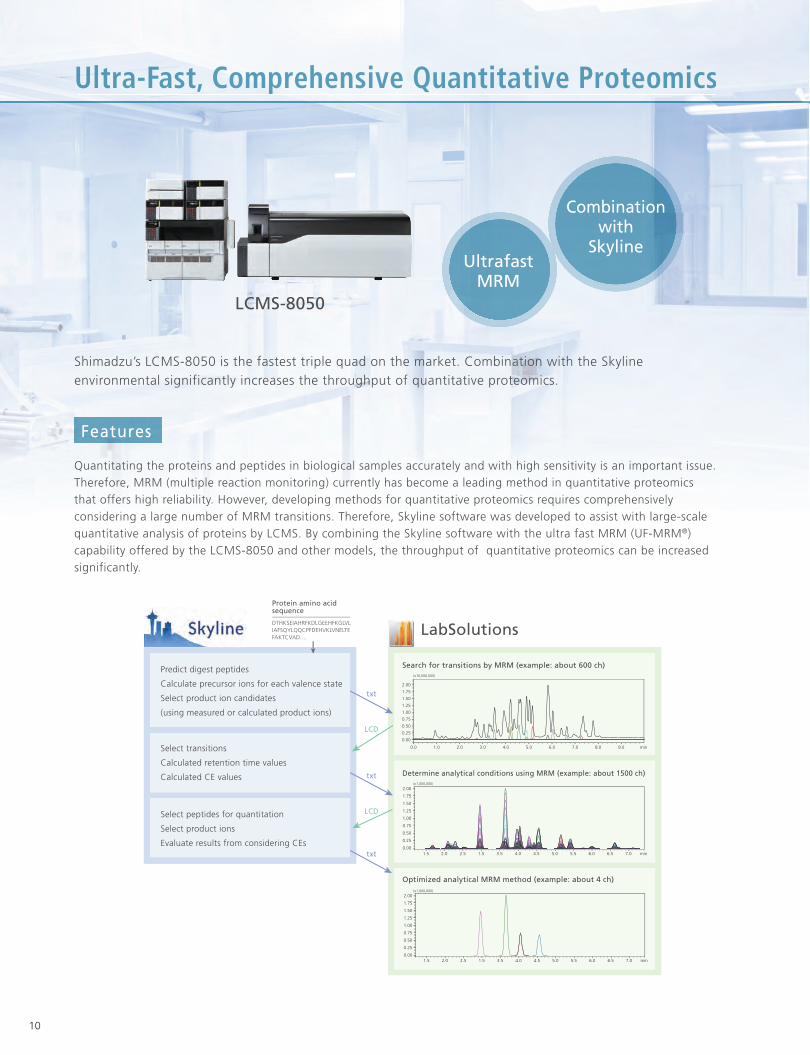
Shimadzu’s LCMS-8050 is the fastest triple quad on the market. Combination with the Skyline environmental significantly increases the throughput of quantitative proteomics.
LCMS-8050
Predict digest peptides
Calculate precursor ions for each valence state
Select product ion candidates
(using measured or calculated product ions)
Select transitions
Calculated retention time values
Calculated CE values
Select peptides for quantitation
Select product ions
Evaluate results from considering CEs
0.0
(×10,000,000)
2.00
1.75
1.50
1.25
1.00
0.75
0.50
0.25
0.00
1.0 2.0 3.0 4.0 5.0 6.0 7.0 8.0 9.0 min
1.5 2.0 2.5 1.5 3.5 4.0 4.5 5.0 5.5 6.0 6.5 7.0 min
2.00
1.75
1.50
1.25
1.00
0.75
0.50
0.25
0.00
(×1,000,000)
(×1,000,000)2.00
1.75
1.50
1.25
1.00
0.75
0.50
0.25
0.001.5 2.0 2.5 1.5 3.5 4.0 4.5 5.0 5.5 6.0 6.5 7.0 min
Search for transitions by MRM (example: about 600 ch)
Determine analytical conditions using MRM (example: about 1500 ch)
Optimized analytical MRM method (example: about 4 ch)
LabSolutions
Protein amino acidsequence
DTHKSEIAHRFKDLGEEHFKGLVLIAFSQYLQQCPFDEHVKLVNELTEFAKTCVAD....
txt
txt
txt
LCD
LCD
UUUllltttrrraa-FFFast, Commprehensive Quannttiittaative Proteommiiccss
Quantitating the proteins and peptides in biological samples accurately and with high sensitivity is an important issue. Therefore, MRM (multiple reaction monitoring) currently has become a leading method in quantitative proteomics that offers high reliability. However, developing methods for quantitative proteomics requires comprehensively considering a large number of MRM transitions. Therefore, Skyline software was developed to assist with large-scale quantitative analysis of proteins by LCMS. By combining the Skyline software with the ultra fast MRM (UF-MRM®) capability offered by the LCMS-8050 and other models, the throughput of quantitative proteomics can be increased significantly.
Features

11
3.50 min
0.0
1.0
2.0
(x10,000)
3.50 min
0.0
0.5
1.0
1.5
(x10,000)
3.50 min
0.0
1.0
2.0
3.0
(x10,000)
3.50 min
0.0
2.5
5.0
7.5(x10,000)
3.50 min
0.0
1.0
2.0
3.0(x10,000)
3.50 min
0.0
2.5
5.0
(x10,000)
3.50 min
0.0
2.5
5.0
7.5
(x10,000)
Extract HLVDEPQNLIK data
HLVDEPQNLIK++ > y9+
653.35 > 1055.55CE: 13-37
HLVDEPQNLIK++ > y8+
653.35 > 956.50CE: 13-37
HLVDEPQNLIK++ > y7+
653.35 >841.50CE: 13-37
HLVDEPQNLIK++ > y6+
653.35 > 712.45CE: 13-37
HLVDEPQNLIK+++ > y6+
435.90 > 712.45CE: 13-37
HLVDEPQNLIK+++ > y5+
435.90 > 615.40CE: 13-37
HLVDEPQNLIK+++ > y4+
435.90 > 487.30CE: 13-37
1.5 2.0 2.5 3.0 3.5 4.0 4.5 5.0 5.5 6.0 6.5 7.0
0.00
0.25
0.50
0.75
1.00
1.25
1.50
1.75
2.00
(x1,000,000)
min
Divalent precursor ions Trivalent precursor ions
Even though the peptide HLVDEPQNLIK dissolves together with other high-intensity peptides, using UF-MRM® allowed determining conditions readily based on nine collision energy levels.
Collision Energy Optimization Using Skyline and UF-MRM®
Example of Determining Collision Energy Condition Using Trypsin Digestion Products of Bovine Serum Albumin (BSA)
For the 33 types of BSA trypsin digestion products, 50 precursor ions with different valence states were specified. In addition, three or four types of product ions were specified for each precursor ion, and nine levels of collision energy (3 V steps) were specified for each product ion (190 MRM transitions), for a total of 1710 transitions considered within eight minutes.
Data
12
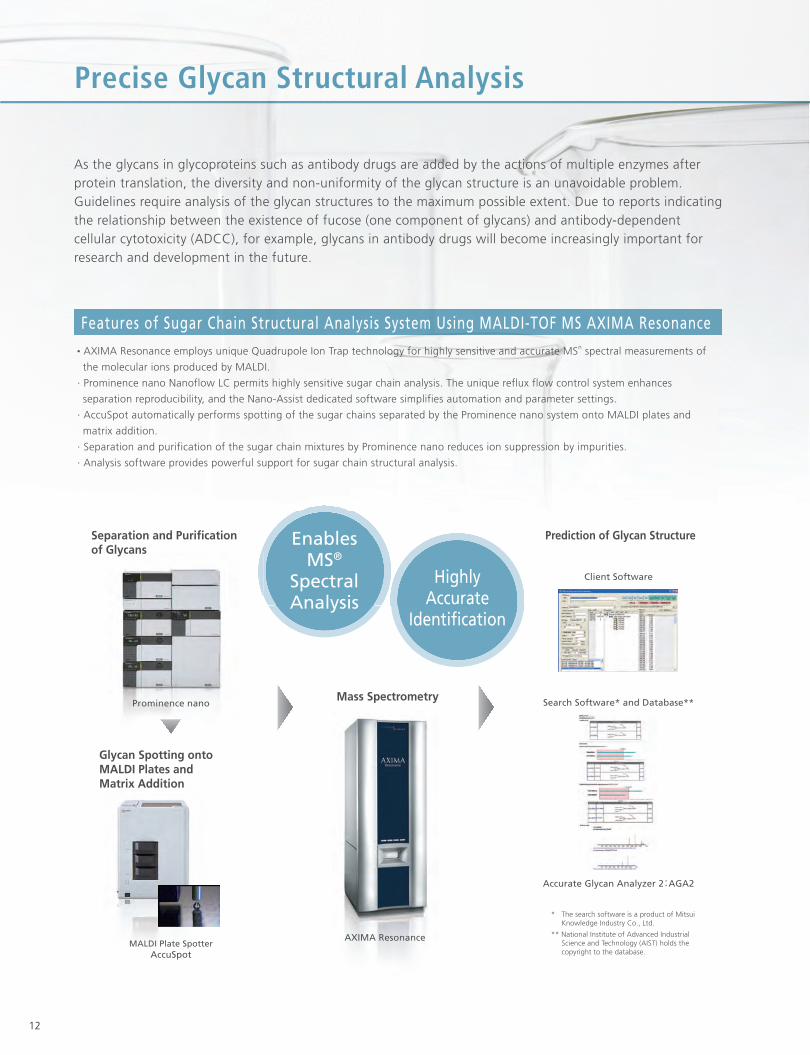
Precise Glycan SStructural Analysis
Prominence nano
MALDI Plate SpotterAccuSpot
AXIMA Resonance
Client Software
Search Software* and Database**
Separation and Purificationof Glycans
Prediction of Glycan Structure
Mass Spectrometry
Glycan Spotting onto MALDI Plates and Matrix Addition
Accurate Glycan Analyzer 2:AGA2
* The search software is a product of Mitsui Knowledge Industry Co., Ltd.
** National Institute of Advanced Industrial Science and Technology (AIST) holds the copyright to the database.
·· AXIMA Resonance employs unique Quadrupole Ion Trap technology for highly sensitive and accurate MSn spectral measurements of
the molecular ions produced by MALDI.
· Prominence nano Nanoflow LC permits highly sensitive sugar chain analysis. The unique reflux flow control system enhances
separation reproducibility, and the Nano-Assist dedicated software simplifies automation and parameter settings.
· AccuSpot automatically performs spotting of the sugar chains separated by the Prominence nano system onto MALDI plates and
matrix addition.
· Separation and purification of the sugar chain mixtures by Prominence nano reduces ion suppression by impurities.
· Analysis software provides powerful support for sugar chain structural analysis.
As the glycans in glycoproteins such as antibody drugs are added by the actions of multiple enzymes after protein translation, the diversity and non-uniformity of the glycan structure is an unavoidable problem. Guidelines require analysis of the glycan structures to the maximum possible extent. Due to reports indicating the relationship between the existence of fucose (one component of glycans) and antibody-dependent cellular cytotoxicity (ADCC), for example, glycans in antibody drugs will become increasingly important for research and development in the future.
HighlyAccurate
Identification
EnablesMS®
SpectralAnalysis
Features of Sugar Chain Structural Analysis System Using MALDI-TOF MS AXIMA Resonance

13
Fig. 3 Predicted Structure of Sugar Chains from Human Myeloma IgG
Fig. 1 LC Chromatograms of Sugar Chain Samples from Human Myeloma IgG
Table 1 List of m/z Values for Ions from Sugar Chains Extracted from Mass Spectra
Fig. 2 Mass Spectra of Sugar Chain Samplesfrom Human Myeloma IgG
1563.69
1725.75
1766.74
1887.68
1928.85
2030.87
2192.93
m/z Values for Ions from Extracted Sugar Chains
m/z
·
·
·
·
·
Analysis of Commercial IgG from Human Myeloma for Research
Data
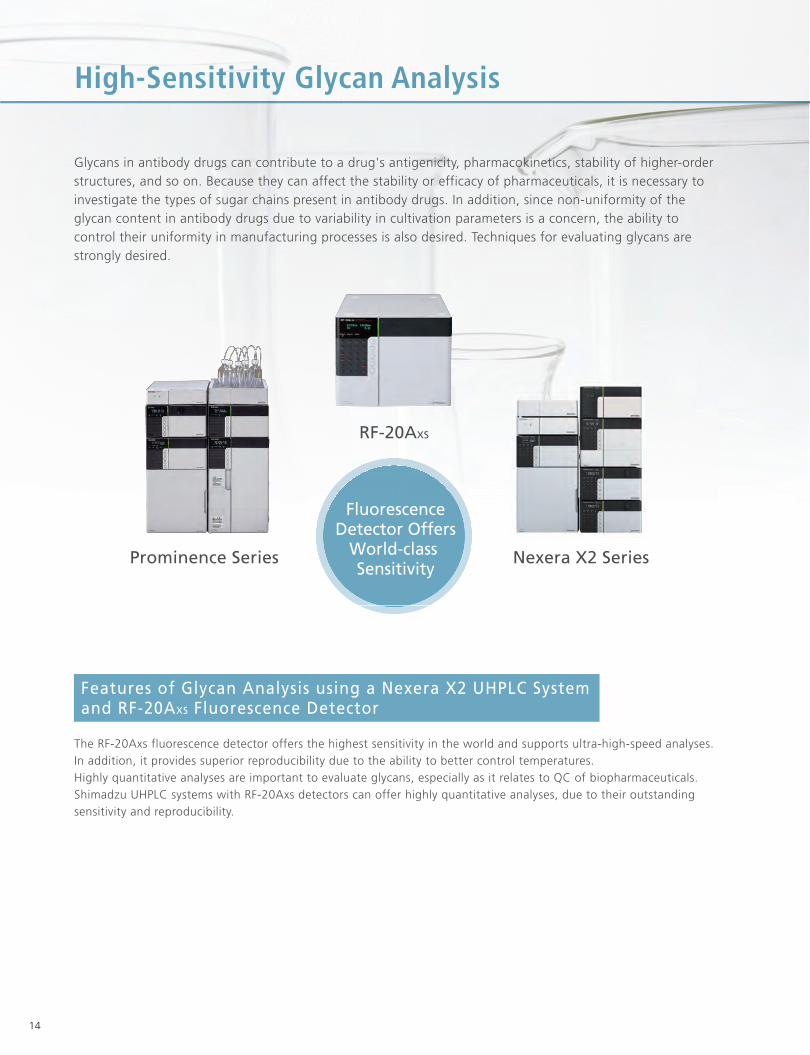
High-Sensittttttiiiiiiviiiiiitty Glycan Analysis
FluorescenceDetector Offers
World-class Sensitivity
Prominence Series
RF-20AXS
Nexera X2 Series
14
Glycans in antibody drugs can contribute to a drug's antigenicity, pharmacokinetics, stability of higher-order structures, and so on. Because they can affect the stability or efficacy of pharmaceuticals, it is necessary to investigate the types of sugar chains present in antibody drugs. In addition, since non-uniformity of the glycan content in antibody drugs due to variability in cultivation parameters is a concern, the ability to control their uniformity in manufacturing processes is also desired. Techniques for evaluating glycans are strongly desired.
The RF-20Axs fluorescence detector offers the highest sensitivity in the world and supports ultra-high-speed analyses. In addition, it provides superior reproducibility due to the ability to better control temperatures.Highly quantitative analyses are important to evaluate glycans, especially as it relates to QC of biopharmaceuticals. Shimadzu UHPLC systems with RF-20Axs detectors can offer highly quantitative analyses, due to their outstanding sensitivity and reproducibility.
Features of Glycan Analysis using a Nexera X2 UHPLC System and RF-20AXS Fluorescence Detector
■
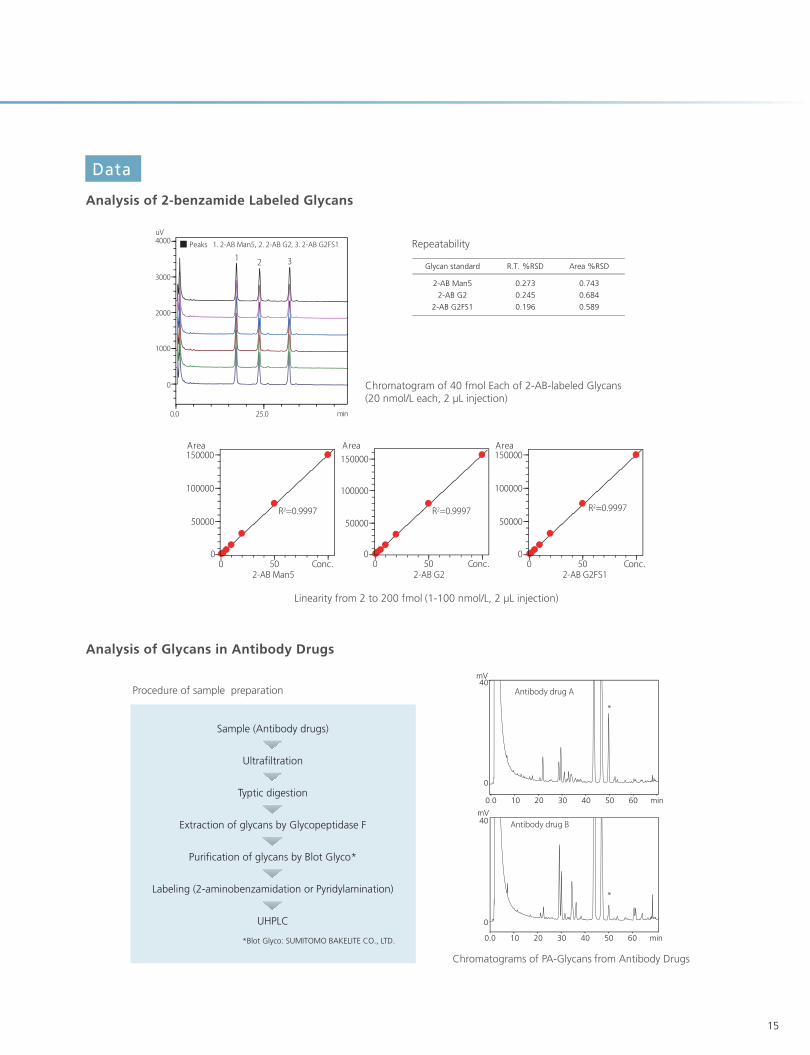
Chromatograms of PA-Glycans from Antibody Drugs
Chromatogram of 40 fmol Each of 2-AB-labeled Glycans(20 nmol/L each, 2 µL injection)
Linearity from 2 to 200 fmol (1-100 nmol/L, 2 µL injection)
15
Analysis of 2-benzamide Labeled Glycans
Analysis of Glycans in Antibody Drugs
Data
Repeatability
Procedure of sample preparation
Glycan standard
2-AB Man5
2-AB G2
2-AB G2FS1
R.T. %RSD
0.273
0.245
0.196
Area %RSD
0.743
0.684
0.589
Sample (Antibody drugs)
Ultrafiltration
Typtic digestion
Extraction of glycans by Glycopeptidase F
Purification of glycans by Blot Glyco*
Labeling (2-aminobenzamidation or Pyridylamination)
UHPLC
*Blot Glyco: SUMITOMO BAKELITE CO., LTD.
0.0 25.0
0
1000
2000
3000
4000uV
■■ Peaks 1. 2-AB Man5, 2. 2-AB G2, 3. 2-AB G2FS1 1 2 3
min
0 50 Conc.0
50000
100000
150000Area
0 50 Conc.0
50000
100000
150000Area
0 50 Conc.0
50000
100000
150000Area
R2=0.9997 R2=0.9997 R2=0.9997
2-AB Man5 2-AB G2 2-AB G2FS1
0.0 10 20 30 40 50 60 min
0
40mV
0.0 10 20 30 40 50 60 min
mV40
0
Antibody drug A
Antibody drug B
*
*

AAmmiinnoo AAcciidd CCoommppoossiittiioonn AAnnaallyyssiis
Ultra High Sensitivity &
Speed
Nexera X2
Data
1. Pre-Column HPLC
Two systems are available, depending on the application and purpose of analysis.• Pre-column HPLC for analysis that prioritizes quantitation• UF-Amino Station LC/MS system for qualitative analysis, which can even be used for samples containing
contaminants
Chromatogram of a 10 µmol/L Standard Mixture Solution with 22 Amino Acid Components (1 µL injection)
Orn
Phe
TrpLys
16
Features of Pre-column HPLC Analysis
• Fast analysis by UHPLC significantly shortens analysis time.• Using the automatic pretreatment functionality of the SIL-30AC autosampler for the derivatization process provides
data with high reproducibility.• The RF-20Axs fluorescence detector offers the world’s highest sensitivity levels, enabling analysis with extremely
high sensitivity.

High-speed9 min/analysis
Ideal for Cell Culture
Fluid Analysis
Features of UF-Amino Station
Data
LCMS-2020
2. UF-Amino Station (Fast LC-MS)
* Permits the analysis of 38 amino acid-related components, such as anserine, citrulline, taurine, and GABA (γ-aminobutyric acid), in addition to the 20 major amino acid components.
Asp Gln Asn Ser
Gly
Pro
Ala Thr
Arg Tyr
Val
Met
Ile
Leu
OrnOrn
PhPhe
Trprp
Orn
LysLysLys
Phe
Trp
0.0 1.0 2.0 3.0 4.0 5.0 6.0 7.0 8.0 min
UF-Amino Station features a special-purpose, fast analysis column and an LCMS-2020 mass spectrometer, which supports ultra-fast analysis speeds, to achieve the simultaneous analysis of 38 amino acid and amino acid-related components* in just nine minutes.Additionally, it automates the derivatization reaction to eliminate the need for cumbersome pretreatment procedures by manual operation. UF-Amino Station is an excellent tool for quantitatively analyzing culture fluids.
Amino Acid Analysis in Commercial Serum-Free Medium (supplied by Ajinomoto Co., Inc.)
17
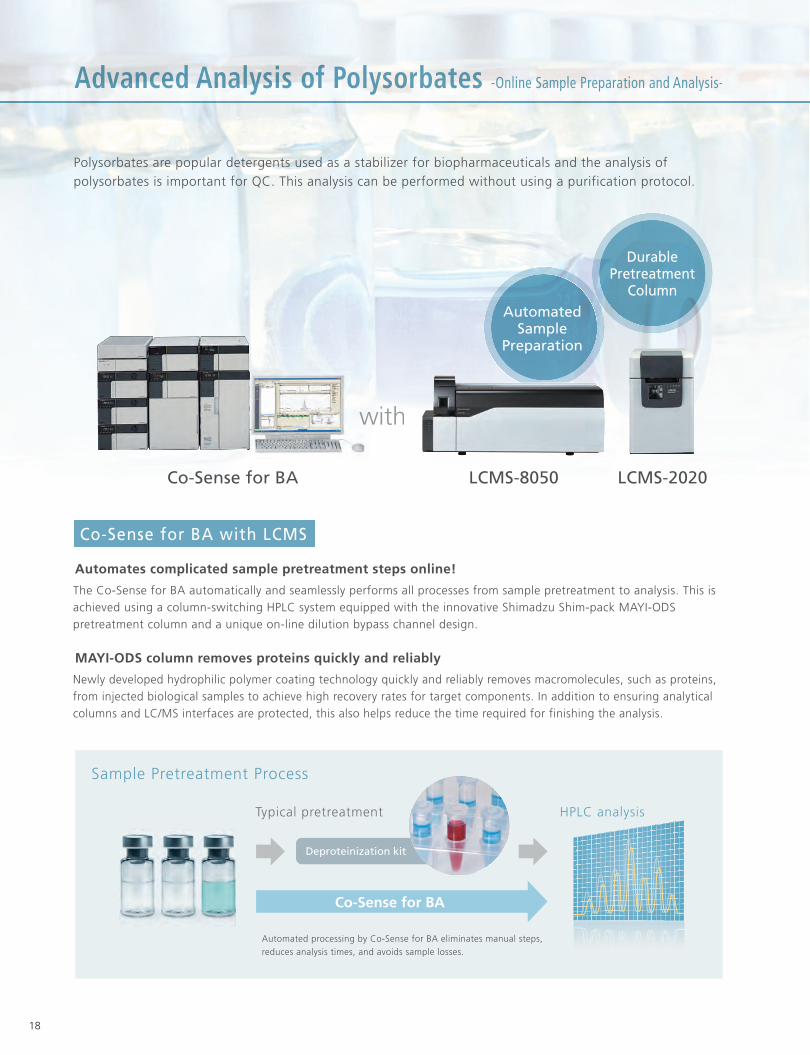
AAAAAAAAAAdddddddvvvvvvaaaaannnnnncccceeeeeeeddddd AAAAAAAAAAnnnnnnnnnnnaaaaaaallllllllyyyyyyysssssssiiiisssss ooooooofffff PPPPPPPPPoooollllyyyyysssssoooorrrrrbbaaaaattttteeeeessssss OOOO-OOOnlinne ee SaSaSaSaSampmpmpmplelelele PPPPrreparaaaatititit ononono aand Anananalylylyssis s-
Polysorbates are popular detergents used as a stabilizer for biopharmaceuticals and the analysis of polysorbates is important for QC. This analysis can be performed without using a purification protocol.
The Co-Sense for BA automatically and seamlessly performs all processes from sample pretreatment to analysis. This is achieved using a column-switching HPLC system equipped with the innovative Shimadzu Shim-pack MAYI-ODS pretreatment column and a unique on-line dilution bypass channel design.
Co-Sense for BA with LCMS
Automates complicated sample pretreatment steps online!
Newly developed hydrophilic polymer coating technology quickly and reliably removes macromolecules, such as proteins, from injected biological samples to achieve high recovery rates for target components. In addition to ensuring analytical columns and LC/MS interfaces are protected, this also helps reduce the time required for finishing the analysis.
Automated processing by Co-Sense for BA eliminates manual steps, reduces analysis times, and avoids sample losses.
MAYI-ODS column removes proteins quickly and reliably
Sample Pretreatment Process
Typical pretreatment HPLC analysis
Deproteinization kit
Co-Sense for BA
DurablePretreatment
ColumnAutomated
SamplePreparation
withw
18
Co-Sense for BA LCMS-8050 LCMS-2020
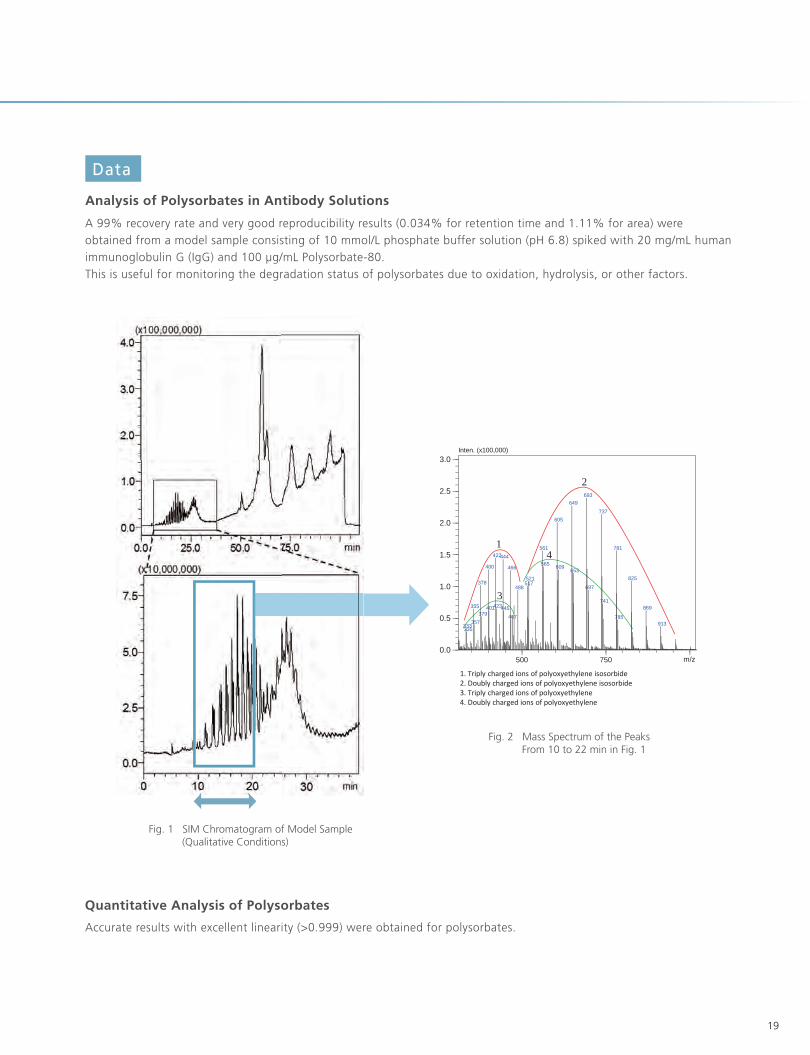
Fig. 1 SIM Chromatogram of Model Sample (Qualitative Conditions)
Fig. 2 Mass Spectrum of the Peaks From 10 to 22 min in Fig. 1
Accurate results with excellent linearity (>0.999) were obtained for polysorbates.
Quantitative Analysis of Polysorbates
1. Triply charged ions of polyoxyethylene isosorbide 2. Doubly charged ions of polyoxyethylene isosorbide 3. Triply charged ions of polyoxyethylene 4. Doubly charged ions of polyoxyethylene
693 649
737 605
561 781 422 444
565 400 609 466
825 521 378 517
697 488
741 423 355 869 401 445
379 467 785 357 913 333 335
653
1
2
3
4
500 750 m/z0.0
0.5
1.0
1.5
2.0
2.5
3.0 Inten. (x100,000)
19
Data
A 99% recovery rate and very good reproducibility results (0.034% for retention time and 1.11% for area) were obtained from a model sample consisting of 10 mmol/L phosphate buffer solution (pH 6.8) spiked with 20 mg/mL human immunoglobulin G (IgG) and 100 µg/mL Polysorbate-80.This is useful for monitoring the degradation status of polysorbates due to oxidation, hydrolysis, or other factors.
Analysis of Polysorbates in Antibody Solutions
20
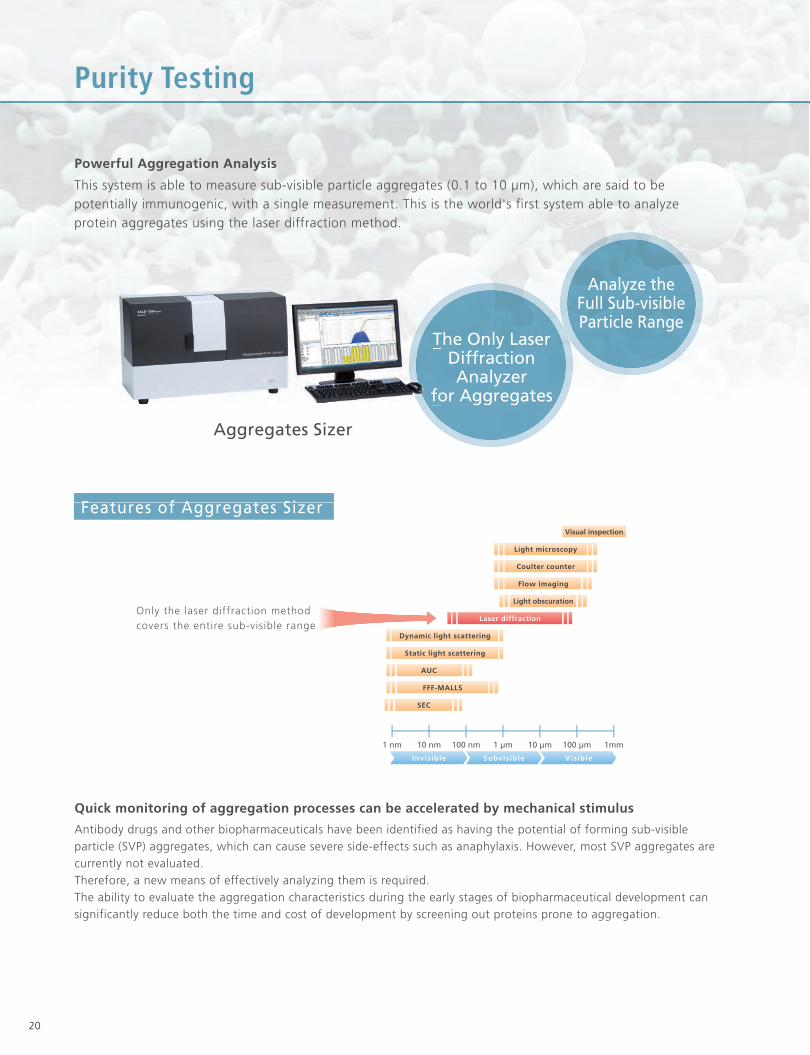
PPuurriittyy TTeessttiinngg
Antibody drugs and other biopharmaceuticals have been identified as having the potential of forming sub-visible particle (SVP) aggregates, which can cause severe side-effects such as anaphylaxis. However, most SVP aggregates are currently not evaluated. Therefore, a new means of effectively analyzing them is required.The ability to evaluate the aggregation characteristics during the early stages of biopharmaceutical development can significantly reduce both the time and cost of development by screening out proteins prone to aggregation.
Quick monitoring of aggregation processes can be accelerated by mechanical stimulus
Powerful Aggregation Analysis
Only the laser diffraction method covers the entire sub-visible range
This system is able to measure sub-visible particle aggregates (0.1 to 10 µm), which are said to be potentially immunogenic, with a single measurement. This is the world's first system able to analyze protein aggregates using the laser diffraction method.
The Only LaserDiffractionAnalyzer
for Aggregates
Analyze theFull Sub-visibleParticle Range
T
fo
··
·
Aggregates Sizer
Features of Aggregates Sizer
1 nm 10 nm 100 nm 1 µm 10 µm 100 µm 1mm
Invisible Subvisible Visible
SEC
FFF-MALLS
Laser diffraction
AUC
Light obscuration
Flow imaging
Coulter counter
Light microscopy
Visual inspection
Static light scattering
Dynamic light scattering
21
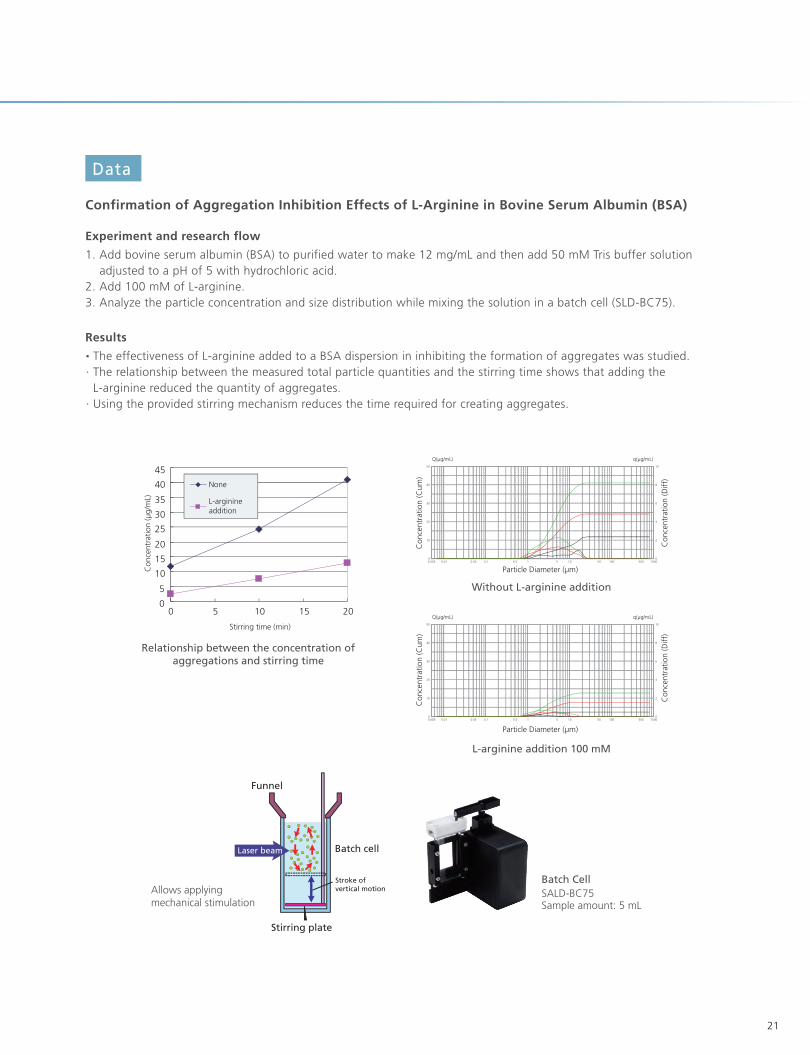
Confirmation of Aggregation Inhibition Effects of L-Arginine in Bovine Serum Albumin (BSA)
Experiment and research flow
1. Add bovine serum albumin (BSA) to purified water to make 12 mg/mL and then add 50 mM Tris buffer solution adjusted to a pH of 5 with hydrochloric acid.
2. Add 100 mM of L-arginine.3. Analyze the particle concentration and size distribution while mixing the solution in a batch cell (SLD-BC75).
Results
·· The effectiveness of L-arginine added to a BSA dispersion in inhibiting the formation of aggregates was studied.· The relationship between the measured total particle quantities and the stirring time shows that adding the
L-arginine reduced the quantity of aggregates.· Using the provided stirring mechanism reduces the time required for creating aggregates.
Allows applyingmechanical stimulation
Funnel
Laser beam Batch cell
Stroke of vertical motion
Stirring plate
Relationship between the concentration ofaggregations and stirring time
L-arginine addition 100 mM
Without L-arginine addition
0
5
10
15
20
25
30
35
40
45
0 5 10 15 20
Stirring time (min)
Con
cent
ratio
n (µ
g/m
L)
None
L-arginineaddition
0.005 0.01 0.05 0.1 0.5 1 5 10 50 100 500 1000 0
10
20
30
40
50
0
2
4
6
8
10
Q(µg/mL) q(µg/mL)
Con
cent
ratio
n (D
iff)
Particle Diameter (µm)
Con
cent
ratio
n (C
um)
0.005 0.01 0.05 0.1 0.5 1 5 10 50 100 500 1000 0
10
20
30
40
50
0
2
4
6
8
10
Q(µg/mL) q(µg/mL)
Con
cent
ratio
n (D
iff)
Particle Diameter (µm)
Con
cent
ratio
n (C
um)
Batch CellSALD-BC75Sample amount: 5 mL
Data
22
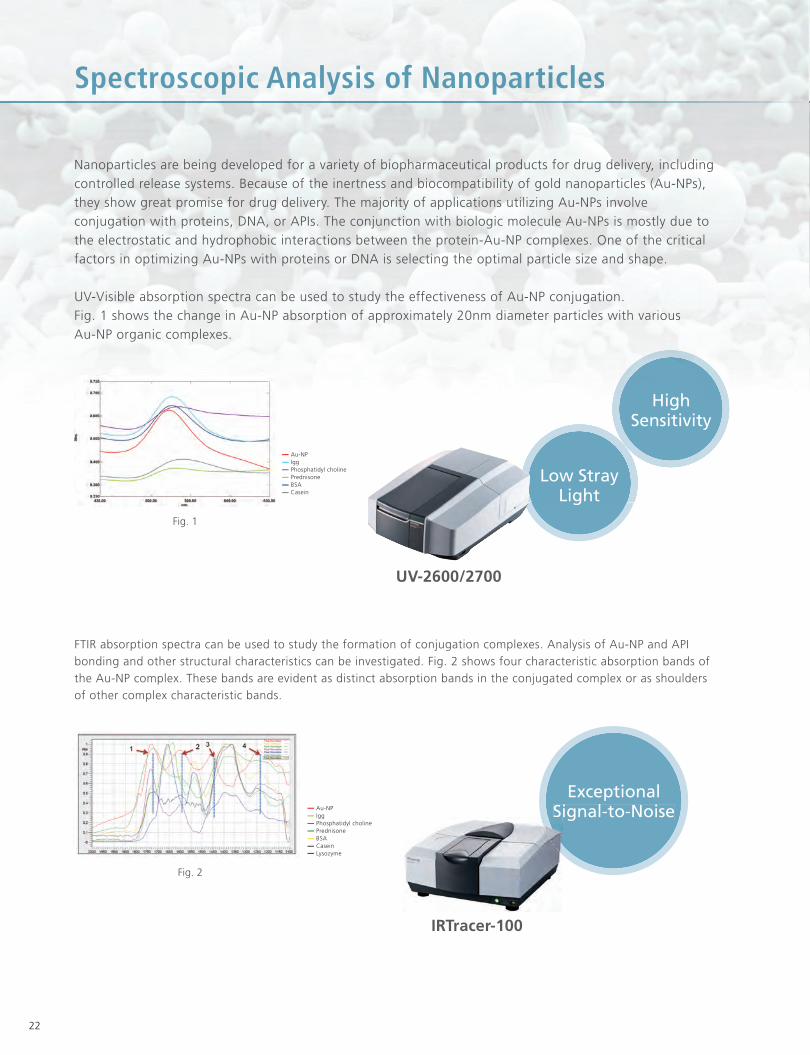
SSppeeccttrroossccooppiic AAnnaallyyssiiss ooff NNaannoopparttiicclleess
FTIR absorption spectra can be used to study the formation of conjugation complexes. Analysis of Au-NP and API bonding and other structural characteristics can be investigated. Fig. 2 shows four characteristic absorption bands of the Au-NP complex. These bands are evident as distinct absorption bands in the conjugated complex or as shoulders of other complex characteristic bands.
Nanoparticles are being developed for a variety of biopharmaceutical products for drug delivery, including controlled release systems. Because of the inertness and biocompatibility of gold nanoparticles (Au-NPs), they show great promise for drug delivery. The majority of applications utilizing Au-NPs involve conjugation with proteins, DNA, or APIs. The conjunction with biologic molecule Au-NPs is mostly due to the electrostatic and hydrophobic interactions between the protein-Au-NP complexes. One of the critical factors in optimizing Au-NPs with proteins or DNA is selecting the optimal particle size and shape.
UV-Visible absorption spectra can be used to study the effectiveness of Au-NP conjugation.Fig. 1 shows the change in Au-NP absorption of approximately 20nm diameter particles with various Au-NP organic complexes.
IRTracer-100
Low StrayLight
HighSensitivity
UV-2600/2700
ExceptionalSignal-to-Noise
Au-NP Igg Phosphatidyl choline Prednisone BSA Casein
Au-NP Igg Phosphatidyl choline Prednisone BSA Casein Lysozyme
·
·
Fig. 1
Fig. 2
23
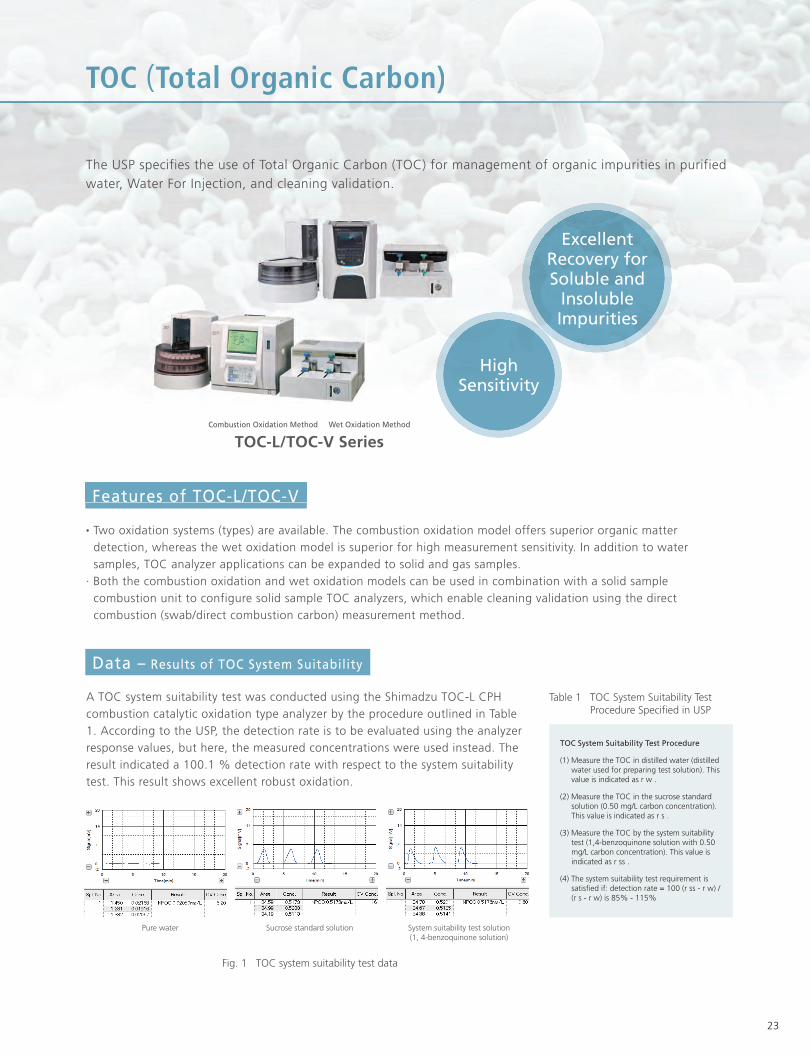
TTOOCC ((TToottaall OOrrggaanniicc CCaarrbboonn))
The USP specifies the use of Total Organic Carbon (TOC) for management of organic impurities in purified water, Water For Injection, and cleaning validation.
Combustion Oxidation Method Wet Oxidation Method
TOC-L/TOC-V Series
HighSensitivity
ExcellentRecovery forSoluble and
InsolubleImpurities
·· Two oxidation systems (types) are available. The combustion oxidation model offers superior organic matter detection, whereas the wet oxidation model is superior for high measurement sensitivity. In addition to water samples, TOC analyzer applications can be expanded to solid and gas samples.
· Both the combustion oxidation and wet oxidation models can be used in combination with a solid sample combustion unit to configure solid sample TOC analyzers, which enable cleaning validation using the direct combustion (swab/direct combustion carbon) measurement method.
A TOC system suitability test was conducted using the Shimadzu TOC-L CPH combustion catalytic oxidation type analyzer by the procedure outlined in Table 1. According to the USP, the detection rate is to be evaluated using the analyzer response values, but here, the measured concentrations were used instead. The result indicated a 100.1 % detection rate with respect to the system suitability test. This result shows excellent robust oxidation.
Features of TOC-L/TOC-V
Data – Results of TOC System Suitability
Fig. 1 TOC system suitability test data
Table 1 TOC System Suitability Test Procedure Specified in USP
Pure water Sucrose standard solution System suitability test solution(1, 4-benzoquinone solution)
TOC System Suitability Test Procedure
(1) Measure the TOC in distilled water (distilled water used for preparing test solution). This value is indicated as r w .
(2) Measure the TOC in the sucrose standard solution (0.50 mg/L carbon concentration). This value is indicated as r s .
(3) Measure the TOC by the system suitability test (1,4-benzoquinone solution with 0.50 mg/L carbon concentration). This value is indicated as r ss .
(4) The system suitability test requirement is satisfied if: detection rate = 100 (r ss - r w) / (r s - r w) is 85% - 115%
24
MinimalOperating Costs
with Low GasConsumption
RobustOperation
with VerticalTorch/Dual
View Design
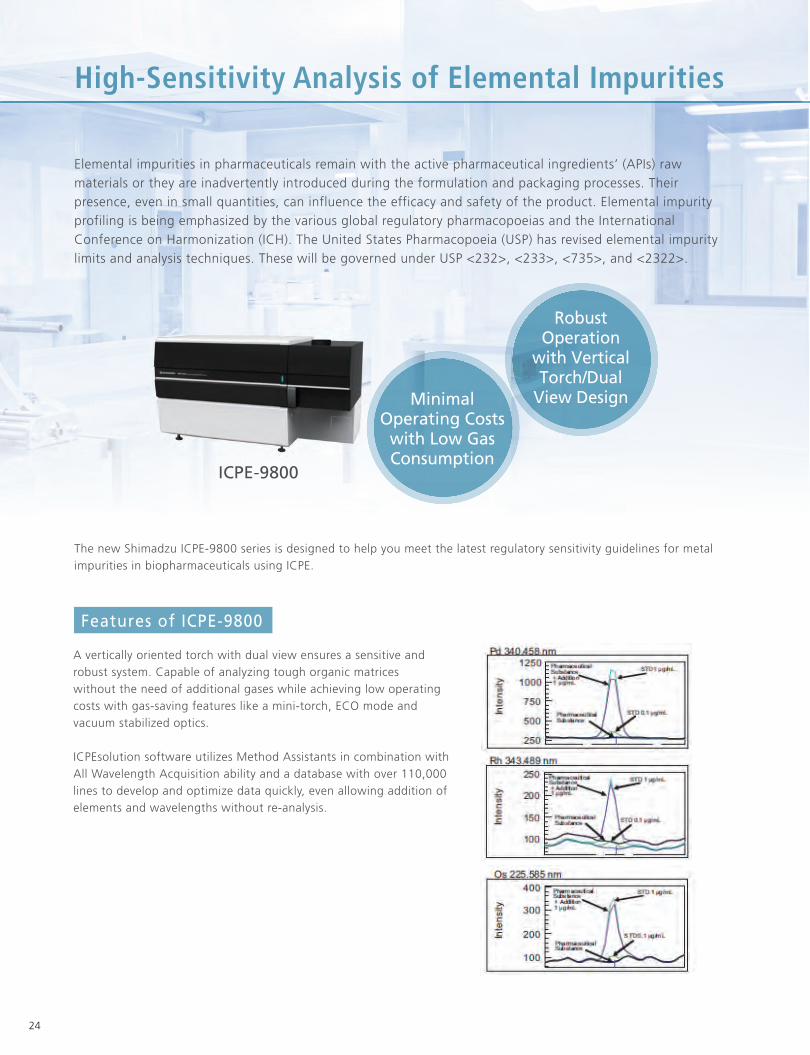
The new Shimadzu ICPE-9800 series is designed to help you meet the latest regulatory sensitivity guidelines for metal impurities in biopharmaceuticals using ICPE.
ICPE-9800
HHHiiiggghhh-SSSensitiviityy Analysis of Eleemmeental Impuriittiieess
Elemental impurities in pharmaceuticals remain with the active pharmaceutical ingredients’ (APIs) raw materials or they are inadvertently introduced during the formulation and packaging processes. Their presence, even in small quantities, can influence the efficacy and safety of the product. Elemental impurity profiling is being emphasized by the various global regulatory pharmacopoeias and the International Conference on Harmonization (ICH). The United States Pharmacopoeia (USP) has revised elemental impurity limits and analysis techniques. These will be governed under USP <232>, <233>, <735>, and <2322>.
A vertically oriented torch with dual view ensures a sensitive and robust system. Capable of analyzing tough organic matriceswithout the need of additional gases while achieving low operating costs with gas-saving features like a mini-torch, ECO mode and vacuum stabilized optics.
ICPEsolution software utilizes Method Assistants in combination withAll Wavelength Acquisition ability and a database with over 110,000lines to develop and optimize data quickly, even allowing addition of elements and wavelengths without re-analysis.
Features of ICPE-9800
25
High-Sensitivitywith LN2–Free
Detector
Low OperatingCosts with No
Gases &Chemicals
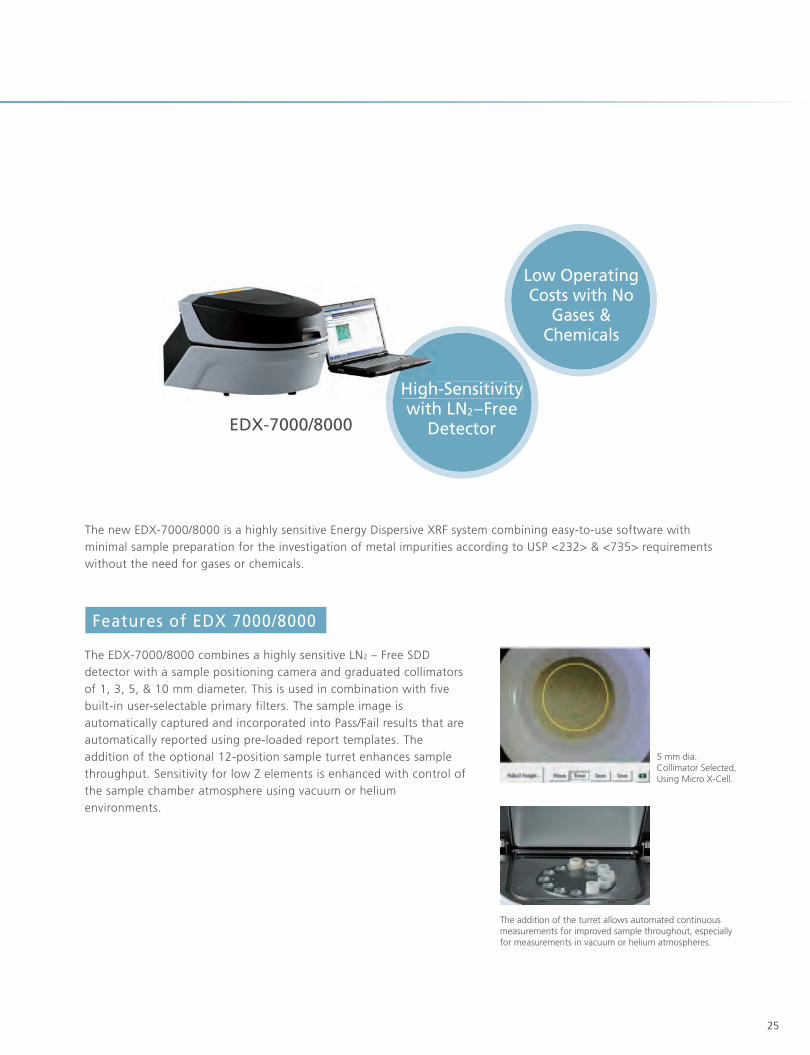
EDX-7000/8000
5 mm dia. Collimator Selected,Using Micro X-Cell.
The addition of the turret allows automated continuousmeasurements for improved sample throughout, especiallyfor measurements in vacuum or helium atmospheres.
The new EDX-7000/8000 is a highly sensitive Energy Dispersive XRF system combining easy-to-use software with minimal sample preparation for the investigation of metal impurities according to USP <232> & <735> requirements without the need for gases or chemicals.
High
The EDX-7000/8000 combines a highly sensitive LN2 – Free SDD detector with a sample positioning camera and graduated collimators of 1, 3, 5, & 10 mm diameter. This is used in combination with five built-in user-selectable primary filters. The sample image is automatically captured and incorporated into Pass/Fail results that are automatically reported using pre-loaded report templates. The addition of the optional 12-position sample turret enhances sample throughput. Sensitivity for low Z elements is enhanced with control of the sample chamber atmosphere using vacuum or helium environments.
Features of EDX 7000/8000
26
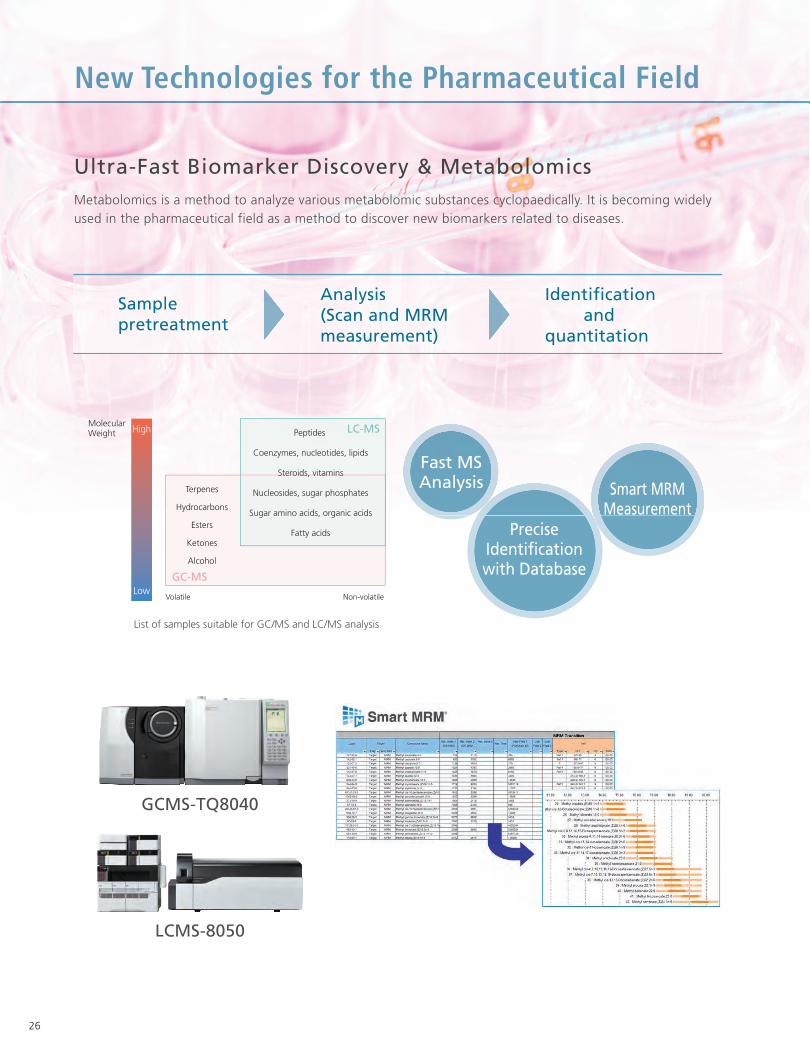
List of samples suitable for GC/MS and LC/MS analysis
Fast MSAnalysis Smart MRM
MeasurementPrecise
Identificationwith Database
GCMS-TQ8040
LCMS-8050
SSaammpllepretrreeatmmenntt
AAnnalysiss ((Sccaann and MRRM mmeeasuurrement)
IIddennttiffiicattiioonn andd quuaantitation
HighMolecularWeight
LowGC-MS
LC-MSPeptides
Terpenes
Hydrocarbons
Esters
Ketones
Alcohol
Coenzymes, nucleotides, lipids
Steroids, vitamins
Nucleosides, sugar phosphates
Sugar amino acids, organic acids
Fatty acids
Volatile Non-volatile
NNeeww TTeechhnoolooggiieess ffoorr tthhee PPhhaarrmmaacceeuuttical FFiieelldd
Metabolomics is a method to analyze various metabolomic substances cyclopaedically. It is becoming widely used in the pharmaceutical field as a method to discover new biomarkers related to diseases.
Ultra-Fast Biomarker Discovery & Metabolomics
27
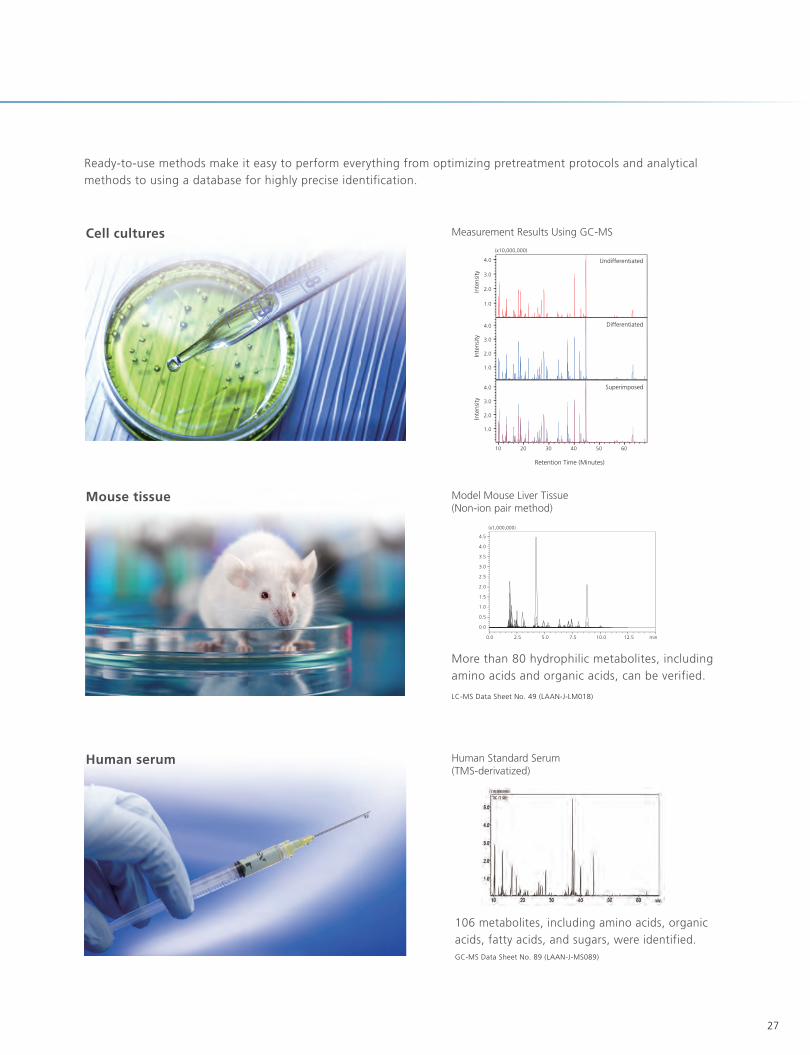
Ready-to-use methods make it easy to perform everything from optimizing pretreatment protocols and analytical methods to using a database for highly precise identification.
Cell cultures
Mouse tissue
Human serum
Measurement Results Using GC-MS
4.0
(x10,000,000)
2.0
3.0
1.0
4.0
1.0
2.0
3.0
2.0
3.0
4.0
10 20 30 40 50 60
1.0
Inte
nsity
Inte
nsity
Inte
nsity
Undifferentiated
Differentiated
Superimposed
Retention Time (Minutes)
Model Mouse Liver Tissue(Non-ion pair method)
LC-MS Data Sheet No. 49 (LAAN-J-LM018)
More than 80 hydrophilic metabolites, including amino acids and organic acids, can be verified.
0.0 2.5 5.0 7.5 10.0 12.5 min
0.0
0.5
1.0
1.5
2.0
2.5
3.0
3.5
4.0
4.5
(x1,000,000)
Human Standard Serum(TMS-derivatized)
GC-MS Data Sheet No. 89 (LAAN-J-MS089)
106 metabolites, including amino acids, organic acids, fatty acids, and sugars, were identified.
28
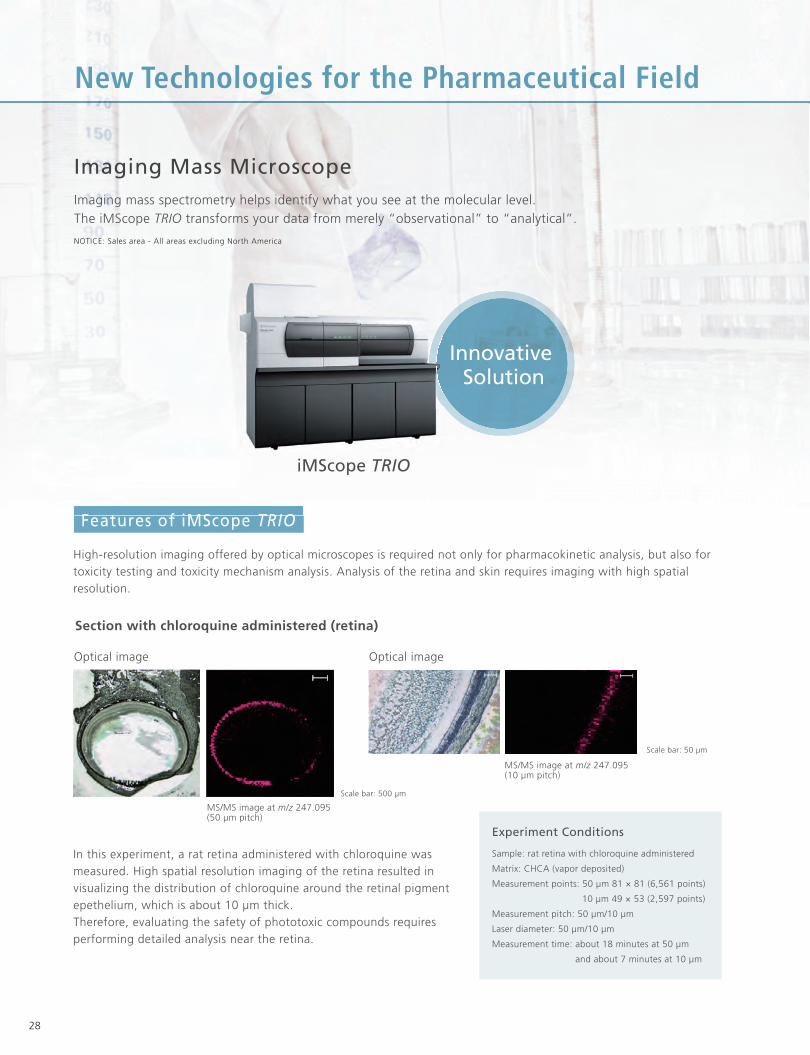
NOTICE: Sales area - All areas excluding North America
Optical Image MS Images
Innovative Solution
iMScope TRIO
Section with chloroquine administered (retina)
Neeeww Teecchnologgies for the Pharmaceuticccccal Field
Imaging mass spectrometry helps identify what you see at the molecular level.The iMScope TRIO transforms your data from merely “observational” to “analytical”.
Imaging Mass Microscope
High-resolution imaging offered by optical microscopes is required not only for pharmacokinetic analysis, but also for toxicity testing and toxicity mechanism analysis. Analysis of the retina and skin requires imaging with high spatial resolution.
Features of iMScope TRIO
Optical image
MS/MS image at m/z 247.095 (50 µm pitch)
Scale bar: 500 µm
Optical image
MS/MS image at m/z 247.095 (10 µm pitch)
Scale bar: 50 µm
In this experiment, a rat retina administered with chloroquine was measured. High spatial resolution imaging of the retina resulted in visualizing the distribution of chloroquine around the retinal pigment epethelium, which is about 10 µm thick.Therefore, evaluating the safety of phototoxic compounds requires performing detailed analysis near the retina.
Experiment Conditions
Sample: rat retina with chloroquine administered
Matrix: CHCA (vapor deposited)
Measurement points: 50 µm 81 × 81 (6,561 points)
10 µm 49 × 53 (2,597 points)
Measurement pitch: 50 µm/10 µm
Laser diameter: 50 µm/10 µm
Measurement time: about 18 minutes at 50 µm
and about 7 minutes at 10 µm
···

29
in vivo Optical Imagingby functional Near-Infrared Spectroscopy (fNIRS)
NOTICE: LABNIRS is not a medical diagnostic device. It can only be used for Research purposes.
LABNIRS is not available in all regions. Please check with your local Shimadzu office or representative for availability.
LABNIRS can be applied to brain function research and drug development for research into mental illness, such as depression and schizophrenia. It is expected to be used for such applications as the prediction of drug efficacy based on brain function.
·· Next-generation optical brain-function measurements start with multi-channel and high-density, high-speed sampling.· Reliability of three wavelengths and photomultiplier tube achieve superb sensitivity.· Comprehensive options provide powerful measurement support. Increase the number of channels according to the aim of the experiments.
Features of LABNIRS
HighPerformance
EasyOperation
OutstandingScalability
Multi-Channel Measurements Normal Placement High-Density Placement
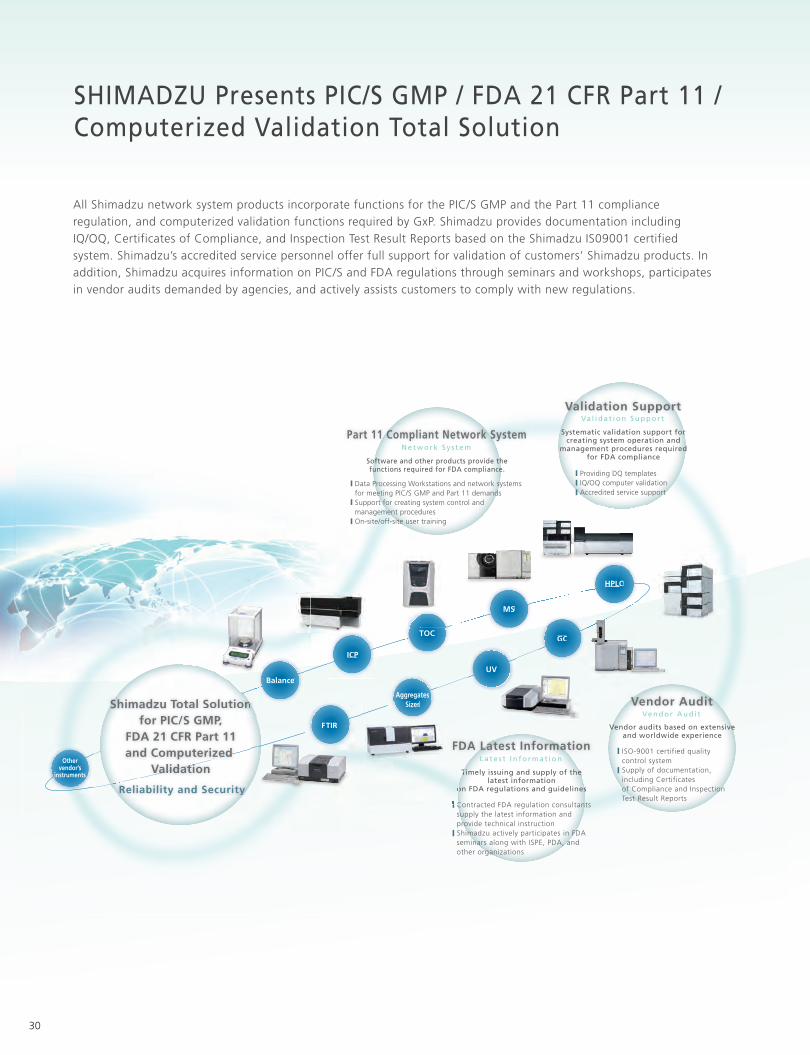
SHIMADZU Presents PIC/S GMP / FDA 21 CFR Part 11 /Computerized Validation Total Solution
Balance
TOC
FTIR
HPLC
MS
UV
AggregatesSizer
ICP
GC
Shimadzu Total Solutionfor PIC/S GMP,
FDA 21 CFR Part 11and Computerized
Validation
Reliability and Security
GC
,t 11zed zed
ycurity
Balance
nTotal SolutionC/S GMP
MS
Othervendor’s
instruments
N e t w o r k S y s t e mN e t w o r k S y s t e m
Part 11 Compliant Network System
Software and other products provide thefunctions required for FDA compliance.
Data Processing Workstations and network systemsfor meeting PIC/S GMP and Part 11 demandsSupport for creating system control andmanagement proceduresOn-site/off-site user training
Validation SupportVa l i d a t i o n S u p p o r t
Systematic validation support forcreating system operation and
management procedures requiredfor FDA compliance
Providing DQ templatesIQ/OQ computer validationAccredited service support
Vendor AuditVe n d o r A u d i t
Vendor audits based on extensiveand worldwide experience
ISO-9001 certified qualitycontrol systemSupply of documentation,including Certificatesof Compliance and InspectionTest Result Reports
FDA Latest InformationL a t e s t I n f o r m a t i o n
Timely issuing and supply of thelatest information
on FDA regulations and guidelines
Contracted FDA regulation consultantssupply the latest information and provide technical instructionShimadzu actively participates in FDAseminars along with ISPE, PDA, andother organizations
CHPL
ICP
B l
Aggregates
DA LaLaL aL a
TTimely il
oon FDA r
FTIRFTIR
CC
Sizer
F
oo
30
All Shimadzu network system products incorporate functions for the PIC/S GMP and the Part 11 compliance regulation, and computerized validation functions required by GxP. Shimadzu provides documentation including IQ/OQ, Certificates of Compliance, and Inspection Test Result Reports based on the Shimadzu IS09001 certified system. Shimadzu’s accredited service personnel offer full support for validation of customers’ Shimadzu products. In addition, Shimadzu acquires information on PIC/S and FDA regulations through seminars and workshops, participates in vendor audits demanded by agencies, and actively assists customers to comply with new regulations.
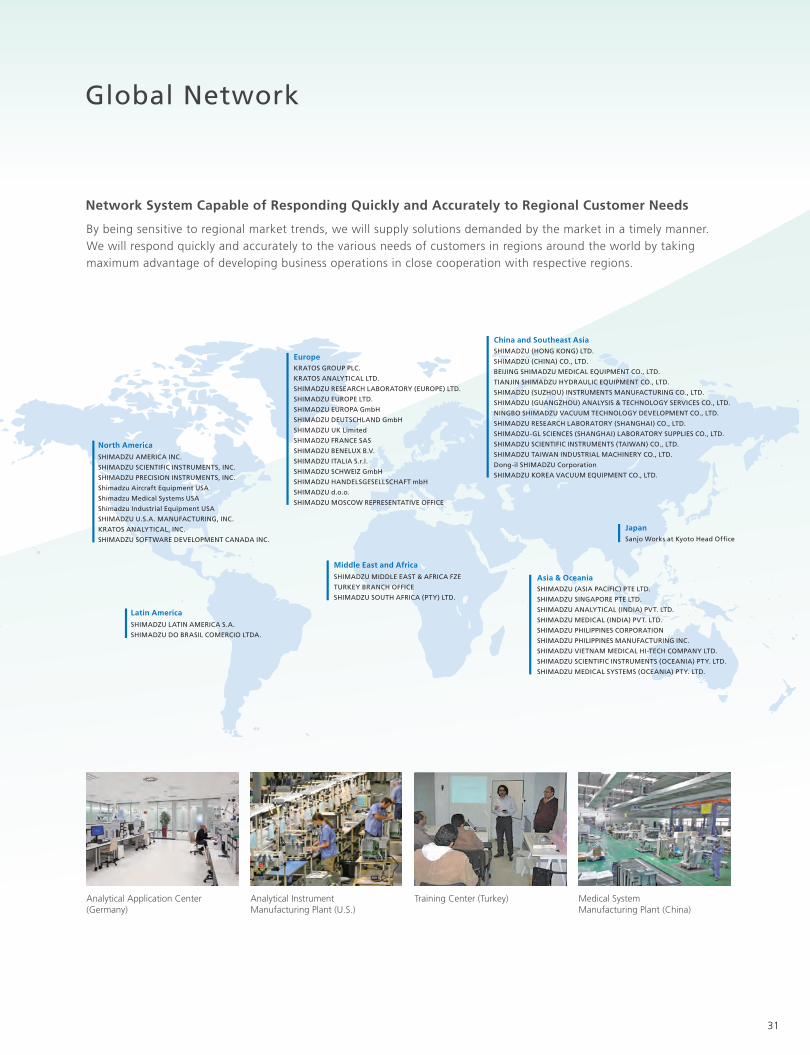
Global Network
31
Network System Capable of Responding Quickly and Accurately to Regional Customer Needs
By being sensitive to regional market trends, we will supply solutions demanded by the market in a timely manner.We will respond quickly and accurately to the various needs of customers in regions around the world by taking maximum advantage of developing business operations in close cooperation with respective regions.
SHIMADZU LATIN AMERICA S.A.
SHIMADZU DO BRASIL COMERCIO LTDA.
Latin America
KRATOS GROUP PLC.
KRATOS ANALYTICAL LTD.
SHIMADZU RESEARCH LABORATORY (EUROPE) LTD.
SHIMADZU EUROPE LTD.
SHIMADZU EUROPA GmbH
SHIMADZU DEUTSCHLAND GmbH
SHIMADZU UK Limited
SHIMADZU FRANCE SAS
SHIMADZU BENELUX B.V.
SHIMADZU ITALIA S.r.l.
SHIMADZU SCHWEIZ GmbH
SHIMADZU HANDELSGESELLSCHAFT mbH
SHIMADZU d.o.o.
SHIMADZU MOSCOW REPRESENTATIVE OFFICE
Europe
SHIMADZU MIDDLE EAST & AFRICA FZE
TURKEY BRANCH OFFICE
SHIMADZU SOUTH AFRICA (PTY) LTD.
Middle East and Africa
SHIMADZU (ASIA PACIFIC) PTE LTD.
SHIMADZU SINGAPORE PTE LTD.
SHIMADZU ANALYTICAL (INDIA) PVT. LTD.
SHIMADZU MEDICAL (INDIA) PVT. LTD.
SHIMADZU PHILIPPINES CORPORATION
SHIMADZU PHILIPPINES MANUFACTURING INC.
SHIMADZU VIETNAM MEDICAL HI-TECH COMPANY LTD.
SHIMADZU SCIENTIFIC INSTRUMENTS (OCEANIA) PTY. LTD.
SHIMADZU MEDICAL SYSTEMS (OCEANIA) PTY. LTD.
Asia & Oceania
SHIMADZU (HONG KONG) LTD.
SHIMADZU (CHINA) CO., LTD.
BEIJING SHIMADZU MEDICAL EQUIPMENT CO., LTD.
TIANJIN SHIMADZU HYDRAULIC EQUIPMENT CO., LTD.
SHIMADZU (SUZHOU) INSTRUMENTS MANUFACTURING CO., LTD.
SHIMADZU (GUANGZHOU) ANALYSIS & TECHNOLOGY SERVICES CO., LTD.
NINGBO SHIMADZU VACUUM TECHNOLOGY DEVELOPMENT CO., LTD.
SHIMADZU RESEARCH LABORATORY (SHANGHAI) CO., LTD.
SHIMADZU-GL SCIENCES (SHANGHAI) LABORATORY SUPPLIES CO., LTD.
SHIMADZU SCIENTIFIC INSTRUMENTS (TAIWAN) CO., LTD.
SHIMADZU TAIWAN INDUSTRIAL MACHINERY CO., LTD.
Dong-il SHIMADZU Corporation
SHIMADZU KOREA VACUUM EQUIPMENT CO., LTD.
China and Southeast Asia
SHIMADZU AMERICA INC.
SHIMADZU SCIENTIFIC INSTRUMENTS, INC.
SHIMADZU PRECISION INSTRUMENTS, INC.
Shimadzu Aircraft Equipment USA
Shimadzu Medical Systems USA
Shimadzu Industrial Equipment USA
SHIMADZU U.S.A. MANUFACTURING, INC.
KRATOS ANALYTICAL, INC.
SHIMADZU SOFTWARE DEVELOPMENT CANADA INC.
North America
Sanjo Works at Kyoto Head Office
Japan
Analytical Application Center (Germany)
Analytical Instrument Manufacturing Plant (U.S.)
Training Center (Turkey) Medical System Manufacturing Plant (China)

Solutions for Biopharmaceuticals A
nalysis
This data was not obtained from an instrument notified, authenticated, or approved in accordance with the Japanese Pharmaceutical Affairs Law.
Company names, product/service names and logos used in this publication are trademarks and trade names of Shimadzu Corporation or its affiliates, whether or not they are used with trademark symbol “TM” or “®”.Third-party trademarks and trade names may be used in this publication to refer to either the entities or their products/services. Shimadzu disclaims any proprietary interest in trademarks and trade names other than its own.
For Research Use Only. Not for use in diagnostic procedures. The contents of this publication are provided to you “as is” without warranty of any kind, and are subject to change without notice. Shimadzu does not assume any responsibility or liability for any damage, whether direct or indirect, relating to the use of this publication.
© Shimadzu Corporation, 2015www.shimadzu.com/an/
Recommended