Soil capability assessment for expanding irrigated agriculture in the Irwin focus area and surrounding lands
Resource management technical report 408


Soil capability assessment for expanding irrigated agriculture in the Irwin focus area and surrounding lands
Resource management technical report 408
Ted Griffin, Angela Stuart-Street and Peter Tille

© Western Australian Agriculture Authority (Department of Primary Industries and Regional Development), 2019
ISSN 1039-7205
Cover: Red loamy earth soil close to the Irwin River (photo: L van Wyk)
Unless otherwise indicated, Soil capability assessment for expanding irrigated agriculture in the Irwin focus area and surrounding lands by Department of Primary Industries and Regional Development is licensed under a Creative Commons Attribution 3.0 Australian Licence. This report is available at dpird.wa.gov.au.
The Creative Commons licence does not apply to the State Crest or logos of organisations.
Recommended reference Griffin, EA, Stuart-Street, A & Tille, PJ 2019, ‘Soil capability assessment for the expansion of irrigated agriculture in the Irwin focus area and surrounding lands’, Resource management technical report 408, Department of Primary Industries and Regional Development, Perth.
Disclaimer The Chief Executive Officer of the Department of Primary Industries and Regional Development, and the State of Western Australia accept no liability whatsoever by reason of negligence or otherwise arising from the use or release of this information or any part of it.
Copies of this document are available in alternative formats upon request.
Department of Primary Industries and Regional Development 3 Baron-Hay Court, South Perth WA 6151 Telephone: +61 (0)8 9368 3333 Email: [email protected] Website: dpird.wa.gov.au

iii
Contents Acknowledgements .................................................................................................. iv
Summary .................................................................................................................... v
1 Introduction ....................................................................................................... 1
1.1 Midlands Water for Food ...................................................................................... 1 1.2 Irwin survey area .................................................................................................. 4
2 Survey area assessment .................................................................................. 6
2.1 Field survey procedure ......................................................................................... 6 2.2 Sampling and lab analyses .................................................................................. 7 2.3 Soil-landscape mapping review ............................................................................ 8 2.4 Land capability analysis ....................................................................................... 9
3 Geology ............................................................................................................ 12
3.1 Generalised depositional history ........................................................................ 12 3.2 Irwin survey area ................................................................................................ 13 3.3 Hydrogeology ..................................................................................................... 16
4 Geomorphology and soil-landscapes ........................................................... 17
4.1 Geomorphology .................................................................................................. 17 4.2 Soil-landscapes .................................................................................................. 17 4.3 Main soils ........................................................................................................... 20
5 Land capability for horticulture ..................................................................... 27
5.1 Very high (Class 1) to high (Class 2) capability land ........................................... 31 5.2 Fair capability land (Class 3) .............................................................................. 31 5.3 Low (Class 4) to very low (Class 5) capability land ............................................. 32 5.4 Soil salinity and crop tolerances ......................................................................... 33 5.5 Conclusion ......................................................................................................... 34
Appendixes .............................................................................................................. 35
Appendix A Land capability assessment .............................................................. 36
A1 Land quality codes used in ratings tables ........................................................... 36 A2 Land capability ratings tables ............................................................................. 37 A3 Example of proportional map unit capability ratings ............................................ 39 A4 Irrigation salinity hazard ..................................................................................... 40
Appendix B Description of soil-landscape subsystem map units ...................... 43
Appendix C Chemistry results from deep drilling sites ....................................... 45
Appendix D WA soil groups and representative soil profiles .............................. 49
Appendix E Predicted crop yield reductions at varying levels of soil salinity in sand, loam and clay .................................................................................... 62
Shortened forms ...................................................................................................... 64
References ............................................................................................................... 65

iv
Acknowledgements Funding through Royalties for Regions made this investigation possible. The Department of Primary Industries and Regional Development (DPIRD), through the Midlands Water for Food Project, conducted this study, which aims to support the expansion of irrigated agriculture in the Northern Perth Basin.
We would like to thank the local landowners who provided access to their land and invaluable knowledge of agricultural enterprises in the area. In particular, we thank landholders and managers who permitted us to access their land for our investigations, including Peter Kupsch, Tim Macnamara, Geoff Crabb and Sally O'Brien.
We also thank DPIRD staff Leon van Wyk, Russell Speed, Tim Pope, Nick Wright and Adele Killen for collaborating on the field survey, and John Bruce for GIS support and information sourcing. Noel Schoknecht and Don Bennett gave peer review comments, and KB Editing and Angela Rogerson edited the report.

v
Summary The Midlands groundwater and land assessment is a $4.7 million Water for Food project using Royalties for Regions funding. It is seeking to confirm groundwater availability in focus areas that may form precincts of 2000–3000ha suitable for intensive irrigated horticulture. Irwin is one of these.
The Department of Water identified the Irwin focus area for investigation for irrigated agriculture potential. It covers almost 7000ha to the east of Dongara in the Mid West region of Western Australia.
This report provides the land assessment for the Irwin area. We expanded the investigation to include land outside of the focus area because our review of the regional soil-landscape mapping indicated that this land had potential for irrigated agriculture. This ‘survey area’ covers about 34 000ha.
This report details the soil-landscapes in the Irwin survey area and provides related information, including:
• descriptions of geology, geomorphology and the soils • an outline of the capability of the soil and land for irrigated horticulture.
To provide a better assessment for irrigated agriculture, we remapped the previous 1:250 000 soil-landscapes of the survey area at the more-detailed scale of 1:100 000. We described 117 soil sites and 15 of these received a significant amount of laboratory analyses.
Our assessment found that over half of the soils in the survey area have moderate to good capability for horticulture (Table A, Figures A and B), with the following limitations:
• The available water is unsuitable for irrigation. Exploratory drilling found that the groundwater contains brackish water of more than 1500 milligrams per litre (mg/L) total dissolved solids, which exceeds the tolerances of many commercial horticulture crops and is likely to cause long-term structural degradation and irrigation salinity. This would be a significant issue for the fertile clays of the alluvial plains.
• The fertile Yardarino Flats have moderate amounts of salt at depth in some areas. While this is not a risk for broadacre agriculture, irrigating these soils may cause the watertable to rise and bring salt closer to the rooting zone. High evaporation may also lead to salt concentrating at the soil surface.
• The alluvial soils have highly sodic subsoils, indicating poor drainage and a risk of waterlogging. The boron levels of some subsoils are high enough to limit root growth of some crops.
• The wind erosion risk is high for most sandy-surfaced soils, so investment in soil management would be required, especially for annual horticulture.
• With the high evaporation and the need to control wind erosion, irrigation in this area has a high water-use requirement.
• The use of poorer quality water for irrigation can also be problematic on the sandy slopes surrounding the clayey alluvial flats, potentially leading to a build-up of salt in the subsoil.

vi
Apart from small, niche opportunities, water of a suitable quality in the quantities required for extensive irrigated agriculture development is not generally available in the Irwin area. Dryland cropping and grazing would be the preferred land uses on the highly productive alluvial flats, and irrigation on the surrounding sandplain would require careful management. Table A Area of annual and perennial hort iculture capabi l i ty codes in the Irwin survey area
Capability code
Area of annual horticulture Area of perennial horticulture
(ha) (%) (ha) (%) A1 188 1 188 1 A2 1 253 4 1 253 4 B1 19 223 57 18 611 55 B2 6 782 20 5 263 16 C1 4 209 12 3 050 9 C2 2 078 6 5 368 16
Note: The capability assessment assumes that management practices incorporate wind erosion
control. Figure A Land capabil i ty map for annual hort iculture in the Irwin survey area

vii
Note: The capability assessment assumes that management practices incorporate wind erosion
control. Figure B Land capabil i ty map for perennial hort iculture in the Irwin survey area

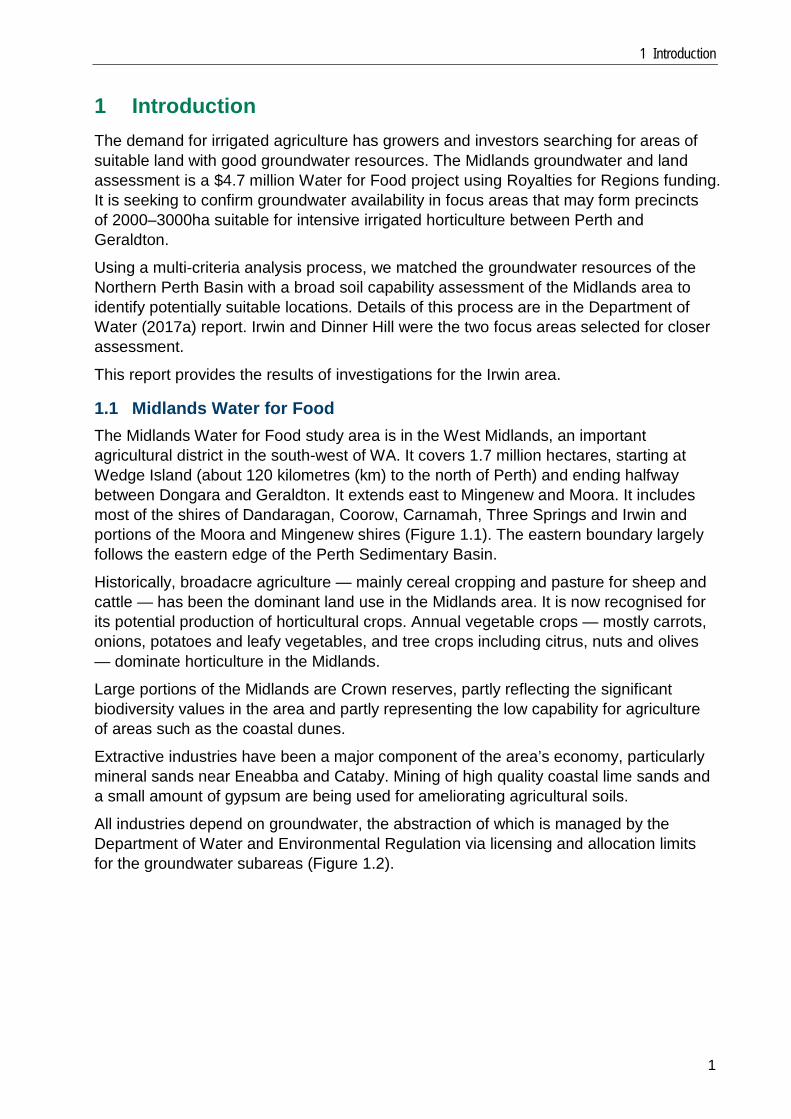
1 Introduction
1
1 Introduction The demand for irrigated agriculture has growers and investors searching for areas of suitable land with good groundwater resources. The Midlands groundwater and land assessment is a $4.7 million Water for Food project using Royalties for Regions funding. It is seeking to confirm groundwater availability in focus areas that may form precincts of 2000–3000ha suitable for intensive irrigated horticulture between Perth and Geraldton.
Using a multi-criteria analysis process, we matched the groundwater resources of the Northern Perth Basin with a broad soil capability assessment of the Midlands area to identify potentially suitable locations. Details of this process are in the Department of Water (2017a) report. Irwin and Dinner Hill were the two focus areas selected for closer assessment.
This report provides the results of investigations for the Irwin area.
1.1 Midlands Water for Food The Midlands Water for Food study area is in the West Midlands, an important agricultural district in the south-west of WA. It covers 1.7 million hectares, starting at Wedge Island (about 120 kilometres (km) to the north of Perth) and ending halfway between Dongara and Geraldton. It extends east to Mingenew and Moora. It includes most of the shires of Dandaragan, Coorow, Carnamah, Three Springs and Irwin and portions of the Moora and Mingenew shires (Figure 1.1). The eastern boundary largely follows the eastern edge of the Perth Sedimentary Basin.
Historically, broadacre agriculture — mainly cereal cropping and pasture for sheep and cattle — has been the dominant land use in the Midlands area. It is now recognised for its potential production of horticultural crops. Annual vegetable crops — mostly carrots, onions, potatoes and leafy vegetables, and tree crops including citrus, nuts and olives — dominate horticulture in the Midlands.
Large portions of the Midlands are Crown reserves, partly reflecting the significant biodiversity values in the area and partly representing the low capability for agriculture of areas such as the coastal dunes.
Extractive industries have been a major component of the area’s economy, particularly mineral sands near Eneabba and Cataby. Mining of high quality coastal lime sands and a small amount of gypsum are being used for ameliorating agricultural soils.
All industries depend on groundwater, the abstraction of which is managed by the Department of Water and Environmental Regulation via licensing and allocation limits for the groundwater subareas (Figure 1.2).

Soil capability assessment for Irwin
2
Figure 1.1 Midlands study area showing the Irwin survey area and the Dinner Hi l l focus area

1 Introduction
3
Figure 1.2 Groundwater areas for the Midlands study area

Soil capability assessment for Irwin
4
1.2 Irwin survey area The Irwin survey area is 16km east of Dongara, straddling the Irwin River to the east of the Brand Highway. The original Irwin focus area, identified by Department of Water (2017a), covered around 7000ha, including the flats adjacent to the Irwin River and the Yardarino Flats running south from the river (Figure 1.3).
For a more inclusive review of the soils and landscapes of the lower Irwin valley area, we expanded the focus area to the north-west and south. This expanded area, called the Irwin survey area, now covers almost 34 000ha of land, extending from the Midlands Road, north almost to Mount Horner West Road and a couple of kilometres to the south of Ejarno Spring Road (Figure 1.3).
It includes the Yardarino Flats north and south of the Irwin River as well as the elevated terrain surrounding the river and Yardarino Flats.
In the north, the survey area incorporates 10 700ha of the Allanooka public drinking water source area (Department of Water 2017b) where there are restrictions on the use of groundwater. A declaration of ‘priority 2’ covers this entire portion, in which market gardens are incompatible, but perennial horticulture and irrigated pasture are compatible with conditions (Department of Water 2017b).1
For the Irwin survey area, this report provides:
• a description of the geology, geomorphology and soils • an outline of the soil capability for irrigated horticulture.
Unlike in the companion soil capability report for the Dinner Hill focus area (Griffin et al. 2019), land management units for irrigated agriculture are not described here because:
• the available water is low quality (Bownds 2018) • there is a significant hydrology hazard if water was to be used for irrigation (Speed &
Killen 2018).
1 Priority 2 areas are defined and managed to maintain or improve the quality of the drinking
water source, with the objective of minimising risk (Department of Water 2016).

1 Introduction
5
Figure 1.3 Locat ion and boundaries of the original Irwin focus area and the expanded Irwin survey area, with soi l- landscape zones
Survey area
Soil capability assessment for Irwin
6
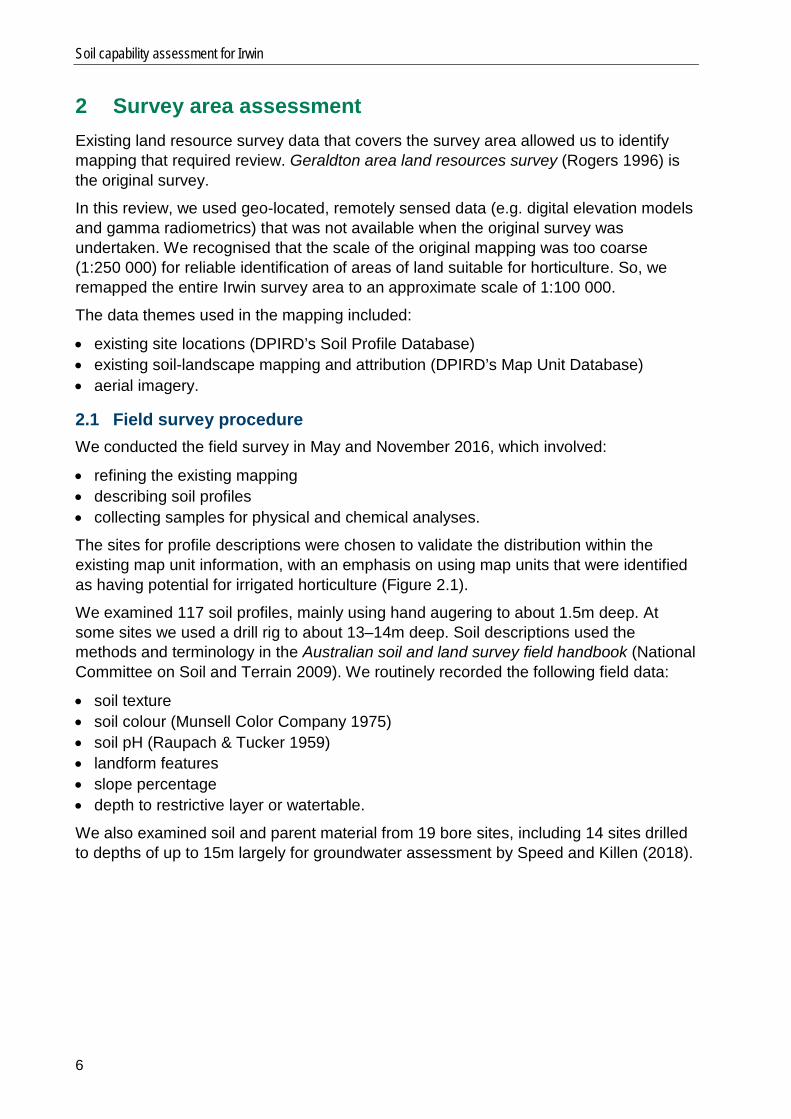
2 Survey area assessment Existing land resource survey data that covers the survey area allowed us to identify mapping that required review. Geraldton area land resources survey (Rogers 1996) is the original survey.
In this review, we used geo-located, remotely sensed data (e.g. digital elevation models and gamma radiometrics) that was not available when the original survey was undertaken. We recognised that the scale of the original mapping was too coarse (1:250 000) for reliable identification of areas of land suitable for horticulture. So, we remapped the entire Irwin survey area to an approximate scale of 1:100 000.
The data themes used in the mapping included:
• existing site locations (DPIRD’s Soil Profile Database) • existing soil-landscape mapping and attribution (DPIRD’s Map Unit Database) • aerial imagery.
2.1 Field survey procedure We conducted the field survey in May and November 2016, which involved:
• refining the existing mapping • describing soil profiles • collecting samples for physical and chemical analyses.
The sites for profile descriptions were chosen to validate the distribution within the existing map unit information, with an emphasis on using map units that were identified as having potential for irrigated horticulture (Figure 2.1).
We examined 117 soil profiles, mainly using hand augering to about 1.5m deep. At some sites we used a drill rig to about 13–14m deep. Soil descriptions used the methods and terminology in the Australian soil and land survey field handbook (National Committee on Soil and Terrain 2009). We routinely recorded the following field data:
• soil texture • soil colour (Munsell Color Company 1975) • soil pH (Raupach & Tucker 1959) • landform features • slope percentage • depth to restrictive layer or watertable.
We also examined soil and parent material from 19 bore sites, including 14 sites drilled to depths of up to 15m largely for groundwater assessment by Speed and Killen (2018).

2 Survey area assessment
7
Figure 2.1 Soi l s ites in the Irwin survey area
2.2 Sampling and lab analyses There was little soil chemistry data available for sites in the area before this study. We took samples from 26 sites, and from these, we submitted about 580 fine-earth (<2mm) samples to CSBP Limited (Australian fertiliser and chemical company) for laboratory analysis of:
• clay, silt and sand percentage • calcium carbonate (CaCO3) percentage • electrical conductivity (EC) 1:5 (water) • pH 1:5 (water and calcium chloride [CaCl2]) • organic carbon Walkley and Black • nitrogen (total ammonia (NH4) and nitrate (NO3)) • phosphorus (extractable in hydrogen carbonate, HCO3) • potassium (extractable in HCO3)
Survey area
Soil capability assessment for Irwin
8
• iron, copper, zinc and manganese (extractable in DTPA [diethylene triamine pentaacetic acid] method)
• sulfur (extractable in potassium chloride, KCl) • boron (extractable in CaCl2) • exchangeable cations of calcium, potassium, magnesium, sodium and aluminium.
We sent another 12 samples to ChemCentre for mineralogy, to identify the most likely clay minerals present in the parent material.
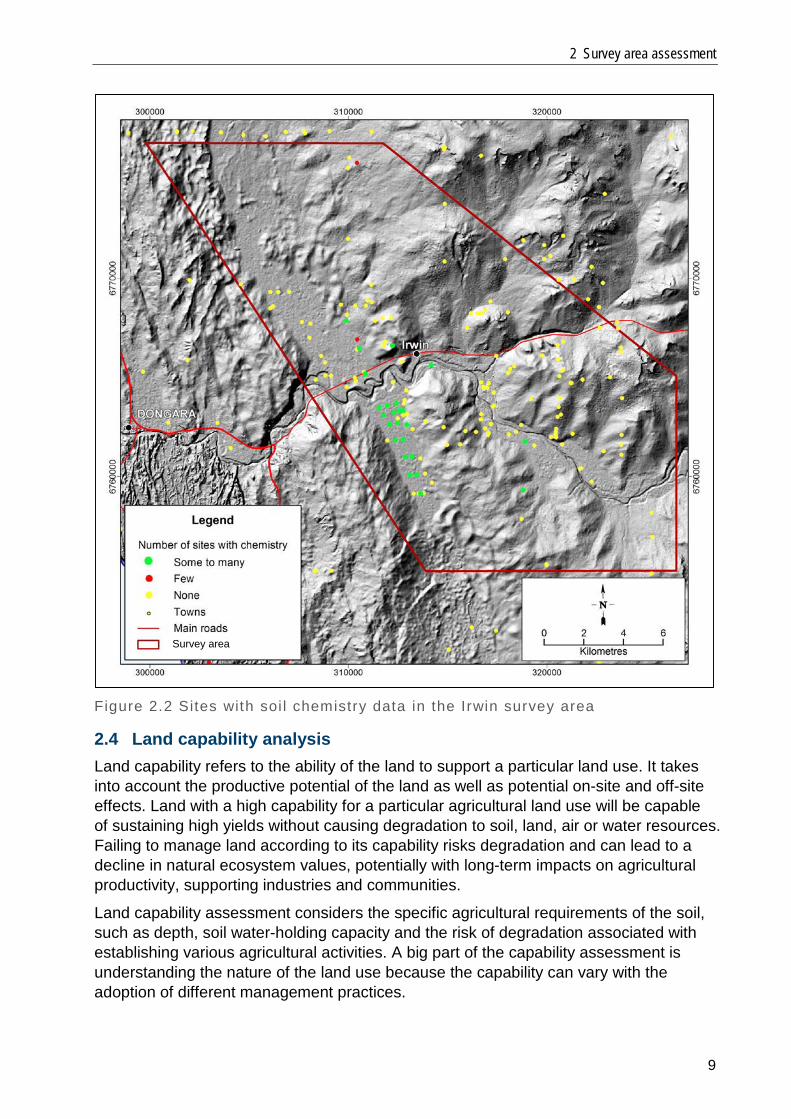
Figure 2.2 shows the sites in the Irwin survey area for which chemistry data is now available.
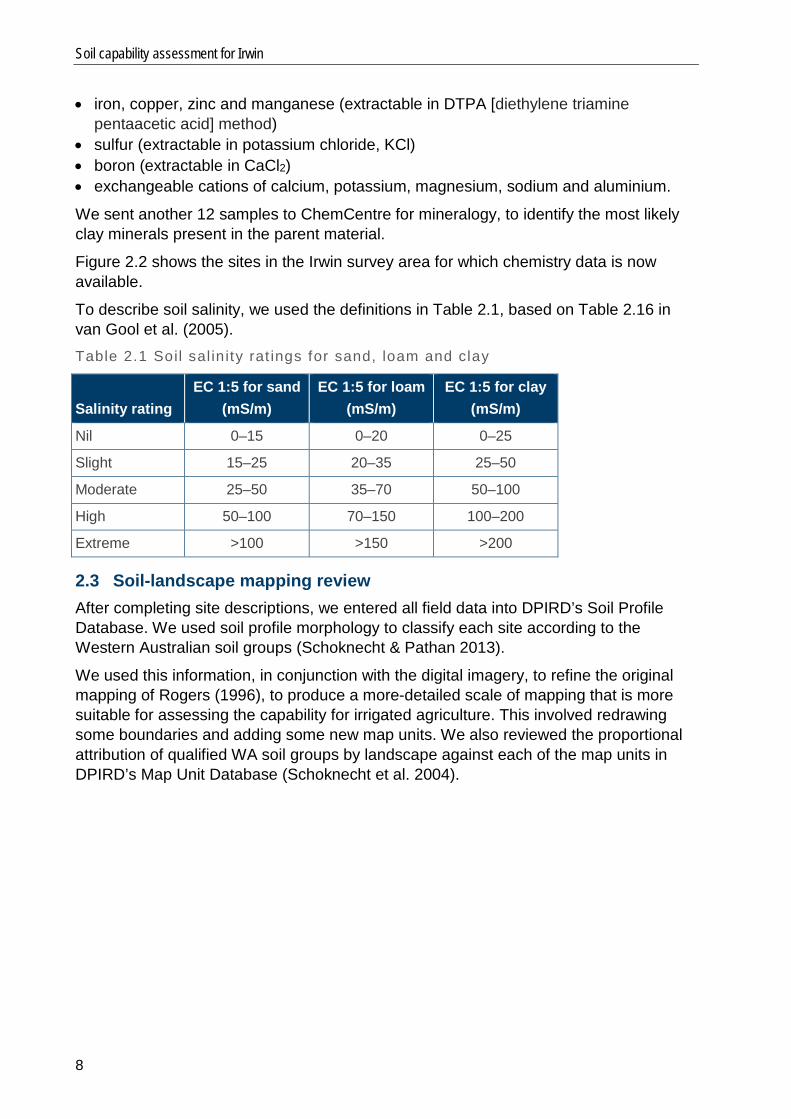
To describe soil salinity, we used the definitions in Table 2.1, based on Table 2.16 in van Gool et al. (2005). Table 2.1 Soil sal inity rat ings for sand, loam and clay
Salinity rating
EC 1:5 for sand (mS/m)
EC 1:5 for loam (mS/m)
EC 1:5 for clay (mS/m)
Nil 0–15 0–20 0–25
Slight 15–25 20–35 25–50
Moderate 25–50 35–70 50–100
High 50–100 70–150 100–200
Extreme >100 >150 >200
2.3 Soil-landscape mapping review After completing site descriptions, we entered all field data into DPIRD’s Soil Profile Database. We used soil profile morphology to classify each site according to the Western Australian soil groups (Schoknecht & Pathan 2013).
We used this information, in conjunction with the digital imagery, to refine the original mapping of Rogers (1996), to produce a more-detailed scale of mapping that is more suitable for assessing the capability for irrigated agriculture. This involved redrawing some boundaries and adding some new map units. We also reviewed the proportional attribution of qualified WA soil groups by landscape against each of the map units in DPIRD’s Map Unit Database (Schoknecht et al. 2004).
2 Survey area assessment
9
Figure 2.2 Sites with soi l chemistry data in the Irwin survey area
2.4 Land capability analysis Land capability refers to the ability of the land to support a particular land use. It takes into account the productive potential of the land as well as potential on-site and off-site effects. Land with a high capability for a particular agricultural land use will be capable of sustaining high yields without causing degradation to soil, land, air or water resources. Failing to manage land according to its capability risks degradation and can lead to a decline in natural ecosystem values, potentially with long-term impacts on agricultural productivity, supporting industries and communities.
Land capability assessment considers the specific agricultural requirements of the soil, such as depth, soil water-holding capacity and the risk of degradation associated with establishing various agricultural activities. A big part of the capability assessment is understanding the nature of the land use because the capability can vary with the adoption of different management practices.
Survey area

Soil capability assessment for Irwin
10
Annual horticulture production is an intensive agricultural industry with respect to operational management and the effect on land and water resources. This means that future horticultural development needs close alignment to the capability of each area’s landforms and soils to maximise production and avoid adverse impacts on land and water resources.
2.4.1 Land capability ratings We based land capability ratings for annual and perennial horticulture on the methodology described by van Gool et al. (2005). For both land uses, we assigned a rating from 1 to 5 (Table 2.2). Table 2.2 Land capabi l i ty c lasses
Capability class General description
1 – Very high Very few physical limitations present and easily overcome. Risk of land degradation is negligible.
2 – High Minor physical limitations affecting either productive land use and/or risk of degradation. Limitations can be overcome by careful planning.
3 – Fair Moderate physical limitations significantly affect productive land use and/or risk of degradation. Careful planning and conservation measures are required.
4 – Low High degree of physical limitation not easily overcome by standard development techniques and/or resulting in high risk of degradation. Extensive conservation measures are required.
5 – Very low Severe limitations. Use is usually prohibitive in terms of development costs or the associated risk of degradation.
The ratings tables we used to determine capability for annual and perennial horticulture are modified versions of those presented by van Gool et al. (2005). The land qualities and ratings tables for annual and perennial horticulture land uses are presented in Appendix A (Tables A1, A2 and A3).
We adopted some modifications from Tille et al. (2013) that are particularly relevant to the sandy soils that dominate the survey area. These include incorporating land qualities for soil water storage within the top 50cm of the profile and inherent soil fertility.
Variation in the grain size and clay content of these sands will affect the soil’s ability to store added water and nutrients in the root zone. The lower the storage capacity of the sands, the greater difficulty of combined management of irrigation and fertiliser applications to maintain production. This is particularly evident during the warmer summer months when there is less margin for error due to higher temperatures, strong daily sea breezes and elevated levels of evaporation.
Without careful management, water and nutrients are likely to move below the root zone of crops on these sands. This is not only a waste of limited water resources, it can lead to poor crop performance, unless more irrigation and fertiliser is applied, leading to even greater expense. It is also likely to contribute to off-site problems such as eutrophication of waterways.

2 Survey area assessment
11
The ratings tables used in this report also adopt Tille et al.’s (2013) modifications for wind erosion hazard. The ratings tables assume that erosion control measures — for example, keeping the soil surface moist when it is bare and disturbed, and using wind breaks — are part of these land uses.
Such control measures are an important part of managing horticultural production on sandy soils in this dry, windy environment.
We developed a land quality for use in this study, termed ‘Irrigation salinity hazard’. This assesses the potential for salinity to develop under regular irrigation. It takes into account factors such as profile permeability, existing salt storage, slope gradients and landforms. Salinity is of particular concern on the clay flats of the Irwin River because of the marginal quality of the main groundwater resource in the area (Bownds 2018). Our methodology for assessing irrigation salinity hazard is described in Appendix A4 and this replaces the land quality ‘Site drainage potential’.
2.4.2 Land capability mapping We assessed land capability ratings for each of the soil and landform combinations assigned to the map units in DPIRD’s Map Unit Database (Table A4 in Appendix A3 shows an example). Because of the range of soil and landform combinations, most map units have more than one capability class rating and these are assigned proportionally. To present capability on a map, a capability code (Table 2.3) that is based on these proportions is assigned to each map unit (Table A5 in Appendix A3 shows an example). Table 2.3 Map unit capabi l i ty codes
Codea Map unit capability description
A1 Dominantly high (>70% of the map unit is Class 1 or 2)
A2 Mostly high (50–70% of the map unit is Class 1 or 2)
B1 Dominantly fair (70% of the map unit is Class 1 or 2 or 3)
B2 Mostly fair (50–70% of the map unit is Class 1 or 2 or 3)
C1 Mostly low (50–70% of the map unit is Class 4 or 5)
C2 Dominantly low (70% of the map unit is Class 4 or 5)
a For more explanation about map unit capability codes, see Section 3.7 in van Gool et al. (2005).
Note: See Table 2.2 for definitions of the classes.

Soil capability assessment for Irwin
12
3 Geology The geology underlying the survey area is the largely unconsolidated Cenozoic sediments, which partially overlie the thick Mesozoic Yarragadee Formation (sandstone with shale and siltstone). In the survey area, the dominant Cenozoic sediments are the Tamala Limestone, as well as a complex of alluvium, colluvium and aeolian deposits. The boundary of the surface expression of Mesozoic and Cenozoic sediments is roughly the soil-landscape zone boundary depicted in Figure 1.3.
3.1 Generalised depositional history The depositional history of the alluvial plains flanking the lower Irwin River is significant in the formation of present-day soils, landforms and hydrology. The sea level variation of at least 200m and cycles of deposition of the Tamala Limestone (e.g. Siddall et al. 2006 and Brooke et al. 2014) had a major influence on the alluvium, colluvium and aeolian deposits in this area. Our view of the likely depositional history is described below.
By the late Tertiary (about five million years ago), the Mesozoic sediments of the Perth Basin had, through tectonic movement, dipped to the east, but the land surface had been eroded to be nearly level. The coastline was west of its present position. At the end of the Tertiary (the Pliocene), the sea level rose to about 100m above the present level (Commander 2003), significantly eroding the Mesozoic sediments and forming sea cliffs much like those on the present Murchison coast. Today, the residue of the sea cliffs between Irwin and Bullsbrook is the Gingin Scarp (equivalent to the Whicher Scarp south-east of Busselton). Therefore, the surface of the Mesozoic sediments was at two levels: an inclined sea floor, and a residual land surface more than 100m above that.
Since the early Pleistocene, the sea level fell to about 100m below the present level and returned to near present levels a number of times (Figure 2.10 of Smith et al. 2012). As it initially fell, the first sediments deposited on the truncated Mesozoic sediments were sequences of terrestrial colluvium and alluvium that, in places, overlay shoreline and beach deposits. The sea became a major source of sediments that were initially quartz, but increasingly became shelly, sands. These accumulated on the coastline and blew in a north-north-easterly direction to form complex ridges of attenuated parabolic dunes. Lipar and Webb (2015) demonstrated that there were a number of discrete periods of overlying deposition.
During the Pleistocene, these coastal dunes formed a barrier dune system. Landward of the barrier dunes, terrestrial sediments accumulated in a backplain. This feature extended up the western coast of WA, including the Irwin survey area. Lowry (1974) referred to the backplain that is south of the survey area (between Eneabba and Beharra Springs) as the ‘Eneabba Plain’. The backplain in the survey area is identified as the Yardarino Flats.
The western coast backplain includes a complex of overlapping deposits that are mainly colluvium and alluvium, and levelled by swamps. Recognised geological units include the Yoganup, Guildford and Ascot formations and the Bassendean Sands. The Yoganup Formation is a Pliocene shoreline deposit that occurs at the base of the

3 Geology
13
backplain sequence in the Beharra area and south to the Whicher Scarp. It includes deposits of mineral sands.
3.2 Irwin survey area Figure 3.1 shows an estimated location (as a dashed line) of the Pliocene sea cliff (Gingin Scarp) in the survey area. This is roughly the boundary between the Arrowsmith and the Geraldton Coastal soil-landscape zones shown in Figure 1.3.
Note: Black linework indicates the 100m above sea level (mASL) contours. Labels ‘GS’ and ‘IV’
are bore locations. Figure 3.1 Irwin survey area elevation on shaded rel ief , showing the approximate locat ion of the Pliocene sea cl if f (Gingin Scarp)
Cross-sections in Figure 51 of Department of Water (2017c) provide an interpretation of the relative placement of the Cenozoic deposits over the Mesozoic sediments. Beneath the backplain, the Mesozoic sediments are about 30m below the present ground surface (e.g. bore GS18 (Koomberi 1994)).
Survey area

Soil capability assessment for Irwin
14
The Arrowsmith Zone in the east of the survey area is weathered Mesozoic sediments with significant colluvium and minor alluvium. Several episodes of dunes and sand sheets cloak the western slopes; most likely having occurred during arid periods.
West of the Gingin Scarp, in the Geraldton Coastal Zone, the Cenozoic sediments are a complex of overlaying dunes and alluvium. The western limestone ridge (Tamala Limestone) formed the major barrier dune that contained the Irwin River to deposit the sediments of the Yardarino Flats backplain.
Figure 3.2 is our interpretation of the sediments along a west-to-east transect through bore site GS18 (shown on Figure 3.1). It follows the models of Kern (1997) rather than Kern and Koomberi (2013) because the latter did not recognise the Yardarino Flats and appears to have over-interpreted the thickness of the Tamala Limestone.
Figure 3.2 Our interpreted cross-section through bore site GS18 (see Figure 3.4 for transect location)
The Cenozoic Guildford Formation is a clayey alluvium about 10m below the current land surface in the GS18 bore. In the survey area, the Irwin River is the main source of the alluvium.
While there is little stratigraphic documentation of the Cenozoic sediments in the Yardarino Flats, there is evidence of complex patterns of sedimentation, both in terms of material deposited and the deposition environment.
The overlying thick, clayey deposits that now dominate the Yardarino Flats backplain likely came from the Irwin River.
The periods when the barrier dunes blocked the Irwin River are very significant to the survey area. The presence of limestone on the plain and the hillslopes of the eastern side of the plain is evidence that shelly (lime) sand dunes crossed the plain. This would have occurred in a relatively arid period, probably with sea levels similar to the present day. Judging by the lower depth of the limestone observed in bore GS18, the surface of the plain was probably about 10m below the present level.
We are not certain if the whole plain has a layer of calcarenite (limestone) beneath it because there is little evidence of it in the banks of the Irwin River, and bores GS17, IV9-77 and IV10-77 (Figure 3.1) had no limestone layers. Since that pulse of lime sands
Inferred Pliocene surfaceAeolian sand
Colluvium and sea depositsAlluvium and swamp
Tamala limestoneMesozoic sediments
0
20
40
60
80
100
120
0 1 2 3 4 5 6 7 8
Chart Title
Yardarino Flats
Irwin River flats
Elev
ation
(metr
es
abov
e sea
leve
l)
Distance (km)

3 Geology
15
Aeolian sandColluvium and sea depositsAlluvium and swamp
Tamala limestone
Irwin River
occurred, there have been additional alluvial and swamp deposits. The swamps are likely to have existed for thousands of years for the smectite clays, the silcretes and diatomaceous sediments to form. Blandford (2008) suggests that these were created less than 100 000 years ago.
The quartz sandy dunes on the plain and the eastern flanking hillslopes are likely to be the result of a redistribution of sand from within the plain. Krauss et al. (2006) and Enright et al. (2003) dated similar dunes from the Eneabba Plain at 15 000–35 000 years old. Like the Bassendean Dunes to the south, these are generally assigned to the early Pleistocene-aged Bassendean (Mory 1995, Department of Water 2017c).
With the most recent opening of the Tamala Limestone barrier, the Irwin River has etched into its own alluvium.
While the Yardarino Flats appear level, the river margin is higher than the plain, more so on the land north of the river than the south (Figure 3.3). Beyond the southern dunes of the Yardarino Flats, the backplain of the Beharra area is significantly lower again. The eastern edge of the plain close to the Irwin River is the highest portion (Figure 3.4), perhaps indicating that this area received preferential deposition of alluvium from the river while the Tamala Limestone barrier was in place.
Figure 3.3 North–south cross-sect ion of the Yardarino Flats, cover ing the full extent of the survey area (see Figure 3.4 for transect location)
The alluvium of the Irwin River to the east of the Gingin Scarp is similar to the alluvium of the plain, even with elevations rising to the east. The cracking clay and diatomite within this eastern alluvium indicates that swamps were once present. Where the stream channel has comparably etched below the alluvial plain, there are more recently deposited sands and loams.
North of river
Distance (km)
South of river
Elev
ation
(metr
es ab
ove
sea l
evel)

Soil capability assessment for Irwin
16
Figure 3.4 Elevation of the Yardarino Flats, with thick black l ines representing cross-sect ions in Figures 3.2 and 3.3
3.3 Hydrogeology For a detailed account of the groundwater of the Irwin area as part of the larger Northern Perth Basin, see Department of Water (2017c). The details of drilling conducted for this project in the Irwin survey area by Department of Water and Environmental Regulation are presented in a bore completion report (Bownds & Paker 2018) and a groundwater investigation report (Bownds 2018).
Soaks and springs occur along and adjacent to the Irwin River. These are expressions of the regional groundwater. Details of groundwater-dependent environmental values for this area are presented in Department of Water and Environmental Regulation (2018).
Speed and Killen (2018) conducted a hydrological hazard assessment for irrigated agriculture for the Irwin focus area.

4 Geomorphology and soil-landscapes
17
4 Geomorphology and soil-landscapes 4.1 Geomorphology The geomorphology of the Irwin survey area is summarised here in the framework of soil-landscape zones. The Arrowsmith Soil-landscape Zone and Geraldton Coastal Soil-landscape Zone are broad units that subdivide the landscape based on geomorphology, geology, vegetation and climate. As described previously, the Gingin Scarp is roughly the boundary between the two zones (Figure 1.3).
4.1.1 Arrowsmith Zone (224) In the east of the survey area, the Arrowsmith Zone landforms are generally undulating plains with residual crests, long colluvial slopes and narrow depressions that are mostly sand-filled.
The western margin of the zone reflects both erosion and deposition. The initial erosion was the breakdown of the Pliocene sea cliff through colluviation and formation of alluvial fans. Several phases of dunes formed from sand blown from the Yardarino Flats. Initial phases were shelly sands, now leached to calcrete. More recently, quartz sand blew across the flats to several kilometres east of the plain, forming dunes and sandsheets.
The Irwin River alluvium in this zone shows evidence of antiquity and complexity. The fringes have swamp and paleo-swamp features. The body of the plain has cracking clays consistent with those of the Yardarino Flats. The river has incised into this plain and it is fringed with recent alluvium composed mainly of sandy and loamy materials.
4.1.2 Geraldton Coastal Zone (221) The lithified dunes in the west of the survey area have largely leached and cemented to create the calcrete ridges and sandy slopes. Small limestone cliffs remain from the rejuvenation of the Irwin River when it breached the limestone barrier dune.
The Yardarino Flats are essentially an ancient swamp with recent alluvium close to the river. As indicated above, the river has significantly etched into the plain. To the north of the plain there are sandsheets and low sand dunes, generally formed from redistributed sandy swamp soils. A few calcrete-capped rises are dotted across the plain as relicts of a much earlier line of sand dunes.
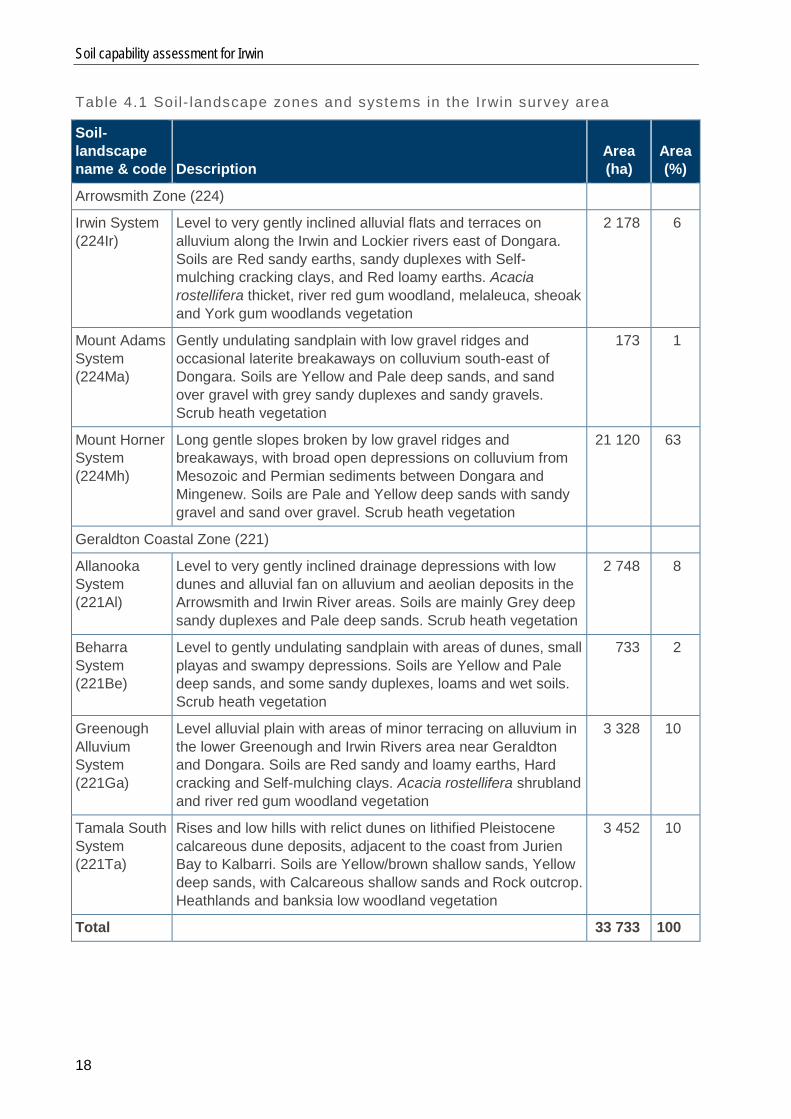
4.2 Soil-landscapes In the Irwin survey area, we subdivided the two soil-landscape zones into seven soil-landscape systems (Table 4.1 and Figure 4.1), which are further split into 22 soil-landscape subsystems and phases — Schoknecht et al. (2004) explains these terms. These are described individually in Appendix B. We also identified a new soil-landscape system, the Beharra System (221Bh), in the south-west corner of the survey area (Figure 4.1).
We subdivided some existing map units. For example, Mount Horner System (224Mh) has new subsystems and associated soils identified, including Swamps (224MhSW), Sandsheets (224MhS) and Dunes (224MhD). The mapping now separates the upper alluvial flats along the river east of the Gingin Scarp (Irwin System, 224Ir) from the lower alluvial flats and adjoining Yardarino Flats (Greenough Alluvium System, 221Ga).
Soil capability assessment for Irwin
18
Table 4.1 Soil- landscape zones and systems in the Irwin survey area
Soil-landscape name & code Description
Area (ha)
Area (%)
Arrowsmith Zone (224)
Irwin System (224Ir)
Level to very gently inclined alluvial flats and terraces on alluvium along the Irwin and Lockier rivers east of Dongara. Soils are Red sandy earths, sandy duplexes with Self-mulching cracking clays, and Red loamy earths. Acacia rostellifera thicket, river red gum woodland, melaleuca, sheoak and York gum woodlands vegetation
2 178 6
Mount Adams System (224Ma)
Gently undulating sandplain with low gravel ridges and occasional laterite breakaways on colluvium south-east of Dongara. Soils are Yellow and Pale deep sands, and sand over gravel with grey sandy duplexes and sandy gravels. Scrub heath vegetation
173 1
Mount Horner System (224Mh)
Long gentle slopes broken by low gravel ridges and breakaways, with broad open depressions on colluvium from Mesozoic and Permian sediments between Dongara and Mingenew. Soils are Pale and Yellow deep sands with sandy gravel and sand over gravel. Scrub heath vegetation
21 120 63
Geraldton Coastal Zone (221)
Allanooka System (221Al)
Level to very gently inclined drainage depressions with low dunes and alluvial fan on alluvium and aeolian deposits in the Arrowsmith and Irwin River areas. Soils are mainly Grey deep sandy duplexes and Pale deep sands. Scrub heath vegetation
2 748 8
Beharra System (221Be)
Level to gently undulating sandplain with areas of dunes, small playas and swampy depressions. Soils are Yellow and Pale deep sands, and some sandy duplexes, loams and wet soils. Scrub heath vegetation
733 2
Greenough Alluvium System (221Ga)
Level alluvial plain with areas of minor terracing on alluvium in the lower Greenough and Irwin Rivers area near Geraldton and Dongara. Soils are Red sandy and loamy earths, Hard cracking and Self-mulching clays. Acacia rostellifera shrubland and river red gum woodland vegetation
3 328 10
Tamala South System (221Ta)
Rises and low hills with relict dunes on lithified Pleistocene calcareous dune deposits, adjacent to the coast from Jurien Bay to Kalbarri. Soils are Yellow/brown shallow sands, Yellow deep sands, with Calcareous shallow sands and Rock outcrop. Heathlands and banksia low woodland vegetation
3 452 10
Total 33 733 100

4 Geomorphology and soil-landscapes
19
Figure 4.1 Soi l- landscape map units in the Irwin survey area
The major part of the Yardarino Flats is identified as map unit Greenough Alluvium subsystem 3 (with Yardarino backflats (221Ga_3IR1b) and Yardarino mixed soils (221Ga_3IR1c) phases – described in Appendix B). Three-quarters of the soils found here are Self-mulching cracking clays — mainly Self-mulching Grey Vertosol in the Australian Soil Classification (Isbell & National Committee for Soil and Terrain 2016) — and the other quarter is Hard cracking clays (Brown Vertosol). Appendix C shows the chemical analyses from deep drilling sites 4, 11 and 13, which are in this map unit.
Closer to the Irwin River is the Greenough Alluvium subsystem 1, Irwin terrace phase (221Ga_1IR2), which defines alluvial soils on the flats flanking the river. These are mainly Self-mulching cracking clay and Red loamy earth soils (Mesotrophic Red Kandosol). Appendix C shows the chemical analyses from site 15, which is in this map unit.
The Irwin System is a similar alluvial system to the Greenough Alluvial System, but it is upstream in the Arrowsmith Zone. Two subsystems dominate this area: Irwin River 1

Soil capability assessment for Irwin
20
subsystem (224Ir_1) with alluvial flats, and Irwin 2 subsystem (224Ir_2) with flat terraces and lower slopes adjacent to the river.
Self-mulching cracking clay (Self-mulching Grey Vertosol) dominates the Irwin 1 subsystem, but it has Red loamy earth (Mesotrophic Red Kandosol) soils as well. Appendix C shows the chemical analyses from site 17, which is in the Irwin 1 subsystem.
The Irwin 2 subsystem features a mixture of Red sandy earth (Mesotrophic Red Kandosol) and Yellow/brown shallow sandy duplex (Yellow Sodosol) soils, with smaller areas of Hard cracking clay. Appendix C shows the chemical analyses for site 226, which is in this map unit.
The Tamala South System (221Ta) is characterised by undulating rises at the western margin of the survey area (mainly mapped as Tamala South 4 subsystem). There is a similar, smaller area at the sloping eastern flank of the flats, identified as a subsystem of the Mount Horner system (224MhTA). It features mainly Yellow deep and shallow sands (Arenic Yellow-Orthic Tenosols), often over limestone. Limestone caprock commonly outcrops in both map units.
The eastern Mount Horner System (224Mh) occupies about 60% of the survey area (Table 4.1). The soils on these long, gentle slopes are mainly Pale and Yellow deep sands (Bleached-, Grey-, or Yellow-Orthic Tenosols), with areas of ironstone gravel (Ferric-Petroferric or Sesqui-Nodular Tenosols).
In the north of the survey area, the Allanooka System (221Al) is characterised by flats and low dunes of mainly Yellow and Pale deep sands and Grey deep sandy duplex soils. Appendix C shows the chemical analyses for site 16, which is in this system.
At the south-western corner is the Beharra System (221Be), which recognises aeolian features of undulating sandy rises and dunes with areas of swampy depressions. Yellow and Pale deep sands are also dominant here.
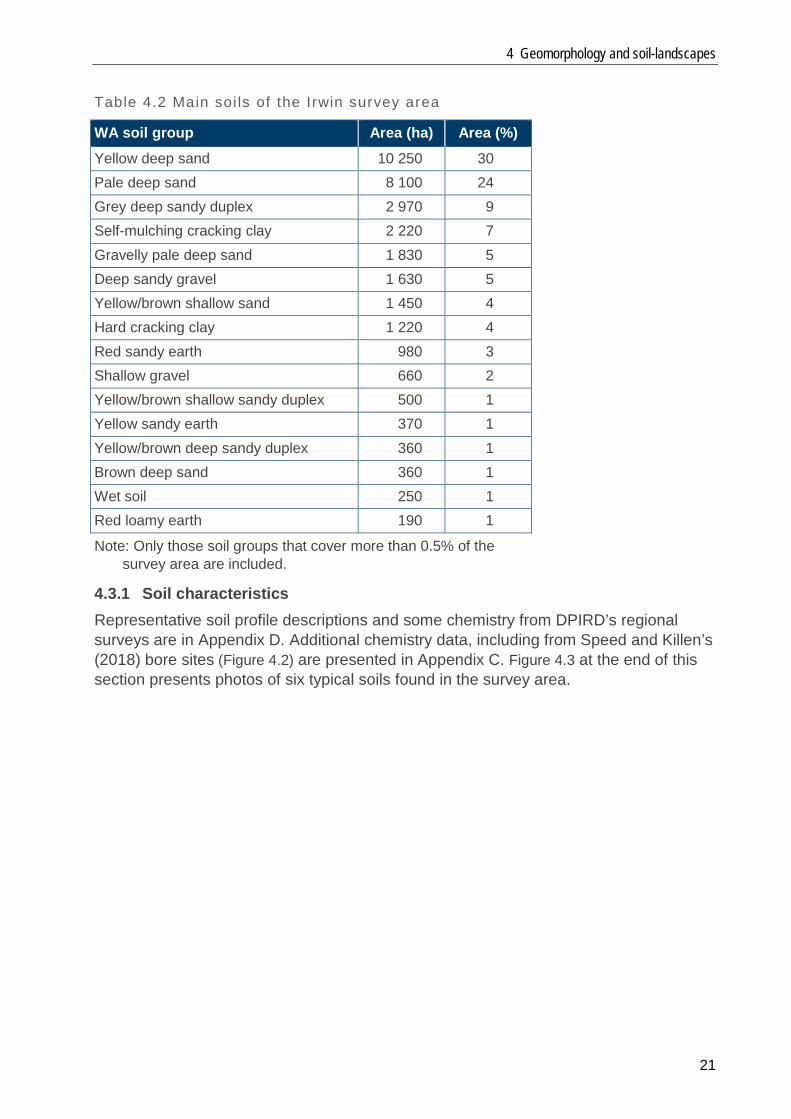
4.3 Main soils Over half of the soils of the Irwin survey area are deep sands. These are usually yellow to pale grey. The deep sands are common across most map units, except for the clayey alluvial plains (221Ga and 224Ir) where cracking clays (Self-mulching and Hard) and the Red sandy earth soils dominate. The Grey deep sandy duplexes and Ironstone gravelly soils are mostly in the Mount Horner System (224Mh).
4 Geomorphology and soil-landscapes
21
Table 4.2 Main soi ls of the Irwin survey area
WA soil group Area (ha) Area (%) Yellow deep sand 10 250 30 Pale deep sand 8 100 24 Grey deep sandy duplex 2 970 9 Self-mulching cracking clay 2 220 7 Gravelly pale deep sand 1 830 5 Deep sandy gravel 1 630 5 Yellow/brown shallow sand 1 450 4 Hard cracking clay 1 220 4 Red sandy earth 980 3 Shallow gravel 660 2 Yellow/brown shallow sandy duplex 500 1 Yellow sandy earth 370 1 Yellow/brown deep sandy duplex 360 1 Brown deep sand 360 1 Wet soil 250 1 Red loamy earth 190 1
Note: Only those soil groups that cover more than 0.5% of the survey area are included.
4.3.1 Soil characteristics Representative soil profile descriptions and some chemistry from DPIRD’s regional surveys are in Appendix D. Additional chemistry data, including from Speed and Killen’s (2018) bore sites (Figure 4.2) are presented in Appendix C. Figure 4.3 at the end of this section presents photos of six typical soils found in the survey area.

Soil capability assessment for Irwin
22
Note: Numbers correspond to sites with chemistry results in Appendix C. Figure 4.2 Locat ion of dri l l ing sites in Irwin survey area
Deep sands Yellow deep sands and Pale deep sands are the two most common soils, but there are also some Gravelly pale deep sands, Deep sandy gravels and small patches of Brown deep sands. As well as variations in colour and gravel content, these deep sands have differing levels of clay content, sand grain size and changes down the profile. These variations result in significant differences in native vegetation and agricultural performance. Rogers (1996) classified many of these sands to soil series level to help discern the differences.
The manner of sand deposition has influenced the particle size. The aeolian sands are narrowly graded, medium to fine sand, while the colluvial sands include more coarse grains. This will influence some soil moisture and compaction characteristics.

4 Geomorphology and soil-landscapes
23
Much of the sand is very low in clay, generally less than 5% at 1m, and has low to very low water-holding capacity (Moore et al. 1998). Sand colour can be a useful indicator of water-holding capacity because grey and pale yellow sands tend to have significantly less capacity than the brighter yellow, brown and red sands.
The most common Yellow deep sands in the survey area belong to the Eurangoa Soil Series. These sands occur mainly in the Mount Horner System in the eastern area. The topsoil is a pale yellow sand, typically with a medium grain size and low clay content, and grades into a yellow loamy or clayey sand with depth.
The Eurangoa sands are typically over 1m deep and they often overlie a substrate of ironstone gravel or clay. Some of the poorer Eurangoa sands have very low clay content and/or coarse sand grains.
The Eradu sands have bright yellow topsoil with a higher clay content than the Eurangoa sands. The texture in the subsoil can increase to a clayey sand or sandy loam, and some are classified as Yellow sandy earths. These are the preferred cereal cropping sands in the district, but they are not very common in the survey area.
Yellow deep sands of the Teakle Soil Series occur on the Tamala South System. These are yellowish-brown sands, usually with a medium grain size and low clay content. In contrast to the Eurangoa Series, these have a substrate of limestone at varying depths. Where the limestone is present at less than 80cm, these soils are classified as Yellow/brown shallow sands. Some of the poorer Teakle sands have very low clay content and/or coarse sand grains.
The most common Pale deep sands belong to the Allanooka Soil Series. The topsoil is typically a pale grey sand of low clay content. The subsoil, beginning at 30–80cm, is a pale brown to pale yellow sand with a slight increase in clay content. These sands are typically found on slopes of the Mount Horner System.
The Casuarina Soil Series, often found in association with the Allanooka Series, has a similar colour and clay content as the soil in the Allanooka Series. The major difference is the presence of ironstone gravel in the Casuarina Series’ subsoil. These soils are classified as Gravelly pale deep sands. The Casuarina Series is regarded as a good soil for cereal cropping.
Poor quality Pale deep sands were placed in Balline Soil Series by Rogers (1996). These have very little colour, a very low clay content and coarse sand grains. Similar sands found on dunes on the Geraldton Coastal Plain are yet to be assigned to a soil series.
Sandy duplex soils These are mainly Grey deep sandy duplex soils of the Heaton Soil Series. They have a loose, brownish-grey sand over reddish-yellow sandy clay at 30–80cm. These relatively common soils are mainly in the Allanooka System, with some also found on the sandy slopes of the Mount Horner System. Other sandy duplex soils have yellow or brown topsoils, described as Yellow/brown deep or shallow sandy duplex, often over mottled sandy clay subsoils. These are generally in alluvial landscapes, particularly in the Irwin System.

Soil capability assessment for Irwin
24
The two sandy duplex soil types we observed on the Yardarino Flats are quite different in their texture and hydrology. North of the river, site 225 has subsoil similar to the nearby Hard cracking clay, suggesting that the surface sand is from a later depositional event rather than in situ development. The low silt content of the deep layers at site 14 in the southern area of the flats suggests these layers came from weathered Mesozoic sediments, rather than Irwin River alluvium.
The soil reaction trend of sandy-surfaced soils was:
• strongly acid (pH 4.5 at site 225) to slightly acidic (pH 6.6 at site 16) in the topsoils • neutral to strongly acidic in the subsoils • neutral to alkaline in the deeper subsoils.
Some duplexes on the margin of the Yardarino Flats show signs of waterlogging. This is possibly a result of the highly sodic clays with low permeability found in the area.
Clay soils The clays are found mainly in the alluvial Irwin River and Greenough Alluvium Systems. Rogers (1996) described the Self-mulching cracking clays as belonging to the Fraser Soil Series. This has seasonal surface cracking with dark-grey, light to medium clay on the surface which gradually becomes dark-brown to reddish-brown, medium to heavy clay with depth. The Hard cracking clays are less common and are part of the Greenough Soil Series. They are hardsetting, grey, gradational silty clays.
We found the cracks in these clays to be relatively narrow (5–10mm) and shallow (less than 30cm deep). Rogers’ (1996) soil diagrams of these series also suggest that the cracks do not extend below 30cm.
These clays, especially the Fraser Series, can be highly productive for dryland agriculture, with high yields for crops such as wheat and canola.
We examined samples from several sites on the clay flats, including Speed and Killen’s (2018) deep bore sites (Figure 4.3). We found there was a significant variation in soil parent material (Appendix C). Some sites have reddish clay substrate to at least 10m deep (sites 4 and 11), especially those close to the Irwin River on the Yardarino Flats. However, some have less than 4m of red clay. The deeper layers can be gleyed (waterlogged), they can have a paleo-swamp feature, or have sandy alluvium (site 17). Speed and Killen (2018) reported limestone at depth on the edge of the Yardarino Flats. This variation would significantly influence how these soils drain and flush.
We found that the soil reaction trend of topsoils in these clays is neutral to alkaline, apart from sites 15 and 17, which are moderately acidic. All sites have alkaline layers in the subsoil rooting zone and tend to have some carbonate formed in the soil, with some sites having large amounts.
Associated with the alkaline, fine-textured horizons typical of these clays, we found that all sites have moderate to high levels of boron (calcium chloride extractable greater than five parts per million) within the reach of deep-rooted plants.
All sites have highly sodic layers (exchangeable sodium percentages (ESPs) greater than 15), particularly in the subsoils (ESPs from 15 to 40 within the top 5m). Sodicity

4 Geomorphology and soil-landscapes
25
relates to poor physical properties, and sodic soils generally exhibit massive and dense horizons that are prone to dispersion and have reduced permeability and poor aeration.
While the topsoils at all sites usually have low levels of salinity, this tends to increase with depth, even to moderate levels of salinity up to 74 millisiemens per metre (mS/m). However, some sites (e.g. site 17, which is east of the Gingin Scarp on the alluvial plain of the Irwin River [224Ir]), had lower salinity than the clays on the Yardarino Flats, to the west of the Gingin Scarp; site drainage may also be better on the upstream Irwin River alluvial plain.
The higher salinity and carbonate of the clay soils on the Yardarino Flats is consistent with their proximity to the Tamala Limestone. Salt from rainwater would have contributed to the salinity levels. Results presented in Speed and Killen (2018) indicate that the levels of salinity increase with distance from the Irwin River channel.
The abundance of silt can be an indicator of different sediment types. The ratio of silt to clay in the study area is about twice that of other soils in the Midlands. This alluvium is derived from the Permian rocks dominant in the Nangetty area further upstream. However, the silt content of the deeper layers at some sites (e.g. 13 and 17) suggests that these are possibly from a different source than the surface alluvium.
Testing of some clay samples collected during the study detected the presence of smectite clay mineral. Smectite clay, the main clay mineral in self-mulching clays, is reputed to form in swamps with high clay and moderate levels of available calcium. These conditions would have occurred in the development of the Yardarino Flats.
The analysis also showed that all profiles have high levels of potassium. The source of potassium is the clay mineralogy and Permian origin of the alluvial sediments.
The subsoil of the Hard cracking clays (site 15) is generally similar to that of the self-mulching clays. It is slightly less alkaline than the self-mulching clays but still has some calcium carbonate. It is moderately saline and strongly sodic and while boron is present, the levels are not as high as in some of the self-mulching clays. These properties probably reflect better deep drainage.
Red sandy and loamy earths Rogers (1996) described the Red sandy earths along the Irwin River as belonging to the Bootenal Soil Series. They are firm, reddish-brown loamy sands grading to sandy clay loam with depth. The associated Red loamy earths of the Bowes Soil Series have a sandy loam surface grading to sandy clay with depth.
Both of these soils are relatively fertile and well drained and are found mainly on alluvial terraces and flats in the Greenough and Irwin systems.
The Red loamy earth close to the Irwin River (site 226) has levels of silt consistent with Irwin alluvium. It has a neutral pH with low salinity in the top 2m and a highly sodic subsoil.

Soil capability assessment for Irwin
26
Pale deep sand, Al lanooka Soi l Ser ies
Yel low deep sand, Teakle Soi l Ser ies
Yel low deep sand, Eurangoa Soi l Ser ies
Sel f -mulching crack ing c lay , Fraser Soi l Ser ies
Grey deep sandy duplex , Heaton Soi l Ser ies
Red sandy ear th, Bootenal Soi l Ser ies
Figure 4.3 Six typical soils of the Irwin survey area

5 Land capability for horticulture
27
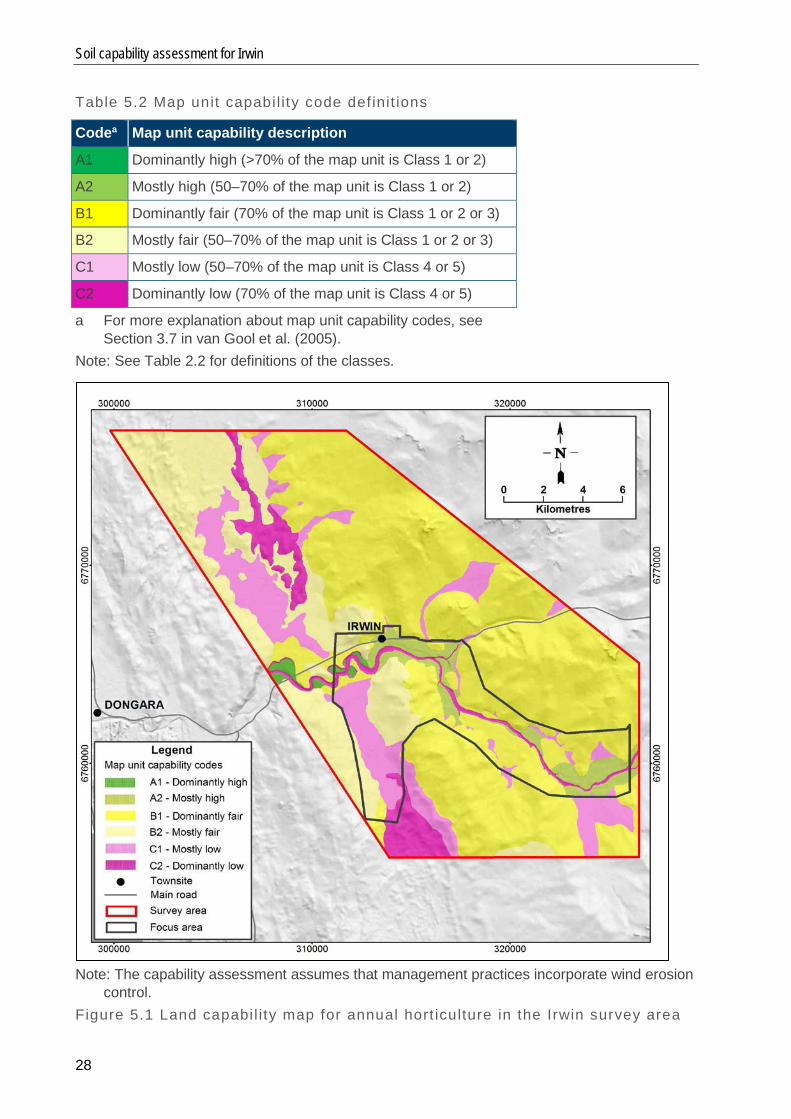
5 Land capability for horticulture As described in Section 2.4, land capability refers to the ability of the land to support a particular land use. It takes into account the productive potential of the land as well as potential hazards.
The land capability assessment showing areas for annual and perennial horticulture across the survey area is shown in Table 5.1. It uses the map unit capability codes presented in Table 2.3 (and repeated below in Table 5.2 to show the relationship to the capability mapping opposite). The assessment assumed management practices that incorporate wind erosion control are in place. Control of wind erosion is an expected part of normal management of any irrigated agriculture enterprise. We also included the potential for developing irrigation salinity. As a result, these maps are different to the capability maps currently presented on NRInfo. Table 5.1 Area of annual and perennial hort iculture for each capabi l i ty code in the Irwin survey area
Capability code
Area of annual horticulture Area of perennial horticulture
ha % ha % A1 188 1 188 1 A2 1 253 4 1 253 4 B1 19 223 57 18 611 55 B2 6 782 20 5 263 16 C1 4 209 12 3 050 9 C2 2 078 6 5 368 16
Figure 5.1 and Figure 5.2 illustrate the land capability across the survey area for annual and perennial horticulture using the map unit capability codes outlined in Table 5.1.
Soil capability assessment for Irwin
28
Table 5.2 Map unit capabi l i ty code def init ions
Codea Map unit capability description
A1 Dominantly high (>70% of the map unit is Class 1 or 2)
A2 Mostly high (50–70% of the map unit is Class 1 or 2)
B1 Dominantly fair (70% of the map unit is Class 1 or 2 or 3)
B2 Mostly fair (50–70% of the map unit is Class 1 or 2 or 3)
C1 Mostly low (50–70% of the map unit is Class 4 or 5)
C2 Dominantly low (70% of the map unit is Class 4 or 5)
a For more explanation about map unit capability codes, see Section 3.7 in van Gool et al. (2005).
Note: See Table 2.2 for definitions of the classes.
Note: The capability assessment assumes that management practices incorporate wind erosion
control. Figure 5.1 Land capabi l i ty map for annual hort iculture in the Irwin survey area

5 Land capability for horticulture
29
Note: The capability assessment assumes that management practices incorporate wind erosion
control. Figure 5.2 Land capabi l i ty map for perennial hort iculture in the Irwin survey area

Soil capability assessment for Irwin
30
The land capability assessment for each soil-landscape subsystem or phase is in Table 5.3. Table 5.3 Land capabi l i ty c lasses for soi l - landscape subsystems and phases in the Irwin survey area
Soil-landscape subsystem or phase Subsystem or phase symbol
Area (ha)
Capability code
Annual horticulture
Perennial horticulture
Allanooka 1 flats subsystem 221Al_1 1 903 B2 C2
Allanooka 2 dunes subsystem 221Al_2 845 C2 C2
Beharra 1 subsystem 221Be_1 351 C2 C2
Beharra 2 subsystem 221Be_2 383 C2 C2
Greenough Alluvium subsystem 1, Irwin terrace phase
221Ga_1IR2 503 B1 B2
Greenough Alluvium subsystem 2, drainage line phase
221Ga_2Dr 191 C2 C2
Greenough Alluvium subsystem 2, Irwin terrace phase
221Ga_2IR2 188 A1 A1
Greenough Alluvium subsystem 3, Yardarino backflats phase
221Ga_3IR1b 2 218 C1 C1
Greenough Alluvium subsystem 3, Yardarino mixed soils phase
221Ga_3IR1c 228 B2 C1
Tamala South subsystem 3, pale sand phase
221Ta_3p 125 B1 B1
Tamala South 4 subsystem 221Ta_4 3 026 B2 B2
Tamala South subsystem 4, yellow deep sand phase
221Ta_4Ty 301 B2 B2
Irwin 1 subsystem 224Ir_1 617 B1 B1
Irwin 2 subsystem 224Ir_2 1 253 A2 A2
Irwin 2 subsystem, river channel phase 224Ir_2Dr 308 C2 C2
Mount Adams 6 subsystem 224Ma_6 173 B2 B2
Mount Horner System 224Mh 12 363 B1 B1
Mount Horner Allanooka subsystem 224MhAL 1 242 C1 C2
Mount Horner Dunes subsystem 224MhD_ 605 C1 C1
Mount Horner Munja subsystem 224MhMJ 109 B1 B2
Mount Horner Sand Sheet subsystem 224MhS_ 5 506 B1 B1
Mount Horner Swamp subsystem 224MhSW 145 C1 C2
Mount Horner Tamala subsystem 224MhTA 1 150 B2 B2
Note: See Appendix B for detailed descriptions of subsystems and phases.

5 Land capability for horticulture
31
5.1 Very high (Class 1) to high (Class 2) capability land There are only two map units with mainly high to very high capability land — Greenough Alluvium subsystem 2, Irwin terrace phase (221Ga_2IR2) and Irwin 2 subsystem (224Ir_2) — which cover the narrow alluvial plains and terraces flanking the Irwin River. The major soils of these river flats are the relatively fertile Red sandy earths (Bootenal Series), Red loamy earths (Bowes Series) and well-structured Yellow/brown shallow sandy duplexes. Both map units also contain pockets of poorer soils and areas that are subject to waterlogging and flooding.
Pockets of high capability land similar to those described above for the river flats are also present on some of the other Greenough Alluvium and Irwin system map units (221Ga_1IR2 and 224Ir_1).
There are some pockets of Yellow deep sands that are rated Class 1 or Class 2 for annual or perennial horticulture in the Tamala South and Mount Horner system map units (221Ta_4, 221Ta_4Ty, 224Mh, 224MhS). These sands tend to have a higher clay content, and therefore better moisture- and nutrient-holding characteristics than the surrounding sands that dominate these map units.
5.2 Fair capability land (Class 3) The bulk of the survey area is classed as fair capability (Figure 5.1 and Figure 5.2). These areas are map units with mostly fair capability land or those where over half the unit has a mix of fair with some high capability land.
Along the western edge of the survey area, the dunes of the Tamala South System (map units 221Ta_4, 221Ta_4Ty and 221Ta_3p) are dominated by yellow/brown sands over limestone at varying depth (Teakle Series). These sands are mostly deep enough for horticultural crops and have good drainage, but they sit mid-range for moisture- and nutrient-holding capacity.
Careful management of irrigation and fertiliser application is required on these sands. Frequent irrigation will help to ensure that crops do not suffer moisture stress, especially during the hot and windy summer months. However, there is a fine line between providing the crops with sufficient water and over-watering, which is wasteful and can leach fertilisers below the root zone and contribute to nutrient export.
Wind erosion is a major consideration for these sands, especially for vegetable cropping. When disturbed and dry, the sandy soils are easily lifted by the strong winds, and sandblasting can be a real problem for emerging vegetables and young perennials. While shelter belts and windbreaks may reduce the risk, it will probably also be necessary to irrigate the soils between ground preparation and when the crops are established, thus increasing the total water requirement.
These Class 3 Teakle sands are also in two patches east of the Yardarino Flats, north and south of the Irwin town site, mapped as part of the Mount Horner System (224MhTA).
The Class 3 sands of the Mount Horner System (map units 224Mh, 224MhS and 224MhMJ) dominate the eastern half of the survey area. These include Yellow deep sands (Eurangoa Series), Pale deep sands (Allanooka Series), Gravelly pale deep

Soil capability assessment for Irwin
32
sands (Casuarina Series) and Grey deep sandy duplexes (Heaton Series). Smaller pockets of these sands are in the other Mount Horner subsystems.
While these Class 3 sands have differences to the Teakle sands described above, they have very similar capability and management considerations. Water and nutrient retention are poor in the paler topsoils, but the clayey subsoils increase moisture and nutrient retention at depth. In the duplex soils, the clayey subsoils may increase the waterlogging risk for tree crops. Soil acidity is an issue in some of these sands and the regular application of lime may be required.
Where some of the Greenough and Fraser clays are in locations with better drainage, we have assessed them as being fair capability for annual horticulture and, in some cases, perennial horticulture. The better-drained clays are most common where the Irwin River terraces merge into the Yardarino Flats (map units 221Ga_1IR2 and 221Ga_3IR1c) and on the heavier river flats upstream (224Ir_1). Limitations of these clays relate to profile and landscape drainage and the associated risk of developing salinity. The following paragraphs further discuss the Greenough and Fraser clays.
5.3 Low (Class 4) to very low (Class 5) capability land Map units that mostly have a low to very low capability are concentrated in a strip running along the eastern edge of the Geraldton Coastal Zone. Sitting between the Tamala South and Mount Horner Systems, this strip incorporates most of the Greenough Alluvium System (i.e. the Yardarino Flats) extending to the north-west and south-east of the Irwin River. The low capability land also extends further north, incorporating the Allanooka System, and southwards it extends into the Beharra System.
We have assessed most of the Yardarino back flats phase map unit (221Ga_3IR1b) as having a low capability for horticulture, even though Greenough and Fraser series clays here are highly productive under dryland cropping. A previous attempt at irrigating vegetables on these flats was short lived. Access problems on the clays soils were encountered during harvest and higher yields were actually achieved when the operation was moved onto the better drained sandy soils on an adjoining hillslope (L van Wyk 2016, pers. comm., 10 May).
Poor drainage and the risk of salinity developing under irrigation are the major limitations. Salinity is a major concern given that exploratory drilling by Bownds (2018) found the regional groundwater to be brackish, with salinity levels ranging from 1515 to 3230mg/L (approximately 275 to 587mS/m).
Salt in irrigation water can build up in the soil surface or subsurface. Additionally, water in excess of the evaporative demand of the crops can bring stored salt to within the rooting zone. Careful attention must be paid to the soil salt store, soil drainage characteristics and irrigation water salinity levels before considering investment in irrigated agriculture.
As discussed by van Wyk (2018), the key to successful irrigation with poor quality water is to leach the added salts below the root zone, generally by applying more irrigation water than the plant requires. This is easier to achieve on sandy soils or porous loams than on heavier clays. Some leaching can occur on cracking clays before they moisten
5 Land capability for horticulture
33
and swell, but the cracks in these clays are relatively narrow and shallow compared to other irrigated cracking clays elsewhere in Australia.
Deep drilling on these flats showed variation in the substrate, but sodic clay layers are common and this is likely to reduce any effective leaching of salts through the profile. Investigations on the southern flat found the watertable elevation rose with distance from the river (Speed & Killen 2018), which is further evidence of poor drainage. The very slight gradient of these flats rises away from the Irwin River (Figure 3.3), reducing the potential for salt removal through overland flow.
We also need to consider the salt that is currently stored in the profile. Speed and Killen’s (2018) electromagnetic surveys and analysis of soil samples from the southern Yardarino Flats suggest that salinity levels in the top metre of the soil profile are unlikely to affect broadacre crops, such as wheat and canola, but may reduce yields of more-sensitive horticultural crops. They also identified a salt bulge that usually begins at about 3m below the surface, with the watertable being brackish to saline.
The alkaline nature of the Greenough and Fraser series’ clay subsoils may affect crops with a low tolerance to high soil pH. Moderate to high levels of boron may cause toxicity in susceptible deep-rooted perennials.
Limitations on the Allanooka flats subsystem (221Al_1) are due to a combination of the low clay content and poor water-holding capacity of the coarse-grained Pale and Yellow deep sands. Nutrient leaching is also likely to occur on these sands. Parts of these flats are subject to winter waterlogging, limiting cropping opportunities and increasing the risk of nutrient export.
There is some evidence to suggest that the use of poor quality water (e.g. about 170mS/m) for irrigation of pastures on these flats has led to salt build-up and proliferation of salt-tolerant grasses (R Speed 2018, pers. comm., 16 July).
While the winter rain can flush salt from the sandy topsoils, continual flushing can result in salt build-up in the clayey subsoil. Site 16, which was irrigated pasture at the time of sampling, showed a sudden salinity increase from 4 to 63mS/m at the top of the clay horizon (Appendix C).
On the Allanooka dunes subsystem (221Al_2), the relatively coarse-grained sands with low clay content sands also have poor moisture and nutrient retention and are susceptible to wind erosion. To the south, similar sands are found on the dunes and sandplains of the Beharra System (221Be_1 and 221Be_2) and adjoining Mount Horner Dunes subsystem (224MhD_).
In the remainder of the Mount Horner System, we mapped the gently inclined drainage depressions with poor sandy soils that are similar to those of the Allanooka system (224MhAL) and small areas of swamp (224MhSW) as mostly low capability.
5.4 Soil salinity and crop tolerances The distribution of salts stored in the soil can vary greatly, spatially and over time. Rainfall and irrigation can create dramatic changes in salinity distribution throughout a soil profile. Even low levels (20–35mS/m) of salinity can lead to a significant reduction in crop yield. Table 2.1 provides the rating of soil salinity from nil to extreme in different

Soil capability assessment for Irwin
34
soil textures. Appendix E gives some indication of the expected yield reductions of horticultural crops at different levels of soil salinity.
Speed and Killen (2018) found that levels of soil salinity measured on the Yardarino Flats are within a range that might affect the yield of some horticultural crops. Our chemical analysis of soil profiles in this area and other parts of the survey area support this finding (see Appendix C).
In the heavier textured clays, tests generally showed low levels (up to 17mS/m) of salinity at the surface, increasing to moderate levels (up to 74mS/m) in the deeper rooting zone.
The better-drained deep sands tended to have fresher surface layers (<11mS/m), apart from site 14 at the southern end of the Yardarino Flats, which had moderate levels (24mS/m). The subsoils of all the deep sands increased in clay and in salinity (between 20 and 63mS/m).
5.5 Conclusion Because of the high productivity for dryland agriculture, it was originally considered that the Yardarino Flats may have good potential for development of irrigated agriculture. But we found that the alluvial plains generally have poor subsurface drainage and a risk of irrigation salinity. Our assessment shows there are probably better opportunities on some of the elevated areas of sand surrounding the plains, depending on water availability. This finding reflects previous attempts at horticulture in this landscape. Converting land use on the flats to irrigation would have a questionable long-term success, and it could create long-term damage to what are some of the best broadacre soils in the region. Apart from impacting on crop suitability and yield, salt concentration contributes to increasing levels of soil sodicity and soil structure decline.
The capability assessment shows that, while most of the survey area has soil-landscapes capable of supporting annual and perennial horticulture, the area of land with high capability is limited and concentrated on relatively thin strips of alluvium along the Irwin River.
The areas with major restrictions for irrigated agriculture are mainly the heavier soils of the Yardarino Flats and the dunes of poorer quality sands extending north and south of these flats. Poor drainage, high pH and boron, and the risk of salinity developing under irrigation are the major limitations for the heavier soils. Poor moisture and nutrient retention and susceptibility to wind erosion are the main limitations for sands.
The wind erosion risk is high for most sandy-surfaced soils, so investment in soil management would be required, especially for annual horticulture. With high levels of evaporation and the need to control wind erosion, irrigation in this area will have a high water-use requirement.

Appendixes
35
Appendixes A Land capability assessment B Description of soil-landscape subsystem map units C Chemistry results from deep drilling sites D WA soil groups and representative soil profiles E Predicted crop yield reductions at varying levels of soil salinity in sand, loam and clay

Soil capability assessment for Irwin
36
Appendix A Land capability assessment A1 Land quality codes used in ratings tables Table A1 presents the land quality value codes used in the ratings tables for annual and perennial horticulture (Table A2 and Table A3, respectively) along with a brief definition of each code. See van Gool et al. (2005) for more detailed definitions of these land qualities and their value codes. The two exceptions are the land qualities Inherent fertility (see Tille et al. 2013) and Irrigation salinity hazard (see Appendix A4). Table A1 Land qual ity value codes used in the capabil i ty rat ings tables
Land quality Value codes Flood hazard N (nil), L (low), M (moderate), H (high) Inherent fertility VH (very high), H (high), M (moderate), L (low), VL (very low) Irrigation salinity hazard VL (very low), L (low), M (moderate), MH (moderately high), H (high),
VH (very high) Land instability hazard N (nil), VL (very low), L (low), M (moderate), H (high) pH 0–10cm, pH 15–25cm, pH 50–80cm (pH in CaCl2)
VSac (very strongly acid: <5.3), Sac (strongly acid: 5.3–5.6), Mac (moderately acid: 5.6–6), Slac (slightly acid: 6–6.5), N (neutral: 6.5–8), Malk (moderately alkaline: 8–9), Salk (strongly alkaline: >9)
Phosphorus export risk L (low), M (moderate), H (high), VH (very high), E (extreme) Rooting depth (cm) VS (<15), S (15–30), MS (30–50), M (50–80), D (>80), VD (>150) Salinity hazard NR (none), PR (partial or low), MR (moderate), HR (high), PS (presently
saline land) Salt spray exposure S (susceptible), N (not susceptible) Site drainage potential R (rapid), W (well), MW (moderately well), M (moderate), P (poor), VP (very
poor) Soil water storage 0–100cm (mm of available water)
EL (extremely low: <30), VL (very low: 30–50), L (low: 50–70), ML (moderately low: 70–100), M (moderate: 100–130), H (high: >130)
Soil water storage 0–50cm (mm of available water)
EL (extremely low: <15), VL (very low: 15–25), L (low: 25–35), ML (moderately low: 35–50), M (moderate: 50–65), H (high: >65)
Soil workability G (good), F (fair), P (poor), VP (very poor) Subsurface acidification susceptibility L (low), M (moderate), H (high), P (presently acid) Subsurface compaction susceptibility L (low), M (moderate), H (high) Surface salinity N (nil), S, (slight), M (moderate), H (high), E (extreme) Surface soil structure decline susceptibility
L (low), M (moderate), H (high)
Trafficability G (good), F (fair), P (poor), VP (very poor) Water erosion hazard VL (very low), L (low), M (moderate), H (high), VH (very high), E (extreme) Waterlogging / inundation risk N (nil), VL (very low), L (low), M (moderate), H (high), VH (very high) Water repellence susceptibility N (nil), L (low), M (moderate), H (high) Wind erosion hazard L (low), M (moderate), H (high), VH (very high), E (extreme)

Appendix A
37
A2 Land capability ratings tables Table A2 presents the ratings table used to assess land capability for annual horticulture, and Table A3 presents the ratings table used to assess land capability for perennial horticulture. Table A2 Capabi l i ty rat ings table for annual hort iculture
Land quality Class 1 Class 2 Class 3 Class 4 Class 5
Flood hazard N L M – H
Inherent fertility H, VH, M L VL – –
Irrigation salinity hazard VL, L M, MH H VH –
Land instability hazard N, VL, L – M H –
pH at 0–10cm Slac, N Mac Vsac, Sac, Malk, Salk
– –
pH at 15–25cm Slac, N Sac, Mac, Malk
Vsac, Salk – –
pH at 50–80cm Slac, N Sac, Mac, Malk
Vsac, Salk – –
Phosphorus export hazard L, M H VH E –
Rooting depth VD, D M MS S VS
Salinity hazard NR PR – MR, HR PS
Salt spray exposure N – – S –
Soil water storage 0–100cm
H, M, ML L, VL EL – –
Soil water storage 0–50cm H, M, ML L VL EL –
Soil workability G F – P VP
Surface salinity N – S M H, E
Surface soil structure decline susceptibility
L, M H – – –
Trafficability G F – P VP
Water erosion hazard VL L M H, VH E
Waterlogging / inundation risk
N, VL L M H VH
Water repellence susceptibility
N, L, M H – – –
Wind erosion hazard L, M H VH – E
– = not applicable

Soil capability assessment for Irwin
38
Table A3 Capabi l i ty rat ings table for perennial hort iculture
Land quality Class 1 Class 2 Class 3 Class 4 Class 5
Flood hazard N L – M H
Inherent fertility H, VH, M L VL – –
Irrigation salinity hazard VL, L M, MH H – VH
Land instability hazard N, VL, L – M – H
pH at 0–10cm Slac, N Mac Vsac, Sac, Malk, Salk
– –
pH at 50–80cm Slac, N Mac, Malk Vsac, Sac, Salk
– –
Phosphorus export risk L, M H VH E –
Rooting depth VD, D – M MS S, VS
Salinity hazard NR – PR MR HR, PS
Salt spray exposure N – – S –
Soil water storage 0–100cm
H, M, ML L VL EL –
Soil water storage 0–50cm
H, M, ML, L VL, EL – – –
Soil workability G F P VP –
Subsurface compaction susceptibility
L, M H – – –
Surface salinity N – S M H, E
Trafficability G F – P VP
Water erosion hazard VL, L M, H – VH E
Waterlogging / inundation risk
N, VL – L M H, VH
Water repellence susceptibility
N, L, M H – – –
Wind erosion hazard L, M H, VH – E –
– = not applicable

Appendix A
39
A3 Example of proportional map unit capability ratings Table A4 An example of proport ional attr ibut ion of soils and landforms, and capabi l i ty rat ings, for map unit Irwin 2 subsystem (224Ir_2) in the Irwin survey area
WA soil group Qualifiera Landscapea
Percentage of map unit
(%)
Capability class
Annual horticulture
Perennial horticulture
Yellow/brown shallow sandy duplex
Neutral subsoil
Well-drained footslopes <3%
10 Class 2 Class 2
Yellow/brown shallow sandy duplex
Neutral subsoil
Well-drained flat 13 Class 2 Class 3
Yellow/brown shallow sandy duplex
Poor subsoil
Well-drained footslopes <3%
5 Class 3 Class 4
Yellow/brown shallow sandy duplex
Poor subsoil
Poorly drained flat
12 Class 4 Class 5
Red sandy earth Neutral subsoil
Well-drained floodplain
10 Class 2 Class 2
Red sandy earth Neutral subsoil
Well-drained flat 35 Class 2 Class 2
Hard cracking clay Neutral subsoil
Poorly drained floodplain
15 Class 4 Class 5
a For more details and definitions of qualifiers and landscapes, see van Gool et al. (2005).
Table A5 Proport ional attr ibut ion of capabi l i ty c lasses for map unit Irwin 2 subsystem (224Ir_2)
Land use
Percentage of Classes 1 & 2
(%) Percentage of
Class 3 (%)
Percentage of Classes 4 & 5
(%) Map unit
capability codea
Annual horticulture 68 5 27 A2
Perennial horticulture 55 13 32 A2
a Table 2.3 defines the map unit capability codes. For more explanation about the capability codes, see Section 3.7 in van Gool et al. (2005).

Soil capability assessment for Irwin
40
A4 Irrigation salinity hazard Irrigation salinity occurs when salts added to the soil profile are not removed by leaching or overland flows with the application of irrigation water. This leads to an accumulation of salt in the profile and if allowed to develop, will severely affect crop growth and productive potential. Irrigation salinity can also occur where salts stored lower in the profile are mobilised up into the root zone through a rising watertable resulting from irrigation.
Factors influencing the development of irrigation salinity include:
• profile permeability • landform position • land surface slope gradient • soil profile salt store • proximity of saline watertables • evaporation rates • quality and volume of water used for irrigation.
This rating hazard has not previously been attempted for capability assessments in WA. To calculate it, we used van Gool et al.’s (2005) method of assessing the land quality ‘Site drainage potential’ as a starting point.
First, we assigned a score out of six to each combination of profile permeability rating (as defined in Table 2.10a of van Gool et al. (2005)) and landform drainage grouping (as shown in the first column of Table 2.10a of van Gool et al. (2005)). For profile permeability, we took the horizon with the lowest permeability in the top 2m of the profile (non-soil layers such as rock were included if present). Table A6 presents the initial irrigation salinity score for these combinations of landform drainage groups and the slowest profile permeability with the top 2m.
Second, we adjusted this initial score by using the separate land quality ‘salinity hazard’ as described by van Gool et al. (2005). This provides an assessment of the potential for dryland salinity to develop because of rising saline watertables that follow land clearing, not taking into account any impacts from irrigation.
Third, we made adjustments based on existing salinity levels in the profile. We used van Gool et al.’s (2005) land quality ‘surface salinity’ assessment method, but applied it to the horizon with the highest salinity in the top 2m of the profile rather than just the surface horizon.
Table A7 presents these adjustments to the initial score. If either of the criteria in the top row of the table is met, add four (+4) to the initial score. If not, move down to the next row and so on.
The irrigation salinity hazard is then determined from the adjusted irrigation salinity score, as shown in Table A8.

Appendix A
41
Table A6 Init ia l irr igat ion sal inity score based on landform drainage group and prof i le permeabil i ty
Landform drainage group (with slope gradient)
Profile permeability
Very slow (<1mm/h)
Slow (1–5mm/h)
Slow–moderate
(5–20 mm/h)
Moderate (20–65 mm/h)
Moderate–rapid
(65–130 mm/h)
Rapid (>130 mm/h)
A. Poorly drained depressions (0–1%)
6 6 5 4 3 2
B1. Poorly drained flats (0–1%)
6 6 5 4 3 2
B2. Hillside seeps
5 5 4 3 2 1
B3. Poorly drained footslopes (1–3%)
5 5 4 3 2 1
C. Well-drained depressions & flats (0–1%)
5 5 4 3 2 1
D. Well-drained footslopes (1–3%)
4 3 3 2 2 1
E. Very gentle slopes (1–3%)
4 3 2 2 2 1
F. Gentle slopes (3–5%)
3 2 2 1 1 1
G. Moderate to steep slopes (>5%)
2 1 1 1 1 1
mm/h = millimetres per hour

Soil capability assessment for Irwin
42
Table A7 Adjustments to irr igat ion sal inity score
Score adjustment
Highest salinity level (ECe) in top 2m of profile (mS/m)a Salinity hazardb
+4 >1400 or Presently saline (PS), High hazard (HR)
+3 800–1400 or Moderate hazard (MR)
+2 600–800 or Partial or low hazard (PR)
+1 400–600 nac
0 <400 or No hazard (NR)
a The horizon salinity in this table is expressed in mS/m as measured by the soil extract method (ECe), rather than by the 1:5 soil suspension method (EC1:5) or an electromagnetic induction meter (ECa). The profile salinity data used to calculate capability is stored in the database as mS/m ECe. This is also the measure used by van Gool et al. (2005) to assess surface salinity.
b Salinity hazard value codes are from van Gool et al. (2005). c Not applicable because there is no salinity hazard value giving rise to a score adjustment of
+1.
The irrigation salinity hazard is then determined from the adjusted irrigation salinity score, as shown in Table A8. Table A8 Adjustments to irr igat ion sal inity score
Adjusted irrigation salinity score
Irrigation salinity hazard value (and code)
6–10 Very high (VH)
5 High (H)
4 Moderately high (MH)
3 Moderate (M)
2 Low (L)
1 Very low (VL)
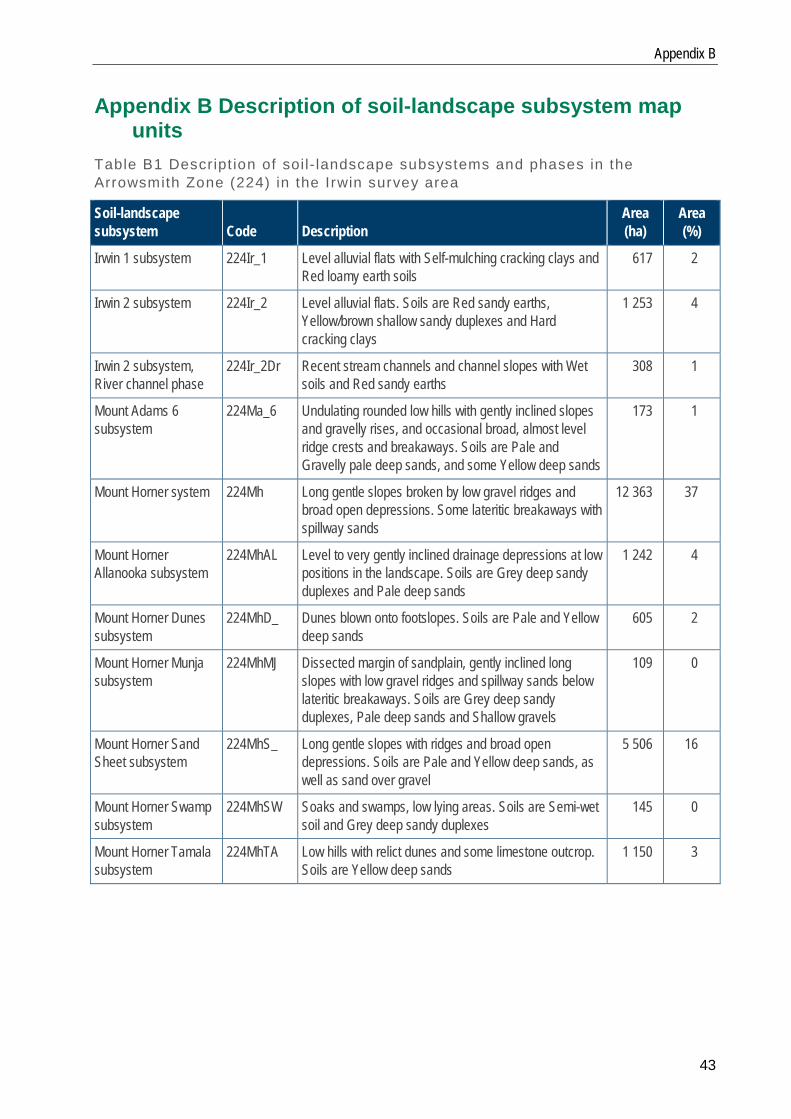
Appendix B
43
Appendix B Description of soil-landscape subsystem map units
Table B1 Descript ion of soil- landscape subsystems and phases in the Arrowsmith Zone (224) in the Irwin survey area
Soil-landscape subsystem Code Description
Area (ha)
Area (%)
Irwin 1 subsystem 224Ir_1 Level alluvial flats with Self-mulching cracking clays and Red loamy earth soils
617 2
Irwin 2 subsystem 224Ir_2 Level alluvial flats. Soils are Red sandy earths, Yellow/brown shallow sandy duplexes and Hard cracking clays
1 253 4
Irwin 2 subsystem, River channel phase
224Ir_2Dr Recent stream channels and channel slopes with Wet soils and Red sandy earths
308 1
Mount Adams 6 subsystem
224Ma_6 Undulating rounded low hills with gently inclined slopes and gravelly rises, and occasional broad, almost level ridge crests and breakaways. Soils are Pale and Gravelly pale deep sands, and some Yellow deep sands
173 1
Mount Horner system 224Mh Long gentle slopes broken by low gravel ridges and broad open depressions. Some lateritic breakaways with spillway sands
12 363 37
Mount Horner Allanooka subsystem
224MhAL Level to very gently inclined drainage depressions at low positions in the landscape. Soils are Grey deep sandy duplexes and Pale deep sands
1 242 4
Mount Horner Dunes subsystem
224MhD_ Dunes blown onto footslopes. Soils are Pale and Yellow deep sands
605 2
Mount Horner Munja subsystem
224MhMJ Dissected margin of sandplain, gently inclined long slopes with low gravel ridges and spillway sands below lateritic breakaways. Soils are Grey deep sandy duplexes, Pale deep sands and Shallow gravels
109 0
Mount Horner Sand Sheet subsystem
224MhS_ Long gentle slopes with ridges and broad open depressions. Soils are Pale and Yellow deep sands, as well as sand over gravel
5 506 16
Mount Horner Swamp subsystem
224MhSW Soaks and swamps, low lying areas. Soils are Semi-wet soil and Grey deep sandy duplexes
145 0
Mount Horner Tamala subsystem
224MhTA Low hills with relict dunes and some limestone outcrop. Soils are Yellow deep sands
1 150 3

Soil capability assessment for Irwin
44
Table B2 Descript ion of soil- landscape subsystems and phases in the Geraldton Coastal Zone (221) in the Irwin survey area
Soil-landscape subsystem Code Description
Area (ha)
Area (%)
Allanooka 1 flats subsystem
221Al_1 Level to very gently inclined drainage depressions and alluvial fan. Soils are Pale and Yellow deep sands and Grey deep sandy duplexes
1 903 6
Allanooka 2 dunes subsystem
221Al_2 Low dunes blown out of, or over, drainage flat. Soils are Pale and Yellow deep sands
845 3
Beharra 1 subsystem 221Be_1 Dunefield. Yellow deep sand is dominant 351 1
Beharra 2 subsystem 221Be_2 Level to gently undulating sandplain with numerous small hummocky dunes with playas and swampy depressions. Soils are Yellow and Pale deep sands
383 1
Greenough Alluvium subsystem 1, Irwin terrace phase
Level alluvial plain with areas of low river terraces. Soils are Hard cracking clays with some Red sandy earths
503 1
Greenough Alluvium subsystem 2, drainage line phase
221Ga_2Dr River channel. Soils are Wet soils, and sandy and loamy earths
191 1
Greenough Alluvium subsystem 2, Irwin terrace phase
221Ga_2IR2 River terraces and floodplains. Soils are Red sandy earths and some Red loamy earths
188 1
Greenough Alluvium subsystem 3, Yardarino backflats phase
221Ga_3IR1b Back plain on alluvium and swamp deposits. Soils are Self-mulching cracking clays and Hard cracking clays
2 218 7
Greenough Alluvium subsystem 3, Yardarino mixed soils phase
221Ga_3IR1c Back plain on alluvium and swamp deposits which grades into the Allanooka flats area. Soils are mainly Self-mulching and Hard cracking clays with Pale and Yellow deep sands and sandy duplexes
228 1
Tamala South 3 subsystem, pale sand phase
221Ta_3p Low rises with patches of pale sand mixed with Yellow deep sand and shallow sand over limestone
125 0
Tamala South 4 subsystem
221Ta_4 Low hills with relict dunes and some limestone outcrop. Soils are Yellow/brown shallow sand with limestone outcrops, and Yellow deep sand
3 026 9
Tamala South 4 subsystem, yellow deep sand phase
221Ta_4Ty Gently undulating plain on the eastern side of the Tamala Limestone. Soils are Yellow deep sands
301 1

Appendix C
45
Appendix C Chemistry results from deep drilling sites Figure 4.2 shows the location of the deep drilling sites with chemistry results (Table C1). Tables C2 and C3 define the texture codes and chemistry method codes. Table C1 Chemistry results f rom deep dr i l l ing sites
Site WASGa Depth (cm) Text
ure
Clay
(%)
Silt
(%)
Silt
/ clay
b
% sa
nd <2
00µ
CF%
CaCO
3
EC (1
:5 m
S/m
)
pH (C
aCl 2)
K_HC
O 3
S_KC
l
B_Ca
Cl2
CEC
ESP
4 602 0–5 ZCL 33c – – – 4 5 10 7.6 588 3 1 30 1
4 5–20 ZLC 38c – – – 9 6 9 7.7 423 2 1 29 1
4 20–140 MC 50c – – – 11 9 28 7.9 340 2 5 30 15
4 225–310 MC 50c – – – 6 30 45 8.2 265 16 12 20 31
4 310–380 MC 50c – – – 3 0.7 30 8.3 328 22 16 22 38
4 500–600 C 43 15 0.3 40 2 – 37 8 279 103 5 19 30
4 1000–1100 C 45 14 0.3 66 4 – 18 4.6 274 55 3 11 37
11 602 0–10 C 36 33 0.9 26 6 – 17 7.1 1301 30 2 37 1
11 100–200 C 66 20 0.3 43 11 – 32 8 424 12 18 35 27
11 500–600 C 74 18 0.2 30 2 – 73 7.2 502 159 19 35 42
11 1000–1100 C 79 13 0.2 56 0 – 75 7.1 512 180 15 32 41
13 602 0–10 C 38 19 0.5 27 3 0 10 7.1 1016 7 2 38 1
13 200–300 C 58 19 0.3 61 4 + 49 8.2 474 49 19 32 28
13 700–800 C 44 4 0.1 85 1 0 32 7.9 331 56 5 18 32
13 900–1000 C 22 2 0.1 89 4 0 8 6.5 233 14 1 10 19
13 1100–1200 SLC 24 2 0.1 89 4 0 9 6.8 251 20 1 11 18
14 444 0–10 S 6 3 95 1 0 26 6.4 233 17 1 11 4
14 100–200 LC 35 3 0.1 90 3 0 52 7.5 176 36 2 14 41
14 500–600 SLC 25 2 0.1 89 0 – 14 7.9 153 9 1 10 33
15 601 0–20 ZC 45 19 0.4 47 5 0.2 4 5.9 396 5 1 10 3
15 20–40 SLC 38c – – – 10 0.2 6 6 150 3 1 9 8
15 40–100 MC 50c – – – 3 0.5 34 7.4 131 14 2 20 17
15 160–250 MC 50c – – – 2 3.9 74 7.7 179 63 3 22 35
15 250–300 FSLC 38c – – – 3 0.2 42 7.3 162 51 2 13 40
15 300–365 FSCL 25c – – – 0 0.3 45 7.8 113 36 2 9 42
(continued)

Soil capability assessment for Irwin
46
Table C1 cont inued
Site WASGa Depth (cm) Te
xtur
e
Clay
(%)
Silt
(%)
Silt
/ clay
b
% sa
nd <2
00µ
CF%
CaCO
3
EC (1
:5 m
S/m
)
pH (C
aCl 2)
K_HC
O 3
S_KC
l
B_Ca
Cl2
CEC
ESP
600–700 C 50c – – – 0 0.2 61 6.8 320 55 5 20 59
900–1000 C 50c – – – 0 – 46 7.2 262 52 3 14 61
16 444 0–10 S 3 2 – 82 2 – 6 6.6 88 6 1 5 2
16 50–70 S 5 2 – 86 0 – 4 6.6 58 3 0 1 4
16 200–300 SCL 40 3 0.1 82 0 – 63 6.3 130 96 1 7 44
16 400–500 SCL 24 1 0.0 85 0 – 44 6.1 60 34 1 5 31
16 600–700 SL 16 5 0.3 83 5 0.2 28 7.4 112 13 1 7 18
16 900–1000 SCL 13 9 – – 2 0.4 46 7.9 164 45 1 10 21
17 602 0–10 C 34 16 0.5 36 5 1.4 8 6.3 445 8 1 15 3
17 10–100 C 52 15 0.3 37 6 – 13 7.2 285 22 2 22 14
17 100–200 C 49 14 0.3 47 10 0.2 19 7.9 228 31 7 19 27
17 400–500 SCL 13 1 0.1 78 9 0.2 3 7.5 175 4 1 6 25
17 600–700 SC 17 2 0.1 89 8 0.2 6 7.2 157 5 1 6 31
17 900–1000 LC 22 6 0.3 79 5 0.2 29 7.3 207 28 1 11 39
225 407 0–10 S 7 2 – 91 2 0.2 3 4.5 56 4.9 0 3 3
225 50–70 FSL 24 3 0.1 84 3 – 6 5.4 262 16 1 5 10
225 300–400 L 39 19 0.5 57 4 0.2 20 8.7 338 4 3 17 37
225 600–700 C 30 14 0.5 58 2 1 22 8.4 280 16 2 12 40
225 900–1000 C 50c – – – 4 – 13 7.6 – – – – –
226 544 0–10 L 12 1 – 65 7 0.6 11 5.7 320 14 1 8 3
226 10–100 L 10 6 – 71 1 – 11 4.7 300 12 1 3 23
226 300–400 SL 21 7 0.3 76 2 0.2 10 6.7 214 7 1 8 22
226 600–700 C 25 4 0.2 94 5 0.2 20 7.2 201 22 2 10 35
226 900–1000 C 24 3 0.1 92 12 0.2 30 7 210 31 2 10 41
– = not assessed a WA soil group (WASG): 602 – Self-mulching clay; 601 – Hard cracking clay; 544 – Red
loamy earth; 444 – Pale deep sand; 407 – Yellow/brown deep sandy duplex. b Silt/clay was only included where clay content was greater than 15% c Clay percentage was estimated from soil texture. Note: Tables C2 and C3 define the texture codes and chemistry method codes.
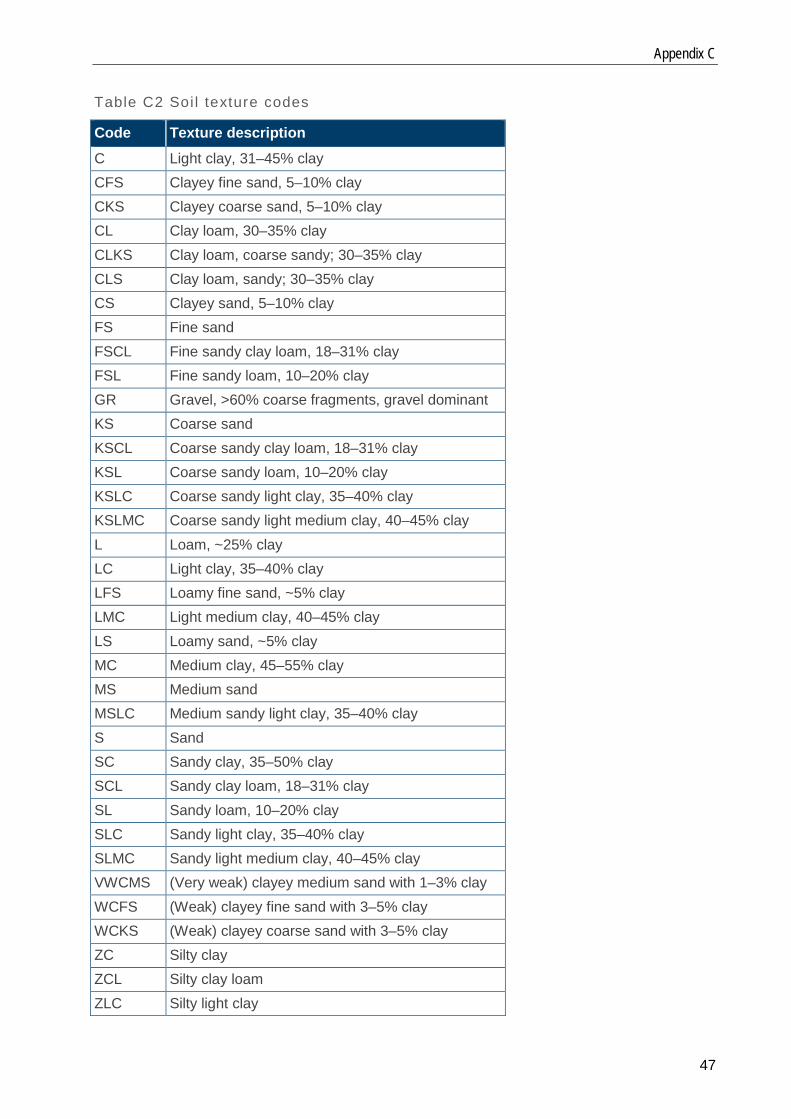
Appendix C
47
Table C2 Soi l texture codes
Code Texture description C Light clay, 31–45% clay CFS Clayey fine sand, 5–10% clay CKS Clayey coarse sand, 5–10% clay CL Clay loam, 30–35% clay CLKS Clay loam, coarse sandy; 30–35% clay CLS Clay loam, sandy; 30–35% clay CS Clayey sand, 5–10% clay FS Fine sand FSCL Fine sandy clay loam, 18–31% clay FSL Fine sandy loam, 10–20% clay GR Gravel, >60% coarse fragments, gravel dominant KS Coarse sand KSCL Coarse sandy clay loam, 18–31% clay KSL Coarse sandy loam, 10–20% clay KSLC Coarse sandy light clay, 35–40% clay KSLMC Coarse sandy light medium clay, 40–45% clay L Loam, ~25% clay LC Light clay, 35–40% clay LFS Loamy fine sand, ~5% clay LMC Light medium clay, 40–45% clay LS Loamy sand, ~5% clay MC Medium clay, 45–55% clay MS Medium sand MSLC Medium sandy light clay, 35–40% clay S Sand SC Sandy clay, 35–50% clay SCL Sandy clay loam, 18–31% clay SL Sandy loam, 10–20% clay SLC Sandy light clay, 35–40% clay SLMC Sandy light medium clay, 40–45% clay VWCMS (Very weak) clayey medium sand with 1–3% clay WCFS (Weak) clayey fine sand with 3–5% clay WCKS (Weak) clayey coarse sand with 3–5% clay ZC Silty clay ZCL Silty clay loam ZLC Silty light clay

Soil capability assessment for Irwin
48
Table C3 Codes for soi l chemistry methods
Code Chemistry
CF% Percentage of coarse fragments in whole soil
clay Percentage of clay in fine earth
silt Percentage of silt in fine earth
sand Percentage of sand in fine earth
pH pH 1:5 (in calcium chloride, CaCl2) in fine earth
Al_CaCl2 Extractable aluminium (in calcium chloride) in fine earth
EC Electrical conductivity (1:5 soil:water) in fine earth
OC_wb Organic carbon Walkley & Black in fine earth
B_CaCl2 Extractable boron (in calcium chloride) in fine earth
K_HCO3 Extractable potassium in fine earth using bicarbonate
S(KCL) Sulphur extracted by potassium chloride
P_HCO3 Extractable phosphorus in fine earth using bicarbonate
P_kjel Extractable phosphorus (Kjeldahl digestion) in fine earth
PRI Phosphorus retention index of fine earth
CEC Cation exchange capacity of fine earth
Exch_Ca Exchangeable calcium in fine earth
Exch_K Exchangeable potassium in fine earth
Exch_Mg Exchangeable magnesium in fine earth
Exch_Na Exchangeable sodium in fine earth
ESP Exchangeable sodium percentage in fine earth (%)
Exch_Al Exchangeable aluminium in fine earth

Appendix D
49
Appendix D WA soil groups and representative soil profiles This appendix presents representative soil profiles for most of the main WA soil groups in the Irwin survey area. Where available, soil profile descriptions are provided along with available soil chemistry. Table C2 defines the soil texture codes and Table C3 defines the chemistry methods used in these profile descriptions.
For most soil profiles, the WA soil group qualifier (Schoknecht & Pathan 2013) and the Australian Soil Classification (Isbell & National Committee on Soil and Terrain 2016) for each profile are included. Table D1 Main soi ls of the Irwin survey area
Subsection in this appendix
WA soil group (use hyperlink where available) Area (ha) Area (%)a
D1 Yellow deep sand 10 200 30
D2 Pale deep sand 8 000 24
D3 Grey deep sandy duplex 3 000 9
D4 Self-mulching cracking clay 2 100 6
D5 Gravelly pale deep sand 1 800 5
D6 Deep sandy gravel 1 600 5
D7 Yellow/brown shallow sand 1 500 4
D8 Red sandy earth 1 300 4
D9 Hard cracking clay 1 100 3
D10 Shallow gravel 700 2
D11 Yellow/brown shallow sandy duplex 500 1
D12 Yellow sandy earth 370 1
D13 Yellow/brown deep sandy duplex 360 1
D14 Brown deep sand 360 1
D15 Red loamy earth 240 1
a Only those soil groups that cover an area greater than 0.5% are shown.

Soil capability assessment for Irwin
50
D1 Yellow deep sand
These are yellow sands greater than 80cm deep. They have varying water- and nutrient-holding capacity depending on the amount of clay in the profile.
Representative site 1: WM 0165
WA soil group: Yellow deep sand
Qualifier: FSV (Fair sand, very deep – fine sand throughout, or sand increasing to clayey or loamy sand below 30cm)
ASC: Yellow-Orthic Tenosol
Location: GDA94 Zone 50, 310347mE, 6768617mN
Map unit: Allanooka 1 flats subsystem (221Al_1) Chemical analysis: See Rogers (1996)
Prof i le descr ipt ion
Depth (cm) Description
0–20 Light yellowish-brown (10YR 6/4 moist) fine sand
20–100 Yellow (10YR 7/6 moist) fine sand
100–110+ Brownish-yellow (10YR 6/8 moist) clayey medium sand
Representative site 2: GTN1566
WA soil group: Yellow deep sand
Qualifier: PSV (Poor sand, very deep – sand is mainly coarse or medium grained, and no hardpan, solid rock or clay layer present in the top 150cm)
ASC: Yellow-Orthic Tenosol
Location: GDA94 Zone 50, 314554mE, 6746625mN
Map unit: Beharra 2 subsystem (221Be_2)
Chemical analysis: See Rogers (1996)
Prof i le descr ipt ion
Depth (cm) Description
0–25 Dark-brown (10YR 3/3 moist) humic medium sand; sandy fabric
25–65 Light yellowish-brown (2.5Y 6/4 moist) to yellow (2.5Y 7/5 dry) medium sand; sandy fabric
65–200+ Yellow (10YR 7/8 moist) medium sand; sandy fabric

Appendix D
51
D2 Pale deep sand These are sands greater than 80cm deep and are white, grey or pale yellow in the top 30cm. They have varying water- and nutrient-holding capacity depending on amount of clay in the profile. Ironstone gravel may also be present in the profile.
Representative site 1: WMIR16ob
WA soil group: Pale deep sand
Qualifier: PSV (Poor sand, very deep – sand is mainly coarse or medium grained, and no hardpan, solid rock or clay layer present in the top 150 cm)
ASC: Hypernatric, Red Sodosol
Location: GDA94 Zone 50, 309884mE, 6767856mN
Map unit: Allanooka 1 flats subsystem (221Al_1) Chemical analysis: See Site 16 in Appendix C
Prof i le descr ipt ion
Depth (cm) Description
0–10 Greyish-brown (10YR 5/2 moist) sand
10–100 Greyish-brown (10YR 5/2 moist) sand
100–200 Yellow (10YR 6/8 moist) sand
200–300 Yellowish-red (5YR 5/8 moist) sandy clay loam
300–400 Strong-brown (7.5YR 5/8 moist) sandy clay loam
400–500 Strong-brown (7.5YR 5/8 moist) sandy clay loam
500–600 Yellowish-brown (10YR 5/8 moist) sandy loam
600–700 Yellowish-brown (10YR 5/8 moist) sandy loam
700–800 Yellowish-brown (10YR 5/8 moist) sandy loam
800–900 Yellowish-brown (10YR 5/8 moist) sandy clay loam
900–1000+ Yellowish-brown (10YR 5/8 moist) sandy clay loam
Representative site 2: WMIR14ob
WA soil group: Pale deep sand
Qualifier: PSE (Poor sand, effective duplex – coarse or medium sand is dominant, and a clay loam to clay layer or soft coffee rock is present at 80–150cm)
ASC: Mottled-Hypernatric, Red Sodosol
Location: GDA94 Zone 50, 313631mE, 67591400mN
Map unit: Greenough Alluvium subsystem 3 (221Ga_3)
Chemical analysis: See Site 14 in Appendix C

Soil capability assessment for Irwin
52
Prof i le descr ipt ion
Depth (cm) Description
0–10 Very dark-brown (10YR 2/2 moist) sand; non–wetting
10–100 Dark yellowish-brown (10YR 4/6 moist) sand
100–200 Yellowish-red (5YR 4/6 moist) light clay with olive (5Y 5/3 moist) mottles; very few calcareous nodules; no audible or visible effervescence
200–300 Brown (7.5YR 5.4 moist) sandy clay loam; very few calcareous nodules; no audible or visible effervescence
300–400 Brown (7.5YR 5.4 moist) sandy clay loam; very few calcareous nodules; no audible or visible effervescence
400–500 Brown (7.5YR 5.4 moist) sandy clay loam
500–600 Brown (7.5YR 5.4 moist) sandy clay loam
600–700+ Brown (7.5YR 5.4 moist) sandy clay loam
Representative site 3: WM0208
WA soil group: Pale deep sand
Qualifier: GSE (Good sand, effective duplex – clayey, loamy or fine sand dominates the profile below 30cm, and the clay loam to clay subsoil is present at 80–150cm)
ASC: Red Sodosol
Location: GDA94 Zone 50, 322563mE, 6752268mN
Map unit: 224Ma_6
Chemical analysis: See Rogers (1996)
Prof i le descr ipt ion
Depth (cm) Description
0–10 Pale-grey fine sand
10–70 White fine sand
70–80 Very pale brown (10YR 7/4 moist) fine sand
80–85+ Yellowish-red (5YR 5/8 moist) sandy clay loam

Appendix D
53
D3 Grey deep sandy duplex
These soils have grey sand over non-alkaline sandy clay loam to clay at 30–80cm.
Representative site 1: GTN 1035
WA soil group: Grey deep sandy duplex
Qualifier: PWN (Poor sand, good neutral subsoil)
ASC: Yellow Chromosol
Location: GDA94 Zone 50, 323531mE, 6767793mN
Map unit: Mount Horner system (224Mh)
Chemical analysis: See Rogers (1996)
Prof i le descr ipt ion
Depth (cm) Description
0–7 Greyish-brown (10YR 5/2 moist) loamy sand; sandy fabric; pH 6 (soil paste)
7–20 Light brownish-grey (10YR 6/2 moist) sand; sandy fabric; pH 6 (soil paste)
20–45 Very pale brown (10YR 8/2 moist) sand; sandy fabric; pH 6.7 (soil paste)
45–68 Very pale brown (10YR 7/3 moist) sand; sandy fabric; pH 7 (soil paste)
68–110 Yellow (10YR 7/6 moist) sandy clay loam; pH 6.7 (soil paste); few fine angular quartz coarse fragments and few fine subrounded ferric ironstone gravels
110–135+ Yellow (10YR 7/8 moist) sandy clay loam; pH 6.7 (soil paste); few fine angular quartz coarse fragments and few fine subangular ferric ironstone gravels
D4 Self-mulching cracking clay
These soils are a cracking clay with a self-mulching surface.
Representative site 1: WM 0222
WA soil group: Self-mulching cracking clay
Qualifier: CLK (Alkaline subsoil)
ASC: Self-mulching, Brown Vertosol
Location: GDA94 Zone 50, 312560mE, 6763310mN
Map unit: Greenough Alluvium subsystem 3 (221Ga_3)

Soil capability assessment for Irwin
54
Prof i le descr ipt ion
Depth (cm) Description
0–5 Dark greyish-brown (10YR 4/2 moist) silty clay loam
5–20 Dark greyish-brown (10YR 4/2 moist) silty light clay
20–140 Very dark greyish-brown (10YR 3/2 moist) medium clay; common fine calcareous soft segregations
140–170 Brown (7.5YR 4/4 moist) medium heavy clay
170–225 Brown (7.5YR 5/4 moist) medium clay
225–310 Light yellowish-brown (10YR 6/4 moist) medium clay; abundant coarse calcareous soft segregations and few fine ferromanganiferous soft segregations and many medium calcareous nodules
310–380+ Yellowish-brown (10YR 5/4 moist) medium clay
Chemical analysis
Depth (cm) Text
ure
CF%
Clay
pH
EC
OC_w
b
B_Ca
Cl2
K_HC
O 3
P_HC
O 3
CEC
Exch
_Ca
Exch
_K
Exch
_Mg
Exch
_Na
ESP
Exch
_Al
0–5 ZCL 4 33a 7.6 10 0.75 1.22 588 14 29.6a 24.34 1.52 3.50 0.24 1 0.04
5–20 ZLC 9 38a 7.7 9 0.61 1.01 423 9 29.0a 23.77 1.12 3.81 0.30 1 0.04
20–140 MC 11 50a 7.9 28 0.42 5.21 340 1 30.1a 13.45 0.91 11.18 4.52 15 0.06
40–170 MC 3 50a 8.1 47 0.22 19.62 330 1 28.2a 8.12 0.87 11.08 8.09 29 0.05
170–225 MC 6 50a 8.3 49 0.25 15.63 295 1 25.5a 7.76 0.80 9.05 7.86 31 0.06
225–310 MC 6 50a 8.2 45 0.22 12.48 265 1 19.8a 6.78 0.64 6.17 6.17 31 0.05
310–380 MC 3 50a 8.3 30 0.15 16.48 328 1 21.5a 4.43 0.80 8.15 8.15 38 0.12
400–500 C 2 43 8.0 37 0.10 4.50 279 1 18.6 7.49 0.74 4.68 5.59 30 0.12
1000–1050 C 4 45 4.6 18 0.08 2.54 274 1 10.6a 2.08 0.66 3.89 3.96 37 0.16
a Values have been estimated or inferred from related observations or measurements.
D5 Gravelly pale deep sand
Sand greater than 15cm (and pale to at least 30cm) over gravelly sand greater than 80cm deep. Gravels are a dominant feature of the profile.
Representative site 1: WM0135
WA soil group: Gravelly pale deep sand
Qualifier: GSV (Good sand, very deep)
ASC: Sesqui-Nodular Tenosol
Location: GDA94 Zone 50, 320440mE, 6762260mN
Map unit: Mount Horner system (224Mh)

Appendix D
55
Prof i le descr ipt ion
Depth (cm) Description
0–10 Grey medium sand
10–75 Very pale yellow fine sand
75–80+ Very pale yellow fine sand with abundant (50–90%) ferric ironstone coarse fragments
Representative site 2: GTN1471
WA soil group: Gravelly pale deep sand
Qualifier: PSV (Poor sand, very deep)
ASC: Sesqui-Nodular Tenosol
Location: GDA94 Zone 50, 323650mE, 6763950mN
Map unit: Mount Horner (224Mh)
Chemical analysis: See Rogers (1996)
Prof i le descr ipt ion
Depth (cm) Description
0–9 Light-grey (10YR 7/2 moist) sand; pH 6.5 (soil paste)
9–16 Dark-grey (10YR 4/1 moist) sand; pH 6.5 (soil paste)
16–22 Light-grey (10YR 7/2 moist) sand; pH 7 (soil paste)
22–31+ Light-grey (10YR 7/2 moist) sand; pH 7 (soil paste); many subrounded to subangular fine to coarse size ferric ironstone coarse fragments
D6 Deep sandy gravel These are ironstone gravel soils with a predominantly sandy matrix, usually over clay, cemented gravels (ferricrete), or reticulite at greater than 80cm.
Representative site 1: WM 0128
WA soil group: Deep sandy gravel
Qualifier: GSV (Good sand, very deep)
ASC: Sesqui-Nodular Tenosol
Location: GDA94 Zone 50, 320200mE, 6761997mN
Map unit: Irwin 1 subsystem (224Ir_1)
Chemical analysis: See Rogers (1996)

Soil capability assessment for Irwin
56
Prof i le descr ipt ion
Depth (cm) Description
0–5 Yellowish-brown (10YR 5/4 moist) medium fine sand
5–50 Strong-brown (7.5YR 5/5 moist) medium fine sand; many ironstone gravels
50–80+ Strong-brown (7.5YR 4/6 moist) medium fine sand; many ironstone gravels
D7 Yellow/brown shallow sand
These soils are yellow or brown sand over rock, hardpan or other cemented layer at less than 80cm.
Representative site 1: WM 0168
WA soil group: Yellow/brown shallow sand
Qualifier: VSH (Very shallow rock substrate - solid rock, hardpan or a cemented layer is present at less than 30cm)
ASC: Leptic Tenosol
Location: GDA94 Zone 50, 311331mE, 6767855mN
Map unit: 224MhTA
Chemical analysis: For representative chemical analysis for Yellow/brown shallow sand see Rogers (1996)
Prof i le descr ipt ion
Depth (cm) Description
0–10 Light reddish-brown (5YR 6/4 moist) fine sand
10–11+ Limestone
D8 Red sandy earth
These soils are red sands grading to loam by 80cm.
Representative site 1: WM 0225 (deep drilling site)
WA soil group: Red sandy earth
Qualifier: PSS (Poor subsoil – poorly structured (typically sodic) clay or clay loam subsoil above 80cm which impedes water movement and root growth)
ASC: Sodic, Eutrophic, Red Kandosol
Location: GDA94 Zone 50, 310561mE, 6766452mN
Map unit: Greenough Alluvium subsystem 2 (221Ga_2)

Appendix D
57
Prof i le descr ipt ion
Depth (cm) Description 0–20 Red sand
20–100 Red fine sandy loam
100–200 Red fine to medium sandy loam
200–300 Red fine sandy loam; audible and slightly visible effervescence
300–400 Red loam; audible but no visible effervescence
400–500 Red loam; audible but no visible effervescence
500–600 Red clay
600–700 Red clay
700–800 Red clay
800–900 Red clay
900–1000+ Red clay
Chemical analysis
Depth (cm) Cl
ay
Silt
Sand
pH C
aCl 2
EC
OC_w
b
B_Ca
Cl2
K_HC
O 3
P_HC
O 3
CEC
Exch
_Ca
Exch
_K
Exch
_Mg
Exch
_Na
ESP
Exch
_Al
0–10 6.89 1.98 91.12 4.5 2.9 0.94 0.32 56 20 38.03 2.09 0.1 0.36 0.07 3 0.136
50–70 24.35 2.93 72.72 5.4 6 0.27 0.53 262 2 18.56 2.44 0.62 0.99 0.47 10 0.138
100–200 6.5 8.4
200–300 8.8 13.1
300–400 38.7 18.88 42.42 8.7 20.3 0.11 2.8 338 <2 43.54 4.5 0.72 5.43 6.2 37 0.058
400–500 8.8 21.3
500–600 8.8 24.8
600–700 29.81 13.93 56.26 8.4 22 0.08 2.46 280 <2 41.19 3.02 0.62 3.71 4.93 40 0.038
700–800 7.8 11.4
800–900 7.8 11.7
900–1000+ 7.6 13.4
Representative site 2: WM 0225a (hand augured site adjacent to WM 0225)
Prof i le descr ipt ion
Depth (cm) Description 0–10 Red sand
10–15 Red medium sand
15–40 Red medium sand
40–80+ Red fine sandy loam

Soil capability assessment for Irwin
58
D9 Hard cracking clay
These soils are cracking clays without a self-mulching surface.
Representative site 1: WM 0223
WA soil group: Hard cracking clay
Qualifier: CLK (Alkaline subsoil: clay loam to clay subsoil above 80cm is alkaline)
ASC: Massive, Brown Vertosol
Location: GDA94 Zone 50, 310845mE, 6765168mN
Map unit: Greenough Alluvium (221Ga_1IR)
Prof i le descr ipt ion
Depth (cm) Description
0–20 Dark-brown (7.5YR 3/2 moist) sandy silty clay; 5% subrounded gravel, medium sized
20–40 Dark-brown (7.5YR 3/3 moist) sandy light clay
40–100 Brown (7.5YR 4/4 moist) medium clay
100–160 Reddish-brown (5YR 4/4 moist) medium clay; common calcareous nodules
160–250 Brown (7.5YR 4/4 moist) medium clay
250–300 Strong-brown (7.5YR 4/6 moist) fine sandy light clay
300–365+ Strong-brown (7.5YR 4/6 moist) fine sandy clay loam
Chemical analysis
Depth (cm)
Text
ure
CF%
Clay
pH C
aCl 2
EC
OC_w
b
B_Ca
Cl2
K_HC
O 3
P_HC
O 3
CEC_
Exch
_Ca
Exch
_K
Exch
_Mg
Exch
_Na
ESP
Exch
_Al
0–20 ZC 5 40a 5.9 4 1.21 0.82 396 16 10.4a 7.55 0.87 1.65 0.35 3 0.02
20–40 SLC 10 38a 6.0 6 0.46 0.69 150 12 8.6a 5.76 0.32 1.84 0.66 8 0.02
40–100 MC 3 50a 7.4 34 0.23 1.72 131 1 19.7a 9.66 0.33 6.31 3.43 17 0.05
100–160 MC 5 50a 8.0 64 0.18 3.81 135 1 22.7a 10.20 0.34 6.62 5.59 25 0.06
160–250 MC 2 50a 7.7 74 0.13 2.99 179 1 22.3a 7.20 0.40 6.92 7.79 35 0.07
250–300 FSLC 3 38a 7.3 42 0.13 2.14 162 1 12.8a 3.27 0.31 4.15 5.06 40 0.11
300–365 FSCL 0 25a 7.8 45 0.07 1.59 113 2 9.1a 2.25 0.21 2.82 3.83 42 0.10
400–500 C 0 50a 7.0 38 0.13 2.56 287 3 17.2a 2.31 0.67 5.40 8.81 51 0.05
600–700 C 0 50a 6.8 61 0.11 4.81 320 6 19.8a 1.62 0.72 5.83 11.6 59 0.06
900–1000 C 0 50a 7.2 46 0.11 2.92 262 7 13.8a 1.27 0.54 3.64 8.35 61 0.07
a Values have been estimated or inferred from related observations or measurements.

Appendix D
59
D10 Shallow gravel Ironstone gravel soil over cemented gravels (ferricrete), rock or other hard or permanently cemented layers at less than or equal to 80cm
Representative site 1: GTN 1467
WA soil group: Shallow gravel
Qualifier: SAM (Sandy matrix – stones or gravel are surrounded by a predominantly coarse to clayey sand, sandy matrix)
ASC: Petroferric, Sesqui-Nodular Tenosol
Location: GDA94 Zone 50, 323179 mE, 6765010mN
Map unit: 224Mh
Chemical analysis: See Rogers (1996)
Prof i le descr ipt ion
Depth (cm) Description
0–6 Dark-grey (10YR 4/1 moist) loamy sand; weak consistence; single grain structure; sandy fabric; very few subrounded ferruginous ironstone gravel, fine sized; pH 6; abrupt boundary
6–19 Greyish-brown (10YR 5/2 moist) sand; weak consistence; massive structure; sandy fabric; few subrounded ferruginous ironstone gravel, many fine- to coarse-sized subangular ferruginous ironstone gravel; pH 6.5; clear boundary
19–52 Pale-brown (10YR 6/3 moist) sand; weak consistence; massive structure; sandy fabric; few subrounded ferruginous ironstone gravel, many fine- to coarse-sized subangular ferruginous ironstone gravel; pH 6.5; clear boundary
52–70+ Brownish-yellow (10YR 6/8 moist) sand; common distinct mottles; firm consistence; massive structure; sandy fabric; pH 6.5
D13 Yellow/brown deep sandy duplex
These soils are yellow/brown sand over sandy clay loam to clay at 30–80cm.
Representative site 1: FFS0019
WA soil group: Yellow/brown deep sandy duplex
Qualifier: NEU (Good neutral subsoil)
ASC: Haplic, Dystrophic, Yellow Chromosol
Location: GDA94 Zone 50, 312932mE, 6762623mN
Map unit: Mount Horner Tamala subsystem (224MhTA)

Soil capability assessment for Irwin
60
Prof i le descr ipt ion
Depth (cm) Description 0–10 Light brownish-grey (10YR 6/2 moist) loamy sand; few roots; water repellent; pH
5 (soil paste)
10–20 Light brownish-grey (10YR 6/2 moist) very weak clayey sand; pH 6 (soil paste)
20–70 Yellow (10YR 7/6 moist) weak clayey sand; pH 6 (soil paste)
70–100+ Brownish-yellow (10YR 6/6 moist) sandy clay; complete slaking; no dispersion; pH 6.5 (soil paste)
Chemical analysis
Depth (cm) pH C
aCl 2
EC
OC
_wb
B_C
aCl 2
K_H
CO
3
P_H
CO
3
PRI
Exch
_Ca
Exch
_K
Exch
_Mg
Exch
_Na
ESP
Exch
_Al
0–10 5.6 5.3 0.93 0.2 58 17 0.6 2.6 0.15 0.35 0.04 1 <0.001
20–40 5.9 2.4 0.09 0.44 95 3 1.59 0.24 0.63 0.06 2 <0.001
50–70 5.6 1 0.05 0.15 33 7 0.5 0.08 0.09 0.01 1 <0.001
80–100+ 5.2 1 0.09 0.15 33 16 0.45 0.08 0.08 <0.01 1 <0.001
D14 Brown deep sand
These soils are brown sands greater than 80cm deep.
Representative site 1: GTN 1472 WA soil group: Brown deep sand Qualifier: GSV (Good sand, very deep) ASC: Basic, Regolithic, Yellow-Orthic Tenosol Location: GDA94 Zone 50, 323760mE, 6762103mN Map unit: Mount Horner system (224Mh) Chemical analysis: See Rogers (1996)
Prof i le descr ipt ion
Depth (cm) Description A, 0–10 Dark-grey (10YR 4/1 moist) loamy sand; weak moist consistence; single grain
structure; sandy fabric; pH 6.5; abrupt boundary
A, 10–22 Greyish-brown (10YR 5/2 moist) loamy sand; weak moist consistence; single grain structure; sandy fabric; pH 6; clear boundary
A, 22–41 Yellowish-brown (10YR 5/4 moist) clayey sand; weak moist consistence; single grain structure; sandy fabric; pH 6; clear boundary
B, 41–185+ Yellow (10YR 7/8a moist) clayey sand; weak moist consistence; massive structure; sandy fabric; pH 6
a The original code for this colour is 20YR 7/8 in DPIRD’s Soil Profile Database; however, we assume colour code 10YR 7/8 was intended.

Appendix D
61
D15 Red loamy earth
These soils are red loam, may grade to clay and may have a red-brown hardpan below 50cm.
Representative site 1: WM 0226 (deep drilling site) WA soil group: Red loamy earth Qualifier: PSS (Poor subsoil) ASC: Sodic, Mesotropic, Red Kandosol Location: GDA94 Zone 50, 314163mE, 6765615mN Map unit: Irwin 2 subsystem (224Ir_2) Chemical analysis: See site 226 in Appendix C
Prof i le descr ipt ion
Depth (cm) Description 0–10 see site WM0226a below 10–100 see site WM0226a below 100–200 Red sand 200–300 Red sand 300–400 Red sandy loam 400–500 Coarse clay 500–600 Coarse clay 600–700 Coarse clay 700–800 Coarse clay 800–900 Coarse clay (sloppy) 900–1000 Coarse clay (sloppy) 1000–1100+ Coarse clay (sloppy)
Representative site 2: WM 0226a (hand-augered site) WA soil group: Red loamy earth Qualifier: PSS (Poor subsoil) ASC: Sodic, Mesotropic, Red Kandosol Location: GDA94 Zone 50, 314163mE, 6765615mN Map unit: Irwin 2 subsystem (224Ir_2)
Prof i le descr ipt ion
Depth (cm) Description 0–5 Red fine sandy loam
5–30+ Red, silty, fine sandy loam

Appendix E Predicted crop yield reductions at varying levels of soil salinity in sand, loam and clay
Table E1 Levels of soi l salinity causing reduced crop yields in sand, loam and clay
Crop
0% yield reduction at EC1:5 (mS/m)
10% yield reduction at EC1:5 (mS/m)
25% yield reduction at EC1:5 (mS/m)
50% yield reduction at EC1:5 (mS/m)
Sand Loam Clay Sand Loam Clay Sand Loam Clay Sand Loam Clay
Cotton 45 70 96 55 85 119 70 115 161 95 150 211
Wheat 35 55 75 40 65 92 50 85 118 70 115 161
Soybean 30 45 62 30 50 68 35 55 77 40 65 93
Sorghum 20 35 40 30 45 63 40 65 89 60 100 137
Broccoli 15 25 35 20 35 48 30 50 68 45 70 102
Fig 15 25 34 20 35 47 30 50 68 45 75 104
Olive 15 25 34 20 35 47 30 50 68 45 75 104
Pomegranate 15 25 34 20 35 47 30 50 68 45 75 104
Rockmelon 10 20 27 20 30 45 30 50 71 50 80 113
Tomato 15 20 31 20 30 43 30 45 62 40 70 94
Cucumber 15 20 31 20 30 41 25 40 55 35 55 78
Corn (forage) 10 15 22 20 30 40 30 45 65 45 75 107
Cabbage 10 15 22 15 25 35 25 40 55 40 60 87
Broad bean 10 15 20 15 25 32 25 40 52 40 60 84
Corn, sweet (grain) 10 15 21 15 20 31 20 35 47 35 50 73
Potato 10 15 21 15 20 31 20 35 47 35 50 73
(continued)

Table E1 cont inued
Crop
0% yield reduction at EC1:5 (mS/m)
10% yield reduction at EC1:5 (mS/m)
25% yield reduction at EC1:5 (mS/m)
50% yield reduction at EC1:5 (mS/m)
Sand Loam Clay Sand Loam Clay Sand Loam Clay Sand Loam Clay
Grape 10 15 19 15 20 31 25 35 51 40 60 83
Sweet potato 10 15 19 15 20 30 20 35 47 35 55 75
Orange 10 15 21 15 20 29 20 30 40 30 40 60
Peach 10 15 21 15 20 27 15 25 36 25 35 51
Capsicum 10 15 19 15 20 27 20 30 41 30 45 63
Plum 10 15 19 15 20 26 15 25 36 25 40 53
Almond 5 15 19 10 20 25 15 25 35 25 35 51
Radish 5 10 15 10 20 25 15 25 39 30 45 62
Avocado 5 10 16 10 15 22 15 20 31 20 35 46
Carrot 5 10 12 10 15 21 15 25 35 25 40 57
Bean 5 10 12 10 15 19 15 20 29 20 30 45
Strawberry 5 10 12 7 12 16 10 15 22 15 25 31
Source: George and Wren (1985), based on data from Ayers and Westcot (1985) and Maas and Hoffman (1977).

Soil capability assessment for Irwin
64
Shortened forms Short form Long form
ASC Australian Soil Classification
DPIRD Department of Primary Industries and Regional Development
EC electrical conductivity
ha hectare
km kilometre
mg/L milligrams per litre
m metre
mm millimetre
mS/m millisiemens per metre
NRInfo Natural Resource Information mapping portal, <https://www.agric.wa.gov.au/resource-assessment/nrinfo-western-australia>
WA Western Australia

References
65
References Ayers, RS & Westcot, DW 1985, ‘Water quality for agriculture’, FAO irrigation and drainage paper no. 29, Food and Agriculture Organization of the United Nations, Rome.
Blandford, DC 2008, Soils investigation of the Dongara project area, stage 2, report to Tiwest Pty Ltd, available from www.epa.wa.gov.au, unpublished report.
Bownds, G 2018, ‘Irwin focus area – groundwater resource investigation’, Hydrogeological record series no. 400, Government of Western Australia, Perth, unpublished report.
Bownds, G & Paker, H 2018, ‘Bore completion report – Irwin focus area drilling program’, Hydrogeological report series no. 401, Department of Water and Environmental Regulation, Perth.
Brooke, BP, Olley, JM, Pietsch, T, Playford, PE, Haines, PW, Murray-Wallace, CV & Woodroffe, CD 2014, ‘Chronology of Quaternary coastal aeolianite deposition and the drowned shorelines of south-western Western Australia — a reappraisal’, Quaternary Science Reviews, vol. 93, pp. 106–124.
Commander, DP 2003, ‘Outline of the geology of the Perth region’, Australian Geomechanics, vol. 38, no. 3, pp. 7–16.
Department of Water 2016, ‘Land use compatibility tables for public drinking water source areas’, Water quality protection note no. 25, Government of Western Australia, Perth.
Department of Water 2017a, Draft Midlands groundwater and land assessment: Selection of focus areas, Government of Western Australia, Perth.
Department of Water, 2017b, ‘Gazetted public drinking water source areas’, Water quality protection note no. 75, Government of Western Australia, Perth.
Department of Water 2017c, ‘Northern Perth Basin: Geology, hydrogeology and groundwater resources’, Hydrogeological bulletin series report HB1, Government of Western Australia, Perth.
Department of Water and Environmental Regulation 2018, ‘Groundwater-dependent environmental values relevant to the Irwin and Dinner Hill focus areas’, Environmental water report series no. 30, Government of Western Australia, Perth.
Enright, NJ, He, TH, Krauss, SL, Lamont, BB & Miller, BP 2003, ‘Genetic variation and biogeographic history in the restricted south-western Australian shrub, Banksia hookeriana’, Physical Geography, vol. 24, no. 5, pp. 358–377, doi: 10.2747/0272-3646.24.5.358.
George, PR & Wren, BA 1985, ‘Crop tolerance to soil salinity’, Technote no. 6/85, Western Australian Department of Agriculture, Perth.
Griffin, EA, Stuart-Street, A, van Wyk, L & Tille, PJ 2019, ‘Soil capability assessment for expanding irrigated agriculture in the Dinner Hill focus area, Midlands, Western Australia’, Resource management technical report 406, Department of Primary Industries and Regional Development, Perth.

Soil capability assessment for Irwin
66
Isbell, RF & National Committee on Soil and Terrain 2016, The Australian soil classification, 2nd edn, CSIRO Publishing, Collingwood.
Kern, AM 1997, ‘Hydrogeology of the coastal plain between Cervantes and Leeman, Perth Basin’, Hydrogeological record HG3, Water and Rivers Commission, Perth.
Kern, AM & Koomberi, HA 2013, ‘Hydrogeology of the coastal plain between Geraldton and Dongara’, Hydrogeology report series, HR 261, Department of Water, Perth, unpublished report.
Koomberi, HA 1994, ‘Greenough shallow drilling project bore completion reports’, Hydrogeology report no. 1994/56, Geological Survey of Western Australia, Perth.
Krauss, SL, Tianhua, H, Lamont, BB, Miller, BP & Enright, NJ 2006, ‘Late Quaternary climate change and spatial genetic structure in the shrub Banksia hookeriana’, Molecular Ecology, vol. 15, pp. 1125–1137.
Lipar, M & Webb, JA 2015, ‘The formation of the pinnacle karst in Pleistocene Aeolian calcarenites (Tamala Limestone) in south-western Australia’, Earth Science Review, vol. 140, pp. 182–202.
Lowry, DC 1974, Geological survey of Western Australia 1:250 000 geological series, Explanatory notes Dongara – Hill River, Western Australia (sheet SH/50-5,9), Australian Government Publishing Service, Canberra.
Maas, EV & Hoffman, GJ 1977, ‘Crop salt tolerance-current assessment’, Journal of the Irrigation and Drainage Division: Proceedings of the American Society of Civil Engineering, vol. 103, pp. 115–134.
Moore, G, Hall, D & Russell, J 1998, ‘Soil water’, in G Moore (ed.), Soilguide: a handbook for understanding and managing agricultural soils, Bulletin 4343, Department of Agriculture and Food, Western Australia, Perth.
Mory, AJ 1995, Geology of the Mingenew – Dongara 1:100 000 sheet: Western Australia Geological Survey, 1:100 000 Geological Series Explanatory Notes, Geological Survey of Western Australia, Perth.
Munsell Color Company 1975, Munsell soil color chart, Munsell Color Company Inc., Baltimore.
National Committee on Soil and Terrain 2009, Australian soil and land survey field handbook, CSIRO Publishing, Melbourne.
Raupach, M & Tucker, BM 1959, ‘The field determination of soil reaction’, Journal of Australian Institute of Agricultural Science, vol. 25, pp. 129–33.
Rogers, LG 1996, ‘Geraldton region land resources survey’, Land resources series no. 13, Agriculture Western Australia, South Perth.
Schoknecht, N & Pathan, S 2013, ‘Soil groups of Western Australia: A simple guide to the main soils of Western Australia’, 4th edn, Resource management technical report 380, Department of Agriculture and Food, Western Australia, Perth.
Schoknecht, N, Tille, PJ & Purdie, B 2004, ‘Soil-landscape mapping in south-western Australia: overview of methodology and outputs’, Resource management technical report 280, Department of Agriculture, Perth.
References
67
Siddall, M, Chappell, J & Potter, EK 2006, ‘Eustatic sea level during past interglacials’, in F Sirocko, M Claussen, MF Sanchez Goñi & T Litt (eds.), The climate of past interglacials, Elsevier, Amsterdam.
Smith, AJ, Massuel, S & Pollock, DW 2012, Geohydrology of the Tamala Limestone Formation in the Perth region: origin and role of secondary porosity, CSIRO, Perth.
Speed, R & Killen, A 2018, ‘Hydrological hazard assessment for irrigated agriculture in the Irwin focus area’, Resource management technical report 407, Department of Primary Industries and Regional Development, Perth.
Tille, PJ, Mathwin, TW & George, RJ 2001, ‘The south-west hydrological information package: understanding and managing hydrological issues on agricultural land in the south-west of Western Australia’, Bulletin 4488, Agriculture Western Australia, Perth.
Tille, P, Stuart-Street, A & van Gool, D 2013, Identification of high quality agricultural land in the Mid West region: Stage 1 Geraldton planning region, 2nd edn, Resource management technical report 386, Department of Agriculture and Food, Western Australia, Perth.
van Gool, D, Tille, P & Moore, G 2005 ‘Land evaluation standards for land resource mapping assessing land qualities and determining land capability in south-western Australia’, Resource management technical report 298, Department of Agriculture and Food, Western Australia, Perth.
van Wyk, L 2018, ‘Crop and climate suitability for the Midlands area of Western Australia’, Resource management technical report 405, Department of Primary Industries and Regional Development, Perth.
Recommended