Smart GridsDick Kronman, ABB Oy, 21.3.2012
From Vision to Reality

Introducing ABB
© ABB Group April 4, 2012 | Slide 3
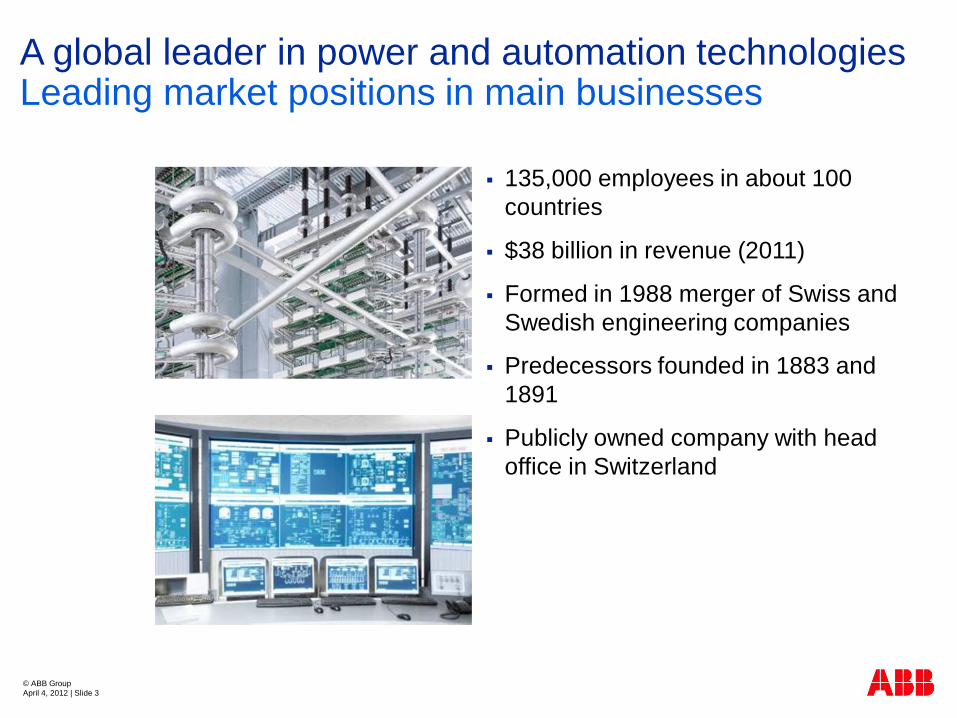
A global leader in power and automation technologiesLeading market positions in main businesses
135,000 employees in about 100 countries
$38 billion in revenue (2011)
Formed in 1988 merger of Swiss and Swedish engineering companies
Predecessors founded in 1883 and 1891
Publicly owned company with head office in Switzerland

Power systems
Discrete automation and motion
Europe
Asia
Americas
Middle East and Africa
Well-balanced business and geographic portfolioCapturing growth opportunities, wherever they arise
Share of employees2011
47%
Mature markets
Emerging markets
Power products
Process automation
Low voltage products
53%
25%
21%22%
12%
20%
Orders by division% of total orders 2011 (non-consolidated)
38%
30%
23%
9%
Orders by region% of total orders 2011
© ABB Group April 4, 2012 | Slide 5
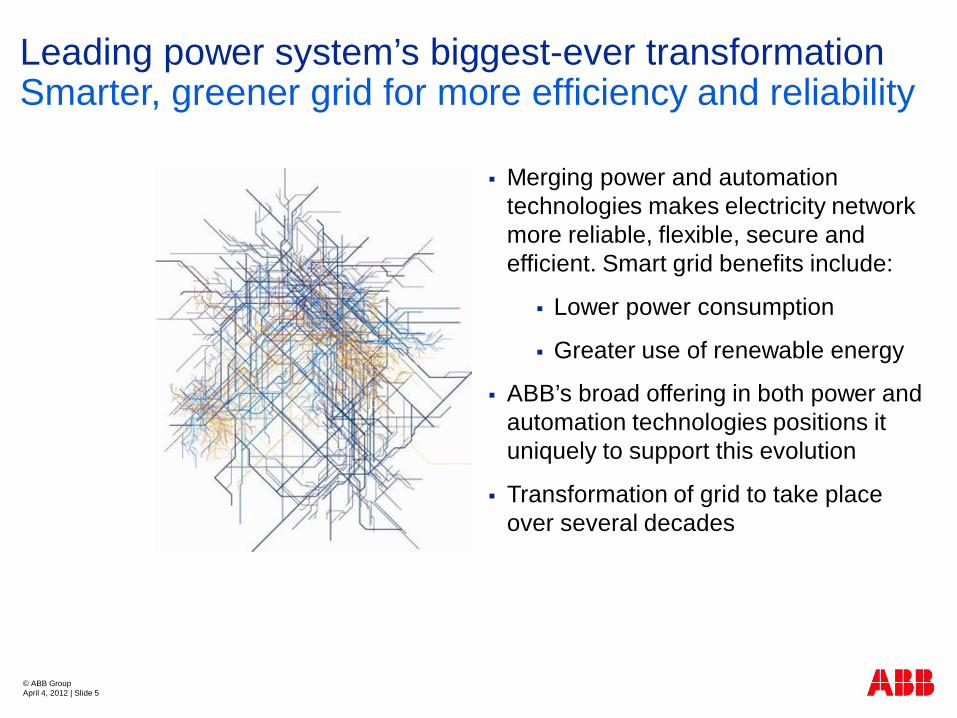
Leading power system’s biggest-ever transformationSmarter, greener grid for more efficiency and reliability
Merging power and automation technologies makes electricity network more reliable, flexible, secure and efficient. Smart grid benefits include:
Lower power consumption
Greater use of renewable energy
ABB’s broad offering in both power and automation technologies positions it uniquely to support this evolution
Transformation of grid to take place over several decades
Transformation of the electricity supply
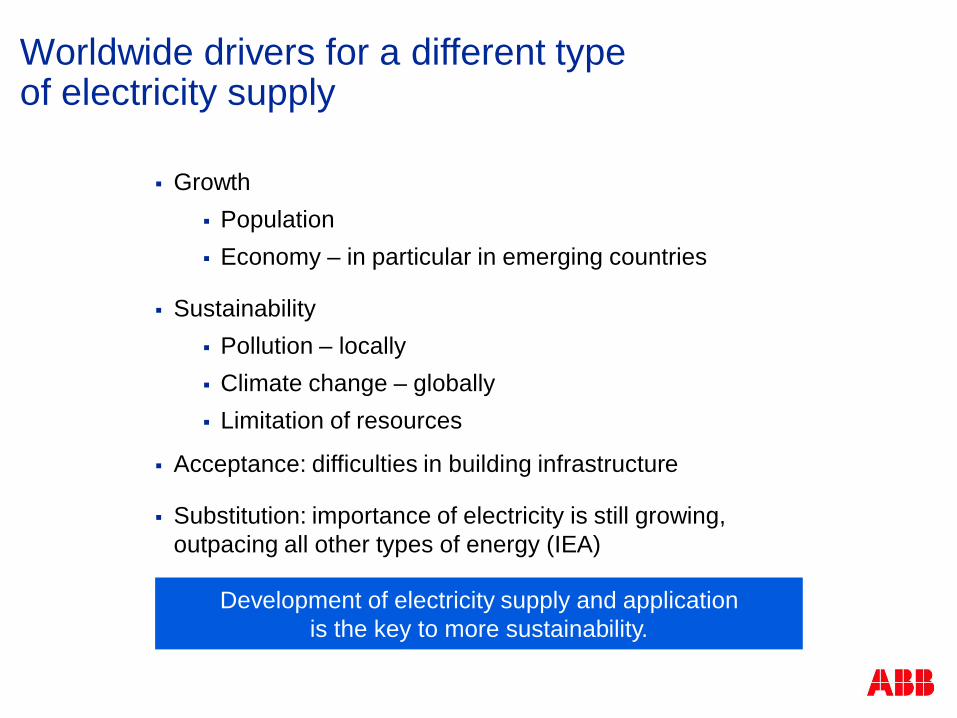
Worldwide drivers for a different typeof electricity supply
GrowthPopulationEconomy – in particular in emerging countries
SustainabilityPollution – locallyClimate change – globallyLimitation of resources
Acceptance: difficulties in building infrastructure
Substitution: importance of electricity is still growing, outpacing all other types of energy (IEA)
Development of electricity supply and applicationis the key to more sustainability.

© ABB Group April 4, 2012 | Slide 8
Today’s energy challengesCut link between growth, energy use and emissions
Meeting these challenges requires the world to:
Reduce the correlation between economic growth
and energy use
Reduce the correlation between energy use and
emissions
Energy
efficiency
Renewable sources
of energy
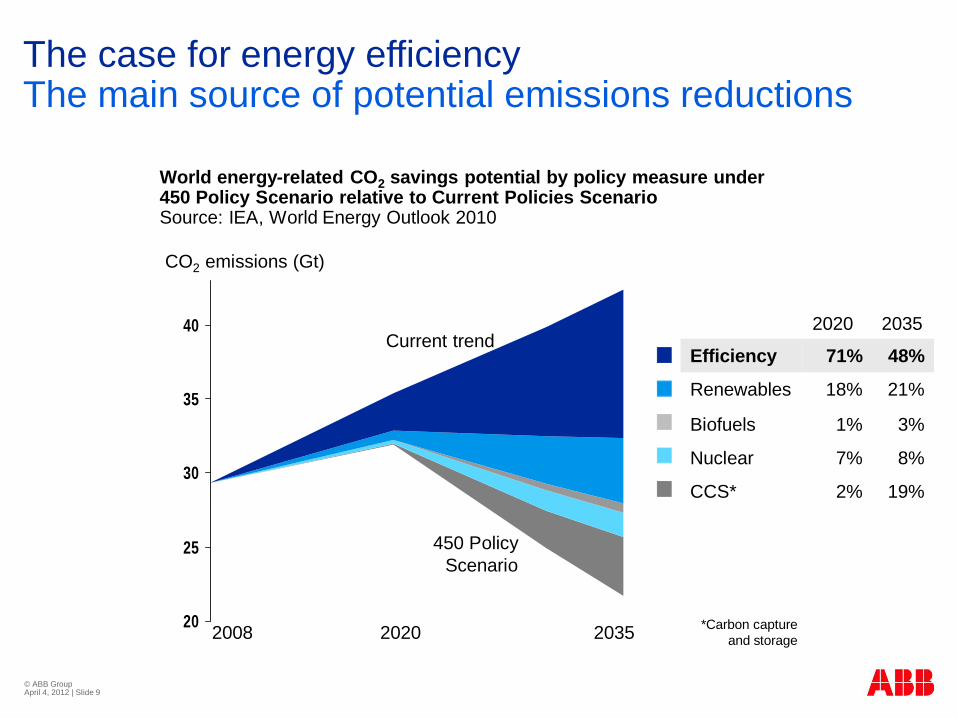
The case for energy efficiencyThe main source of potential emissions reductions
20
25
30
35
40
2008 20352020 *Carbon capture and storage
CO2 emissions (Gt)
World energy-related CO2 savings potential by policy measure under 450 Policy Scenario relative to Current Policies ScenarioSource: IEA, World Energy Outlook 2010
Current trend
450 Policy Scenario
© ABB Group April 4, 2012 | Slide 9
2020 2035
Efficiency 71% 48%
Renewables 18% 21%
Biofuels 1% 3%
Nuclear 7% 8%
CCS* 2% 19%
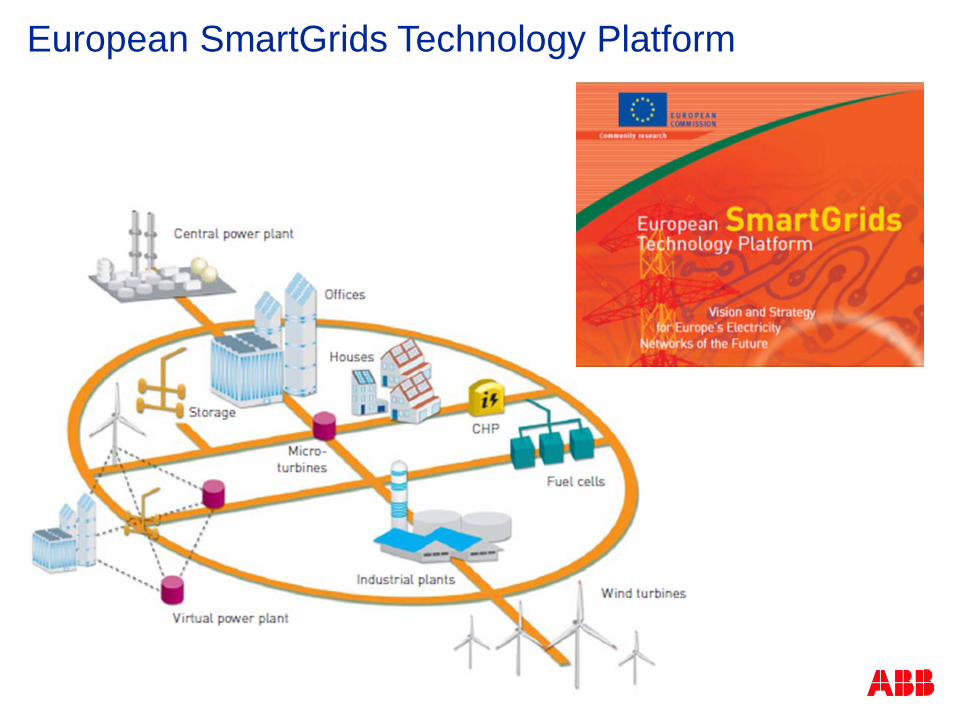
European SmartGrids Technology Platform

Evolution of grid designFrom traditional to future grids
Centralized power generation
One-directional power flow
Generation follows load
Operation based on historical experience
Limited grid accessibility for new producers
Centralized and distributed power generation
Intermittent renewable power generation
Consumers become also producers
Multi-directional power flow
Load adapted to production
Operation based more on real-time data
trad
ition
al g
rids
futu
re g
rids
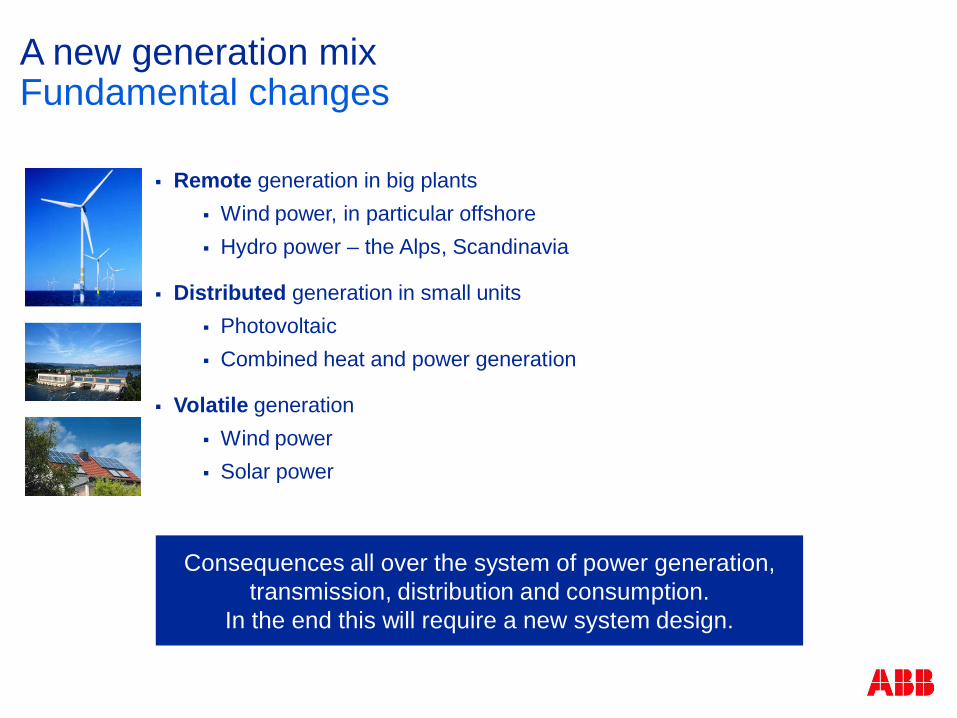
A new generation mixFundamental changes
Remote generation in big plantsWind power, in particular offshoreHydro power – the Alps, Scandinavia
Distributed generation in small unitsPhotovoltaicCombined heat and power generation
Volatile generationWind powerSolar power
Consequences all over the system of power generation, transmission, distribution and consumption.
In the end this will require a new system design.

Managing the challenge


European Electricity Grid Initiative
EEGI – Focus Areas
Source: Entso-e, Edso for SG 2010
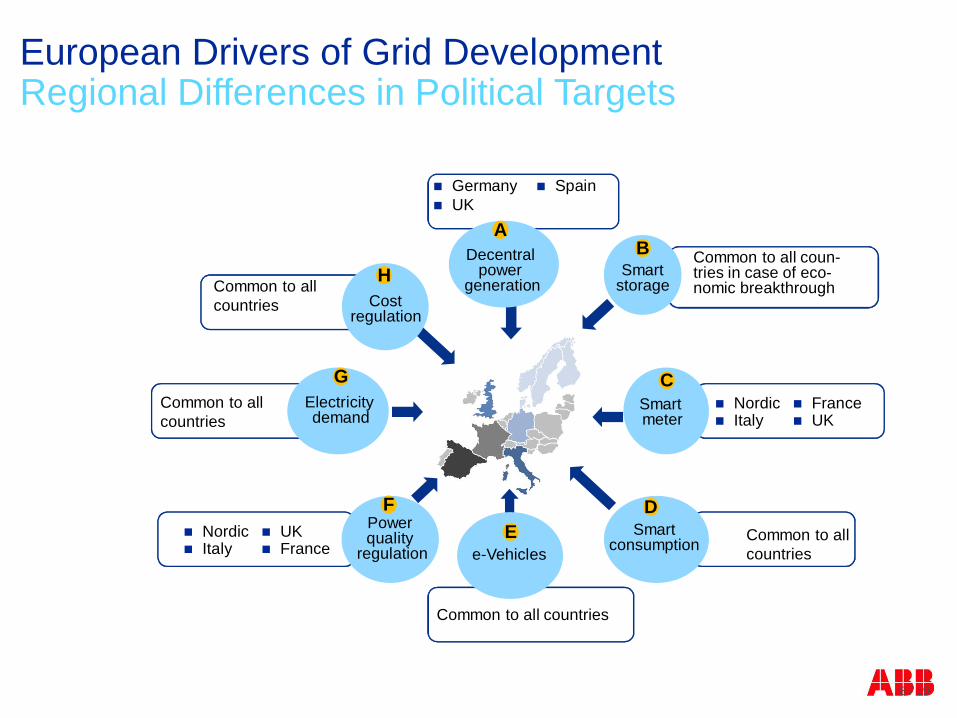
European Drivers of Grid DevelopmentRegional Differences in Political Targets
8 / 19
Common to all countries
Common to allcountries
Germany UK
Spain
Decentral power
generation
A
Smartstorage
B
Smart meter
C
Smart consumption
DPower quality
regulation
F
Electricity demand
G
Costregulation
H
NordicItaly
FranceUK
NordicItaly
UKFrance
Common to allcountries
Common to all coun-tries in case of eco-nomic breakthrough
e-VehiclesE
Common to all countries
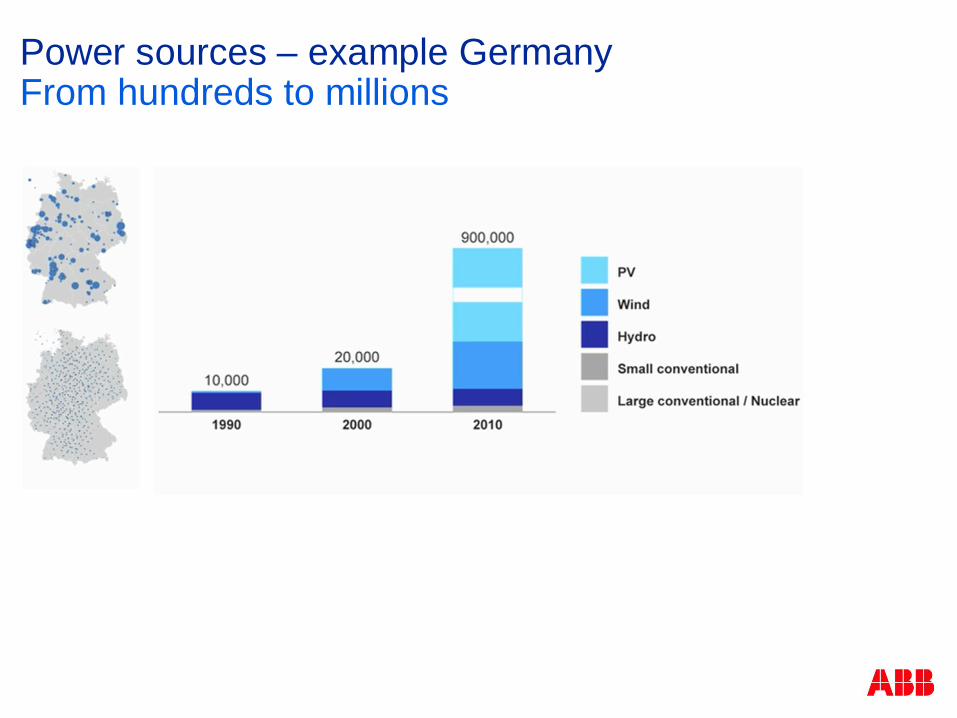
Power sources – example GermanyFrom hundreds to millions

MWWind production
Source :
Statnett
Integration of renewables also brings many challengesExample - balancing demand and supply in real-time
Unpredictable / intermittent
Need for balancing reserves
Legislation / incentives for renewables
Negative tariffs
The effect of heavy wind power feed-in on tariffs
Base: -35,57Peak 9,47Max(18) 42,59Min (7) -199,99
Source: EnBW, 2010
100
50
0
-50
-100
-150
-200
-250
€/MWh
1 2 3 4 5 6 7 8 9 10 11 12 13 14 15 16 17 18 19 20 21 22 23 24
hour
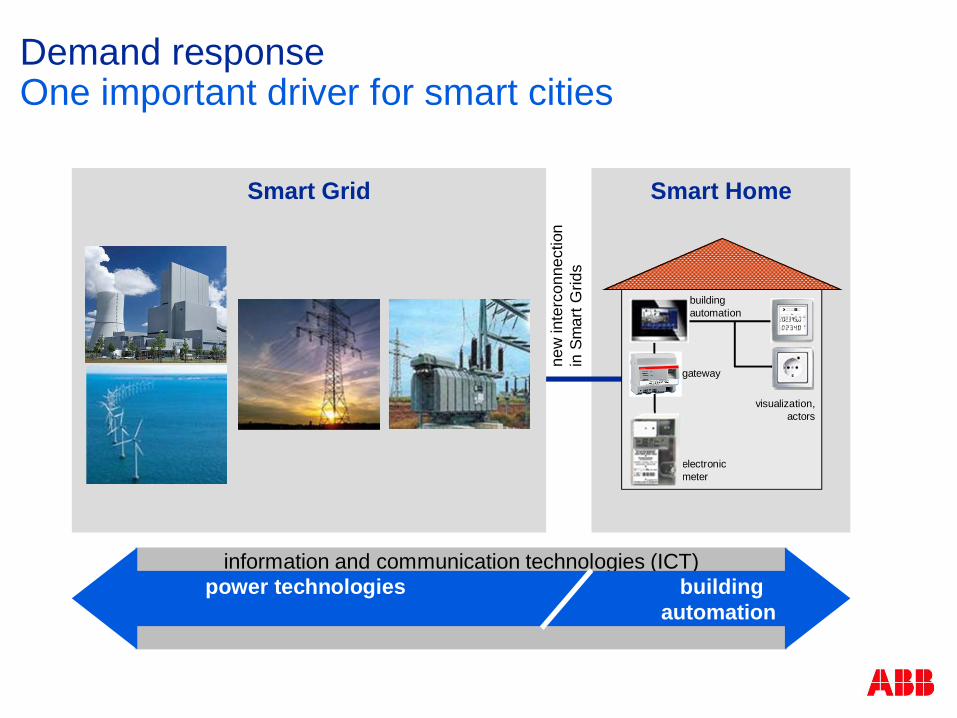
information and communication technologies (ICT)
Demand responseOne important driver for smart cities
Smart Home
power technologies buildingautomation
new
inte
rcon
nect
ion
in S
mar
t Grid
s
Smart Grid
building automation
electronic meter
visualization,actors
gateway
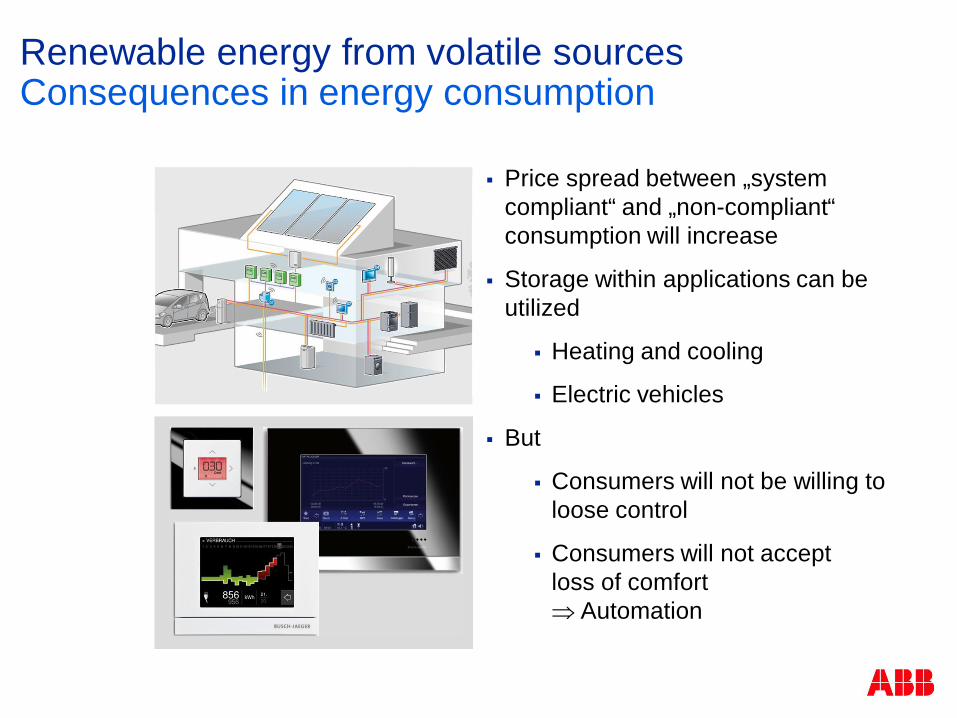
Renewable energy from volatile sourcesConsequences in energy consumption
Price spread between „system compliant“ and „non-compliant“ consumption will increase
Storage within applications can be utilized
Heating and cooling
Electric vehicles
But
Consumers will not be willing to loose control
Consumers will not acceptloss of comfort
Automation
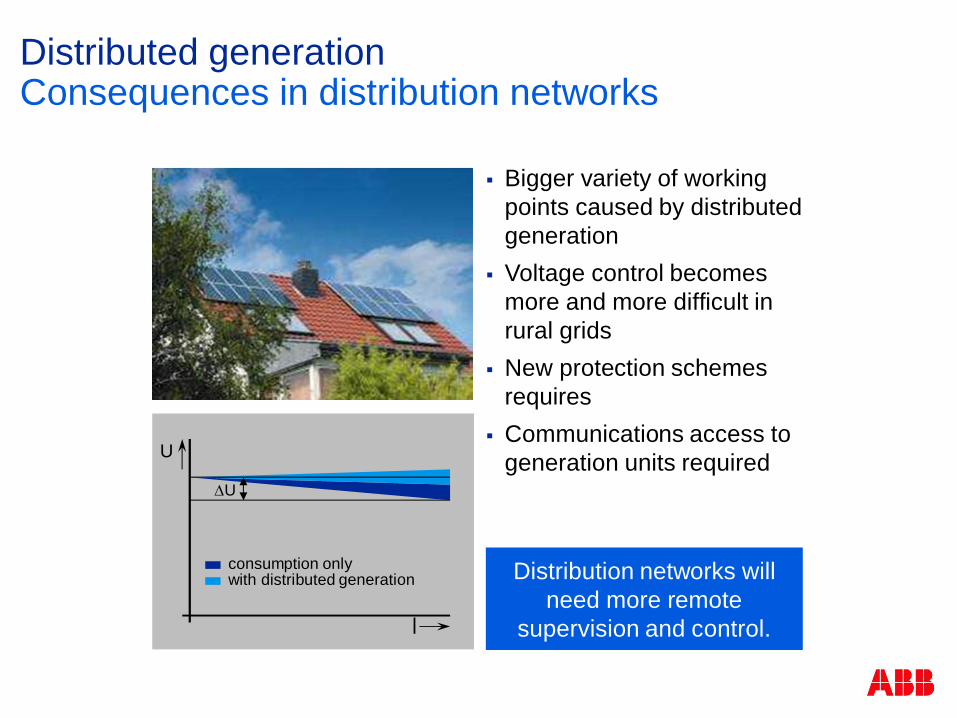
Distributed generationConsequences in distribution networks
Bigger variety of working points caused by distributed generationVoltage control becomes more and more difficult in rural gridsNew protection schemes requiresCommunications access to generation units requiredU
l
U
consumption onlywith distributed generation Distribution networks will
need more remote supervision and control.
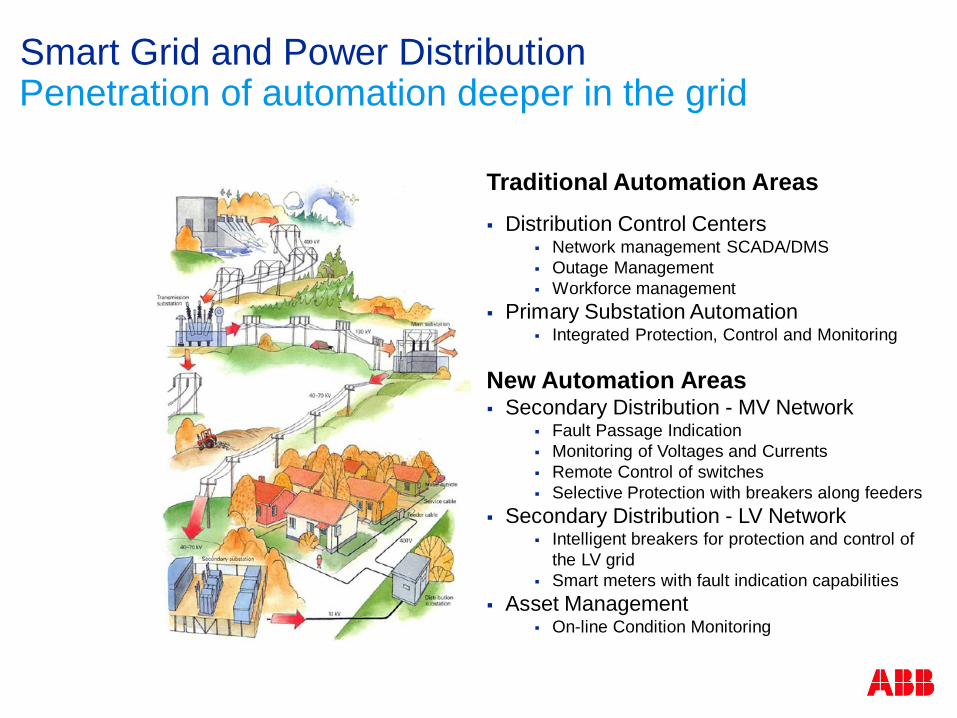
Smart Grid and Power Distribution
Traditional Automation AreasDistribution Control Centers
Network management SCADA/DMSOutage ManagementWorkforce management
Primary Substation AutomationIntegrated Protection, Control and Monitoring
New Automation Areas Secondary Distribution - MV Network
Fault Passage IndicationMonitoring of Voltages and CurrentsRemote Control of switchesSelective Protection with breakers along feeders
Secondary Distribution - LV NetworkIntelligent breakers for protection and control of the LV gridSmart meters with fault indication capabilities
Asset ManagementOn-line Condition Monitoring
Penetration of automation deeper in the grid
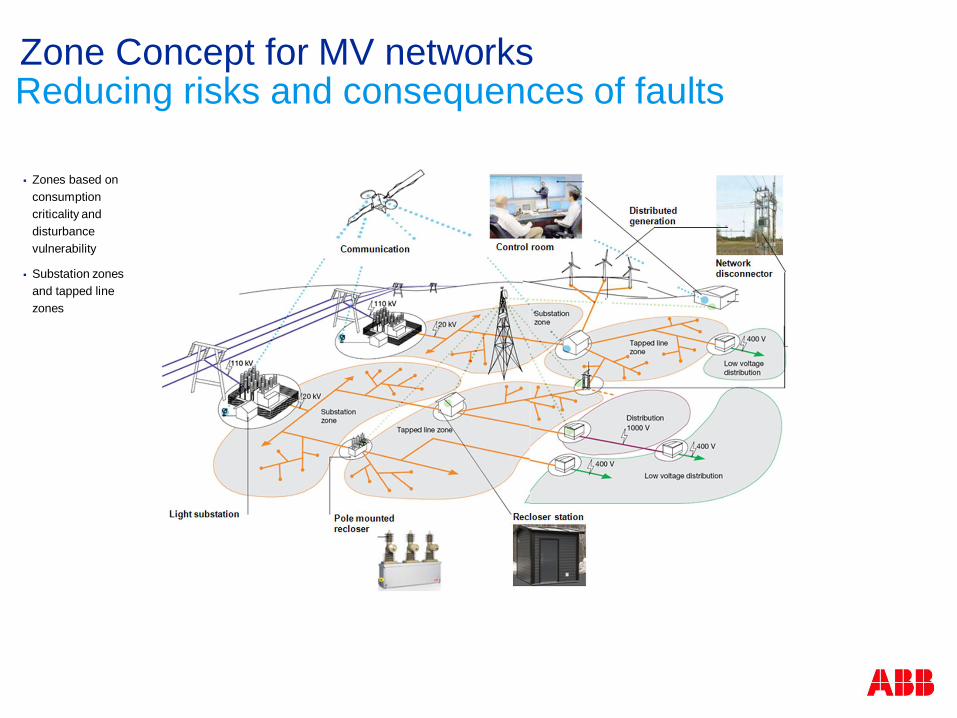
Zones based on consumption criticality and disturbance vulnerability
Substation zones and tapped line zones
Zone Concept for MV networks Reducing risks and consequences of faults
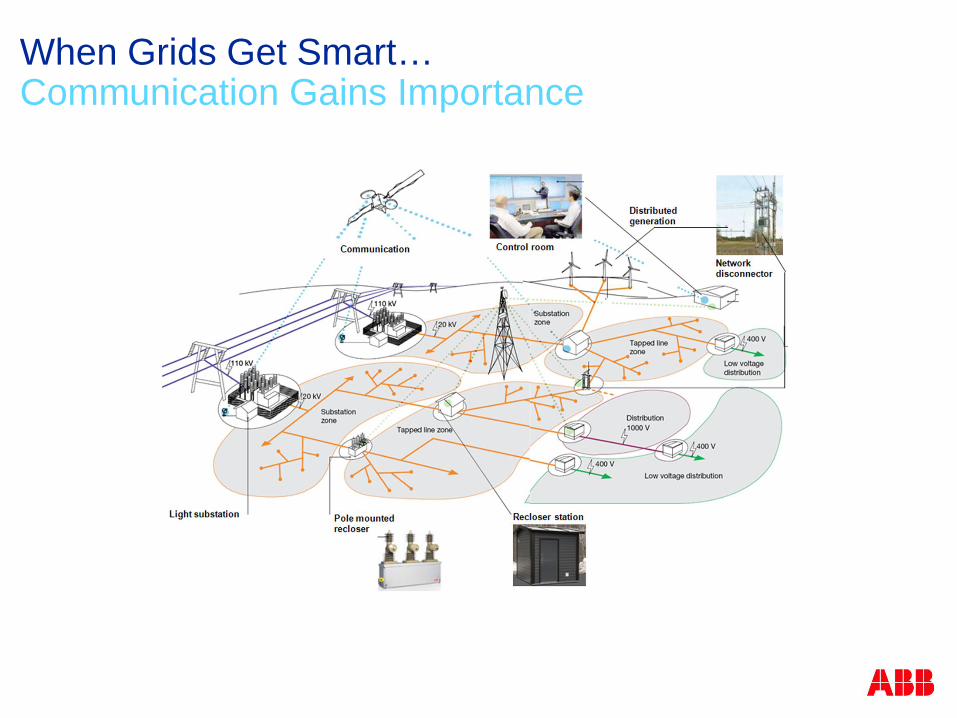
When Grids Get Smart…Communication Gains Importance
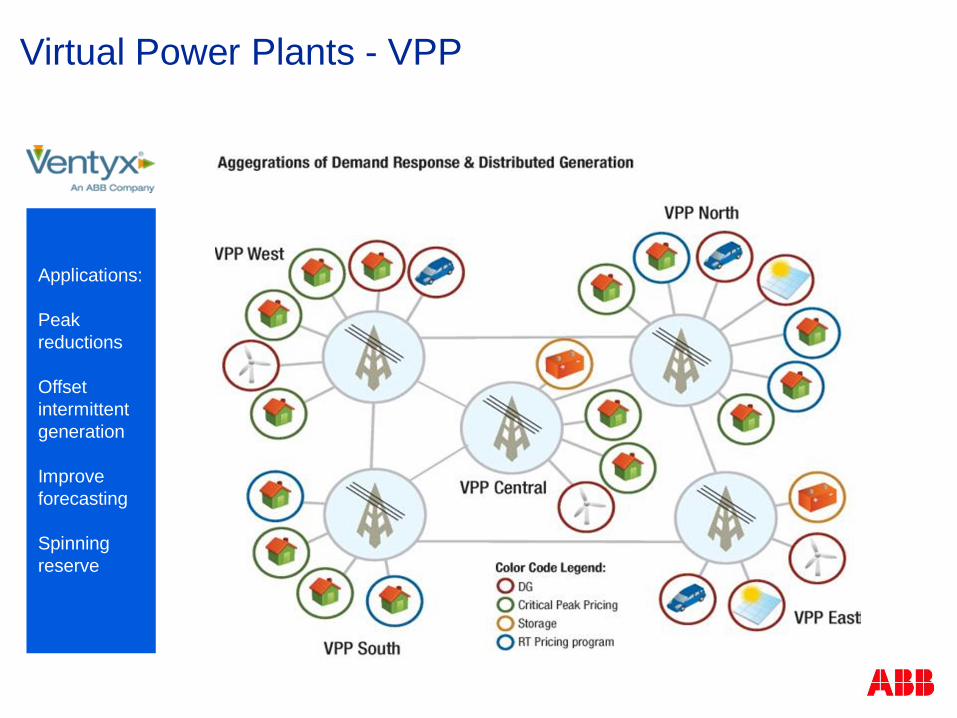
Virtual Power Plants - VPP
Applications:
Peak reductions
Offset intermittent generation
Improve forecasting
Spinning reserve

Smart Cities
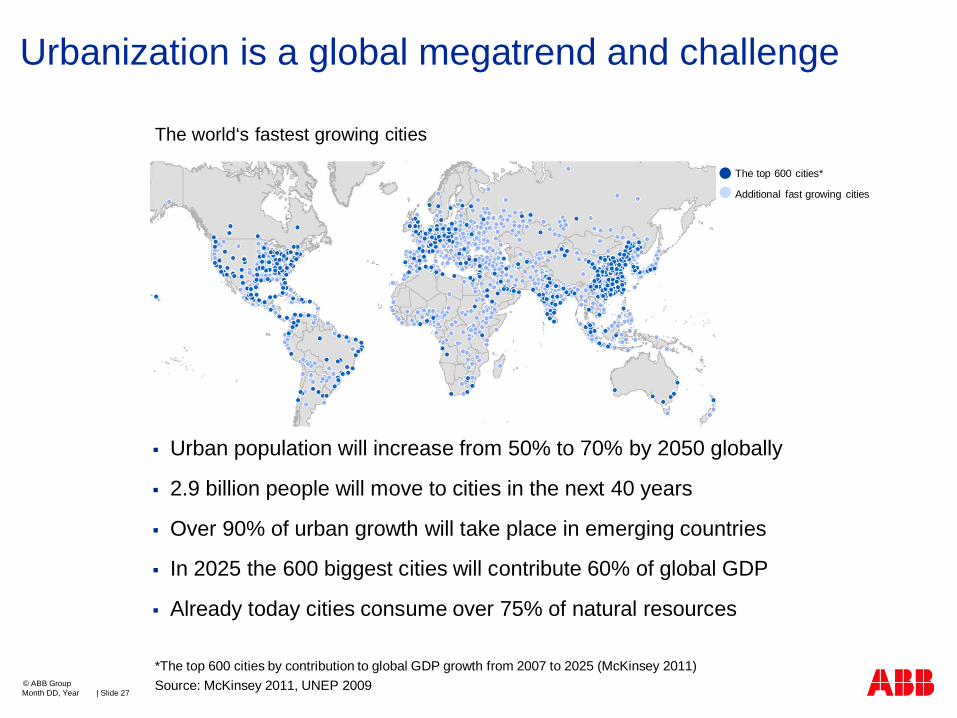
Urbanization is a global megatrend and challenge
Month DD, Year | Slide 27© ABB Group
The world‘s fastest growing cities
The top 600 cities*
Additional fast growing cities
Urban population will increase from 50% to 70% by 2050 globally
2.9 billion people will move to cities in the next 40 years
Over 90% of urban growth will take place in emerging countries
In 2025 the 600 biggest cities will contribute 60% of global GDP
Already today cities consume over 75% of natural resources
*The top 600 cities by contribution to global GDP growth from 2007 to 2025 (McKinsey 2011)Source: McKinsey 2011, UNEP 2009
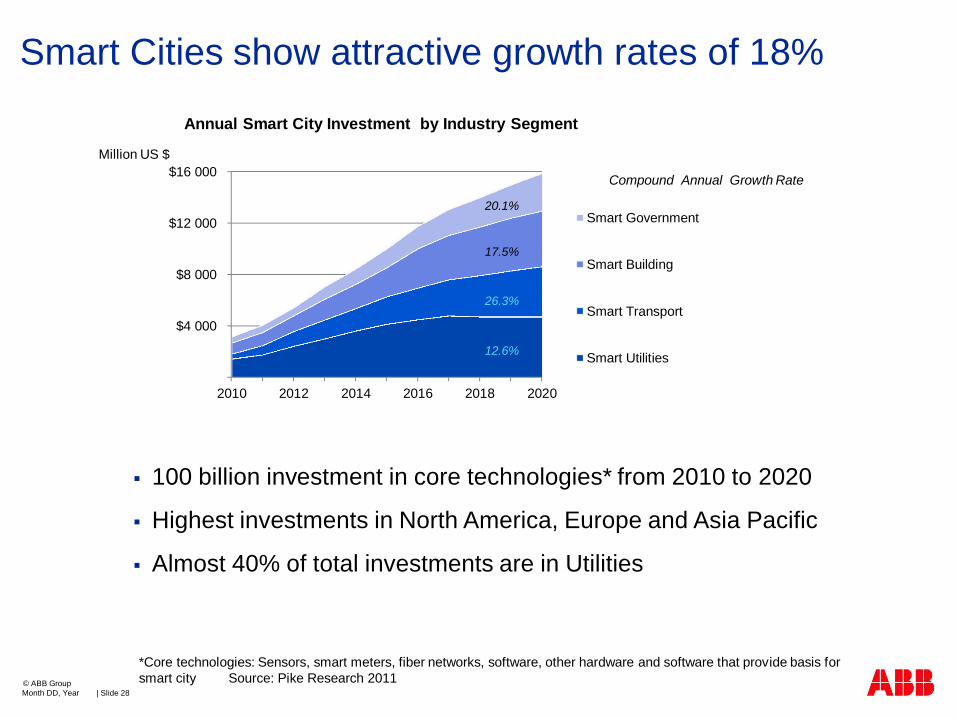
Smart Cities show attractive growth rates of 18%
100 billion investment in core technologies* from 2010 to 2020
Highest investments in North America, Europe and Asia Pacific
Almost 40% of total investments are in Utilities
Month DD, Year | Slide 28© ABB Group
$-
$4 000
$8 000
$12 000
$16 000
2010 2012 2014 2016 2018 2020
Smart Government
Smart Building
Smart Transport
Smart Utilities
Annual Smart City Investment by Industry Segment
12.6%
26.3%
17.5%
20.1%
Compound Annual Growth Rate
*Core technologies: Sensors, smart meters, fiber networks, software, other hardware and software that provide basis for smart city Source: Pike Research 2011
Million US $
ABB Smart City Projects
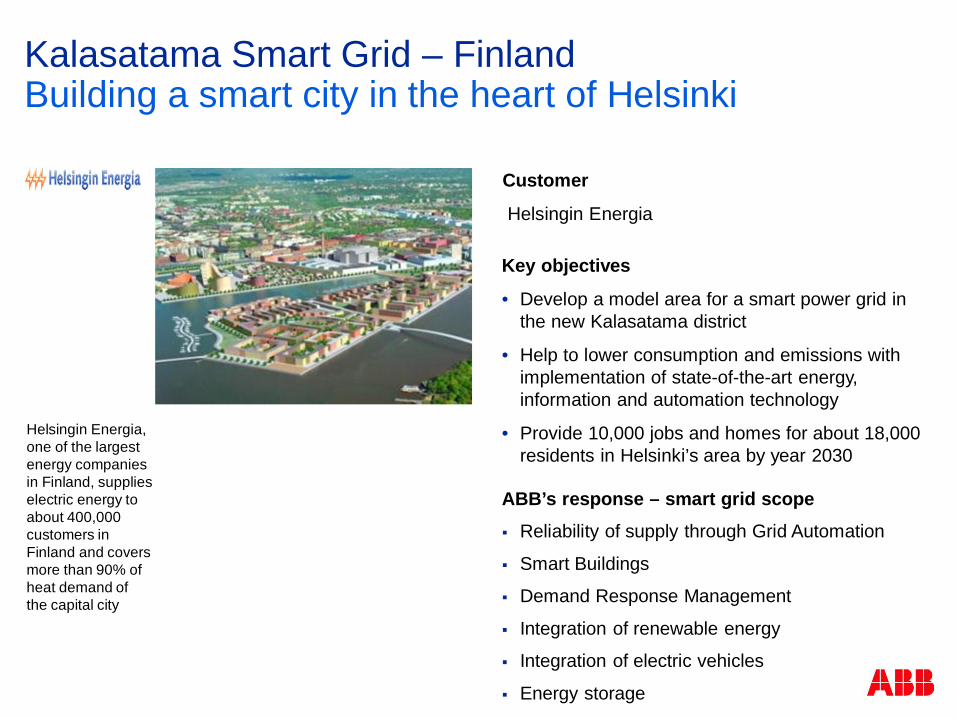
Kalasatama Smart Grid – FinlandBuilding a smart city in the heart of Helsinki
Key objectives
• Develop a model area for a smart power grid in the new Kalasatama district
• Help to lower consumption and emissions with implementation of state-of-the-art energy, information and automation technology
• Provide 10,000 jobs and homes for about 18,000 residents in Helsinki’s area by year 2030
ABB’s response – smart grid scopeReliability of supply through Grid Automation
Smart Buildings
Demand Response Management
Integration of renewable energy
Integration of electric vehicles
Energy storage
Customer
Helsingin Energia
Helsingin Energia, one of the largest energy companies in Finland, supplies electric energy to about 400,000 customers in Finland and covers more than 90% of heat demand ofthe capital city
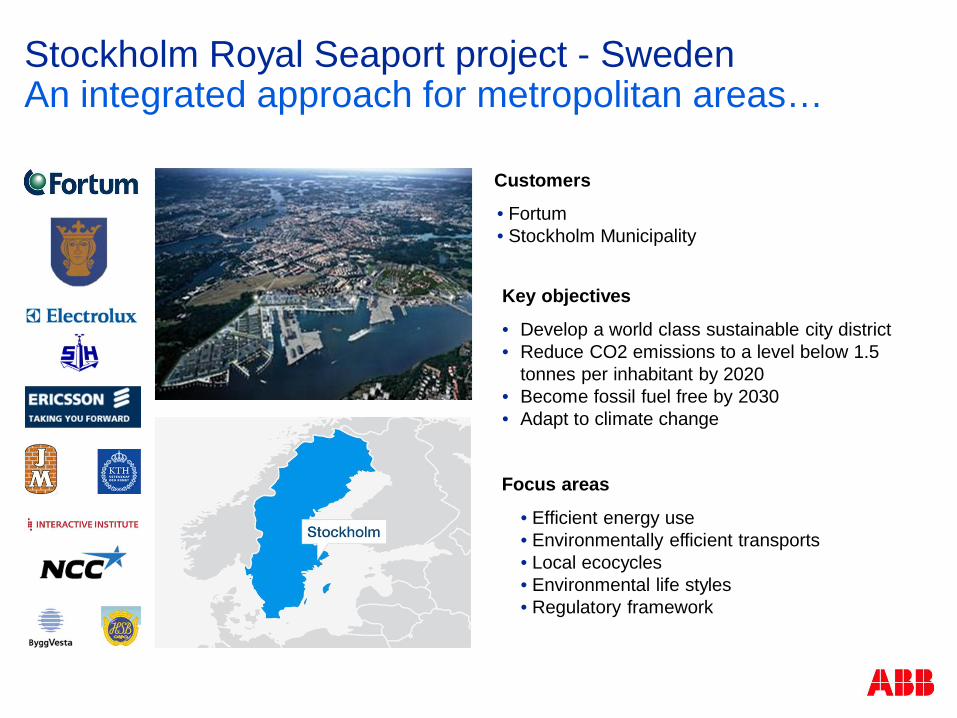
Stockholm Royal Seaport project - Sweden An integrated approach for metropolitan areas…
Focus areas
• Efficient energy use• Environmentally efficient transports• Local ecocycles• Environmental life styles• Regulatory framework
Customers
• Fortum • Stockholm Municipality
Key objectives
• Develop a world class sustainable city district• Reduce CO2 emissions to a level below 1.5
tonnes per inhabitant by 2020 • Become fossil fuel free by 2030• Adapt to climate change
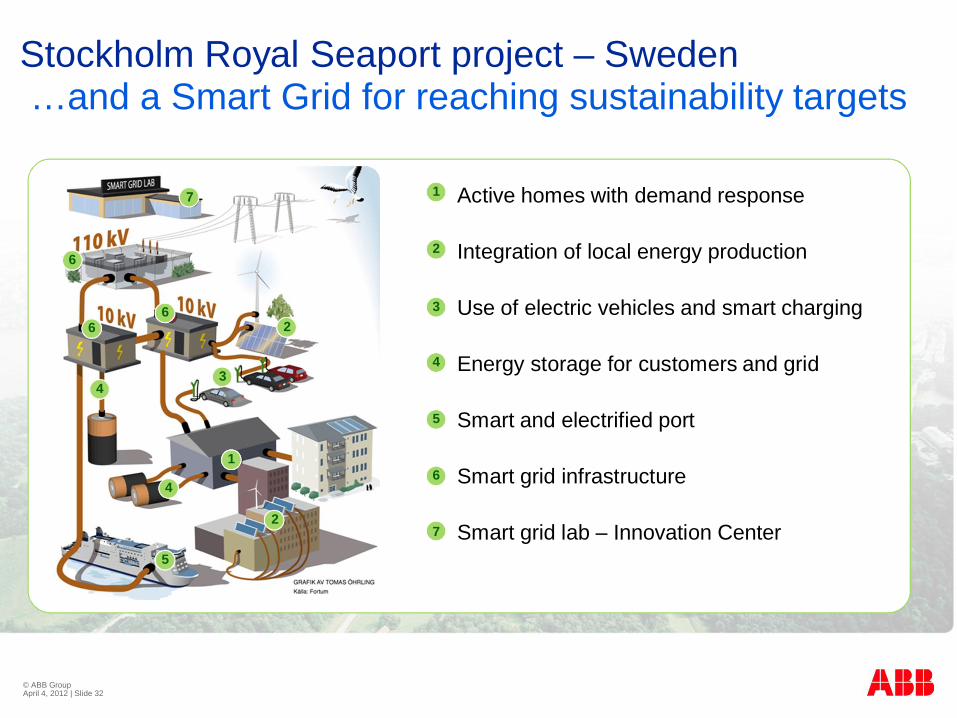
Stockholm Royal Seaport project – Sweden…and a Smart Grid for reaching sustainability targets
© ABB Group April 4, 2012 | Slide 32
Active homes with demand response
Integration of local energy production
Use of electric vehicles and smart charging
Energy storage for customers and grid
Smart and electrified port
Smart grid infrastructure
Smart grid lab – Innovation Center
7
6
66
4
4
3
2
2
1
5
1
2
3
4
5
6
7

ABB Smart Grids Projects
© ABBMonth DD, YYYY | Slide 33
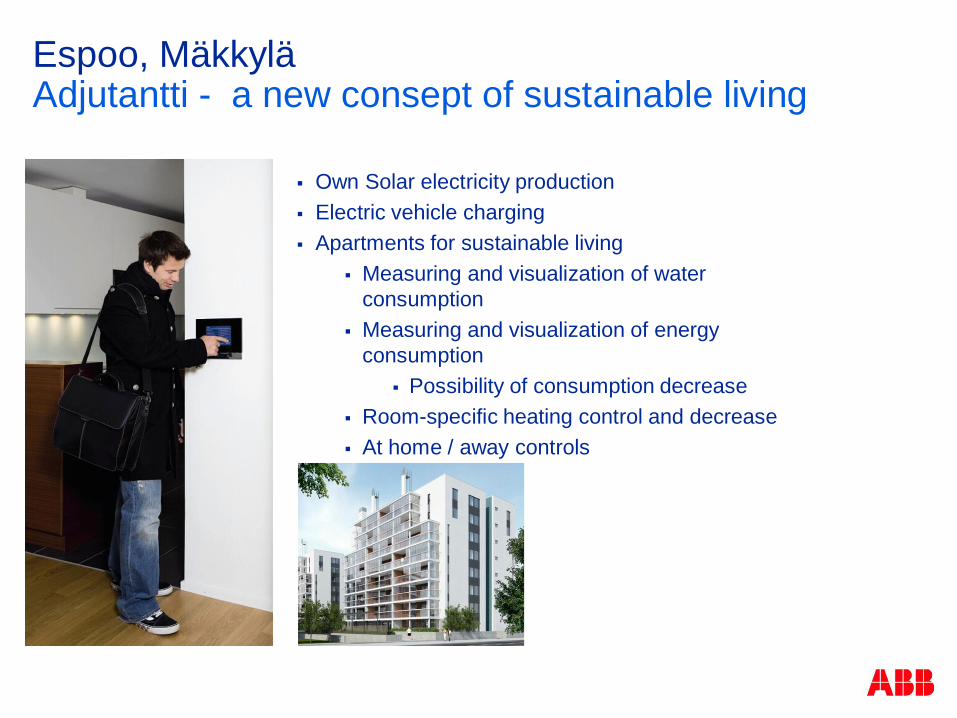
Espoo, MäkkyläAdjutantti - a new consept of sustainable living
Own Solar electricity productionElectric vehicle chargingApartments for sustainable living
Measuring and visualization of water consumptionMeasuring and visualization of energy consumption
Possibility of consumption decreaseRoom-specific heating control and decreaseAt home / away controls
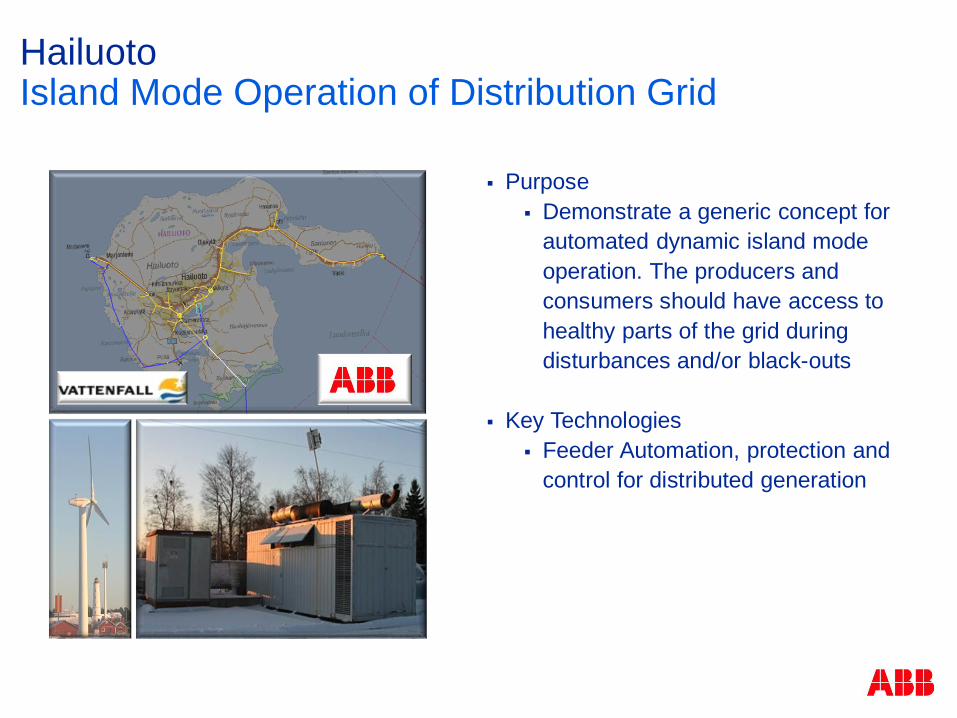
HailuotoIsland Mode Operation of Distribution Grid
PurposeDemonstrate a generic concept for automated dynamic island mode operation. The producers and consumers should have access to healthy parts of the grid during disturbances and/or black-outs
Key TechnologiesFeeder Automation, protection and control for distributed generation
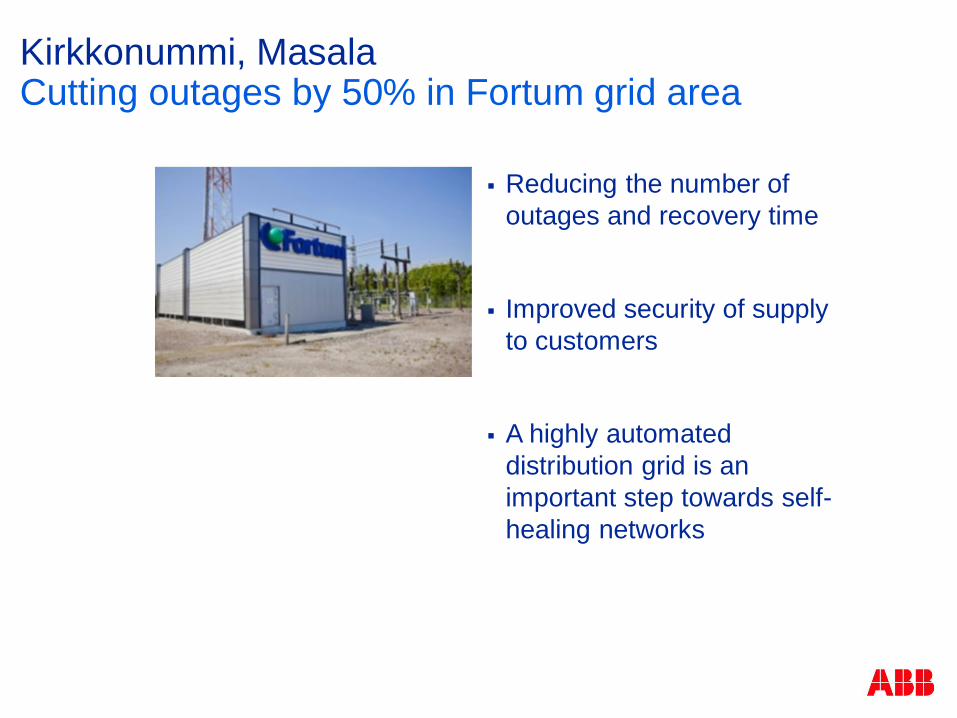
Kirkkonummi, MasalaCutting outages by 50% in Fortum grid area
Reducing the number of outages and recovery time
Improved security of supply to customers
A highly automated distribution grid is an important step towards self-healing networks
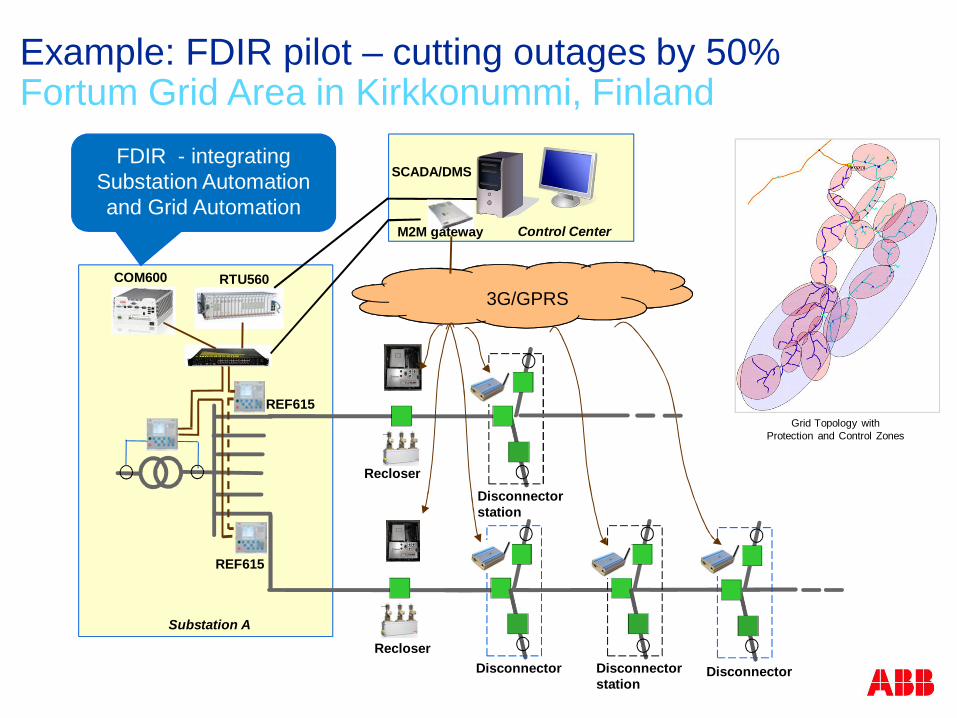
Example: FDIR pilot – cutting outages by 50%Fortum Grid Area in Kirkkonummi, Finland
3G/GPRS
Disconnector
SCADA/DMS
RTU560
Recloser
Substation A
Control Center
Disconnectorstation
Disconnectorstation
Disconnector
M2M gateway
COM600
REF615
REF615
Recloser
FDIR - integrating Substation Automation and Grid Automation
Grid Topology with Protection and Control Zones
ABB Finland
© ABBMonth DD, YYYY | Slide 38
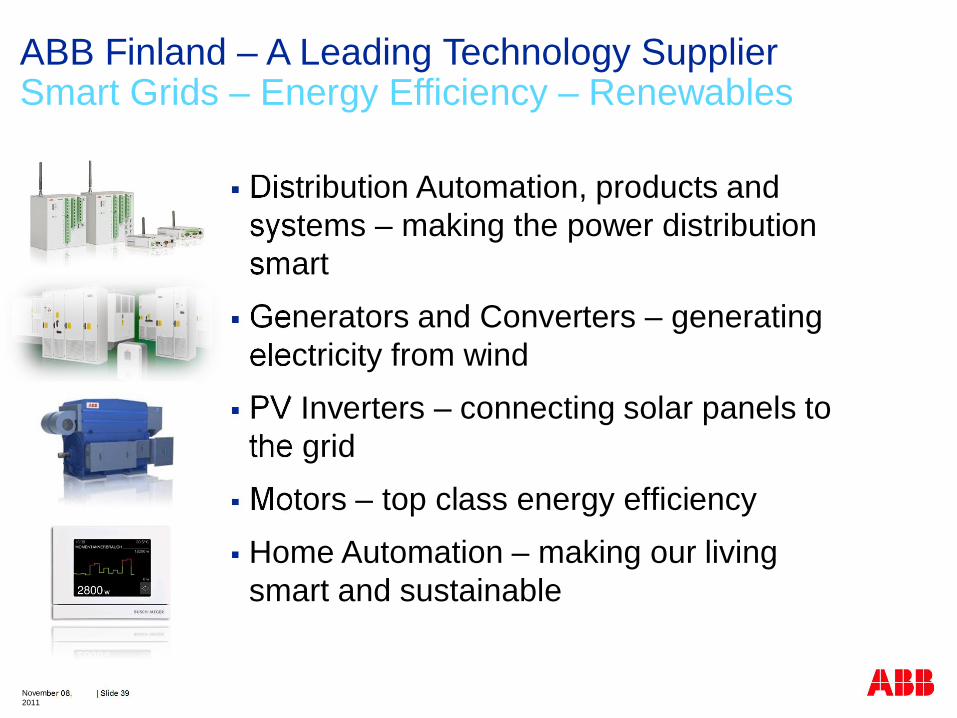
Distribution Automation, products and systems – making the power distribution smartGenerators and Converters – generating electricity from windPV Inverters – connecting solar panels to the gridMotors – top class energy efficiencyHome Automation – making our living smart and sustainable
ABB Finland – A Leading Technology SupplierSmart Grids – Energy Efficiency – Renewables
November 08, 2011
| Slide 39

Recommended


![[MICRO]GRIDS TODAY - marsdd.com€¦ · [MICRO]GRIDS TODAY Themes and Outcomes. JULY 2015. ONTARIO SMART GRID . FORUM](https://img.dokumen.tips/doc/110x75/5b37f9f87f8b9abd438cc430/microgrids-today-microgrids-today-themes-and-outcomes-july-2015-ontario.jpg)


