SimLipid®:
Software platform for automating Shotgun, LC-MS and MALDI-MS based high-throughput
lipidomics
Ningombam Sanjib Meitei1
, Arun Apte2
,
Rupanjan Goswami1
, Julian Saba3
1
PREMIER Biosoft, Indore, India; 2
PREMIER Biosoft, Palo Alto, U.S; 3
Thermo Fisher Scientific, San Jose, CA
Corresponding author e-mail: [email protected]
Introduction
A combination of different approaches namely ‘Shotgun lipidomics’, LC-MS, and MALDI-TOF is often necessary to detect the whole lipidome of an organism. Each lipid class has its own fragmentation patterns as well as ionization efficiency [1], thereby making the interpretation of MS/MS lipid spectra a challenging task. Currently available software tools lack the ability to analyze data generated by all the mentioned approaches in a single platform. We have developed SimLipid® software to address this challenge.
Methods
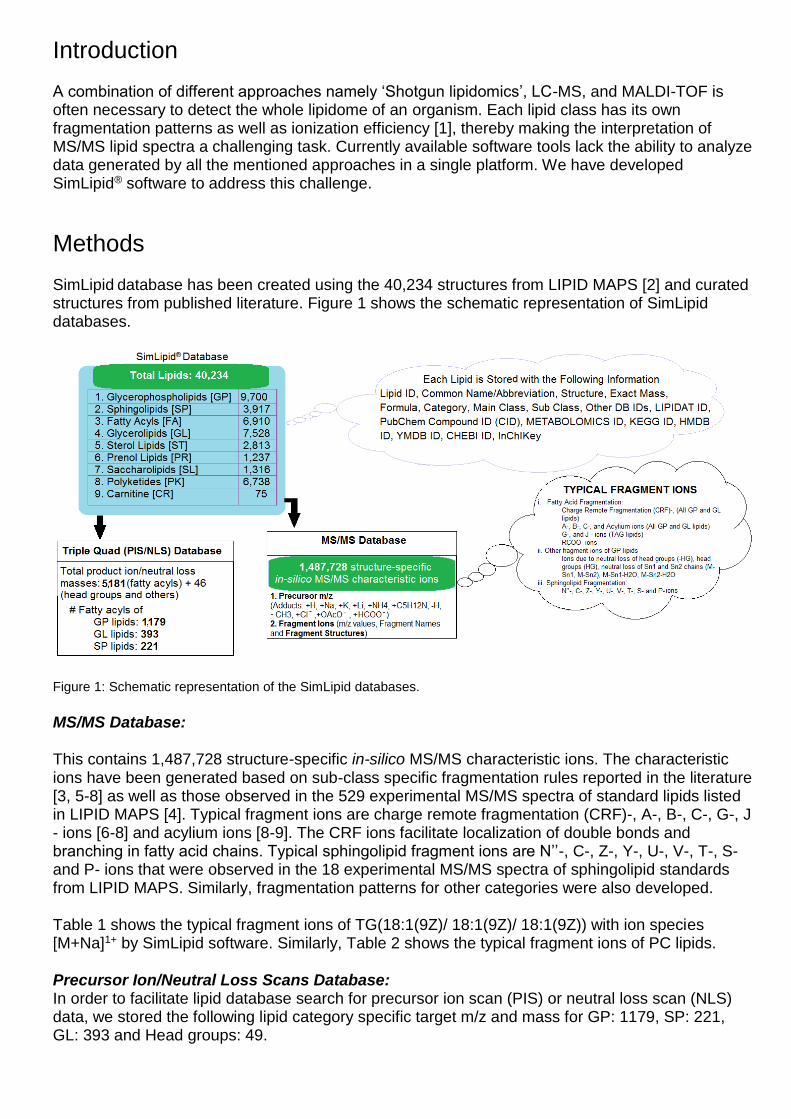
SimLipid database has been created using the 40,234 structures from LIPID MAPS [2] and curated structures from published literature. Figure 1 shows the schematic representation of SimLipid databases.
Figure 1: Schematic representation of the SimLipid databases.
MS/MS Database:
This contains 1,487,728 structure-specific in-silico MS/MS characteristic ions. The characteristic ions have been generated based on sub-class specific fragmentation rules reported in the literature [3, 5-8] as well as those observed in the 529 experimental MS/MS spectra of standard lipids listed in LIPID MAPS [4]. Typical fragment ions are charge remote fragmentation (CRF)-, A-, B-, C-, G-, J - ions [6-8] and acylium ions [8-9]. The CRF ions facilitate localization of double bonds and branching in fatty acid chains. Typical sphingolipid fragment ions are N’’-, C-, Z-, Y-, U-, V-, T-, S- and P- ions that were observed in the 18 experimental MS/MS spectra of sphingolipid standards from LIPID MAPS. Similarly, fragmentation patterns for other categories were also developed.
Table 1 shows the typical fragment ions of TG(18:1(9Z)/ 18:1(9Z)/ 18:1(9Z)) with ion species [M+Na]1+ by SimLipid software. Similarly, Table 2 shows the typical fragment ions of PC lipids.
Precursor Ion/Neutral Loss Scans Database: In order to facilitate lipid database search for precursor ion scan (PIS) or neutral loss scan (NLS) data, we stored the following lipid category specific target m/z and mass for GP: 1179, SP: 221, GL: 393 and Head groups: 49.
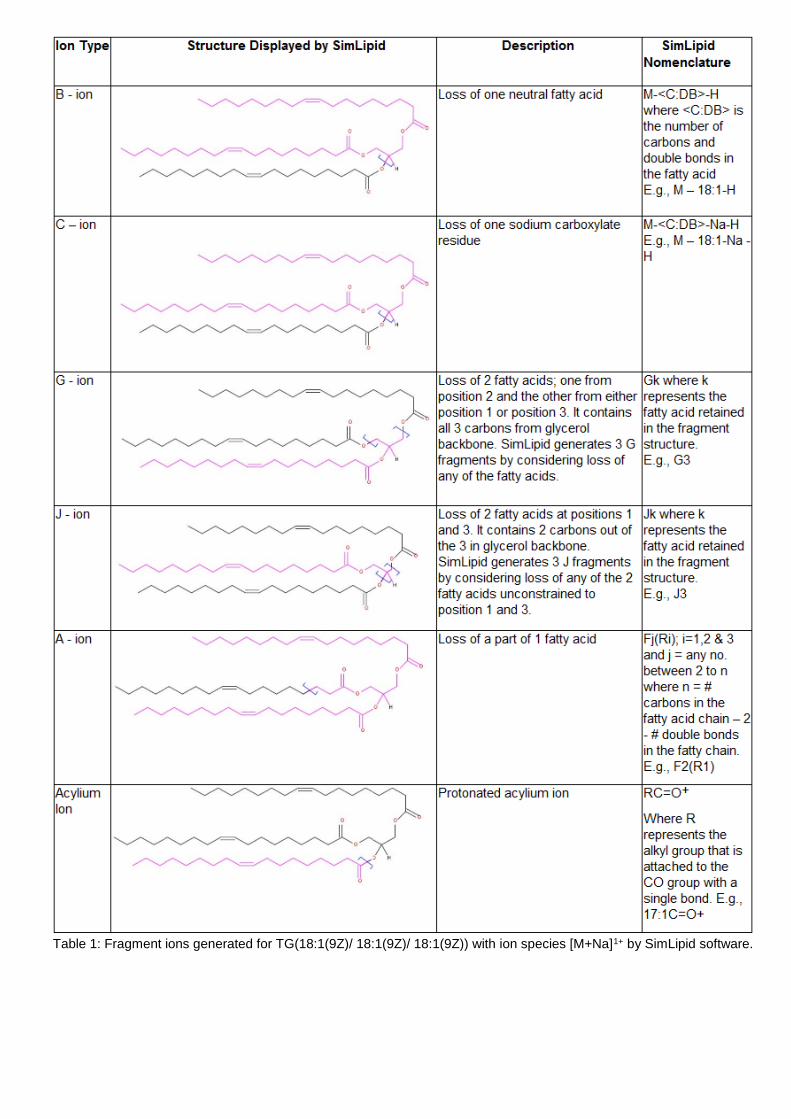
Table 1: Fragment ions generated for TG(18:1(9Z)/ 18:1(9Z)/ 18:1(9Z)) with ion species [M+Na]1+ by SimLipid software.

Table 2: Typical fragment ions generated for PC lipids.
Lipid Identification using MALDI-, ESI-, LC-ESI-, MS and MS/MS data:
For MS1 data, SimLipid profiles lipids based on exact mass database search by assigning highest score to the candidate with minimum delta mass, that is the difference between the observed vs theoretical mass of a candidate lipid calculated in the units of Da (range: 0.0001-2), parts per million (ppm; range: 0.1-200), and milli-Daltons (mDa; range: 0.1-2000)). In case of LC-MS peaklist, the program performs the exact mass DB search for m/z at the M+0th peak of isotope clusters of each of the LC-compounds.
For MS/MS data, the program creates a list of candidate structures for each MS/MS spectrum based on precursor m/z value and other information. For each candidate, in-silico fragment ions are matched against the experimental MS/MS data. A scoring mechanism was developed in order to differentiate isobaric candidates.

Lipid Identification and Quantitation using PIS/NLS data:
SimLipid performs exact mass database search by constraining candidate lipids based on the target fatty acid chain or lipid head group. Once the lipids are profiled, isotope correction of peaks are performed using algorithm described by Liebisch et al. (2004) [10]. Profiled Lipids can be aligned across multiple scans and biological samples based on (a) Short name (i.e., #C:#DB), (b) Similar fatty acyls (disregarding the position of Sn1, Sn2, Sn3 chains and position of double bonds), and (c) Common name/Abbreviation. Figure 2 shows the schematic representation of SimLipid workflow for lipid identification and quantitation using PIS/NLS data.
Figure 2: Schematic representation of SimLipid workflow for lipid identification and quantitation using PIS/NLS data.

Visualization and Processing of LC-MS Data:
Table 3 shows the native/standard file formats from mass spectrometer manufacturing vendors that can be directly imported into SimLipid software. Once the raw data is imported into the program, a user can generate peaklist after performing peak detection, peak deconvolution, molecular feature finding and clustering of MS/MS data into LC-compounds. The peaklist can be subjected to exact mass and/or MS/MS database searches to identify the probable lipids.
Figure 3 and 4 shows typical graphical user interfaces (GUI) of SimLipid software facilitating visualization of raw data and search results on the peaklist.
Sl. # File Format Vendor File Types Software used to read data
1 .baf, .yef, .fid Bruker Corporation Native file CompassXtract
2 .lcd Shimadzu Corporation Native file DataFileReader
3 .wiff, .T2D SCIEX Native file WiffFileReader
4 .raw Thermo Fisher Scientific
Native File MSFileReader
5 mzXML, mzData, mzML, .xls, txt
All Standard files -
6 .cef Agilent Technologies Peaklist generated by MassHunter/MPP software
-
7 .txt Waters Corporation Peaklist generated by MSe DataViewer software
-
Table 3: Data files that can be imported into SimLipid software.
Figure 3: Typical GUI of SimLipid software showing the (1) tabular, (2) chromatogram, (3) spectrum views of LC-MS raw data. (4) Search results and (5) Lipid information is displayed after performing lipid database search.
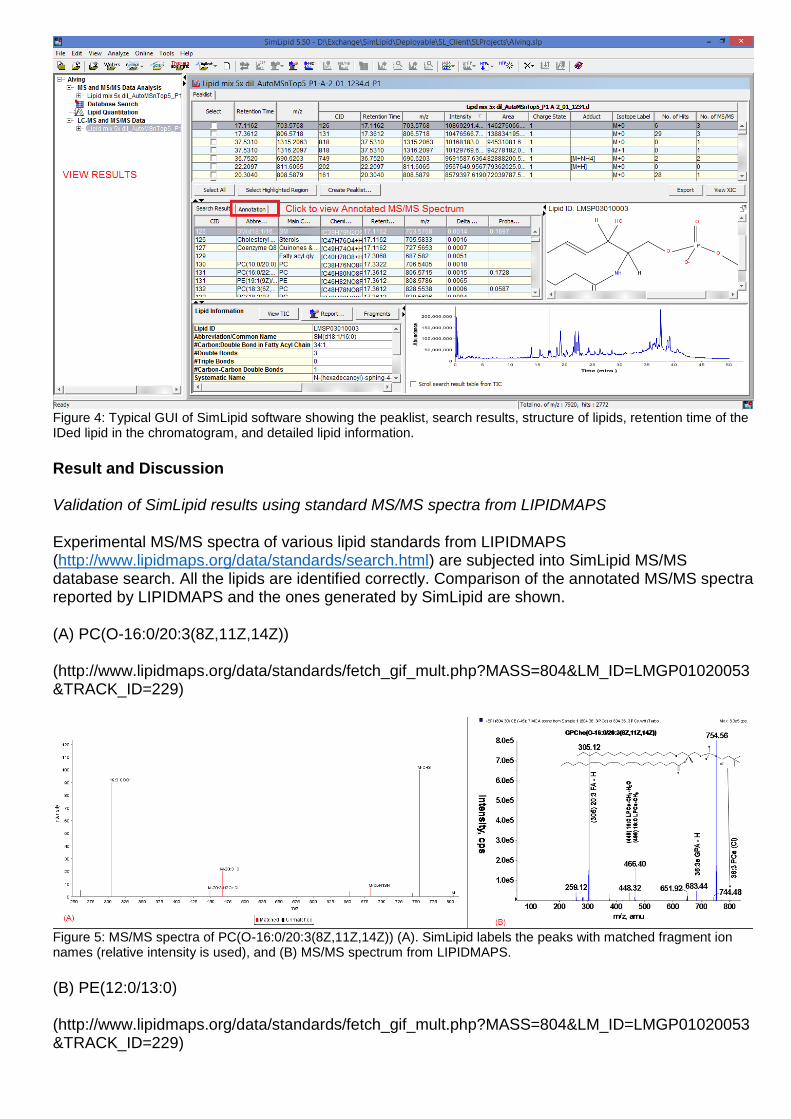
Figure 4: Typical GUI of SimLipid software showing the peaklist, search results, structure of lipids, retention time of the IDed lipid in the chromatogram, and detailed lipid information.
Result and Discussion Validation of SimLipid results using standard MS/MS spectra from LIPIDMAPS
Experimental MS/MS spectra of various lipid standards from LIPIDMAPS (http://www.lipidmaps.org/data/standards/search.html) are subjected into SimLipid MS/MS database search. All the lipids are identified correctly. Comparison of the annotated MS/MS spectra reported by LIPIDMAPS and the ones generated by SimLipid are shown.
(A) PC(O-16:0/20:3(8Z,11Z,14Z)) (http://www.lipidmaps.org/data/standards/fetch_gif_mult.php?MASS=804&LM_ID=LMGP01020053&TRACK_ID=229)
Figure 5: MS/MS spectra of PC(O-16:0/20:3(8Z,11Z,14Z)) (A). SimLipid labels the peaks with matched fragment ion names (relative intensity is used), and (B) MS/MS spectrum from LIPIDMAPS.
(B) PE(12:0/13:0) (http://www.lipidmaps.org/data/standards/fetch_gif_mult.php?MASS=804&LM_ID=LMGP01020053&TRACK_ID=229)
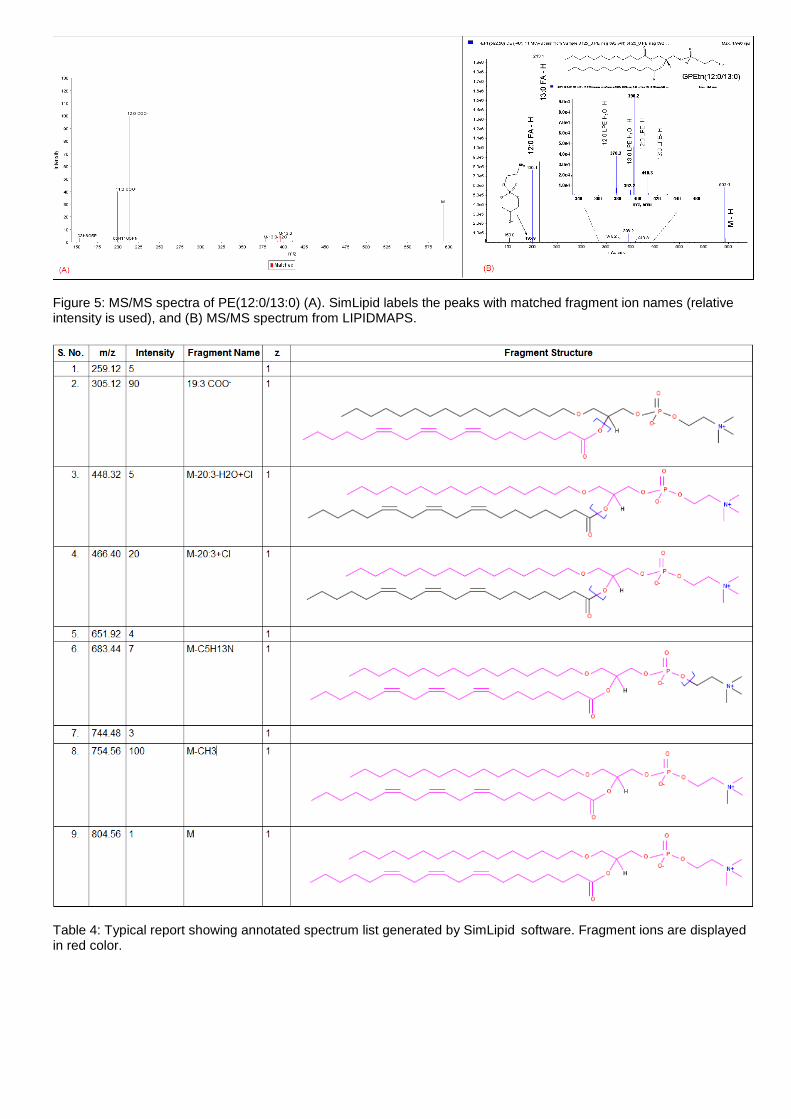
Figure 5: MS/MS spectra of PE(12:0/13:0) (A). SimLipid labels the peaks with matched fragment ion names (relative intensity is used), and (B) MS/MS spectrum from LIPIDMAPS.
Table 4: Typical report showing annotated spectrum list generated by SimLipid software. Fragment ions are displayed in red color.

Table 5: Typical report showing annotated MS/MS spectrum list of PE(12:0/13:0) generated by SimLipid software.
Lipid identification using MALDI TOF/TOF data:
The MS/MS spectrum acquired using methods described in [11] was subjected to a search in SimLipid software which resulted in the identification of a TAG 54:3. The annotated MS/MS spectrum and the lipid structure are shown in Figure 6. In this case, CRF ions are the determinants for identifying the lipid structure as well as the position of double bonds in the fatty acyls.

Figure 6: SimLipid software interface: (A) MS/MS spectrum annotation of TG(18:1(9Z)/18:1(9Z)/18:1(9Z) (B) MS/MS spectrum annotation of 2nd ranked lipid TG(18:1(9Z)/18:1(9Z)/18:1(9Z).
Lipid identification using MS/MS spectra in variable ion mode:
In order to achieve structural information from tandem mass spectrometry data acquired in both the positive and negative mode ionizations, SimLipid software combined lipids identified by different experimental workflows and exported the fragment ions that are observed in different spectra, thereby facilitating easy review of the identified lipids.
Figure 7: PE(16:0/18:1) lipid was identified in all the four MS/MS runs by SimLipid.
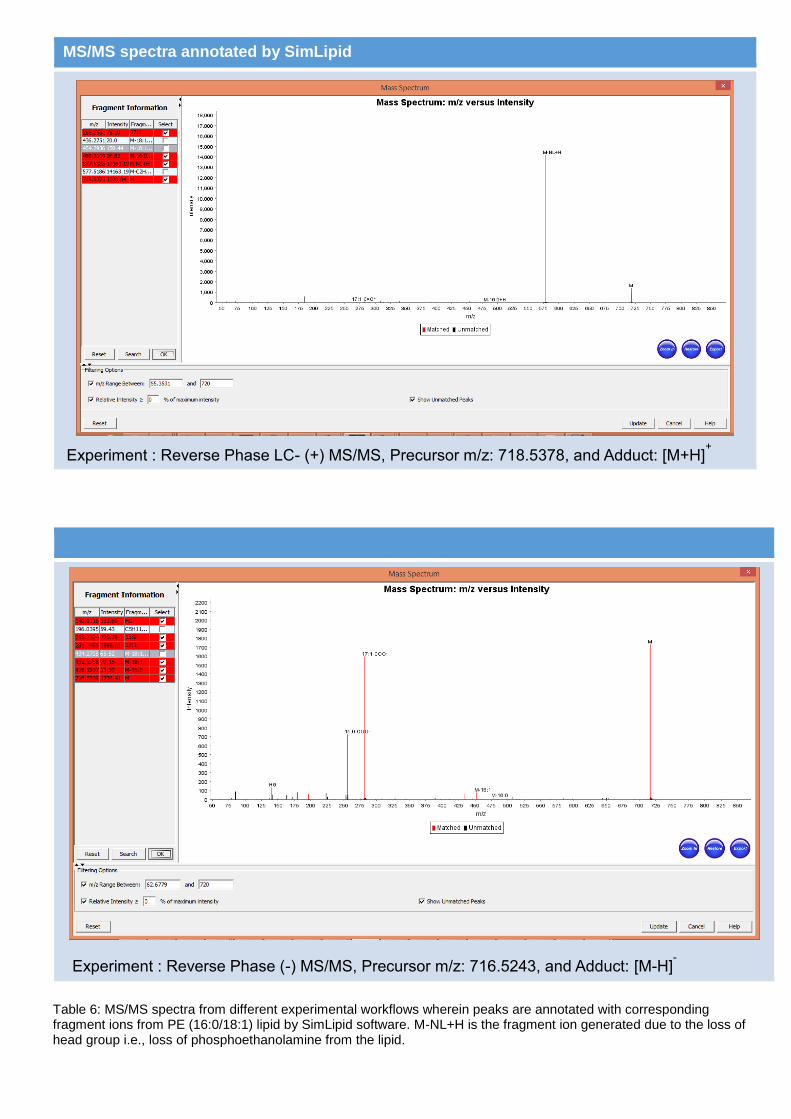
MS/MS spectra annotated by SimLipid
Table 6: MS/MS spectra from different experimental workflows wherein peaks are annotated with corresponding fragment ions from PE (16:0/18:1) lipid by SimLipid software. M-NL+H is the fragment ion generated due to the loss of head group i.e., loss of phosphoethanolamine from the lipid.
Experiment : Reverse Phase LC- (+) MS/MS, Precursor m/z: 718.5378, and Adduct: [M+H]+
Experiment : Reverse Phase (-) MS/MS, Precursor m/z: 716.5243, and Adduct: [M-H]-

Table 6 shows the MS/MS spectra of PE(16:0/18:1) (Figure 7) from different experimental setups described in previously presented scientific poster [12]. Figure 8 shows the prototype results of lipids identified from LC- MS/MS data of both the ion modes exported into MS excel file.
Multiplexed Precursor Ion/Neutral Loss Scan Data analysis:
Data from multiple precursor ion/neutral loss scans can be imported into SimLipid software using either native file formats or standard formats. For an event e.g., PIS 184.1, data from all the scans can be summed up to normalize the fluctuation in peak intensities across scans. Users can model, experimental designs using the GUIs (Figure 9) by classifying data files according to biological/technical replicates.
Figure 8: Lipid identified using MS/MS data from both the ion modes exported into MS excel file.
Identification of lipids based on target fatty acyls/head group fragment ions or their neutral losses is processed in batch mode. Isotope peak correction, if opted, is also done before loading the results into the software display windows (Figure 10). Lipids IDed across scans or samples are aligned (Figure 11) and corrected intensities of aligned lipids (across multiple precursor ion and neutral loss scans) are summed up.
Figure 9: Typical SimLipid software GUIs for modeling experimental designs and assigning target fatty acyls or lipid headgroups to product ions/neutral loss masses.
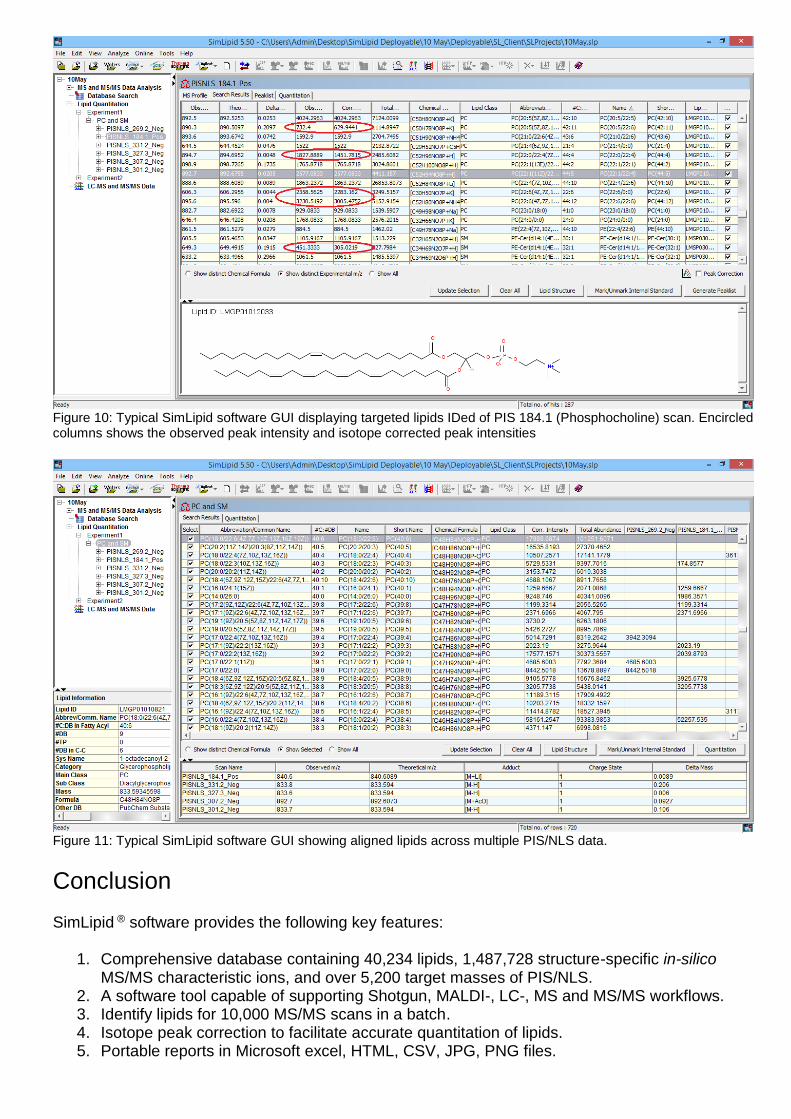
Figure 10: Typical SimLipid software GUI displaying targeted lipids IDed of PIS 184.1 (Phosphocholine) scan. Encircled columns shows the observed peak intensity and isotope corrected peak intensities
Figure 11: Typical SimLipid software GUI showing aligned lipids across multiple PIS/NLS data.
Conclusion
SimLipid ® software provides the following key features:
1. Comprehensive database containing 40,234 lipids, 1,487,728 structure-specific in-silico MS/MS characteristic ions, and over 5,200 target masses of PIS/NLS.
2. A software tool capable of supporting Shotgun, MALDI-, LC-, MS and MS/MS workflows. 3. Identify lipids for 10,000 MS/MS scans in a batch. 4. Isotope peak correction to facilitate accurate quantitation of lipids. 5. Portable reports in Microsoft excel, HTML, CSV, JPG, PNG files.

References
1. Hsu, F.F. et al. J. Chromatogr. B Analyt. Technol. Biomed. Life Sci. (2009) 877:2673–2695. 2. Sud M et al, Nucleic Acids Research (2007) 35:D527-32. 3. Murphy, R.C. (2002). Illuminati Press. 4. Byrnes R et al. J. Association for Lab. Automation (2007) 12:230-238. 5. Ayumi et al. JASMS. (2013) 24:684Y68, 6. Gross et al. Int. J. Mass Spectrom. Ion Process (1992) 118/119,137. 7. Trimpin et al., JASMS. (2007) 18:1967. 8. Cheng et al. Anal. Chem. (1998) 70:4417. 9. McAnoy et al. J Am Soc Mass Spectrom. (2005) 16:1498–1509. 10. Liebisch, G. et al. (2004) Biochimica et Biophysica Acta (BBA)-Molecular and Cell Biology of Lipids 1686.1:
108-117. 11. Meitei, N.S., et al. (2014) Automatic Characterization of Lipids Using Charge Remote Fragmentation Ions and
Peaks Characteristic of Fatty Acid Fragmentation From MALDI MS/MS Data. 62nd ASMS, Baltimore. 12. Meitei, N.S., et al. (2015) Automatic lipid characterization using SimLipid® from normal phase and reverse
phase liquid chromatography -MS, MS/MS data acquired in variable ion modes. 63rd ASMS, St. Louis.
Recommended