1
SHARE ISSUANCE AND EQUITY RETURNS IN THE
ISTANBUL STOCK EXCHANGE
Yigit Atilgana, K. Ozgur Demirtas
b and Alper Erdogan
c
ABSTRACT
This paper investigates the predictive power of share issuance on equity returns in the Istanbul Stock
Exchange (ISE). The share issuance measure is estimated as the annual logarithmic change in shares
outstanding adjusted for distribution events. This measure is not significantly related to expected
equity returns in a univariate setting; however, this is due to the prevalence of rights offerings in the
ISE and the consequent mechanical relation between the issuance measure and the book-to-market
effect. After controlling for book-to-market, size and momentum factors, there is a significantly
negative relation between share issuance and expected returns, especially for longer return horizons.
The results from the portfolio analysis confirm this finding and show that the portion of share issuance
that cannot be explained by the book-to-market effect has a strong negative cross-sectional relation
with expected equity returns in the ISE between 1992 and 2011.
a Yigit Atilgan is an Assistant Professor of Finance at the School of Management, Sabanci University. Orhanli,
Tuzla 34956, Istanbul, Turkey. Phone: +90 (216) 483-9663, Email: [email protected]. b K. Ozgur Demirtas is a Professor of Finance at the School of Management, Sabanci University. Orhanli, Tuzla
34956, Istanbul, Turkey. Phone: +90 (216) 483-9985, Email: [email protected]. c Alper Erdogan is a doctoral student at the School of Management, Sabanci University. Orhanli, Tuzla 34956,
Istanbul, Turkey. Email: [email protected].
1
1. INTRODUCTION
The cross-sectional determinants of equity returns have been a popular topic among financial
economists. A milestone in this literature is the mean-variance portfolio analysis of Markowitz
(1952) and the subsequent introduction of the Capital Asset Pricing Model (CAPM) by Sharpe
(1964) and Lintner (1965) among others. Fama and Macbeth (1973) test the standard CAPM
using two parameter portfolio models for NYSE stocks and find that the CAPM betas and
expected equity returns have a linear cross-sectional relationship. Since then, a considerable
portion of the asset pricing literature has been devoted to uncovering additional variables that
explain stock returns. Some of the most well-known variables that have been shown to have a
significant relation with expected returns are market value of equity for the size effect (Banz
(1981)), market-to-book ratio for the value effect (Fama and French (1992, 1993)) and past
intermediate-term stock returns for the momentum effect (Jegadeesh and Titman (1993)).1
Another important cross-sectional determinant of equity returns is share issuance activity.
Loughran and Ritter (1995) and Ikenberry, Lakonishok and Vermaelen (1995) investigate equity
issues and open market share repurchases, respectively, and find that higher stock issuance
activity is related to lower long-run abnormal returns and vice versa. Similarly, Loughran and
Vijh (1997) argue that acquirers that complete stock mergers experience negative long-run excess
returns. Subsequent studies attempt to explain the negative relation between net stock issuance
and expected equity returns by theories such as risk reduction due to equity issuance, managerial
market timing, pseudo-timing and investment sensitivity2. More recent studies such as Daniel and
Titman (2006), Pontiff and Woodgate (2008) and Fama and French (2008) reiterate the negative
effect of net share issuance on equity returns and show that this effect is robust to size, value and
momentum factors. McLean, Pontiff and Watanabe (2009) extend this line of research to a pooled
sample of international stocks and Bali, Demirtas and Hovakimian (2010) argue that the share
issuance effect is even more pronounced when the extreme case of value purchasers versus
growth issuers is considered.
Our aim in this study is to investigate the relation between net stock issuance and expected equity
returns in the Turkish stock market. We believe that this is an essential topic of interest because
the strengthening of the Turkish economy and the development of capital markets especially after
1 The cross-sectional relation between these variables and equity returns in the ISE has been investigated by
Akdeniz, Altay-Salih, Aydogan (2000), Doganay (2006) and Unlu (2012). 2 See Eckbo, Masulis and Norli (2000), Baker and Wurgler (2000), Schultz (2003) and Bulter, Grullon and
Weston (2005), Lyandres, Sun and Zhang (2008).
2
the 2001 crisis led to a higher number of share issuance events. Also, Turkish regulatory bodies
are taking initiatives to incentivize more companies to go public. Moreover, the legal framework
is being restructured to make it more convenient for public firms to issue and repurchase equity.
Share issuance is at the crossroads of asset pricing and corporate finance and it is worth to
investigate the impact of this corporate financing activity on equity valuations, especially in these
transformative stages in the Turkish financial markets.
The annual logarithmic change in shares outstanding adjusted for distribution events is used to
measure share issuance activity. First, we run univariate regressions of one-period ahead stock
returns on the share issuance measure for five different return horizons but find no significant
relationship. We attribute this lack of significance to the fact that most stock issues in Turkey
occur in the form of rights offerings. The money raised in rights offerings must necessarily be
added to the book value of capital and this induces a mechanical positive correlation between the
book-to-market ratio and the share issuance measure. The positive relation between the book-to-
market ratio and expected equity returns3 could mask the negative relation between share issuance
and expected equity returns. This offsetting effect could cause the coefficients on the share
issuance measure to be insignificant in univariate regressions. Consistent with this conjecture, we
find that there is a significant and negative relation between share issuance and expected returns
after controlling for size, book-to-market ratio and momentum, especially when the expected
returns are measured for horizons of 6 months and longer. We also find that book-to-market ratio
is positively related to expected equity returns whereas firm size and past returns are negatively
related to expected equity returns.
We also conduct portfolio analysis to check the robustness of the regression results. Every month,
we sort stocks into quintiles based on the share issuance measure. Next, we look at the return
differences between the extreme quintiles by calculating returns for horizons ranging from 1
month to 24 months after portfolio formation. Consistent with the univariate regressions, there is
no significant return difference between the extreme portfolios due to the confounding impact of
the book-to-market effect. Thus, we run monthly contemporaneous regressions of the share
issuance measure on the book-to-market ratio and calculate a residual share issuance measure for
each stock every month. When we form the quintiles based on this residual issuance measure, we
find that that the quintile with the lowest residual issuance significantly outperforms the quintile
with the highest residual issuance for return horizons of 6 months and longer.
3 The cause of this positive relation could be higher risk embedded in value stocks as argued in Fama and French
(1992) or suboptimal behavior of the typical investor and resulting misvaluation as argued in Lakonishok,
Shleifer and Vishny (1994).

3
The rest of the paper is organized as follows. Section 2 summarizes the legal framework related to
right offerings, seasoned equity offerings and share repurchases in the Turkish market. Section 3
explains the data and the methodology and provides descriptive statistics. Section 4 presents the
empirical results from the regression and portfolio analysis. Section 5 concludes.
2. REGULATIONS FOR RIGHT OFFERINGS, SEO'S AND REPURCHASES
A review of the regulatory framework of the capital markets is an important part of our research,
because as in the case for many other emerging nations, share issuances and repurchases in
Turkish markets were either costly or illegal until recent years. For the Turkish case, there are
very few SEO's and rights offerings are utilized as the primary issuance method. Hence, we start
by analyzing regulatory and corporate governance frameworks of Turkish markets.
2.1 Rights Offerings and Seasoned Equity Offerings
In Turkish markets, capital structure changes occur mostly via rights offerings. A rights offering is
a type of issuance of additional shares by a company to raise capital. A rights issue is a special
form of shelf offering or shelf registration. With the issued rights, existing shareholders have the
privilege to buy a specified number of new shares from the firm at a specified price within a
specified time. In rights issues, new cash enters the firm in contrast to a stock split. The Capital
Markets Board of Turkey (CMBOT) regulates the registration and issue of shares in Turkish
markets through Communiqué Serial I No: 40 dated 03/04/2010 and amendments done under
Communiqué Serial I No: 43 on 23/10/2010. In a rights offering, new shares can be issued at any
price; however, if the firm intends to issue the shares at a price different from the market price or
nominal price, CMBOT should be consulted and the valuation report on the sale price in question
should be published at least two days before the beginning of the sale. Article 7 of Communiqué
Serial I No: 40 regulates the rules regarding how the board of directors should pass the resolution
establishing the amount of and principles governing the capital contributions in a rights offering
and the measures that should be taken when the board opts to restrict the entitlement of the new
shares. Article 8 of Communiqué Serial I No: 40 regulates the conversion of shares offered in
SEO's to tradable shares, the calculation of the registration fees and sales restrictions.
In rights offerings, the pre-emptive rights of the existing shareholders can be restricted and it is
possible that the new shares will only be issued to new investors. However, rights issues are still

4
different from seasoned equity offerings because the money raised in rights issues has to be added
to the book value of capital. In SEO's, the current shareholders of a company can register their
unregistered shares with CMBOT, sell these newly registered shares in the market through
financial intermediaries and take away a portion or all of the money raised for their personal
accounts. Under such a situation, the shares outstanding will change but this change may not be
accompanied by an increase in the book value of capital. The free float of the company will
increase in SEO’s while it may stay the same in a rights issue if the pre-emptive rights are not
restricted. For the Turkish markets, SEO’s are very rare and they are only used by state-owned
enterprises because in right offerings these public companies are also obliged to allocate new
capital.
Bonus issues are the type of issues that companies raise equity capital without any payment to be
made by existing shareholders. Shares issued in these transactions are free shares. Bonus issues
are typically financed by using internal resources and stock dividends in Turkey. The method of
internal resources refers the capital gain from selling a firm’s assets, buildings, equipment or other
real estates. On the other hand, a stock dividend, perceived by investors as “splits”, is an offer of
additional shares of stocks to shareholders in proportion to their existing stocks rather than cash.
CMBOT issued new measures for IPO’s and SEO’s with Communiqué Serial VIII No: 66 dated
03/04/2010 and the prerequisites for entering the capital markets have been relaxed for both
equity and fixed income markets. While most of the articles remained the same, CMBOT
amended the requirement of having 3 consecutive years of net profit to 1 year. CMBOT also
introduced new incentives in collaboration with the Istanbul Stock Exchange, TSPAKB
(Association of Capital Market Intermediary Institutions of Turkey) and KOSGEB (Small and
Medium Enterprises Development Organization) on 04/02/2011 for small and medium sized firms
to enter to the equity market for developing firms. With this incentive, up to 100,000 TL which
covers almost all the costs of IPO’s are granted by KOSGEB to the member firms. In order to be
qualified as a “small and medium sized firm” the total sales in one accounting year must be below
25 million TL.4
2.2 Share Repurchases
For a long time Turkish markets were ruled by a complicated legal system. The capital structure
decisions were regulated by the old Turkish Trade Law no. 6762 which was put into effect in
4 Refer to http://www.ipoturkeysummit.com for further information.

5
1956 and temporary changes have been made since then by communiqués and bylaws of the
Capital Markets Board of Turkey and the Istanbul Stock Exchange (ISE). According to Article
329 of the old Turkish Trade Law, companies could not buy their shares back but the law had
some exceptions. For example, if the company decided to diminish its equity capital to increase its
leverage, aimed to hedge corporate debt with company receivables other than equity participation
contracts or inherited shares through the acquisition of another firm, then the company was
allowed to engage in stock buybacks. Additionally, in the events that the ordinary scope of
activity of the company is engaging in buyback transactions, the board members, directors or
officers pledge their shares as security for their obligations or the buyback is made free and not in
exchange for any consideration, share repurchasing activity was possible. There were other
complications such as the exemption of foreign owned firms from the aforementioned law and
special arrangements that could be made by public companies.
Even with these exceptions, there were very few firms that employed buyback programs until
recently when the CMBOT and ISE issued new principles concerning share repurchases in
parallel with the new Turkish Trade Law no. 6102 under which the new share repurchase
principles are regulated by Article 379. First, with the CMBOT’s Communiqué 27/748 dated
01/09/2009, exchange traded investment trusts and brokerage houses were given the right to buy
back their own shares. Then with a new Communiqué 26/767 dated 11/08/2011, CMBOT
expanded the buyback concessions to all the publicly traded firms declaring that share repurchase
would protect the shareholders from volatility in the stock markets both in Turkey and abroad and
improve the transparency in the markets.
According to the new CMBOT decision, all ISE-listed companies can employ share repurchase
programs but a board decision and subsequent approval from the general shareholder’s meeting is
required. The buyback transactions should be performed in a maximum period of 18 months. Only
previously traded shares can be repurchased through the ISE and no block trades or special
arrangements between buyer and seller parties are allowed. The amount of repurchased shares is
limited by 10% of the company's paid-in-capital and any additional repurchased shares must be
resold in the market in 6 months. Aside from these rules, there are limits on how the company can
apply the repurchase program to avoid affecting the share price in a manipulative manner which
can harm the investors. These restrictions are generally in the form of order bans at the beginning
and ending of trading sessions or price and volume limitations.
6
In short, with the development of Turkish markets especially after the crisis period of 2008,
Turkish legislators have taken new initiatives to ease both share offerings and repurchases. Aside
from the regulatory changes that are stated above, CMBOT and ISE also took a liberal approach
to simplify the bureaucratic procedures and speed up the application processes. We can observe
that these improvements have been proven successful as more firms have applied for IPO’s and
SEO’s until the renewed crisis situation in 2011.
3. DATA AND METHODOLOGY
The data for monthly stock returns, book value of equity, market equity and shares outstanding
are obtained for stocks quoted in the ISE between October 1991 and July 2011 from the
StockGround and Matriks databases5. The raw number of shares outstanding obtained from
StockGround is adjusted for distribution events such as stock splits. In order to be conservative
and ensure that shares outstanding data is available to investors, we only use six-month old data to
explain equity returns following Pontiff and Woodgate (2008). Thus, the adjusted shares
outstanding metric used to measure annual share issuance at time t is:
ISSUEt-6,t-18 = Ln(Adjusted Shares Outstandingt-6) - Ln(Adjusted Shares Outstandingt-18) (1)
In the same vein as Fama and Macbeth (1973), for each month, we estimate separate univariate
regressions using one-period ahead returns as our dependent variable:
Ri,t+n = αi,t + βMEi × MEt + εi,t+n
Ri,t+n = αi,t + βBMi × BMt + εi,t+n
Ri,t+n = αi,t + βMOMi × MOMt + εi,t+n
Ri,t+n = αi,t + βISSUEi × ISSUEt-6,t-18 + εi,t+n for n = 1, 3, 6, 12 and 24 months (2)
Then, we also estimate multivariate regressions to test the statistical power of share issuance after
controlling for size, book-to-market and momentum:
Ri,t+n = αi,t + βMEi ×MEt + βBM
i × BMt + βMOMi × MOMt + βISSUE
i × ISSUEt-6,t-18 + εi,t+n (3)
for n= 1, 3, 6, 12 and 24 months
5 StockGround is a financial analysis software with advanced fundamental and technical analysis capabilities
designed by Rasyonet Inc. which is a software solution provider to brokerage houses, commercial banks and
portfolio management firms. Matriks Bilgi Dağıtım Hizmetleri A.Ş. (“Matriks”) has been serving as a “Licensed
Data Dissemination Company” since January 2004, upon receiving a buyer’s license from the ISE. Matriks
extracts information on Turkish and global capital markets and conveys it to individual and institutional clients.

7
In regression equations (2) and (3), Ri,t+n is the return on stock i for holding periods of n months
after year t; ME is the natural logarithm of market equity measured at the end of previous June;
BM is the natural logarithm of the ratio of book value of equity to market value of equity
measured at the end of the previous calendar year; MOM is the equity returns for the past 6
months and ISSUEt-6,t-18 is estimated as in equation (1). To account for nonlinearities in the
relation between past returns and expected returns, an ordinal ranking is used for the momentum
factor following Chan, Jegadeesh and Lakonishok (2006).6
We report the average slope coefficients, intercepts, and adjusted R2s. The dependent variables in
our regressions are the future stock returns for holding periods of 1, 3, 6, 12 and 24 months. Using
the same procedure as in Pontiff (1996), t-statistics for the slope coefficients are calculated with
autocorrelation-consistent standard errors that consider the holding period overlap. This procedure
estimates a regression using each month’s slope estimate where the residuals follow an nth-order
autoregressive process with n equal to one minus the length of the holding period in months. This
technique is general in that it does not rely on the assumption of no monthly return
autocorrelation. The time-series of the slope coefficients are also analyzed to see the effects of the
crisis periods and business cycles on the relation between share issuance and expected equity
returns.
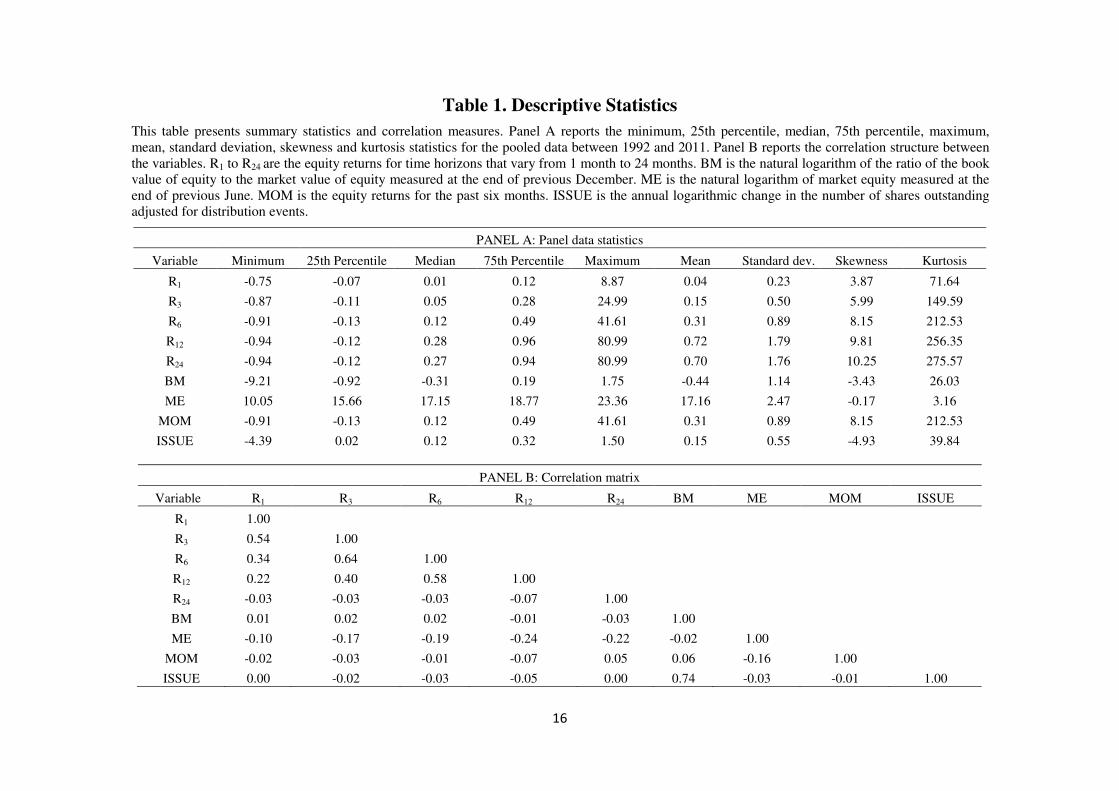
Table 1 presents descriptive statistics and correlation structures for the variables used in study. In
Panel A, we compute descriptive statistics for the pooled panel data. We are particularly interested
in share issuance. The share issuance measure that we use reflects annual logarithmic changes in
adjusted shares outstanding and we find that the mean and median values for ISSUE are positive
implying that the average firm in our sample had a tendency to issue shares in a given month.
However, Panel A also shows that there are some monthly observations for which some firms
reduced their number of shares outstanding substantially. The standard deviation of ISSUE is
higher than its mean and the distribution of ISSUE is highly left-skewed and leptokurtic.
The returns for the five distinct time horizons exhibit similar patterns and we will focus on the
descriptive statistics for the one-month window in our discussion. The monthly average return for
the stocks in the sample is 4% and the median return is 1%. This difference between the mean and
6 The momentum measure is lagged by 1 month to avoid losing predictive ability due to the positive
autocorrelation attributable to the bid-ask bounce. The results are robust when the unlagged momentum measure
is used in the regressions instead. The results are also qualitatively the same if raw returns rather than an ordinal
ranking are used for the momentum factor.
8
the median statistics is due to the existence of some firm-months with very high returns. The
maximum statistic is 887% implying that there was a particular company whose stock price
increased by almost tenfold in a given month. Consequently, the standard deviation for the
monthly return distribution is about 6 times the mean and the distribution is highly right-skewed
and leptokurtic. As the return horizon is extended; the mean and median statistics increase, the
extreme returns get more pronounced and the distribution becomes more skewed and leptokurtic.
The mean and median statistics for the raw book-to-market values are 0.64 and 0.73, respectively
and the BM distribution has fat tails as evidenced by the extreme observations. The average size
of the sample firms is about 28 million TL. The momentum variable is measured by returns over
six month windows, thus its distributional properties follow those of the return measures.
Panel B of Table 1 describes the correlation structure between the variables. The negative
correlation between issuance and expected returns is a precursor for the significantly negative
relation between these two variables that we find in subsequent analysis. While the correlations
between most of the variables are small, there is an exceptionally large correlation of 0.74
between BM and ISSUE. This finding is not witnessed in the U.S. markets and is particular to
Turkey. The reason is that, contrary to U.S. markets, SEO's are rare in the ISE and the share
issuance measure is mainly driven by rights offerings. Rights issues are different from seasoned
equity offerings because the money raised has to be added to the book value of capital in rights
issues. However, in SEO’s, the shareholders that register their shares for the first time and sell
them in the market have the option to add the proceeds to the firm’s capital or take them for their
personal accounts. Hence, the book-to-market ratio increases mechanically for rights offerings but
this need not be the case for SEO’s. Since our issuance measure is driven by rights issues, there is
a strong positive correlation between BM and ISSUE. One final point worth to note is that the
correlations between returns up to a horizon of 12 months tends to be positive but there seems to
be some reversal when the return horizon is extended to two years.
4. EMPIRICAL RESULTS
4.1 Regression Analysis
The regressions results of expected equity returns on share issuance, book-to-market ratio, size
and momentum are presented in Table 2. Five holding periods ranging from 1 month to 24 months
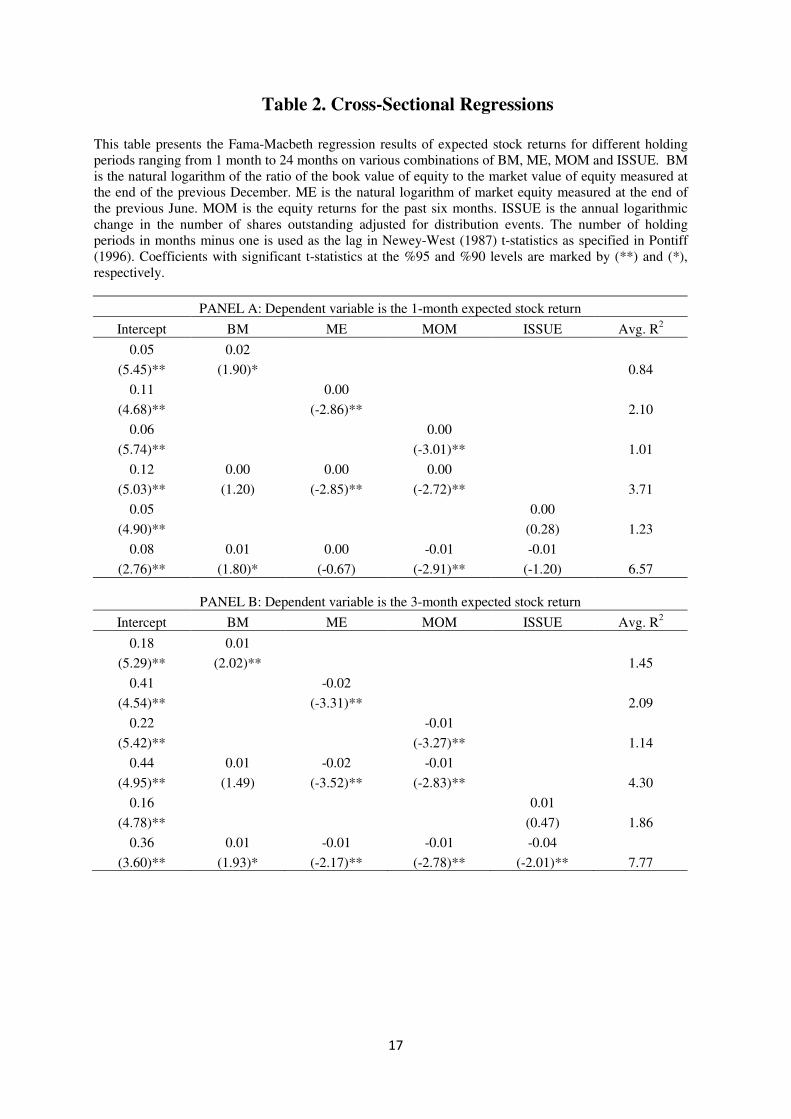
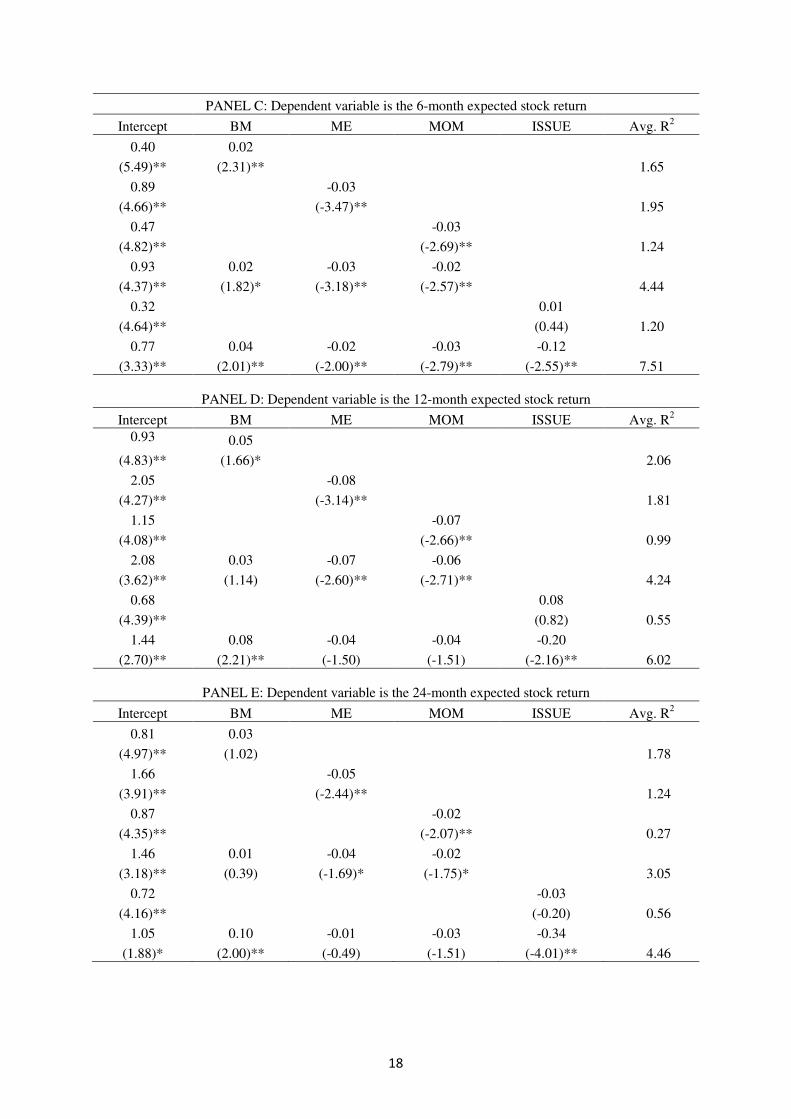
are considered to measure expected returns. Panel A gives the estimation results for the 1-month
return horizon. The first four rows present a “horse race” between book-to-market (BM), size
9
(ME) and momentum (MOM) by considering three separate univariate regressions. The fourth row
presents results for a multivariate regression on BM, ME and MOM. In univariate regressions, BM
has a positive relation with one-month ahead returns whereas ME has a negative relation with
one-month ahead returns. These results are consistent with prior literature; however, the
significantly negative coefficient of MOM is at odds with results from U.S. studies. Other studies
focusing on Turkish markets such as Bildik and Gulay (2007) and Kandir and Inan (2011) also
find that the momentum effect does not hold for the ISE. In this respect, it may be more accurate
to treat the momentum effect as a reversal effect in the context of Turkish markets. The univariate
regression results for one-month returns extend to other return horizons with the exception of BM
which loses its significance at the two-year horizon. The multivariate regressions that include BM,
ME and MOM show that size and momentum are still significantly negatively related to expected
returns for all horizons whereas the coefficient on BM becomes generally insignificant.
The main variable of interest is ISSUE. In univariate regressions, for all return horizons, we find
that there is no significant relation between share issuance and expected returns. This result can be
explained by observing that ISSUE captures both the issuance effect which implies a negative
relation with expected equity returns and the book-to-market effect which implies a positive
relation with expected equity returns. This is due to the fact that, in Turkish markets, most
issuance occurs in the form of rights offerings under which the money raised necessarily becomes
a part of the book capital. As a result, the book-to-market ratio of the issuing firm mechanically
increases along with the number of shares outstanding. The negative effect of increased shares
outstanding and the positive effect of a higher book-to-market ratio on expected equity returns are
potentially offsetting. This conjecture can explain the insignificant slope coefficient of ISSUE in
the univariate setting. Hence, it becomes essential to control for BM to see the relation between
share issuance activity and expected equity returns in isolation.
In the last row of each panel, multivariate regressions that include ISSUE along with the other
three control variables are presented. Although ISSUE still has no cross-sectional relation with
one-month ahead returns, we find that the coefficient of ISSUE becomes significant at the three-
month horizon with a value of -0.04 and a t-statistic of -2.01. As we extend the return
measurement window, the slope coefficient of ISSUE increases in absolute magnitude and
becomes more significant. For example, for the two-year return horizon, the coefficient of ISSUE
is -0.34 with a t-statistic of -4.01. In these multivariate regressions, ME and MOM lose their
significance after the 6-month return horizon. In other words, as the return window is extended,
the issuance effect subsumes the size and the momentum effects. Moreover, the book-to-market
10
effect generally gets more pronounced for longer return horizons and the coefficient of BM is
significantly positive in all panels. This shows that including the issuance measure in the
specification also makes it possible to tease out the positive relation between the book-to-market
ratio and expected returns which was missing from the univariate regressions. Overall, we
interpret these results as evidence that logarithmic annual changes in share issuance is
significantly related to expected equity returns, especially for longer horizons.7
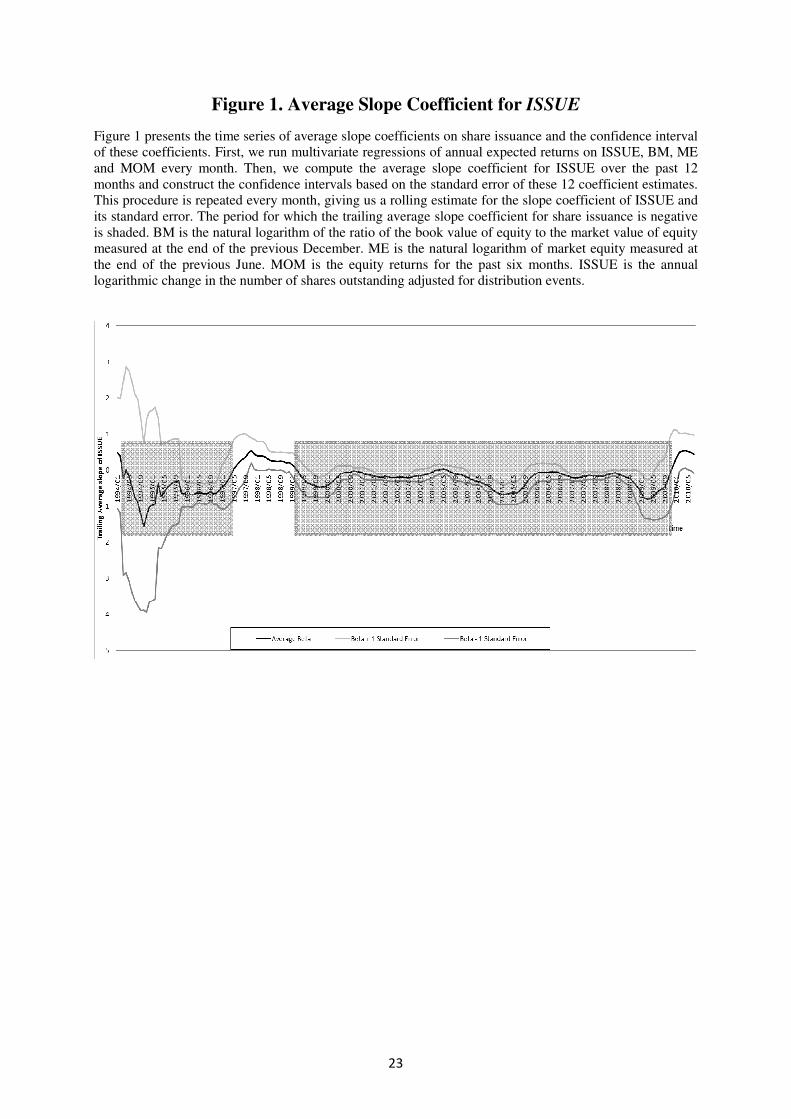
Figure 1 investigates the time series of slope coefficients on share issuance. First, we run
multivariate regressions of annual returns on ISSUE and the three control variables every month.
Then, we compute the average slope coefficient for ISSUE over the past 12 months and construct
the confidence intervals based on the standard error of these 12 coefficient estimates. This
procedure is repeated every month, giving us a rolling estimate for the slope coefficient of ISSUE
and its standard error. The period for which the trailing average slope coefficient for share
issuance is negative is shaded. As Figure 1 shows, after the early years of the ISE, the average
relation between share issuance and expected equity returns exhibits a remarkable tendency to be
negative and the shaded areas dominate most of the timeline. In the early years of the ISE,
particularly the pre-1994 data tend to produce positive slope coefficients but the standard
deviation of these coefficients is large. After that, the average slope coefficient becomes positive
only briefly towards the end of the 90's and during 2010 when the economy experienced a strong
recovery after the 2008 crisis. Even during these periods, although the average slope coefficients
for share issuance tend to be positive, their magnitude is small and their variability is large. The
main message from Figure 1 is that the negative relation between share issuance and expected
equity returns documented in Table 2 is a phenomenon that applies to the majority of the sample
period.
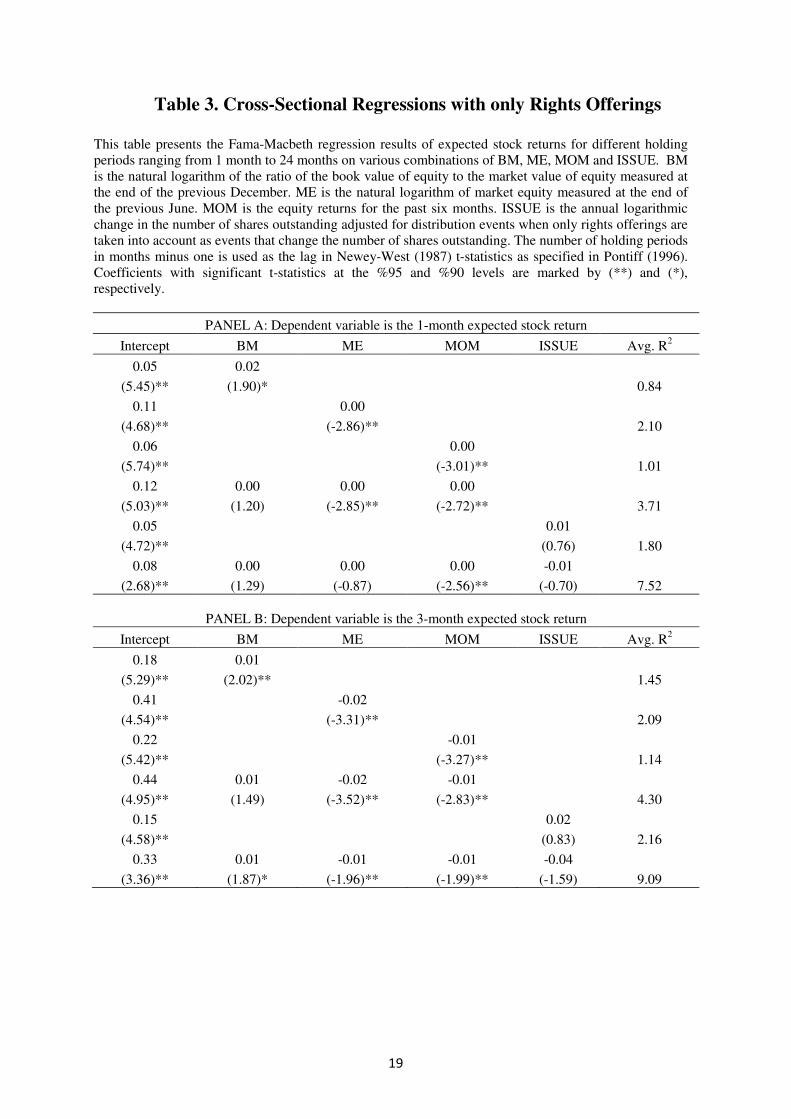
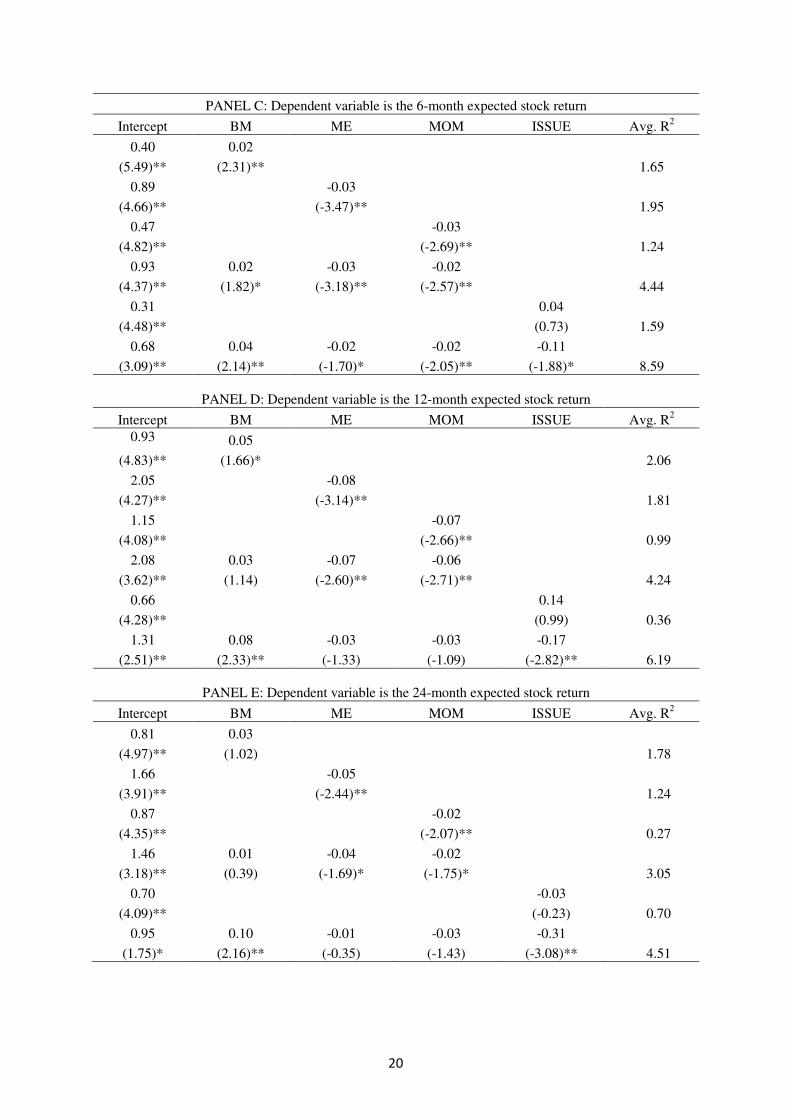
Since SEO's or share repurchases are rare in the ISE, the share issuance measure used in Table 2
is driven mainly by rights offerings. Hence next, we repeat our analysis by considering only rights
offerings as the event that changes shares outstanding. The results are presented in Table 3.
Overall, Table 3 shows that the removal of SEO's and share repurchases has a minor impact on
the relation between share issuance and expected returns. The major difference is that, in the
multivariate analysis, the slope coefficients and t-statistics for ISSUE decrease. However, the
significantly negative relation between ISSUE and expected equity returns is still visible for return
horizons starting with 6 months. As one moves from the six-month horizon to the two-year
horizon, the coefficient of ISSUE increases in absolute magnitude from -0.11 to -0.31 and the
7 All of these results are robust to winsorizing all the right-hand variables at the 0.5% level.
11
corresponding t-statistic changes from -1.88 to -3.08. In other words, the main result of this study
stays intact after considering rights offerings as the only event that affects issuance activity.
Moreover, the slight reduction in the strength of the relation between share issuance and equity
returns is expected due to the fact that the offsetting impact of the book-to-market effect on the
issuance effect should become more pronounced when only rights offerings are taken into
account.
4.2 Portfolio Analysis
To further test the cross-sectional relation between share issuance and expected equity returns, we
use a sorted portfolio approach. First, every month, we construct five quintile portfolios based on
ISSUE. Next, we calculate the return difference between the quintile with the highest net share
issuance and the quintile with the lowest net share issuance. The return differences are calculated
for five different holding periods that extend from 1 month to 24 months. The results are
presented in Table 4.
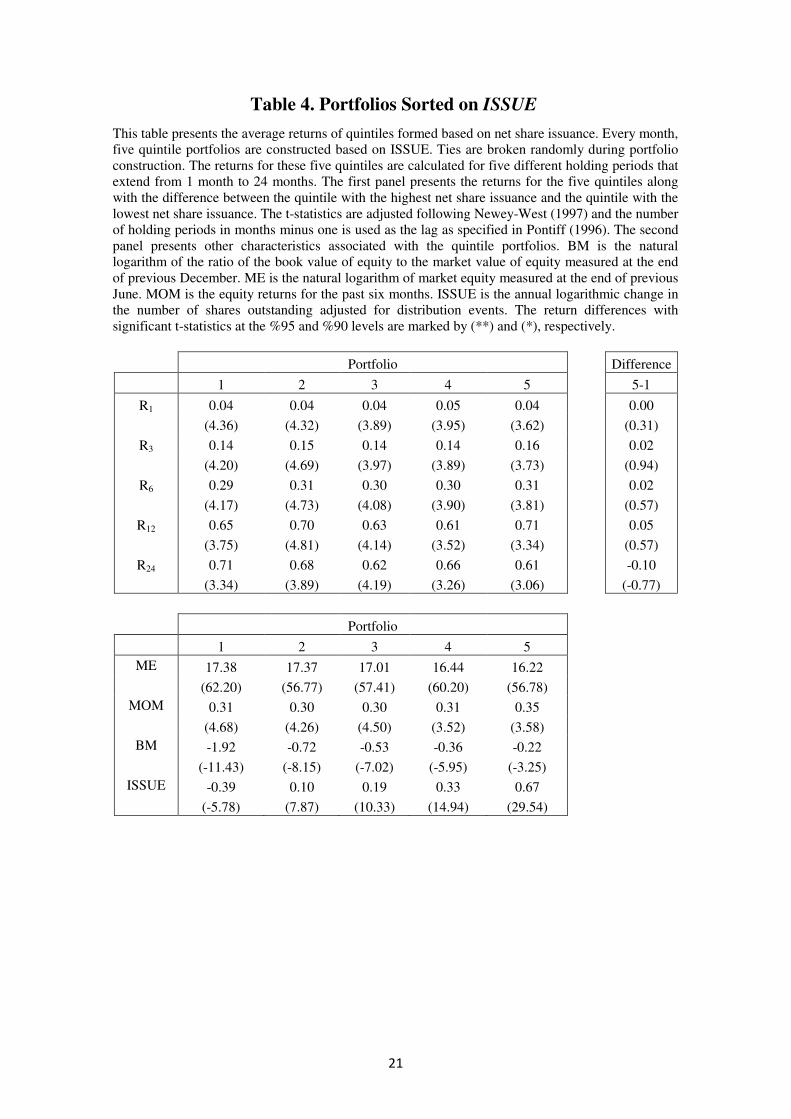
Table 4 shows that, for all return horizons, there is no significant performance difference between
the extreme share issuance quintiles. For the return windows up to 12 months, the returns of all
quintile portfolios are essentially flat. For the two-year horizon, although the quintile with the
lowest net share issuance outperforms the quintile with the highest net share issuance by 10%, this
difference is not statistically significant. These findings are consistent with the univariate
regression results from Tables 2 and 3. We again attribute the lack of a significant performance
difference between the quintiles formed based on ISSUE to the mechanical relation between this
measure and the book-to-market ratio. This mechanical relation is evident from the second panel
in Table 4 which shows that the book-to-market ratio increases uniformly as one moves from the
lowest net share issuance quintile to the highest net share issuance quintile. As a result, the
issuance effect and the book-to-market effect offset each other.
To separate the issuance and book-to-market effects from each other, we regress ISSUE on book-
to-market ratio every month and calculate a residual share issuance measure for every stock as the
error term from the regression. This residual share issuance measure is orthogonal to the book-to-
market ratio by construction and helps us isolate the stand-alone relation between issuance
activity and expected equity returns. We construct five quintile portfolios based on the residual
issuance measure every month and calculate the return difference between the quintiles with the
highest and lowest residual share issuance. The results are presented in Table 5.
12
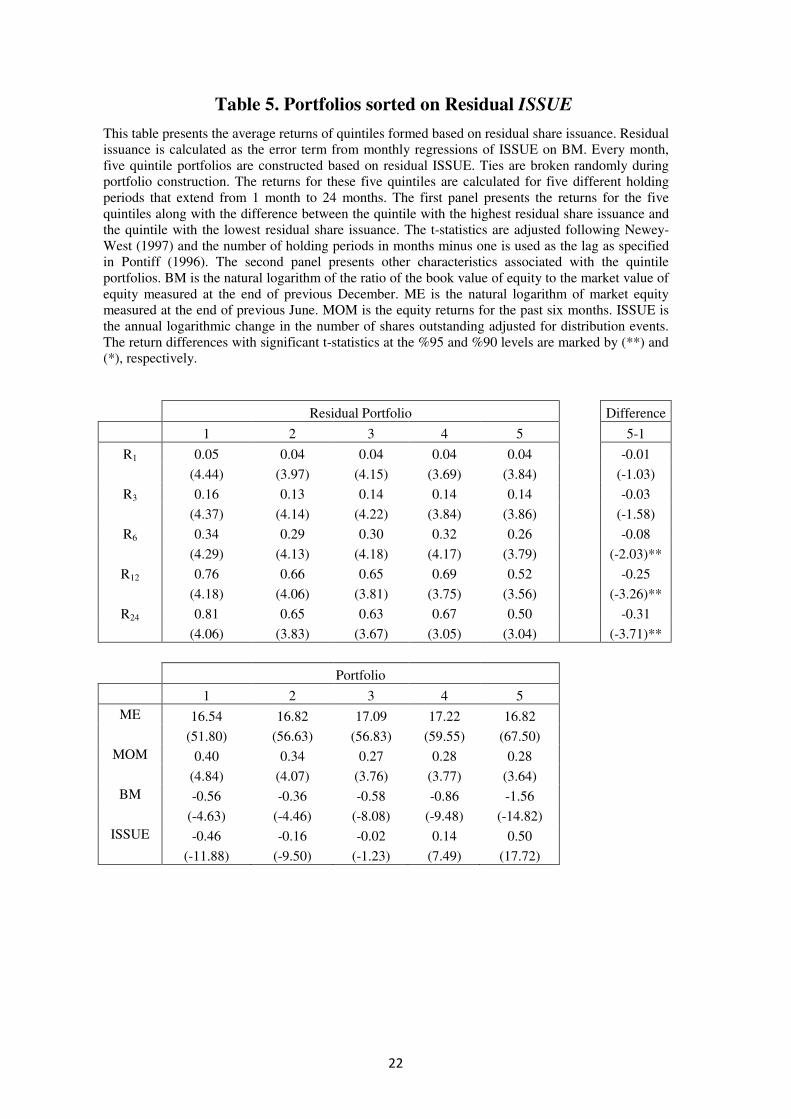
Although the profile for the quintile returns seems to be flat for the 1-month and 3-month
expected return windows, there is a significant return difference between the quintiles with the
highest and lowest residual share issuance starting with the 6-month horizon. For the 6-month
window, the quintile with the lowest residual share issuance has an average return of 34%
whereas the quintile with the highest residual share issuance has an average return of 26%. The
return difference is 8% with a Newey-West (1997) adjusted t-statistic of 2.03. The results get
more dramatic as the expected return horizon is extended to 12 and 24 months. For the 24-month
horizon, the lowest and highest residual share issuance quintiles have average returns of 81% and
50%, respectively. The difference is 31% with a highly significant t-statistic of 3.71. In other
words, the negative relation between share issuance activity and expected equity returns becomes
apparent after controlling for the book-to-market ratio in the portfolio analysis as well. These
results confirm that share issuance exhibits a strong cross-sectional relation with expected equity
returns in the ISE between 1992 and 2011.
5. CONCLUSION
In this study, we investigate the cross-sectional relation between share issuance and expected
equity returns in the Istanbul Stock Exchange. Especially in the post-2000 period, numerous
international studies argue that post-issuance long-run returns are abnormally low and the post-
share repurchase long-run returns are abnormally high. This debate motivates us to examine
whether net share issuance can be used to explain expected stock returns in the ISE, especially
given that Turkish regulators are taking important steps to make capital structure changing events
such as IPO's, SEO's and share repurchases less costly.
We measure share issuance as the annual logarithmic change in shares outstanding adjusted for
distribution events such as stock splits. First, we estimate univariate regressions to test the stand-
alone predictive power of book-to-market, size, momentum and share issuance. The dependent
variable in our regressions is the one-period ahead stock return for five distinct horizons ranging
from 1 month to 24 months. Our variable of interest, ISSUE, is not statistically significant in a
univariate setting. This is due to the fact that ISSUE is highly correlated with the book-to-market
ratio and captures both the issuance effect and the book-to-market effect. In Turkish markets,
most capital structure changes occur in the form of rights offerings. Rights offering are different
from seasoned equity offerings because the money raised in rights offers has to be added to the
capital whereas in SEO’s they can be taken away by the shareholders that register their shares for

13
the first time and offer them in the market. Hence, in a rights offer, the book-to-market ratio
necessarily increases along with the number of shares outstanding. Hence, the positive relation
between the book-to-market ratio and expected returns offsets the negative relation between share
issuance and expected returns resulting in an insignificant coefficient for ISSUE in the univariate
setting. However, when multivariate regressions are estimated to test the significance of share
issuance along with the size, value and momentum factors, we find that there is a significantly
negative relation between share issuance and expected stock returns. This relation gets stronger
and subsumes the size and momentum effects for longer return horizons. When we investigate the
time series of slope coefficients on share issuance, we find that the average slope exhibits a
remarkable tendency to be negative over the sample period.
A sorted portfolio approach is also employed to test the validity of our regression results. Every
month, five quintile portfolios are constructed based on the share issuance measure and the return
differences between extreme quintiles are computed for different return horizons after portfolio
formation. There is no significant return difference between the quintiles with the highest and
lowest net share issuance in any holding period, confirming the results of the univariate
regressions. However, when we sort stocks into portfolios according to the residuals from a
monthly regression of share issuance on the book-to-market ratio to abstract from the book-to-
market effect, the return difference between the extreme residual issuance quintiles become
significantly negative for return windows of 6 months and longer. These results confirm that share
issuance has a significantly negative relation with expected equity returns in the ISE between
1992 and 2011.
14
REFERENCES
Akdeniz, L., Altay-Salih, A., Aydogan, K., 2000, A Cross-section of expected stock returns on the
Istanbul Stock Exchange, Russian and Eastern European Finance and Trade, 36, 6-26.
Baker, M., Wurgler, J., 2000, The equity share in new issues and aggregate stock returns, Journal of
Finance 55, 2219-2257
Bali, T.K., Demirtas, O., Hovakimian, A., 2010, Corporate financing activities and contrarian
investment, Review of Finance 14, 543-584
Banz, R.W., 1981, The relationship between return and market value of common stocks, Journal of
Financial Economics 9, 3-18
Bildik, R., Gulay, G., 2007, Profitability of Contrarian Strategies: Evidence from the Istanbul Stock
Exchange, International Review of Finance. Mar/Jun2007, Vol. 7 Issue 1/2, 61-87
Butler, A., Grullon, G., Weston, J., 2005, Can Managers Forecast Aggregate Market Returns?, Journal
of Finance 60, 963-986
Chan, L. K, Jegadeesh, N., Lakonishok, J., 1996, Momentum Strategies, Journal of Finance 51, 1681-
1713.
Daniel, K., Titman, S., 2006, Market reactions to tangible and intangible information, Journal of
Finance 61, 1605-1643
Doganay, M., 2006, Fama-French üç faktör varlık fiyatlama modelinin İMKB'de uygulanması, İktisat,
İşletme ve Finans Dergisi, 21, 61-71.
Eckbo, E., Masulis, R., Norli, O., 2000, Seasoned public offerings: Resolution of the new issues
puzzle, Journal of Financial Economics 56, 251-291
Fama, E.F., French, K.R., 1992, The cross-section of expected stock returns, Journal of Finance 47,
427-465
Fama, E.F., French, K.R., 1993, Common risk factors in the returns on stocks and bonds, Journal of
Financial Economics 33, 3-56
Fama, E.F., French, K.R., 2008, Dissecting Anomalies, Journal of Finance 63, 1653-1678
Fama, E. F., MacBeth, J.D., 1973, Risk, Return and Equilibrium: Empirical tests. Journal of Political
Economy 81, 607-636.
Ikenberry, D., Lakonishok, J., Vermaelen, T., 1995, Market under reaction to open market share
repurchases, Journal of Financial Economics 39, 181-208
Kandir, S.Y., Inan, H., 2011, Momentum Yatırım Stratejisinin Karlılığının İMKB’de Test Edilmesi,
Journal of BRSA Banking & Financial Markets. 2011, Vol. 5 Issue 2, 51-70
Jegadeesh, N., Titman, S., 1993, Returns to buying winners and selling losers: Implications for stock
market efficiency, Journal of Finance 48, 65-91
Lakonishok, J., Shleifer, A., Vishny, R., 1994, Contrarian investment, extrapolation and risk, Journal
of Finance 49, 1541-1578
15
Lintner, J., 1965, The valuation of risk assets and the selection of risky investments in stock portfolios
and capital budgets, Review of Economics and Statistics 47, 13-37
Loughran, T., Ritter, J., 1995, The new issues puzzle, Journal of Finance 50, 23-51
Loughran T., Vijh, Anand M., 1997, Do long-term shareholders benefit from corporate acquisitions?,
Journal of Finance 52, 1765-1790.
Lyandres, E., Sun, L., Zhang, L., 2008, The new issues puzzle: Testing the investment-based
explanation, Review of Financial Studies 21, 2825-2855
McLean, D.R., Pontiff, J., Watanabe, A., 2008, Share issuance and cross–sectional returns:
International Evidence, Journal of Financial Economics 94, 1-17
Newey, Whitney K., Kenneth D. West, 1987. A simple, positive semi-definite, heteroscedasticity and
autocorrelation consistent covariance matrix. Econometrica 55:3, 703-708.
Pontiff, J., 1996, Costly arbitrage and closed-end fund discounts, Quarterly Journal of Economics 111,
1135-1151
Pontiff, J., Woodgate, A., 2008, Share issuance and cross-sectional returns, Journal of Finance 63,
921-945
Schultz, P., 2003, Pseudo Market Timing and the Long-Run Underperformance of IPOs, Journal of
Finance 58, 483-517
Sharpe, W.F., 1964, Capital asset prices: A theory of market equilibrium under conditions of risk,
Journal of Finance 19, 425-442
Unlu, U., 2012, Dört faktörlü varlık fiyatlama modelinin İMKB'de test edilmesi, İktisat, İşletme ve
Finans Dergisi, 27, 57-83.
16
Table 1. Descriptive Statistics
This table presents summary statistics and correlation measures. Panel A reports the minimum, 25th percentile, median, 75th percentile, maximum,
mean, standard deviation, skewness and kurtosis statistics for the pooled data between 1992 and 2011. Panel B reports the correlation structure between
the variables. R1 to R24 are the equity returns for time horizons that vary from 1 month to 24 months. BM is the natural logarithm of the ratio of the book
value of equity to the market value of equity measured at the end of previous December. ME is the natural logarithm of market equity measured at the
end of previous June. MOM is the equity returns for the past six months. ISSUE is the annual logarithmic change in the number of shares outstanding
adjusted for distribution events.
PANEL A: Panel data statistics
Variable Minimum 25th Percentile Median 75th Percentile Maximum Mean Standard dev. Skewness Kurtosis
R1 -0.75 -0.07 0.01 0.12 8.87 0.04 0.23 3.87 71.64
R3 -0.87 -0.11 0.05 0.28 24.99 0.15 0.50 5.99 149.59
R6 -0.91 -0.13 0.12 0.49 41.61 0.31 0.89 8.15 212.53
R12 -0.94 -0.12 0.28 0.96 80.99 0.72 1.79 9.81 256.35
R24 -0.94 -0.12 0.27 0.94 80.99 0.70 1.76 10.25 275.57
BM -9.21 -0.92 -0.31 0.19 1.75 -0.44 1.14 -3.43 26.03
ME 10.05 15.66 17.15 18.77 23.36 17.16 2.47 -0.17 3.16
MOM -0.91 -0.13 0.12 0.49 41.61 0.31 0.89 8.15 212.53
ISSUE -4.39 0.02 0.12 0.32 1.50 0.15 0.55 -4.93 39.84
PANEL B: Correlation matrix
Variable R1 R3 R6 R12 R24 BM ME MOM ISSUE
R1 1.00
R3 0.54 1.00
R6 0.34 0.64 1.00
R12 0.22 0.40 0.58 1.00
R24 -0.03 -0.03 -0.03 -0.07 1.00
BM 0.01 0.02 0.02 -0.01 -0.03 1.00
ME -0.10 -0.17 -0.19 -0.24 -0.22 -0.02 1.00
MOM -0.02 -0.03 -0.01 -0.07 0.05 0.06 -0.16 1.00
ISSUE 0.00 -0.02 -0.03 -0.05 0.00 0.74 -0.03 -0.01 1.00
17
Table 2. Cross-Sectional Regressions
This table presents the Fama-Macbeth regression results of expected stock returns for different holding
periods ranging from 1 month to 24 months on various combinations of BM, ME, MOM and ISSUE. BM
is the natural logarithm of the ratio of the book value of equity to the market value of equity measured at
the end of the previous December. ME is the natural logarithm of market equity measured at the end of
the previous June. MOM is the equity returns for the past six months. ISSUE is the annual logarithmic
change in the number of shares outstanding adjusted for distribution events. The number of holding
periods in months minus one is used as the lag in Newey-West (1987) t-statistics as specified in Pontiff
(1996). Coefficients with significant t-statistics at the %95 and %90 levels are marked by (**) and (*),
respectively.
PANEL A: Dependent variable is the 1-month expected stock return
Intercept BM ME MOM ISSUE Avg. R2
0.05 0.02
(5.45)** (1.90)* 0.84
0.11 0.00
(4.68)** (-2.86)** 2.10
0.06 0.00
(5.74)** (-3.01)** 1.01
0.12 0.00 0.00 0.00
(5.03)** (1.20) (-2.85)** (-2.72)** 3.71
0.05 0.00
(4.90)** (0.28) 1.23
0.08 0.01 0.00 -0.01 -0.01
(2.76)** (1.80)* (-0.67) (-2.91)** (-1.20) 6.57
PANEL B: Dependent variable is the 3-month expected stock return
Intercept BM ME MOM ISSUE Avg. R2
0.18 0.01
(5.29)** (2.02)** 1.45
0.41 -0.02
(4.54)** (-3.31)** 2.09
0.22 -0.01
(5.42)** (-3.27)** 1.14
0.44 0.01 -0.02 -0.01
(4.95)** (1.49) (-3.52)** (-2.83)** 4.30
0.16 0.01
(4.78)** (0.47) 1.86
0.36 0.01 -0.01 -0.01 -0.04
(3.60)** (1.93)* (-2.17)** (-2.78)** (-2.01)** 7.77
18
PANEL C: Dependent variable is the 6-month expected stock return
Intercept BM ME MOM ISSUE Avg. R2
0.40 0.02
(5.49)** (2.31)** 1.65
0.89 -0.03
(4.66)** (-3.47)** 1.95
0.47 -0.03
(4.82)** (-2.69)** 1.24
0.93 0.02 -0.03 -0.02
(4.37)** (1.82)* (-3.18)** (-2.57)** 4.44
0.32 0.01
(4.64)** (0.44) 1.20
0.77 0.04 -0.02 -0.03 -0.12
(3.33)** (2.01)** (-2.00)** (-2.79)** (-2.55)** 7.51
PANEL D: Dependent variable is the 12-month expected stock return
Intercept BM ME MOM ISSUE Avg. R2
0.93 0.05
(4.83)** (1.66)* 2.06
2.05 -0.08
(4.27)** (-3.14)** 1.81
1.15 -0.07
(4.08)** (-2.66)** 0.99
2.08 0.03 -0.07 -0.06
(3.62)** (1.14) (-2.60)** (-2.71)** 4.24
0.68 0.08
(4.39)** (0.82) 0.55
1.44 0.08 -0.04 -0.04 -0.20
(2.70)** (2.21)** (-1.50) (-1.51) (-2.16)** 6.02
PANEL E: Dependent variable is the 24-month expected stock return
Intercept BM ME MOM ISSUE Avg. R2
0.81 0.03
(4.97)** (1.02) 1.78
1.66 -0.05
(3.91)** (-2.44)** 1.24
0.87 -0.02
(4.35)** (-2.07)** 0.27
1.46 0.01 -0.04 -0.02
(3.18)** (0.39) (-1.69)* (-1.75)* 3.05
0.72 -0.03
(4.16)** (-0.20) 0.56
1.05 0.10 -0.01 -0.03 -0.34
(1.88)* (2.00)** (-0.49) (-1.51) (-4.01)** 4.46
19
Table 3. Cross-Sectional Regressions with only Rights Offerings
This table presents the Fama-Macbeth regression results of expected stock returns for different holding
periods ranging from 1 month to 24 months on various combinations of BM, ME, MOM and ISSUE. BM
is the natural logarithm of the ratio of the book value of equity to the market value of equity measured at
the end of the previous December. ME is the natural logarithm of market equity measured at the end of
the previous June. MOM is the equity returns for the past six months. ISSUE is the annual logarithmic
change in the number of shares outstanding adjusted for distribution events when only rights offerings are
taken into account as events that change the number of shares outstanding. The number of holding periods
in months minus one is used as the lag in Newey-West (1987) t-statistics as specified in Pontiff (1996).
Coefficients with significant t-statistics at the %95 and %90 levels are marked by (**) and (*),
respectively.
PANEL A: Dependent variable is the 1-month expected stock return
Intercept BM ME MOM ISSUE Avg. R2
0.05 0.02
(5.45)** (1.90)* 0.84
0.11 0.00
(4.68)** (-2.86)** 2.10
0.06 0.00
(5.74)** (-3.01)** 1.01
0.12 0.00 0.00 0.00
(5.03)** (1.20) (-2.85)** (-2.72)** 3.71
0.05 0.01
(4.72)** (0.76) 1.80
0.08 0.00 0.00 0.00 -0.01
(2.68)** (1.29) (-0.87) (-2.56)** (-0.70) 7.52
PANEL B: Dependent variable is the 3-month expected stock return
Intercept BM ME MOM ISSUE Avg. R2
0.18 0.01
(5.29)** (2.02)** 1.45
0.41 -0.02
(4.54)** (-3.31)** 2.09
0.22 -0.01
(5.42)** (-3.27)** 1.14
0.44 0.01 -0.02 -0.01
(4.95)** (1.49) (-3.52)** (-2.83)** 4.30
0.15 0.02
(4.58)** (0.83) 2.16
0.33 0.01 -0.01 -0.01 -0.04
(3.36)** (1.87)* (-1.96)** (-1.99)** (-1.59) 9.09
20
PANEL C: Dependent variable is the 6-month expected stock return
Intercept BM ME MOM ISSUE Avg. R2
0.40 0.02
(5.49)** (2.31)** 1.65
0.89 -0.03
(4.66)** (-3.47)** 1.95
0.47 -0.03
(4.82)** (-2.69)** 1.24
0.93 0.02 -0.03 -0.02
(4.37)** (1.82)* (-3.18)** (-2.57)** 4.44
0.31 0.04
(4.48)** (0.73) 1.59
0.68 0.04 -0.02 -0.02 -0.11
(3.09)** (2.14)** (-1.70)* (-2.05)** (-1.88)* 8.59
PANEL D: Dependent variable is the 12-month expected stock return
Intercept BM ME MOM ISSUE Avg. R2
0.93 0.05
(4.83)** (1.66)* 2.06
2.05 -0.08
(4.27)** (-3.14)** 1.81
1.15 -0.07
(4.08)** (-2.66)** 0.99
2.08 0.03 -0.07 -0.06
(3.62)** (1.14) (-2.60)** (-2.71)** 4.24
0.66 0.14
(4.28)** (0.99) 0.36
1.31 0.08 -0.03 -0.03 -0.17
(2.51)** (2.33)** (-1.33) (-1.09) (-2.82)** 6.19
PANEL E: Dependent variable is the 24-month expected stock return
Intercept BM ME MOM ISSUE Avg. R2
0.81 0.03
(4.97)** (1.02) 1.78
1.66 -0.05
(3.91)** (-2.44)** 1.24
0.87 -0.02
(4.35)** (-2.07)** 0.27
1.46 0.01 -0.04 -0.02
(3.18)** (0.39) (-1.69)* (-1.75)* 3.05
0.70 -0.03
(4.09)** (-0.23) 0.70
0.95 0.10 -0.01 -0.03 -0.31
(1.75)* (2.16)** (-0.35) (-1.43) (-3.08)** 4.51
21
Table 4. Portfolios Sorted on ISSUE
This table presents the average returns of quintiles formed based on net share issuance. Every month,
five quintile portfolios are constructed based on ISSUE. Ties are broken randomly during portfolio
construction. The returns for these five quintiles are calculated for five different holding periods that
extend from 1 month to 24 months. The first panel presents the returns for the five quintiles along
with the difference between the quintile with the highest net share issuance and the quintile with the
lowest net share issuance. The t-statistics are adjusted following Newey-West (1997) and the number
of holding periods in months minus one is used as the lag as specified in Pontiff (1996). The second
panel presents other characteristics associated with the quintile portfolios. BM is the natural
logarithm of the ratio of the book value of equity to the market value of equity measured at the end
of previous December. ME is the natural logarithm of market equity measured at the end of previous
June. MOM is the equity returns for the past six months. ISSUE is the annual logarithmic change in
the number of shares outstanding adjusted for distribution events. The return differences with
significant t-statistics at the %95 and %90 levels are marked by (**) and (*), respectively.
Portfolio Difference
1 2 3 4 5 5-1
R1 0.04 0.04 0.04 0.05 0.04 0.00
(4.36) (4.32) (3.89) (3.95) (3.62) (0.31)
R3 0.14 0.15 0.14 0.14 0.16 0.02
(4.20) (4.69) (3.97) (3.89) (3.73) (0.94)
R6 0.29 0.31 0.30 0.30 0.31 0.02
(4.17) (4.73) (4.08) (3.90) (3.81) (0.57)
R12 0.65 0.70 0.63 0.61 0.71 0.05
(3.75) (4.81) (4.14) (3.52) (3.34) (0.57)
R24 0.71 0.68 0.62 0.66 0.61 -0.10
(3.34) (3.89) (4.19) (3.26) (3.06) (-0.77)
Portfolio
1 2 3 4 5
ME 17.38 17.37 17.01 16.44 16.22
(62.20) (56.77) (57.41) (60.20) (56.78)
MOM 0.31 0.30 0.30 0.31 0.35
(4.68) (4.26) (4.50) (3.52) (3.58)
BM -1.92 -0.72 -0.53 -0.36 -0.22
(-11.43) (-8.15) (-7.02) (-5.95) (-3.25)
ISSUE -0.39 0.10 0.19 0.33 0.67
(-5.78) (7.87) (10.33) (14.94) (29.54)
22
Table 5. Portfolios sorted on Residual ISSUE
This table presents the average returns of quintiles formed based on residual share issuance. Residual
issuance is calculated as the error term from monthly regressions of ISSUE on BM. Every month,
five quintile portfolios are constructed based on residual ISSUE. Ties are broken randomly during
portfolio construction. The returns for these five quintiles are calculated for five different holding
periods that extend from 1 month to 24 months. The first panel presents the returns for the five
quintiles along with the difference between the quintile with the highest residual share issuance and
the quintile with the lowest residual share issuance. The t-statistics are adjusted following Newey-
West (1997) and the number of holding periods in months minus one is used as the lag as specified
in Pontiff (1996). The second panel presents other characteristics associated with the quintile
portfolios. BM is the natural logarithm of the ratio of the book value of equity to the market value of
equity measured at the end of previous December. ME is the natural logarithm of market equity
measured at the end of previous June. MOM is the equity returns for the past six months. ISSUE is
the annual logarithmic change in the number of shares outstanding adjusted for distribution events.
The return differences with significant t-statistics at the %95 and %90 levels are marked by (**) and
(*), respectively.
Residual Portfolio Difference
1 2 3 4 5 5-1
R1 0.05 0.04 0.04 0.04 0.04 -0.01
(4.44) (3.97) (4.15) (3.69) (3.84) (-1.03)
R3 0.16 0.13 0.14 0.14 0.14 -0.03
(4.37) (4.14) (4.22) (3.84) (3.86) (-1.58)
R6 0.34 0.29 0.30 0.32 0.26 -0.08
(4.29) (4.13) (4.18) (4.17) (3.79) (-2.03)**
R12 0.76 0.66 0.65 0.69 0.52 -0.25
(4.18) (4.06) (3.81) (3.75) (3.56) (-3.26)**
R24 0.81 0.65 0.63 0.67 0.50 -0.31
(4.06) (3.83) (3.67) (3.05) (3.04) (-3.71)**
Portfolio
1 2 3 4 5
ME 16.54 16.82 17.09 17.22 16.82
(51.80) (56.63) (56.83) (59.55) (67.50)
MOM 0.40 0.34 0.27 0.28 0.28
(4.84) (4.07) (3.76) (3.77) (3.64)
BM -0.56 -0.36 -0.58 -0.86 -1.56
(-4.63) (-4.46) (-8.08) (-9.48) (-14.82)
ISSUE -0.46 -0.16 -0.02 0.14 0.50
(-11.88) (-9.50) (-1.23) (7.49) (17.72)
23
Figure 1. Average Slope Coefficient for ISSUE
Figure 1 presents the time series of average slope coefficients on share issuance and the confidence interval
of these coefficients. First, we run multivariate regressions of annual expected returns on ISSUE, BM, ME
and MOM every month. Then, we compute the average slope coefficient for ISSUE over the past 12
months and construct the confidence intervals based on the standard error of these 12 coefficient estimates.
This procedure is repeated every month, giving us a rolling estimate for the slope coefficient of ISSUE and
its standard error. The period for which the trailing average slope coefficient for share issuance is negative
is shaded. BM is the natural logarithm of the ratio of the book value of equity to the market value of equity
measured at the end of the previous December. ME is the natural logarithm of market equity measured at
the end of the previous June. MOM is the equity returns for the past six months. ISSUE is the annual
logarithmic change in the number of shares outstanding adjusted for distribution events.
Recommended


