Final Report Prepared for Missouri Department of Transportation 2012 August Project TRyy1103 Report cmr 13-003
Self-Consolidating Concrete (SCC) for Infrastructure Elements
Report D – Creep, Shrinkage and Abrasion Resistance
Prepared By:

D-i
FINALReportD
TRyy1103
ProjectTitle:Self‐ConsolidatingConcrete(SCC)forInfrastructureElements
ReportD:Self‐ConsolidatingConcrete(SCC)forInfrastructureElements:Creep,ShrinkageandAbrasionResistance
Prepared for Missouri Department of Transportation
Construction and Materials
Missouri University of Science and Technology, Rolla, Missouri
July 2012 The opinions, findings, and conclusions expressed in this publication are those of the principal investigators and the Missouri Department of Transportation. They are not necessarily those of the U.S. Department of Transportation, Federal Highway Administration. This report does not constitute a standard or regulation .

D-ii

D-iii
ABSTRACT
Concrete specimens were fabricated for shrinkage, creep, and abrasion resistance
testing. Variations of self-consolidating concrete (SCC) and conventional concrete were
all tested. The results were compared to previous similar testing programs and used to
determine the adequacy of the materials for use in practice.
The testing program consisted of normal strength (6000 psi) and high strength
(10,000 psi) variations of SCC and conventional concrete.
All specimens were tested for compressive strength, modulus of elasticity,
shrinkage strain, creep strain, and abrasion resistance. All tests were performed
according to their respective ASTM standard methods. In general, SCC performed well
relative to conventional concrete at high strengths, but not as well at normal strengths for
shrinkage and creep.
D-iv
TABLE OF CONTENTS
Page
ABSTRACT ....................................................................................................................... iii
LIST OF ILLUSTRATIONS ............................................................................................ vii
LIST OF TABLES ............................................................................................................. ix
NOMENCLATURE ........................................................................................................... x
1. LITERATURE REVIEW ........................................................................................ 1
SECTION
1.1. SELF-CONSOLIDATING CONCRETE (SCC) ................................................ 1
1.1.1. Definition of SCC ..................................................................................... 1
1.1.2. Advantages of SCC .................................................................................. 1
1.2. SHRINKAGE OF CONCRETE ......................................................................... 1
1.2.1. Definition of Shrinkage ............................................................................ 1
1.2.2. Factors Affecting Shrinkage ..................................................................... 2
1.3. SHRINKAGE MODELS. ................................................................................... 4
1.3.1. ACI 209R-92 ............................................................................................ 4
1.3.2. NCHRP Report 496 (2003) ...................................................................... 8
1.3.3. Model B3 ................................................................................................ 10
1.3.4. CEB-FIP 90 ............................................................................................ 11
1.3.5. GL 2000 .................................................................................................. 12
1.4. SCC SHRINKAGE RESEARCH ..................................................................... 13
1.4.1. NCHRP Report 628 (2009) .................................................................... 14
1.4.2. Shindler, et. al. ........................................................................................ 14
1.4.3. Fernandez-Gomez and Landsberger ....................................................... 15
1.4.4. Long, et. al. ............................................................................................. 15
1.5. CREEP OF CONCRETE .................................................................................. 16
1.5.1. Definition of Creep ................................................................................. 16
1.5.2. Factors Affecting Creep ......................................................................... 17
1.6. CREEP MODELS ............................................................................................. 18
1.6.1. ACI 209R-92 .......................................................................................... 18

D-v
1.6.2. NCHRP Report 496 ................................................................................ 20
1.6.3. CEB-FIP 90 ............................................................................................ 21
1.6.4. GL 2000 .................................................................................................. 22
1.7. SCC CREEP RESEARCH ................................................................................ 23
1.7.1. NCHRP Report 628 ................................................................................ 23
1.7.2. Long and Khayat .................................................................................... 24
1.7.3. Long, et. el. ............................................................................................. 24
1.8. Application of Shrinkage and Creep ................................................................. 24
1.8.1. Prestress Loss ......................................................................................... 24
1.8.2. Load Effects ........................................................................................... 26
1.8.3. Beam Deflection ..................................................................................... 26
1.9. CONCRETE ABRASION ................................................................................ 27
1.9.1. Definition of Concrete Abrasion ............................................................ 27
1.9.2. Factors Affecting Concrete Abrasion ..................................................... 27
1.10. SCC ABRASION RESEARCH ...................................................................... 27
2. RESEARCH PROGRAM ..................................................................................... 28
2.1. MIX DESIGNS ................................................................................................. 28
2.1.1. SCC.. ...................................................................................................... 28
2.2. SHRINKAGE AND CREEP SPECIMEN CONSTRUCTION ........................ 29
2.2.1. Shrinkage and Creep Specimens ............................................................ 29
2.2.2. Shrinkage and Creep Molds ................................................................... 30
2.2.3. Shrinkage and Creep Specimen Casting ................................................ 31
2.2.4. Shrinkage and Creep De-Molding and Preparation ............................... 31
2.2.5. Shrinkage and Creep Data Acquisition .................................................. 31
2.3. ABRASION SPECIMEN CONSTRUCTION ................................................. 32
2.4. TESTING PROCEDURES ............................................................................... 33
2.4.1. Shrinkage Testing Procedures ................................................................ 33
2.4.2. Creep Testing Procedures ....................................................................... 36
2.4.3. Abrasion Resistance Testing Procedures ............................................... 39
3. SCC RESULTS AND DISCUSSION ................................................................... 43
3.1. SHRINKAGE ................................................................................................... 43

D-vi
3.1.1. Results .................................................................................................... 43
3.1.2. Discussion and Conclusions ................................................................... 43
3.2. CREEP .............................................................................................................. 52
3.2.1. Results .................................................................................................... 52
3.2.2. Discussion and Conclusions ................................................................... 53
3.3. ABRASION RESISTANCE ............................................................................. 57
3.3.1. Results .................................................................................................... 57
3.3.2. Discussion and Conclusions ................................................................... 60
APPENDICES
A. SHRINKAGE WITH RELATIVE HUMIDITY DATA ...................................... 62
B. EXAMPLE STRAIN CALCULATIONS ............................................................ 67
C. COEFFICIENT OF VARIATION DATA ........................................................... 70
BIBLIOGRAPHY ............................................................................................................. 73

D-vii
LIST OF ILLUSTRATIONS
Figure Page
Figure 1.1 - Relationship Between Moist Cure Time and Shrinkage Strain ...................... 3
Figure 1.2 - Stress vs. Time for Prestressed Bridge Girder (Tadros et. al. 2003) ............. 25
Figure 2.1 - Shrinkage and Creep Form............................................................................ 30
Figure 2.2 – Shrinkage and Creep Specimens and DEMEC Point Arrangement (Myers
and Yang, 2005) ......................................................................................................... 32
Figure 2.3 – DEMEC Reading Taken on Specimen ......................................................... 34
Figure 2.4 - Reference Bar ................................................................................................ 34
Figure 2.5 - Reading Taken on Reference Bar ................................................................. 35
Figure 2.6 - Gauge Factor Used for Shrinkage and Creep Calculations ........................... 35
Figure 2.7 - Example DEMEC Gauge Reading ................................................................ 35
Figure 2.8 - Schematic of Creep Loading Frame (Myers and Yang, 2005) ..................... 36
Figure 2.9 - Creep Loading Frame with Specimen ........................................................... 37
Figure 2.10 - Reading Taken on Creep Specimen ............................................................ 38
Figure 2.11 - Schematic of Abrasion Rotating Cutter (ASTM C944) .............................. 40
Figure 2.12 - Rotating Cutter ............................................................................................ 40
Figure 2.13 - Abrasion Resistance Test In Progress ......................................................... 41
Figure 2.14 - Depth of Wear Measurement Points ........................................................... 41
Figure 2.15 - Abrasion Resistance Specimen After Testing ............................................. 42
Figure 3.1 - C6-58L Shrinkage Results and Prediction Models ....................................... 46
Figure 3.2 - S6-48L Shrinkage Results and Prediction Models ........................................ 47
Figure 3.3 - C10-58L Shrinkage Results and Prediction Models ..................................... 48
Figure 3.4 - S10-58L Shrinkage Results and Prediction Models ..................................... 49
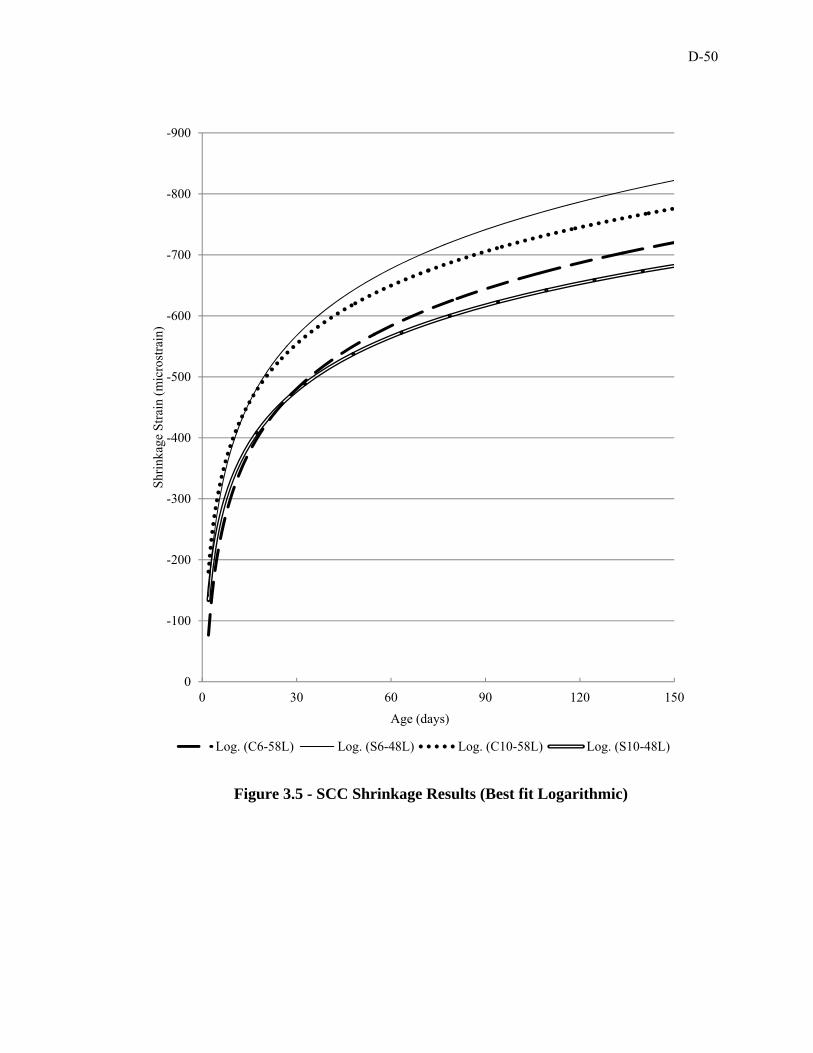
Figure 3.5 - SCC Shrinkage Results (Best fit Logarithmic) ............................................. 50
Figure 3.6 – SCC Results with Shrinkage Databases (Fernandez-Gomez, Shindler et. al.,
and Holshemacher) ..................................................................................................... 51
Figure 3.7 – SCC Coefficient of Creep Results ................................................................ 54
Figure 3.8 – S6-48L Plotted Against Results from Long and Khayat (2011) ................. 55
Figure 3.9 – S10-48L Plotted Against Results from Long and Khayat (2011) ................ 56

D-viii
Figure 3.10 - C6-58L Mass Loss Results.......................................................................... 57
Figure 3.11 - S6-48L Mass Loss Results .......................................................................... 58
Figure 3.12 - C10-58L Mass Loss Results........................................................................ 58
Figure 3.13 - S10-48L Mass Loss Results ........................................................................ 59
Figure 3.14 - SCC Mass Loss Results .............................................................................. 59
Figure 3.15 - SCC Depth of Wear Results ........................................................................ 60
Figure A.1 – C6-58L shrinkage data shown with recorded relative humidity .................. 63
Figure A.2 - S6-48L shrinkage data shown with recorded relative humidity ................... 64
Figure A.3 – C10-58L shrinkage data shown with recorded relative humidity ................ 65
Figure A.4 – S10-48L shrinkage data shown with recorded relative humidity ................ 66
Figure B.1 – Example shrinkage and creep strain calculation .......................................... 68
Figure B.2 – Example shrinkage and creep strain calculations with equations shown .... 69
Figure C.1 – C6-58L and S6-48L COV Data ................................................................... 71
Figure C.2 – C10-58L and S10-48L COV Data ............................................................... 72
D-ix
LIST OF TABLES
Table Page
Table 1.1 - Standard Conditions as Defined by ACI 209R-92 .......................................... 6
Table 1.2 – Coded Values for Eqs. 1.48 – 1.49 ................................................................ 16
Table 2.1 - SCC Test Program Mix Designs and mechanical properties ......................... 29
Table 3.1 – SCC results compared to Eqs. 2.48 – 2.49 by Long et. al. ............................ 52
Table 3.2 - Summary of SCC Creep Results .................................................................... 52
Table 3.3 - Summary of Results Shown with 28 Day Measured Compressive Strength . 60

D-x
NOMENCLATURE
Symbol Description
A Cement type correction factor (NCHRP 628)
Ac Cross-section area (mm2) (CEB-FIP 90)
c Cement content (lb/yd3) (ACI 209R-92)
D Effective cross-section thickness (Model B3)
D0 Datum reading on the reference bar
Di Subsequent reading on the reference bar
f Size effects factor (ACI 209R-92)
f’c Tested compressive strength of concrete (psi, ksi, MPa)
f’ci Specified compressive strength of concrete (ksi) (NCHRP 496)
fcm Tested compressive strength of concrete at 28 days age (psi, ksi, MPa)
(CEB-FIP 90)
G Gauge factor
H Relative humidity (% or decimal)
K Cement type correction factor (GL 2000)
kf Concrete strength factor (NCHRP 496)
khc Humidity factor (NCHRP 496)
khs Humidity factor (NCHRP 496 and NCHRP 628)
kla Loading factor (NCHRP 496)
ks Size factor (NCHRP 496 and NCHRP 628) or Cross-section shape factor
(Model B3)
ktd Time development factor (NCHRP 496)
D-xi
R0 Datum reading on tested material
RH Relative humidity (%) (CEB-FIP 90)
Ri Subsequent reading on tested material
s Slump of fresh concrete (in)
S(t) Time dependence factor (Model B3)
t Age of concrete (days)
t0 Age of concrete when drying begins (days) (Model B3)
or Age at which creep specimen is loaded (days) (ACI 209R-92
and CEB FIP 90)
tc Age of concrete when drying begins (days) (ACI 209R-92
and GL 2000)
ti Age at which creep specimen is loaded (days) (NCHRP 496)
ts Age of concrete at the beginning of shrinkage (days) (CEB-FIP 90)
u Perimeter in contact with the atmosphere (mm) (CEB-FIP 90)
V/S Volume to Surface area ratio (in or mm)
w Water content of concrete (lb/ft3)
α Concrete air content (%)
α1 Cement type correction factor (Model B3)
α2 Curing condition correction factor
β(h) Humidity correction factor (GL 2000)
β(t) Time effect correction factor (GL 2000)
βc Coefficient to describe the development of creep with time after loading
(CEB FIP 90)

D-xii
βRH Relative humidity correction factor (CEB-FIP 90)
βs Coefficient to describe the development of shrinkage with time
(CEB-FIP 90)
βsc Concrete type correction factor (CEB-FIP 90)
γc,RH Humidity correction factor (ACI 209R-92)
γc,s Slump correction factor (ACI 209R-92)
γc,t0 Curing condition correction factor (ACI 209R-92)
γc,vs Size correction factor (ACI 209R-92)
γc,α Air content correction factor (ACI 209R-92)
γc,ψ Fine aggregate correction factor (ACI 209R-92)
γsh,c Cement content correction factor (ACI 209R-92)
γsh,RH Relative humidity correction factor (ACI 209R-92)
γsh,s Slump correction factor (ACI 209R-92)
γsh,tc Initial moist cure duration correction factor (ACI 209R-92)
sh,vs Volume/surface area correction factor (ACI 209R-92)
γsh,α Air content correction factor (ACI 209R-92)
γsh,ψ Fine aggregate correction factor (ACI 209R-92)
Δεc Change in creep strain from one reading to the next
Δεs Change in shrinkage strain from one reading to the next
εcso Notional shrinkage coefficient (CEB-FIP 90)
εes(t,ts) Calculated ultimate shrinkage strain (µε) (CEB-FIP 90)
εi Measured strain due to initial loading of creep specimen
εes(t,t0) Calculated shrinkage strain at a given age (µε) (Model B3)
D-xiii
εsh Calculated shrinkage strain at a given age (µε) (NCHRP 496,
GL 2000, and NCHRP 628)
εsh(t,tc) Calculated shrinkage strain at a given age (µε) (ACI 209R-92)
εshu Calculated ultimate shrinkage strain (µε) (ACI 209R-92)
or Notional ultimate shrinkage strain (GL 2000)
εsh∞ Calculated ultimate shrinkage strain (µε) (Model B3)
εt Measured creep strain at a given age
λΔ Multiplier for additional deflection due to long-term effects
(ACI 318-08)
ξ Time dependant factor for sustained load (ACI 318-08)
ρ’ Compression reinforcement ratio (ACI 318-08)
τsh Size dependence factor (Model B3)
Φ(t,t0) Calculated creep coefficient at a given age (ACI 209R-92
and CEB FIP 90) or Measured creep coefficient at a given age
Φ0 Notional creep coefficient (CEB FIP 90)
Φ28 Calculated creep coefficient at a given age (GL 2000)
Φ(tc) Factor that takes into account drying before loading (GL 2000)
Φu Calculated ultimate creep coefficient (ACI 209R-92)
Ψ Ratio of fine aggregate to total aggregate by weight (%)
Ψ(t,ti) Calculated creep coefficient at a given age (NCHRP 496
and NCHRP 628)
1. LITERATURE REVIEW
1.1. SELF-CONSOLIDATING CONCRETE (SCC)
1.1.1. Definition of SCC. ACI 237R-07 defines self-consolidating concrete as
“highly flowable, nonsegregating concrete that can spread into place, fill the formwork,
and encapsulate the reinforcement without any mechanical consolidation.” In order to
achieve the necessary fluidity, a high range water reducer (HRWR) is often utilized.
1.1.2. Advantages of SCC. The choice of SCC over conventional concrete
results in both economical and material performance benefits. The use of SCC eliminates
the necessity of manual compaction, typically achieved by vibration. The self-leveling
properties of SCC additionally reduce or eliminate the need for screeding operations to
achieve a flat surface. This reduction in jobsite labor and equipment forces, along with
the time saved by not having to perform these labor intensive operations, lead to
significant savings. Because of its fluidity, SCC has the ability to effectively flow into
areas that conventional concrete cannot. SCC is therefore ideal for construction of
members with significant reinforcement congestion or unusually shaped members. This
allows for greater freedom in member design and reinforcement detailing. Finally, the
reduction in honeycombing is beneficial both structurally and aesthetically (ACI 237R-
07).
1.2. SHRINKAGE OF CONCRETE
1.2.1. Definition of Shrinkage. Shrinkage of concrete is the decrease in
volume of hardened concrete with time. Shrinkage is expressed as the strain measured on
a load-free specimen, most often as the dimensionless unit microstrain (strain x10-6).
D-2
Concrete experiences shrinkage in three ways, drying shrinkage, autogenous (chemical)
shrinkage, and carbonation shrinkage. Autogenous shrinkage is due strictly to the
hydration reactions of the cement. Drying shrinkage is the strain imposed on a specimen
exposed to the atmosphere and allowed to dry. Carbonation shrinkage is caused by the
reaction of calcium hydroxide with cement with carbon dioxide in the atmosphere. The
magnitude and rate of shrinkage is dependent on a number of factors. These factors are
accounted for and described in the various industry models and research projects in the
following sections.
1.2.2. Factors Affecting Shrinkage (ACI 209.1R-05). Shrinkage of concrete is
closely related to shrinkage of paste. Therefore the amount of paste in the mix
significantly affects the level of concrete shrinkage. Paste volume is determined by the
quantity, size, and gradation of aggregate. Because paste volume is largely dependent on
aggregate properties, the most important factor in determining a concrete’s shrinkage
level is the aggregate used in the mix. Similarly, the water content, cement content, and
slump will affect the shrinkage of concrete. These three factors are indications of the
paste volume and therefore can be used to determine the shrinkage potential of a mix.
Aggregate acts as a restraining force to shrinkage, therefore an aggregate with a higher
modulus of elasticity (MOE) will better restrain against shrinkage than an aggregate with
a lower MOE. The characteristics of the cement itself are other significant indicators of
shrinkage potential. Research has shown cements with low sulfate content, high alumina
content, and cements that are finely ground exhibit increased shrinkage.
The environment which the concrete is exposed to can also influence shrinkage.
The biggest environmental factor is the relative humidity of the surrounding air. As

D-3
shown by Eq. 1.1, as relative humidity increases, shrinkage decreases due to the decrease
in potential moisture loss. It has also been shown that an increase in temperature
increases the ultimate shrinkage of concrete.
shrinkage ∝ 1 (1.1)
Where: h is relative humidity in percent, and b is a constant that ranges from 1 to 4.
Finally, the design and construction of concrete specimens can influence shrinkage. The
curing conditions experienced by the concrete have a significant effect on shrinkage.
Generally, the longer the specimen is allowed to moist cure, the less it will shrink.
However, research conducted by Perenchio (1997), Figure 1.1, shows that there may not
be a simple relationship between moist cure time and shrinkage.
Figure 1.1 - Relationship Between Moist Cure Time and Shrinkage Strain
0
100
200
300
400
500
600
700
1 10 100 1000 10000
Dry
ing
shri
nkag
e af
ter
1 ye
ar, m
icro
stra
in
Initial moist curing period, hours
0.4
0.5
0.6
w/c ratio

D-4
(adapted from Perenchio 1997)
Larger members tend to dry slower, so the ratio of volume to surface area is a
significant factor in shrinkage of concrete.
shrinkage ∝ (1.2)
Where: V/S is the volume to surface area ratio in inches.
1.3. SHRINKAGE MODELS.
The ability to accurately predict the shrinkage of a concrete structure is extremely
important. An accurate model for shrinkage will allow the engineer to predict long term
serviceability, durability, and stability of a given structure. As mentioned above, there
are many different factors that affect a concrete’s susceptibility to shrinkage. Because of
these factors, accurate prediction of shrinkage is very difficult. The models described
below take into account many of the factors described above in their attempt to predict
concrete shrinkage (Bazant and Baweja, 2000).
1.3.1. ACI 209R-92. This model, developed by Branson and Christiason
(1971) and modified by ACI committee 209, predicts shrinkage strain of concrete at a
given age under standard conditions. The original model by Branson and Christiason was
developed based on a best fit from a sample of 95 shrinkage specimens and using an
ultimate shrinkage strain of 800x10-6 in./in. (mm/mm). However, subsequent research by
Branson and Chen, based on a sample of 356 shrinkage data points, concluded that the

D-5
ultimate shrinkage strain should be 780x10-6 in./in. (mm/mm). The prediction model,
Eq. 1.3 – 1.5, apply only to the standard conditions as shown in Table 1.1.
ε t, t
ϵ (µε) (1.3)
ε 780 10 (µε) (1.4)
f 26.0e . / (1.5)
Where: f is 35 (moist cure) or 55 (steam cure), or by Eq. 1.5 if size effects are to be
considered, α is assumed to be 1, t is the age of concrete it days, and tc is the age of
concrete when drying begins in days.

D-6
Table 1.1 - Standard Conditions as Defined by ACI 209R-92
When concrete is not subject to any or all of the standard conditions, correction
factors shall be applied, as shown in Eq. 1.6 – 1.16.
ε t, t ε (µε) (1.6)
f 26.0e . ⁄ (1.7)
Factors Variables Standard
Concrete
Concrete Composition
Cement Paste Content Type of Cement Type I or IIIW/C Slump 2.7 in (70mm)Mix Proportions Air Content ≤ 6%
Aggregate Characteristics
Fine Aggregate % 50%
Degree of Compaction Cement Content 470 to 752 lb/yd3
(279 to 446 kg/m3)
Initial Curing
Length of Initial CuringMoist Cured 7 daysSteam Cured 1 - 3 days
Curing Temperature Moist Cured
73.4 ± 4°F (23 ± 2°C)
Steam Cured ≤212°F (≤100°C)
Curing Humidity Relative Humidity ≥95%
Member Geometry & Environment
Environment
Concrete Temperature Concrete Temperate 73.4°F ± 4°F (23 ± 2°C)
Concrete Water Content
Ambient Relative Humidity
40%
Geometry Size and Shape Volume-Surface Ratio (V/S)
V/S = 1.5 in (38mm)
Minimum Thickness 6 in (150mm)

D-7
ε 780γ 10 (µε) (1.8)
γ γ , γ , γ , γ , γ , γ , γ , (1.9)
γ , 1.202 .2337log t (1.10)
γ ,1.40 1.02hfor0.40 h 0.803.00 3.0hfor0.80 h 1
(1.11)
γ , 1.2e . ⁄ (1.12)
γ , 0.89 0.041s (1.13)
γ ,0.30 0.014ψforψ 50%0.90 0.002ψforψ 50% (1.14)
γ , 0.75 0.00036c (1.15)
γ , 0.95 0.008α 1 (1.16)
Where: εsh(t,tc) is the calculated shrinkage strain at a given age, εshu is the calculated
ultimate shrinkage strain, γsh,tc is the initial moist cure duration correction factor, t is the
age of concrete in days, tc is the age of concrete when drying starts in days, γsh,RH is the

D-8
relative humidity correction factor, h is humidity in decimals, γsh,vs is the volume/surface
area correction factor, where V/S is the volume to surface area ratio in inches, γsh,s is the
slump correction factor, s is slump in inches, γsh,ψ is the fine aggregate correction factor,
ψ is the ratio of fine aggregate to total aggregate by weight expressed as percentage, γsh,c
is the cement content correction factor, c is the cement content in lb/yd3, γsh,α is the air
content correction factor, and α is the air content in percent. In Eq 1.6, the value of α can
be assumed to be equal to 1, with f assumed to be equal to 35 for concrete that is moist
cured for seven days or 55 for concrete subject to 1-3 days of steam curing. In order to
totally consider shape and size effects, α is still assumed to be equal to 1, with f given by
Eq. 1.7.
1.3.2. NCHRP Report 496 (2003). The National Cooperative Highway Research
Program (NCHRP) conducted research on shrinkage of high strength concrete in the
states of Nebraska, New Hampshire, Texas, and Washington. This research project was
sponsored by the American Association of State Highway and Transportation Officials
(AASHTO) and the results adopted into the 2007 AASHTO LRFD Bridge Design
Specifications. Laboratory shrinkage data was obtained from three 4 in. (101.6 mm) by 4
in. (101.6 mm) by 24 in. (609.6 mm) specimens per mix, with a total of 48 specimens
tested including both normal and high strength concrete. Field specimens were also made
and cured in the same condition as corresponding bridge girders in each of the four
participating states. The field program consisted of a set of three 4 in. (101.6 mm) by 4
in. (101.6 mm) by 24 in. (609.6 mm) shrinkage specimens at each location with
measurements taken for 3 months. The data showed that an ultimate shrinkage strain of
480x10-6 in./in. (mm/mm) should be assumed. The modification factors in the model
D-9
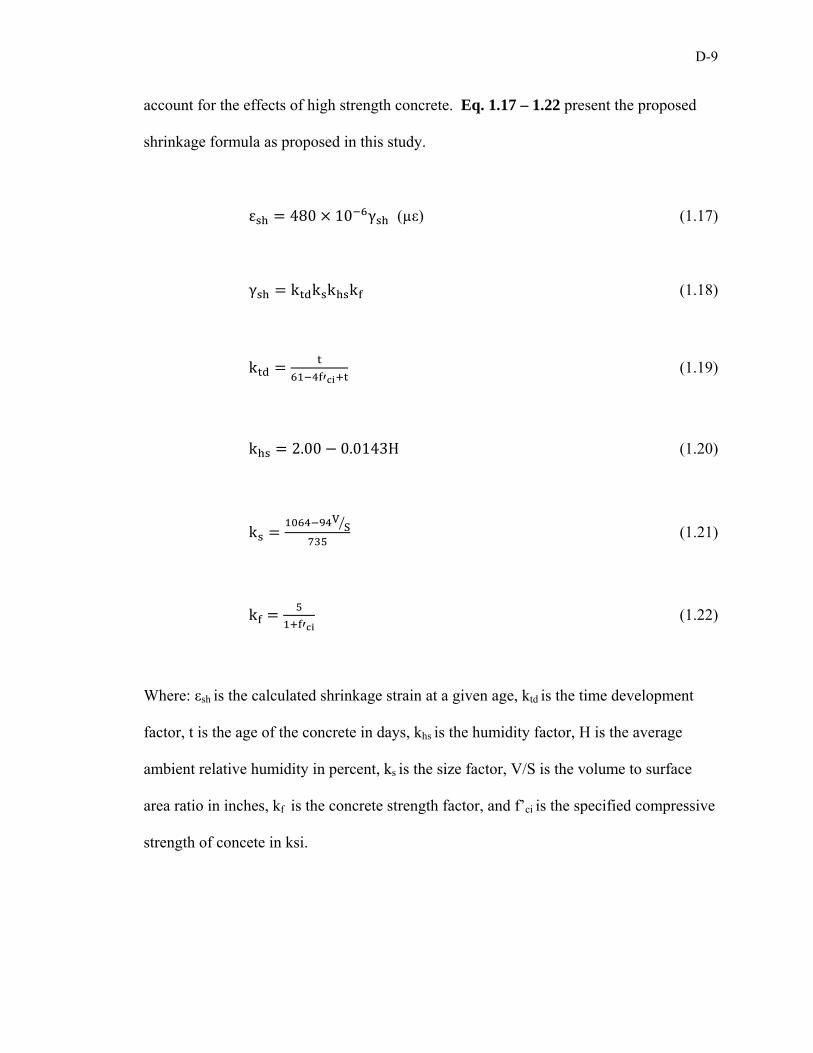
account for the effects of high strength concrete. Eq. 1.17 – 1.22 present the proposed
shrinkage formula as proposed in this study.
ε 480 10 γ (µε) (1.17)
γ k k k k (1.18)
k (1.19)
k 2.00 0.0143H (1.20)
k (1.21)
k (1.22)
Where: εsh is the calculated shrinkage strain at a given age, ktd is the time development
factor, t is the age of the concrete in days, khs is the humidity factor, H is the average
ambient relative humidity in percent, ks is the size factor, V/S is the volume to surface
area ratio in inches, kf is the concrete strength factor, and f’ci is the specified compressive
strength of concete in ksi.
D-10
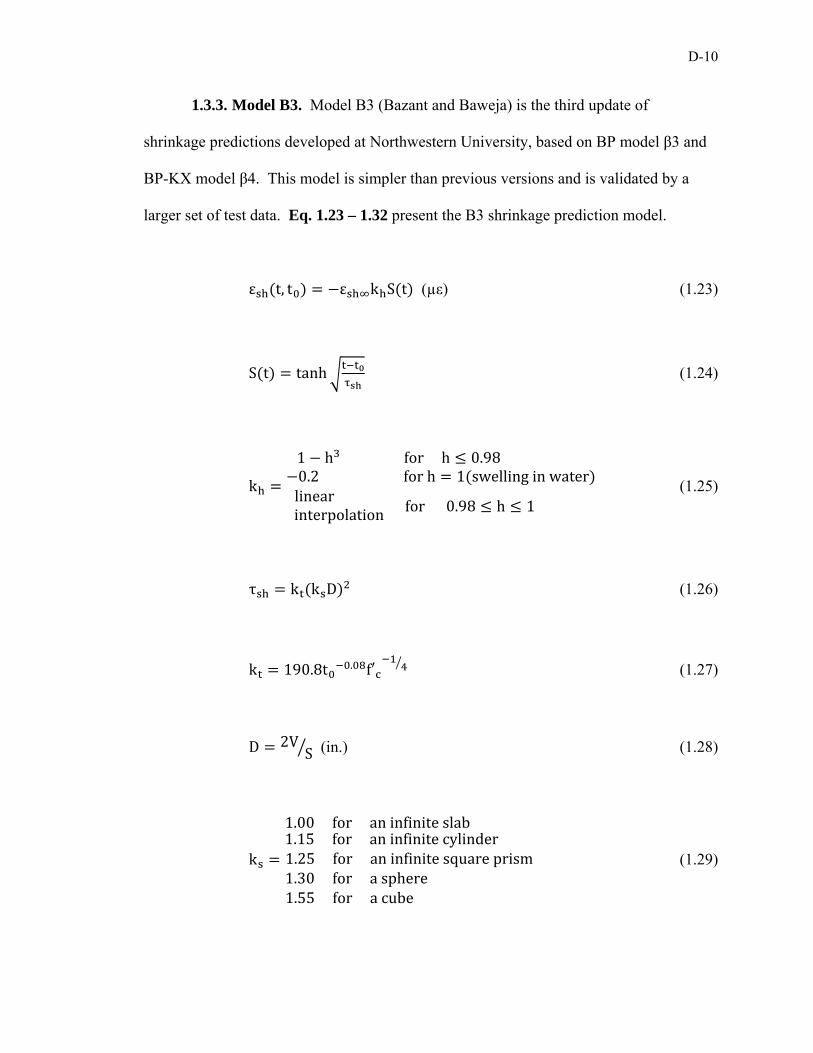
1.3.3. Model B3. Model B3 (Bazant and Baweja) is the third update of
shrinkage predictions developed at Northwestern University, based on BP model β3 and
BP-KX model β4. This model is simpler than previous versions and is validated by a
larger set of test data. Eq. 1.23 – 1.32 present the B3 shrinkage prediction model.
ε t, t ε k S t (µε) (1.23)
S t tanh (1.24)
k
1 h forh 0.980.2forh 1 swellinginwater linearinterpolationfor0.98 h 1
(1.25)
τ k k D (1.26)
k 190.8t . f′ (1.27)
D 2VS (in.) (1.28)
k
1.00foraninfiniteslab1.15foraninfinitecylinder1.25foraninfinitesquareprism1.30forasphere1.55foracube
(1.29)

D-11
ε 26 . ′ . 270 (µε) (1.30)
α1.0fortypeIcement0.85fortypeIIcement1.1fortypeIIIcement
(1.31)
α
0.75forsteam curing
1.2forsealedornormalcuringinairwithinitialprotectionagainstdrying
1.0forcuringinwaterorat100%relativehumidity
(1.32)
Where: εshu(t,t0) is the calculated shrinkage strain at a given age, S(t) is the time
dependence factor, t is the age of concrete in days, t0 is the age of concrete at which
drying begins, τsh is the size dependence factor, f’c is the cylinder compressive strength in
psi, D is the effective cross-section thickness, V/S is the volume to surface area ratio in
inches, ks is the cross-section shape factor, εsh∞ is the calculated ultimate shrinkage strain,
α1 is the cement type correction factor, α2 is the curing condition correction factor, and w
is the water content of the concrete in lb/ft3.
1.3.4. CEB-FIP 90. This model, developed jointly by Euro-International
Concrete Committee (CEB – Comité Euro-International du Béton) and the International
Federation for Prestressing (FIP – Fédération Internationale de la Précontrainte) is found
in the CEB-FIP Model Code 1990. It is stated that due to its international character, the
code is more general than most and does not apply to any particular structure type. Eq.
1.33 – 1.38 present this model for calculating shrinkage strain.
, ε β t t (µε) (1.33)

D-12
ε ε f β (1.34)
β t t (1.35)
ε f 160 10β 9 0.1f 10 (1.36)
β 1.55 1 100 (1.37)
β4forslowlyhardeningcements5fornormalorrapidhardeningcements8forrapidhardeninghighstrengthcements
(1.38)
Where: εes(t,ts) is the calculated ultimate shrinkage strain, εcso is the notional shrinkage
coefficient, βs is the coefficient to describe the development of shrinkage with time, t is
the age of concrete in days, ts is the age of concrete at the beginning of shrinkage in days,
Ac is the cross section area in mm2, u is the perimeter in contact with the atmosphere in
mm, fcm is the compressive strength of concrete at age of 28 days in MPa, βRH is the
relative humidity correction factor, RH is the relative humidity in percent, and βsc is the
concrete type correction factor.
1.3.5. GL 2000. This model, developed by Gardener and Lockman was
published in the ACI materials journal under the title “Design provisions for drying
shrinkage and Creep of Normal-Strength Concrete.” The model developed is shown in
Eq. 1.39 – 1.43.

D-13
ε ε β h β t (µε) (1.39)
ε 1000K 10 (µε) (1.40)
β h 1 1.18h (1.41)
β t. ⁄
(1.42)
K1fortypeIcement0.75fortypeIIcement1.15fortypeIIIcement
(1.43)
Where: εsh is the calculated shrinkage strain at a given age, εshu is the notional ultimate
shrinkage strain, β(h) is the humidity correction factor, h is humidity in decimals, β(t) is
the correction factor for the effect of time on shrinkage, tc is the age that drying has
commenced in days, t is age of concrete in days, V/S is the volume to surface area ratio,
and K is the cement type correction factor.
1.4. SCC SHRINKAGE RESEARCH
A number of shrinkage models have been developed which are formulated specifically
for self consolidating concrete. The sections to follow present some shrinkage models
that apply to SCC.
D-14
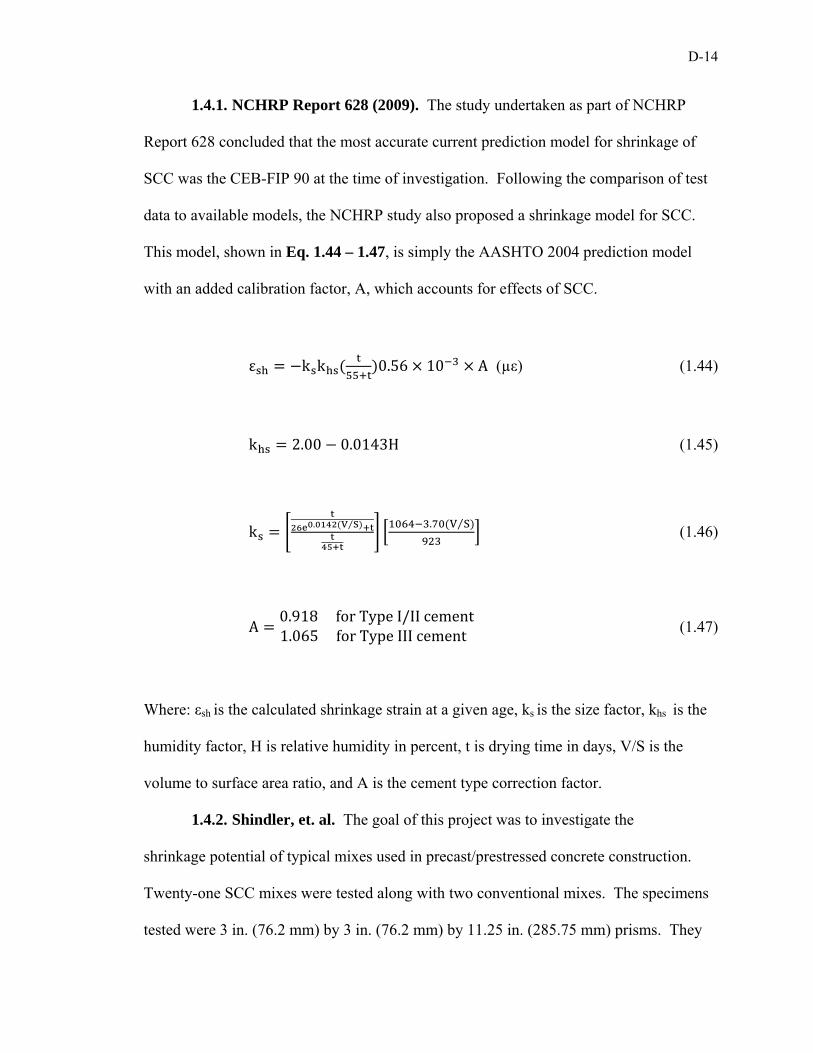
1.4.1. NCHRP Report 628 (2009). The study undertaken as part of NCHRP
Report 628 concluded that the most accurate current prediction model for shrinkage of
SCC was the CEB-FIP 90 at the time of investigation. Following the comparison of test
data to available models, the NCHRP study also proposed a shrinkage model for SCC.
This model, shown in Eq. 1.44 – 1.47, is simply the AASHTO 2004 prediction model
with an added calibration factor, A, which accounts for effects of SCC.
ε k k 0.56 10 A (µε) (1.44)
k 2.00 0.0143H (1.45)
k. ⁄ . ⁄
(1.46)
A0.918forTypeI/IIcement1.065forTypeIIIcement (1.47)
Where: εsh is the calculated shrinkage strain at a given age, ks is the size factor, khs is the
humidity factor, H is relative humidity in percent, t is drying time in days, V/S is the
volume to surface area ratio, and A is the cement type correction factor.
1.4.2. Shindler, et. al. The goal of this project was to investigate the
shrinkage potential of typical mixes used in precast/prestressed concrete construction.
Twenty-one SCC mixes were tested along with two conventional mixes. The specimens
tested were 3 in. (76.2 mm) by 3 in. (76.2 mm) by 11.25 in. (285.75 mm) prisms. They
D-15
were cured in a lime bath for seven days prior to drying. The results suggest very little
difference in 28 day shrinkage between the SCC and conventional mixes. At 112 days,
the SCC mixes performed better on average than the conventional mixes.
1.4.3. Fernandez-Gomez and Landsberger. Experimental shrinkage results
were gathered from 25 published investigations. The database compiled included results
from 93 SCC mixes and 30 conventional concrete (CC) mixes. The results were
analyzed in order to determine which shrinkage model best fit the data. The models
analyzed were CEB-FIP 90, ACI 209, B3, GL 2000, and the Spanish EHE model. The
Spanish EHE model is based on the CEB-FIP 90 model; however, it doesn’t include the
factor accounting for cement type. The data was also analyzed to determine which
material or mix parameters most influenced shrinkage strain. It was concluded that,
based on three statistical models (best-fit line, residual analysis, and coefficient of
variation), the B3 and ACI 209 models best predicted shrinkage results for both SCC and
CC.
1.4.4. Long, et. al. The goal of this study was to develop equations to predict
mechanical properties, workability, and visco-elastic properties of SCC. This was
accomplished by evaluating 16 different SCC mixes and determining the key parameters
which effect the desired properties. The parameters evaluated were the binder content,
binder type, w/c, viscosity modifying admixture (VMA) content, and sand to aggregate
ratio (S/A). Using statistical analysis of the data obtained, the following equations were
developed. The variables in the equations are defined according to Table 1.2.
D-16
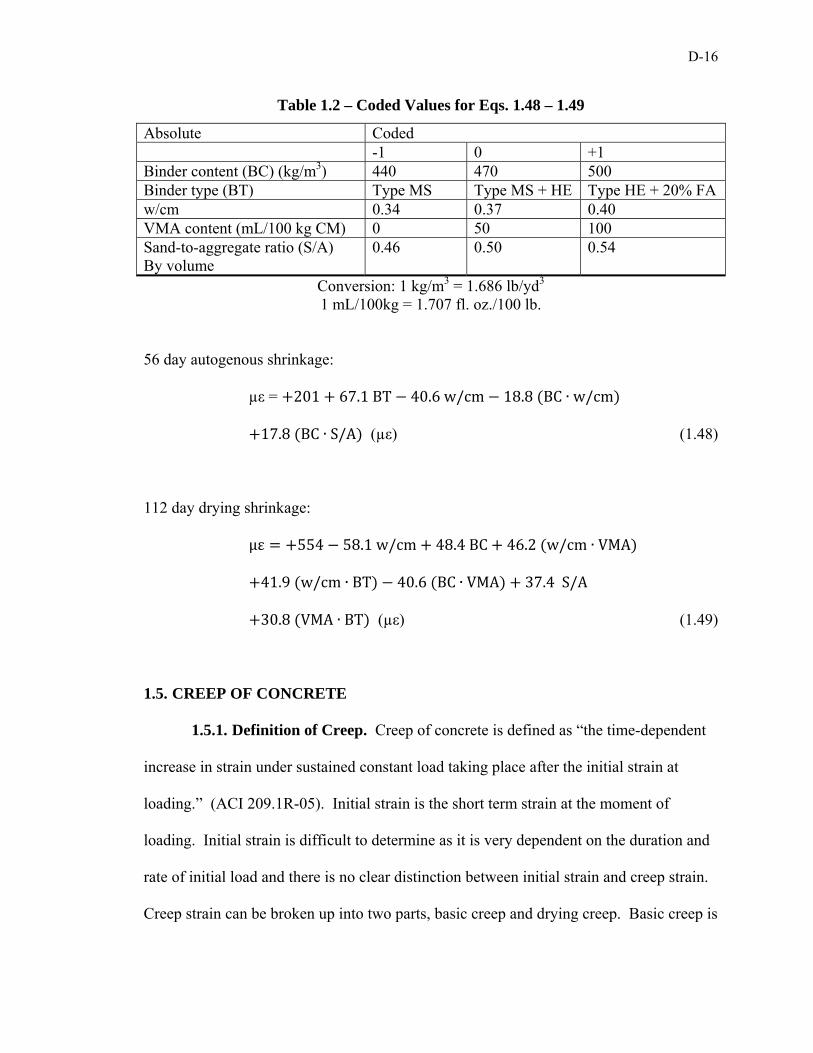
Table 1.2 – Coded Values for Eqs. 1.48 – 1.49
Absolute Coded -1 0 +1 Binder content (BC) (kg/m3) 440 470 500 Binder type (BT) Type MS Type MS + HE Type HE + 20% FA w/cm 0.34 0.37 0.40 VMA content (mL/100 kg CM) 0 50 100 Sand-to-aggregate ratio (S/A) By volume
0.46 0.50 0.54
Conversion: 1 kg/m3 = 1.686 lb/yd3
1 mL/100kg = 1.707 fl. oz./100 lb.
56 day autogenous shrinkage:
µε = 201 67.1BT 40.6w/cm 18.8 BC ∙ w/cm (1.22)
17.8 BC ∙ S/A (µε) (1.48)
112 day drying shrinkage:
με 554 58.1w/cm 48.4BC 46.2 w/cm ∙ VMA (1.22)
41.9 w/cm ∙ BT 40.6 BC ∙ VMA 37.4S/A (1.22)
30.8 VMA ∙ BT (µε) (1.49)
1.5. CREEP OF CONCRETE
1.5.1. Definition of Creep. Creep of concrete is defined as “the time-dependent
increase in strain under sustained constant load taking place after the initial strain at
loading.” (ACI 209.1R-05). Initial strain is the short term strain at the moment of
loading. Initial strain is difficult to determine as it is very dependent on the duration and
rate of initial load and there is no clear distinction between initial strain and creep strain.
Creep strain can be broken up into two parts, basic creep and drying creep. Basic creep is

D-17
“the increase in strain under sustained constant load of a concrete specimen in which
moisture losses or gains are prevented.” Even after 30 years of measurement on sealed
concrete specimens, it had yet to be determined if basic creep approaches an ultimate
value. Drying creep is the additional creep occurring in a specimen exposed to the
environment and allowed to dry. The effects of creep can be expressed in three ways.
The first is similar to that of shrinkage, where creep strain is simply expressed in terms of
microstrain (strain x10-6). The second way is called the creep coefficient. The creep
coefficient is the ratio of creep strain to the initial strain at loading. The third is specific
creep. Specific creep is the ratio of microstrain to applied load (psi).
1.5.2. Factors Affecting Creep. Like shrinkage, creep is affected by
numerous material, mix design, environmental, and construction related factors. Similar
to shrinkage, the amount, size, gradation, and properties of the aggregate are very
influential on creep of concrete. An increase in aggregate volume will decrease creep.
Aggregate gradation is believed to influence creep of concrete because of its relation to
changes in overall aggregate volume. The size of aggregate affects bond between paste
and aggregate, which controls stress concentration and microcracking. Unlike shrinkage,
which is primarily affected by properties of the paste, creep is very dependent on the
elastic properties of the aggregate. Concretes with aggregate that have a lower modulus
of elasticity generally have higher creep. The primary environmental factor in creep is
relative humidity. As relative humidity increases, drying creep significantly decreases.
Specimens in environments where drying cannot occur may have only one quarter of the
creep of concrete which is allowed to dry. The effects of construction and design on
creep are slightly different than shrinkage. One similarity is that increased curing time
D-18
will decrease creep strain. Unlike shrinkage, basic creep is not affected by the size and
shape of the member. The factor that most affects creep is the load applied to the
specimen. The magnitude of the load, and the age at which the load is first applied are
very important. Loads up to 0.40f’c are considered to be linearly related to creep.
Finally, concrete loaded at later ages has lower creep.
1.6. CREEP MODELS
As with shrinkage, considerable research has been done and models developed to predict
the creep potential of concrete. The following sections will present various models for
calculating creep. This includes industry models developed for use with conventional
concrete as well as models developed specifically for self-consolidating concrete.
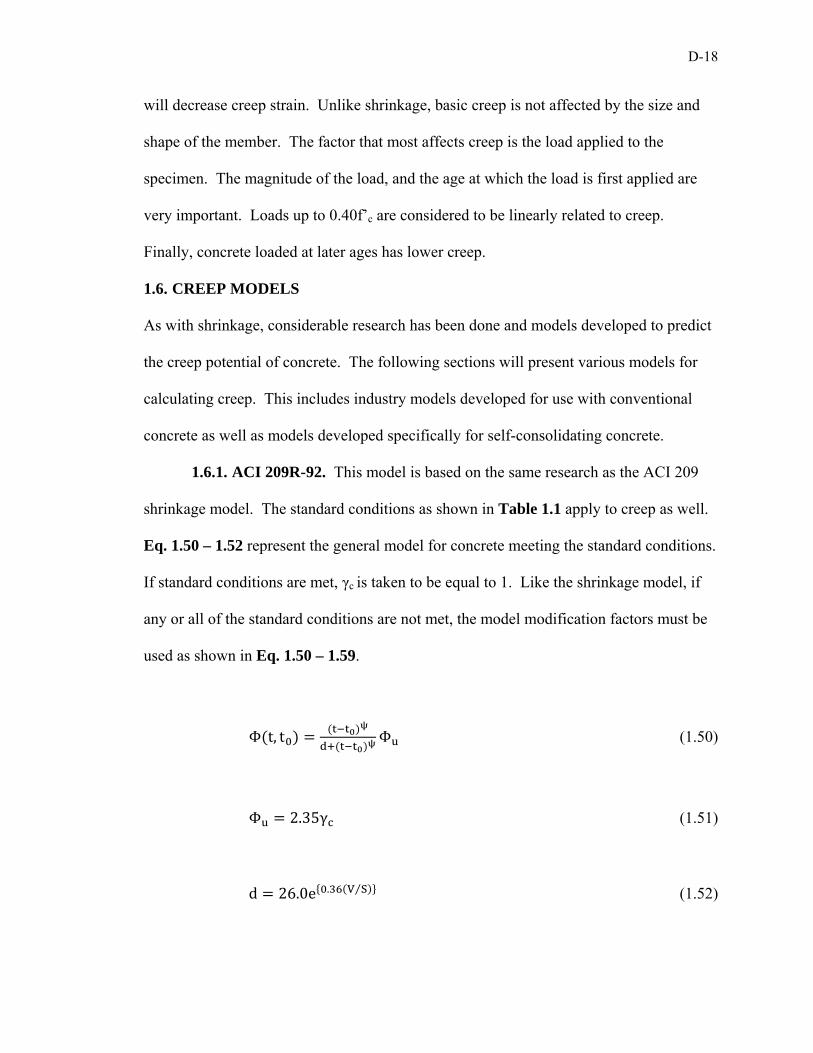
1.6.1. ACI 209R-92. This model is based on the same research as the ACI 209
shrinkage model. The standard conditions as shown in Table 1.1 apply to creep as well.
Eq. 1.50 – 1.52 represent the general model for concrete meeting the standard conditions.
If standard conditions are met, γc is taken to be equal to 1. Like the shrinkage model, if
any or all of the standard conditions are not met, the model modification factors must be
used as shown in Eq. 1.50 – 1.59.
Φ t, t Φ (1.50)
Φ 2.35γ (1.51)
d 26.0e . ⁄ (1.52)

D-19
γ γ , γ , γ , γ , γ , γ , (1.53)
γ ,1.25t . formoistcuring1.13t . forsteamcuring
(1.54)
γ , 1.27 0.67h (1.55)
γ , 1 1.13e . ⁄ (1.56)
γ , 0.82 0.067s (1.57)
γ , 0.88 0.0024ψ (1.58)
γ , 0.46 0.09α 1 (1.59)
Where: Φ(t,t0) is the calculated creep coefficient at a given age, Φu is the calculated
ultimate creep coefficient, t is the age of the specimen in days, γc,to is the curing condition
correction factor, t0 is the age at which the specimen is loaded in days, γc,RH is the
humidity correction factor, h is relative humidity in decimals, γc,VS is the size correction
factor, V/S is the volume to surface area ratio, γc,s is the slump correction factor, s is
slump in inches, γc,ψ is the fine aggregate correction factor, ψ is the ratio of fine aggregate
to total aggregate by weight expressed as percentage, γc,α is the air content correction
factor, and α is the air content in percent. For shape and size effects to be totally
D-20
considered, d is to be determined using Eq. 1.52 and ψ assumed to be equal to 1.0.
Otherwise, average values of d=10 and ψ=0.6 are to be assumed.
1.6.2. NCHRP Report 496. This proposed creep model was developed in a
similar manner to that of the NCHRP Report 496 shrinkage model. The correction
factors that are identical to those used in the corresponding shrinkage model have already
been defined in Section 1.3.2. The model is shown in Eq. 1.60 – 1.66.
ψ t, t 1.90γ (1.60)
γ k k k k k (1.61)
k (1.62)
k t . (1.63)
k (1.64)
k 1.56 0.008H (1.65)
k (1.66)

D-21
Where: ψ(t,ti) is the calculated creep coefficient at a given age, ktd is the time
development factor, t is the age of the concrete in days, kla is the loading factor, ti is the
age at which creep specimen is loaded in days, ks is the size factor, V/S is the volume to
surface area ratio, khc is the humidity factor, H is the average ambient relative humidity in
percent, kf is the concrete strength factor, and f’ci is the specified compressive strength of
concete in ksi.
1.6.3. CEB-FIP 90. The following equations apply to the creep model as
developed jointly by CEB and FIP as presented in the CEB-FIP Model Code 1990.
Φ t, t Φ β t t (1.67)
Φ Φ β f β t (1.68)
Φ 1. /
(1.69)
β f ..⁄ (1.70)
β t. . (1.71)
β t t.
(1.72)
β 150 1 1.2RH 250 1500 (1.73)

D-22
Where: Φ(t, t0) is the calculated creep coefficient at a given age, Φ0 is the notional creep
coefficient, βc is the coefficient to describe the development of creep with time after
loading, t is the age of concrete in days, t0 is the age of concrete at loading in days, RH is
the relative humidity in decimals, Ac is the cross section area in mm2, u is the perimeter
in contact with the atmosphere in mm, and fcm is the mean compressive strength of
concrete at the age of 28 days in MPa.
1.6.4. GL 2000. As with the GL 2000 shrinkage model, the following creep
model was published in the ACI materials journal under the title “Design Provisions for
Drying Shrinkage and Creep of Normal-Strength Concrete”.
Φ Φ t 2.
.
. . (1.72)
2.5 1 1.086h⁄
. (1.74)
Φ t 1⁄
. .
(1.75)
Where: Φ28 is the calculated creep coefficient at a given age, Φ(tc) is a factor that takes
into account drying before loading, t is age of concrete in days, tc is the age of concrete
when drying begins, t0 is the age the concrete was loaded, h is humidity in decimals, and
V/S is the volume to surface area ratio in mm.

D-23
1.7. SCC CREEP RESEARCH
1.7.1. NCHRP Report 628. As with shrinkage, NCHRP 628 presents an SCC
specific creep prediction model which is a modified version of the AASHTO 2004
model. Eq. 1.76 – 1.81 are used to calculate creep of SCC using the proposed
modification factor.
ψ t, t 1.9k k k k k . A (1.76)
k 1.45 0.0051 V S⁄ 0 (1.77)
k 1.56 0.08H (1.78)
k (1.79)
k.
(1.80)
A1.19forTypeI/IIcement1.35forTypeIIIcement (1.81)
Where: ψ(t,ti) is the calculated creep coefficient, kvs is the volume to surface area factor,
V/S is the volume to surface area ratio, khc is the humidity correction factor, H is relative
humidity in percent, kf is the concrete strength factor, f’ci is the concrete compressive
strength at time of loading in MPa, ktd is the time development factor, t is age of concrete
since loading in days, and A is the cement type correction factor.

D-24
1.7.2. Long and Khayat. A total of 16 SCC mixes were tested for creep. The
purpose of this experimental program was to determine the key mixture design and
material selection parameters that most affect creep of SCC. Additionally, conclusions
were made on which current creep prediction model best estimates creep of SCC. It was
found that the binder type (i.e. cementitious materials) was most influential on creep of
SCC, followed by binder content. The model that best predicts creep of SCC was found
to be CEB-FIP 90. The modified AASHTO model described in Section 1.7.1. was also
determined to successfully predict creep of SCC.
1.7.3. Long, et. el. The same study as described in Section 1.4.4 was also
done to develop a prediction equation for creep strain of SCC. The following equation
was developed to predict creep of SCC, with the same variable definitions as shown in
Table 1.2.
112 day creep strain (µε):
1036 73.6BT 40.7 VMA ∙ BT 38.8BC (1.23)
34.9 w/cm ∙ BT 32.9 BC ∙ S/A (1.82)
1.8. Application of Shrinkage and Creep
1.8.1. Prestress Loss. Prestress loss is “the loss of compressive force acting
on the concrete component of a prestressed concrete section.” (NCHRP 426) The ability
to accurately predict the prestress loss in beams is very dependent on the ability to predict
the beam’s shortening due to shrinkage and creep. Shortening of the beam reduces the
tensile force in the prestressed reinforcement and must be accounted for in design.

D-25
NCHRP 426 names three components which significantly affect the prestress loss in
pretensioned concrete members which directly relate to shrinkage and creep. These
components are:
1. Instantaneous prestress loss due to elastic shortening at transfer of force from
prestressed reinforcement to concrete.
2. Long-term prestress loss due to shrinkage and creep of concrete and relaxation of
prestressing strands between the time of transfer and deck placement.
3. Long-term prestress loss between the time of deck placement to the final service
life of the structure due to shrinkage and creep of the girder.
Figure 1.2 shows the prestress loss over the life cycle of a pretensioned concrete
girder. The loss between points D and E represent the loss due to creep, shrinkage, and
relaxation of prestressing strands.
Figure 1.2 - Stress vs. Time for Prestressed Bridge Girder (Tadros et. al. 2003)

D-26
1.8.2. Load Effects. The procedures in “Design of Continuous Highway
Bridges with Precast, Prestressed Concrete Girders” published by the Portland Cement
Association (PCA) take into account additional moments due to shrinkage and creep
when determining loads for design. In this method, fixed end moments due to creep and
end driving moments due to shrinkage are calculated. These applied moments result
from a continuity connection being made at supports by the placement of the bridge deck.
The placement restricts free rotation of the beams and therefore produces moment in the
connection. The moments calculated by this method are then added to all other load
effects at all sections for determination of the ultimate design load. The shrinkage
driving moment calculation is done by first calculating theoretical ultimate shrinkage
values for the beam and the slab. The differential shrinkage between the beam and slab
are then used to determine an applied moment due to shrinkage. The applied moment
due to creep results from prestressed creep and dead load creep. Theoretical creep
coefficients are calculated for the time before and after deck placement. The creep that
occurs after deck placement is what contributes to the applied moment.
1.8.3. Beam Deflection. Shrinkage and creep must also be accounted for
when calculating long term deflection of flexural members. Eq. 9-11 of ACI 318-08,
shown here as Eq. 1.83, accounts for long term sustained loads. This factor is multiplied
by the immediate deflection caused by the load considered.
λ (1.83)

D-27
Where: λΔ is the multiplier for additional deflection due to long-term effects, ξ is the time
dependent factor for sustained load, and ρ’ is compression reinforcement ratio.
1.9. CONCRETE ABRASION
1.9.1. Definition of Concrete Abrasion. Abrasion is the physical wearing
down of a material. The most common sources of abrasion of concrete structures are by
the friction between vehicle tires and concrete pavement road surfaces, and by water
flows over exposed dam or bridge footings. Concrete abrasion leads to a decrease in
member thickness which can lead to cracking or failure of the structure (Atis).
1.9.2. Factors Affecting Concrete Abrasion. Several material properties
and construction factors can affect the abrasion resistance of concrete. The concrete
strength is the most influential property in regards to abrasion resistance. The properties
of the aggregate are also very important in a concrete’s resistance to abrasion. The
surface finish and whether or not a hardener or topping is used effects abrasion resistance
as well (Naik et. al.).
1.10. SCC ABRASION RESEARCH
Little research has been done on self-consolidating concrete’s abrasion resistance relative
to conventional concrete. This is most likely due to the fact that the use of SCC is not
motivated primarily by its hardened properties but by its fresh concrete properties. Also
SCC members are less likely to be exposed to abrasive action as SCC is normally
reserved for use in pre-stressed members such as girders which are typically not exposed
to vehicles or water.

D-28
2. RESEARCH PROGRAM
2.1. MIX DESIGNS
2.1.1. SCC. The SCC testing program consisted of four mixes, two being
SCC with two as conventional concrete equivalents to the SCC mixes. The naming
convention used in the SCC testing program begins with either C (conventional concrete)
or S (SCC). The next number indicates the target 28 day compressive strength, in ksi.
Following the dash is a number indicating the ratio of fine aggregate to total aggregate by
weight. It finishes with L, indicating the type of coarse aggregate used, dolomitic
limestone. The baseline normal strength concrete tested was MoDOT A-1 (C6-58L).
The A-1 mix was used as the comparative mix to the normal strength SCC mix (S6-48L).
Both mixes had identical w/c and air content, with the aggregate ratio and HRWR dosage
adjusted. The S6-28L mix design was based on the average of survey responses from
regional precast plants. The baseline high strength concrete (C10-58L) mix design was
based on research done by Myers and Carrasquillo (2000) at the University of Texas at
Austin. The high strength SCC mix (S10-48L) was designed based on the C10-58L mix
design and finalized after trial batches were made and adjusted. The designs of the mixes
tested can be found in Table 2.1 along with measured 28 day compressive strength (f’c)
and modulus of elasticity (MOE). All mixes and specimens were batched and cast in the
Missouri University of Science and Technology (Missouri S&T) concrete lab located in
Butler-Carlton Hall. All testing was done in the High Bay Structures Engineering
Laboratory (SERL) also located in Butler-Carlton Hall on the campus of Missouri S&T.
Due to the large volume of concrete produced for various studies associated with this
overall research program (i.e. Reports A, B, C, D, and E) some concrete production was

D-29
done in separate batches on different days resulting in some minor variations in concrete
properties between various reports.
Table 2.1 - SCC Test Program Mix Designs and mechanical properties
Amount (per cubic yard) Material C6-58L S6-48L C10-58L S10-48L Water 277.5 lb. 277.5 lb. 315 lb. 315 lb. Cement 750 lb.
(Type I) 750 lb. (Type I)
840 lb. (Type III)
840 lb. (Type III)
Coarse Aggregate
1610 lb. 1333 lb. 1440 lb. 1192 lb.
Fine Aggregate 1444 lb. 1444 lb. 1043 lb. 1291 lb. Fly Ash N/A N/A 210 lb. 210 lb. BASF MB-AE-90 (air entrainment)
2.3 fl oz/cwt 1.2 fl oz/cwt 1.25 fl oz/cwt 1.0 fl oz/cwt
BASF Glenium (HRWR)
4.7 fl oz/cwt 6.2 fl oz/cwt 4.9 fl oz/cwt 6.0 fl oz/cwt
f’c (psi) 7,000 5,500 11,000 13,500 MOE (psi) 3,450,000 3,130,000 3,900,000 4,200,000
Conversion: 1 kg/m3 = 1.686 lb/yd3 1 fl oz = 26.57 mL
1 psi = 6.89 kPa
2.2. SHRINKAGE AND CREEP SPECIMEN CONSTRUCTION
2.2.1. Shrinkage and Creep Specimens. Both shrinkage and creep testing
were done using identical specimens. Although only four specimens per mix were
necessary for testing (two each for shrinkage and creep), six specimens per mix were cast
in case any specimens were damaged during de-molding. These specimens were
fabricated and prepared as described below.

D-30
2.2.2. Shrinkage and Creep Molds. The molds for the shrinkage and creep
specimens were 4 in. diameter PVC pipe adhered to a plywood base. The PVC was cut
into 24 in. sections with care being taken to ensure all cuts were made so that the mold
would sit flush and orthogonal to the base. The PVC was also notched on opposite sides.
The notches made de-molding much easier and significantly reduced the possibility of
damaging the specimens during de-molding. Once prepared the PVC was adhered to a 1
ft. (304.8 mm) by 1 ft. (304.8 mm) plywood base using a waterproof silicon sealant. The
completed molds were allowed to sit for at least 24 hours before use to allow for the
sealant to fully set up. Figure 2.1 shows a completed shrinkage and creep mold.
Figure 2.1 - Shrinkage and Creep Form

D-31
2.2.3. Shrinkage and Creep Specimen Casting. Specimens were consolidated
in a manner similar to that prescribed in ASTM C31 “Standard Practice for Making and
Curing Concrete Test Specimens in the Field” for a 6 in. diameter cylinder.
Consolidation and vibration were performed when necessary. The specimens were cast
in three layers of approximately equal depth and were rodded 25 times per layer for all
mixes. External vibration was also performed after each layer was rodded using an
electric handheld concrete vibrator as needed. Specimens were moist cured until de-
molded and prepared.
2.2.4. Shrinkage and Creep De-Molding and Preparation. All specimens
were de-molded within 24 hours of their initial set time. De-molding was done by first
cutting through the notched section with a utility knife. A hammer and chisel were then
used to split the mold and remove it from the concrete. Creep specimens were sulfur
capped on both ends in preparation for loading at 28 days. Shrinkage specimens were
sulfur capped on only the bottom end, allowing for stability and more accurate readings.
2.2.5. Shrinkage and Creep Data Acquisition. A demountable mechanical
strain gauge (DEMEC) was used to measure strain in the concrete. DEMEC points, small
pre-drilled stainless steel discs, were adhered to the surface of the specimen. They were
arranged in three vertical lines of five points, 120º apart, as shown in Fig. 2.2. This
arrangement allowed for 9 readings to be taken per specimen. The average of all
readings taken per specimen was taken as the value to be used for strain calculation. The
points in one line per specimen were adhered using gel control super glue. The instant
hardening allowed for initial readings to be made on each specimen as soon as possible.

D-32
The remaining points were adhered using concrete/metal epoxy, which took up to 24
hours to fully harden for accurate reading to be taken. The points adhered with super
glue were later protected using the epoxy.
Figure 2.2 – Shrinkage and Creep Specimens and DEMEC Point Arrangement
(Myers and Yang, 2005)
2.3. ABRASION SPECIMEN CONSTRUCTION
One specimen per mix was cast for abrasion test. Each specimen was large enough so
that three replicate abrasion tests could be done for each mix. Abrasion specimens
measured 6 in. (152.4 mm) by 16 in. (406.4 mm) by 3.5 in. (88.9 mm) and were cast in a
mold made from wooden 2x4 sections and attached to a plywood base. The baseline
mixes were consolidated similar to that prescribed in ASTM C31 “Standard Practice for
Making and Curing Concrete Test Specimens in the Field” for a 6 in. (152.4 mm) wide
beam. External vibration was used as necessary. To ensure that abrasion tests on all
specimens were consistent, every specimen tested was finished by the same individual
using a hand trowel. Specimens were moist cured until tested. All testing was performed
on the top finished surface of the specimen.

D-33
2.4. TESTING PROCEDURES
2.4.1. Shrinkage Testing Procedures. A modified version of ASTM C157
“Standard Test Method for Length Change of Hardened Hydraulic-Cement Mortar and
Concrete” was used to determine the shrinkage of the concrete specimens. Until the age
of loading for creep, four specimens were used for shrinkage determination. At 28 days,
two of these specimens were transferred to creep frames, leaving two remaining
specimens to be tested for long term shrinkage. Nine strain readings could be taken per
specimen, with the average of all readings taken as the value to be used for shrinkage
calculation. Strain was determined using the DEMEC readings and calculated by Eq. 2.1
as found in “Simplified Instructions for Using a Digital DEMEC Gauge”. An example of
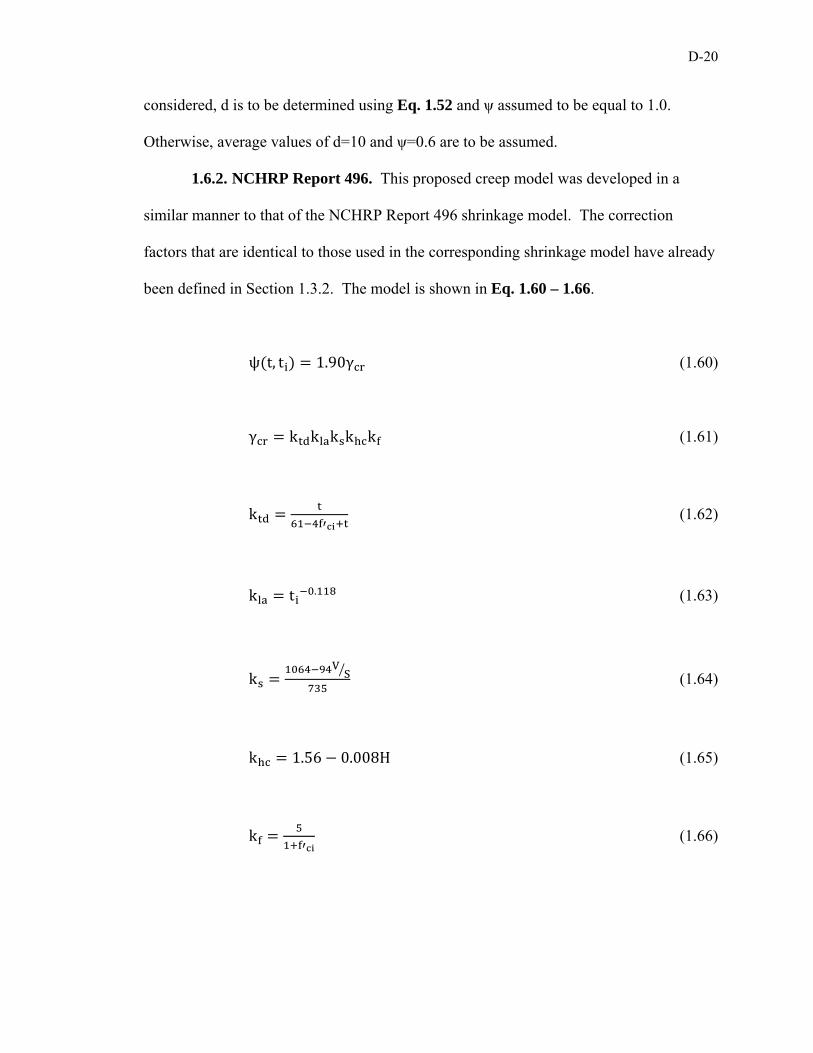
a DEMEC reading being taken on a specimen is shown in Figure 2.3. Readings were
normalized by taking a reading on the reference bar (see Figure 2.4) as shown in Figure
2.5. Shrinkage strain experienced during the first day after demolding was estimated
based on linear interpolation of subsequent strain values, as calculated by Eq. 2.1
∆ε G R R D D (µε) (2.1)
Where: Δεs is the change in strain from one reading to the next, G is the gauge factor
shown in Figure 2.6, 0.400 x 10⁻⁵ strain per division (4 microstrain), D0 is the datum
reading on the reference bar, Di is the subsequent reading on the reference bar, R0 is the
datum reading on the tested material, and Ri is the subsequent reading on the tested
material. Gauge units are the digital gauge reading without the decimal point. For
example, Figure 2.7 shows a reading of 2.523 which equates to 2523 gauge units.

D-34
Figure 2.3 – DEMEC Reading Taken on Specimen
Figure 2.4 - Reference Bar
D-35
Figure 2.5 - Reading Taken on Reference Bar
Figure 2.6 - Gauge Factor Used for Shrinkage and Creep Calculations
Figure 2.7 - Example DEMEC Gauge Reading

D-36
2.4.2. Creep Testing Procedures. A modified version of ASTM C512 “Standard
Test Method for Creep of Concrete in Compression” was used to determine the creep of
the concrete specimens tested. Until the age of loading, creep specimens acted as
shrinkage specimens. This is a modification of ASTM C512, as the specimens were not
moist cured beyond the time of de-molding. Additionally, humidity was not controlled
however it was recorded.
At 28 days, representative specimens were tested according to ASTM C39
“Standard Test Method for Compressive Strength of Cylindrical Concrete Specimens”
and ASTM C469 “Standard Test Method for Static Modulus of Elasticity and Poisson’s
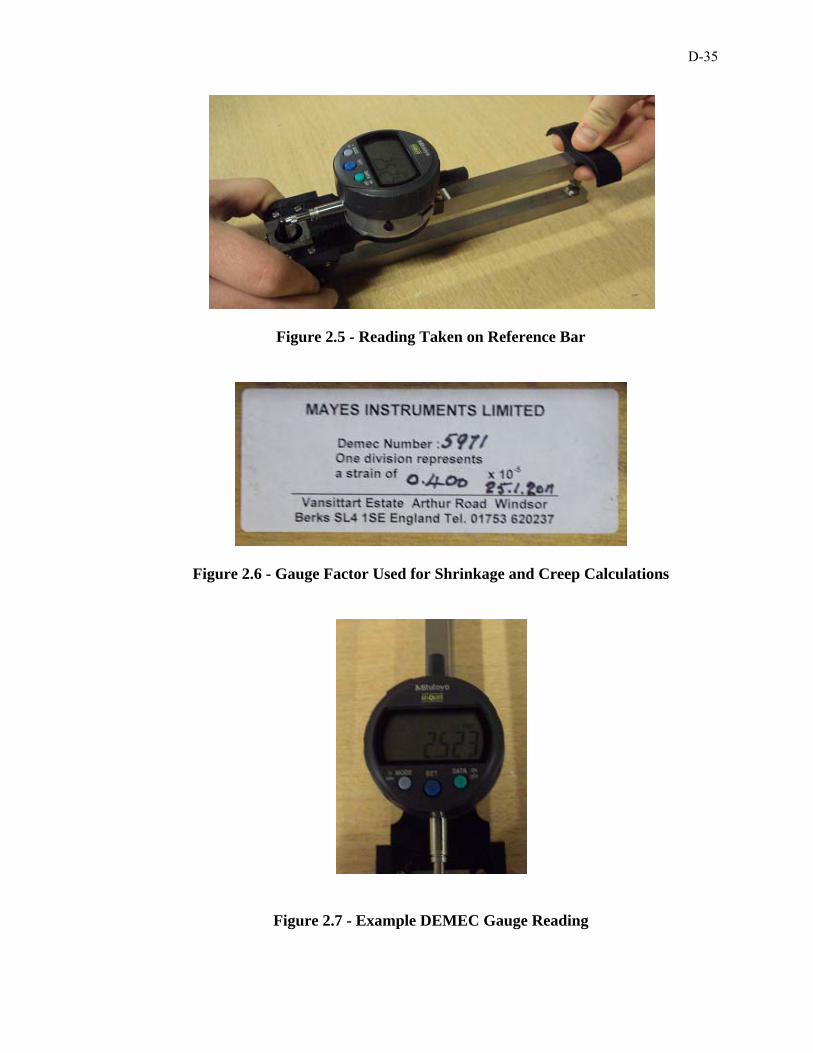
Ratio of Concrete in Compression.” Creep specimens were then loaded to 40% of their
measured 28 day compressive strength in the creep frames shown in Figures 2.8 – 2.9.
The design of the creep frames was based on research done by Myers and Yang (2005).
Figure 2.8 - Schematic of Creep Loading Frame (Myers and Yang, 2004) (1 in = 25.4 mm)
D-37
Figure 2.9 - Creep Loading Frame with Specimen
Measurements taken on creep specimens were done in the exact way as with the
shrinkage specimens. Eq. 2.2 was used to determine the change in strain between one
creep reading to the next. Using the calculated creep strain, the coefficient of creep could
be determined by Eq. 2.3. Creep and shrinkage readings for like specimens were taken at
the same interval. Readings were also taken immediately before and after loading to
determine initial elastic strain due to loading. Figure 2.10 shows a reading being taken
on a creep specimen.

D-38
∆ε G R R D D ∆ε (µε) (2.2)
Where: Δεc is the change in creep strain between readings.
Φ t, t εε (2.3)
Where: Φ(t,t0) is the measured creep coefficient at a given age, εi is the measured strain
due to initial loading of the specimen, εt is the measured creep strain at a given age.
Figure 2.10 - Reading Taken on Creep Specimen

D-39
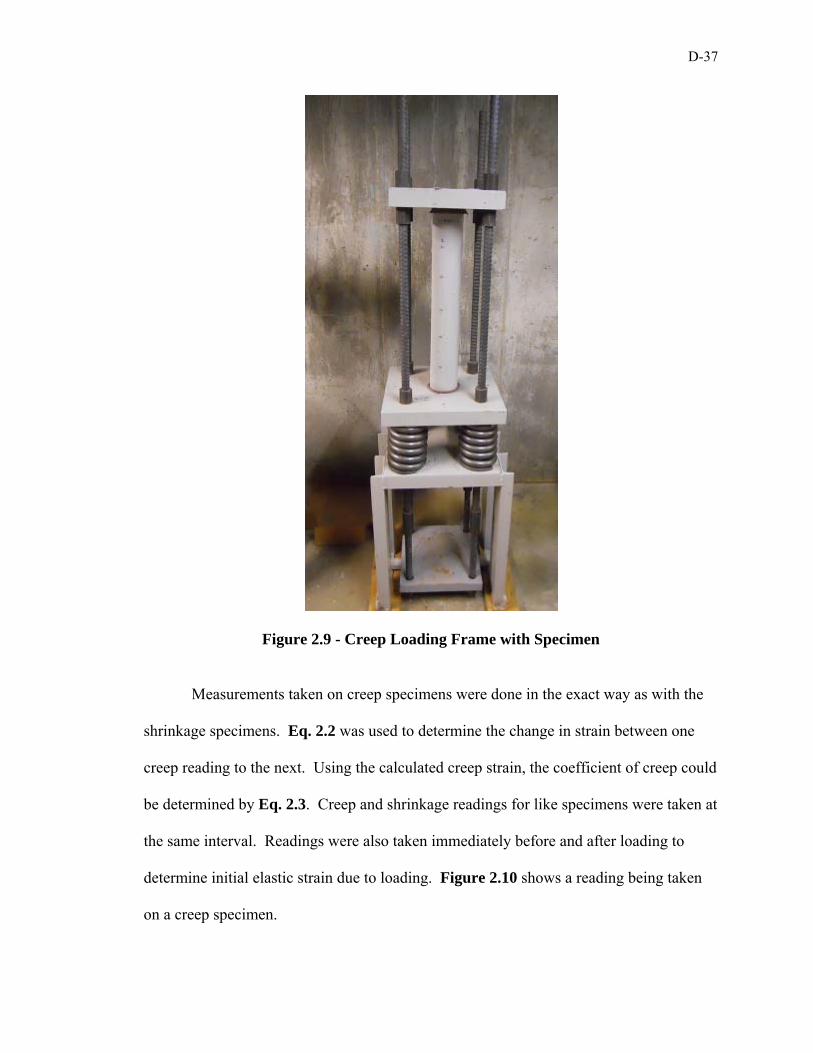
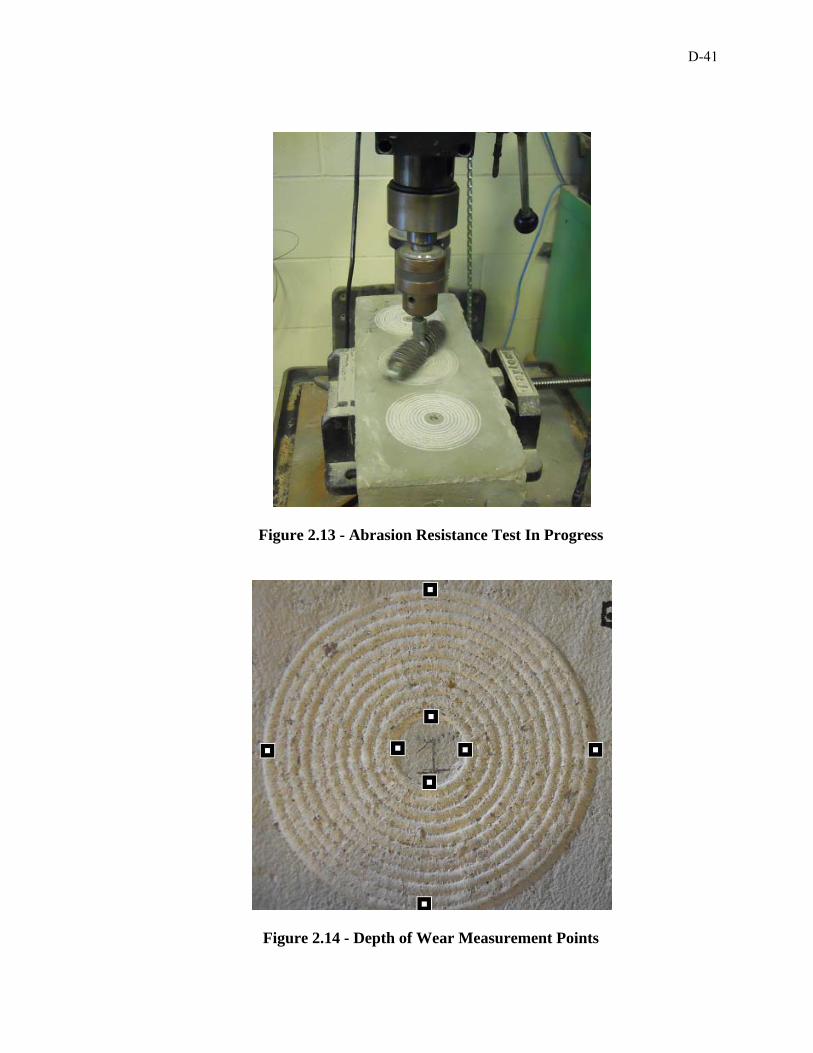
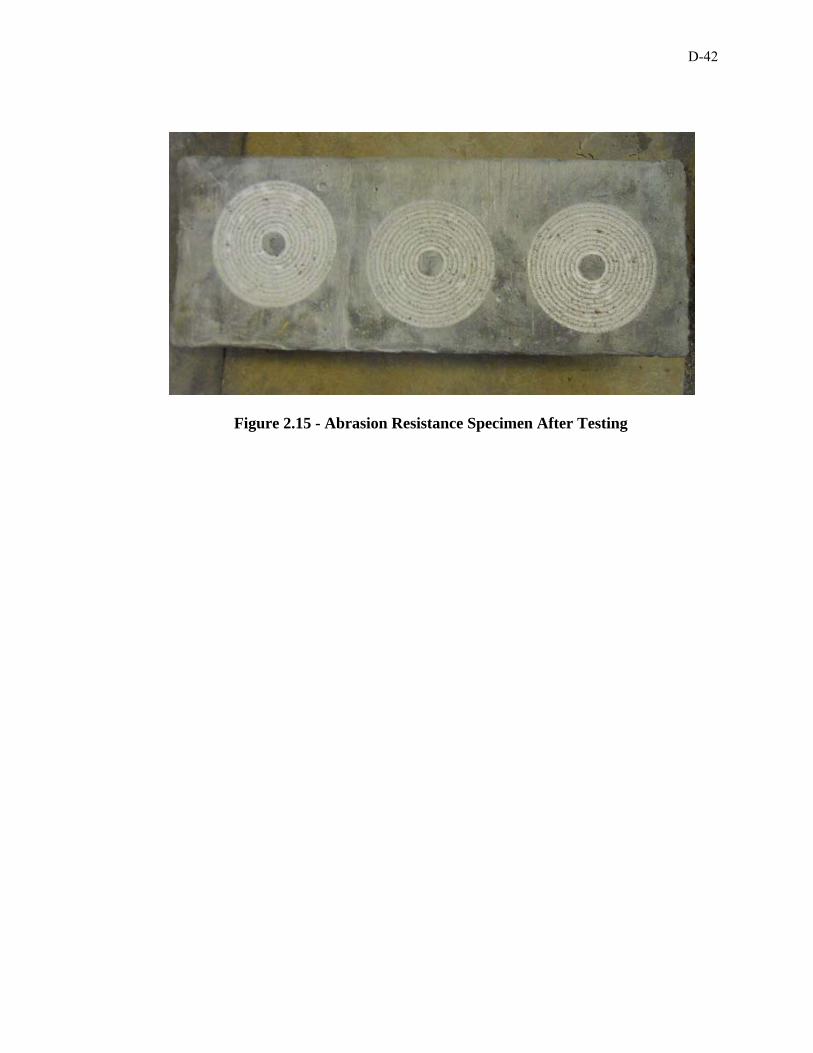
2.4.3. Abrasion Resistance Testing Procedures. ASTM C944 “Standard Test
Method for Abrasion Resistance of Concrete or Mortar Surfaces by the Rotating-Cutter
Method” was used to determine abrasion resistance. A schematic of the rotating cutter
used is shown in Figure 2.11, which is taken from ASTM C944. The actual rotating
cutter is shown in Figure 2.12. Abrasion specimens were moist cured until testing at 28
days age. One specimen per mix was constructed, which allowed for three abrasion tests.
One abrasion test consisted of three abrasion cycles. Each cycle lasted two minutes. A
load of 44lb, defined as a double load in ASTM C944, was applied at a rate of 300 rpm
using a drill press as shown in Figure 2.13. After each cycle, mass loss (mg) was
recorded by subtracting the final weight from the initial weight. Each cycle per test was
done on the same spot. After completion of each abrasion test, the average depth of wear
(mm) was measured using digital calipers. The average depth of wear was calculated
from a total of eight depth measurements relative to the adjacent untested surface, four
taken on the outer perimeter of the tested surface and four taken around the inner
perimeter, at the points indicated in Figure 2.14. The measurements were made using a
digital caliper. On the day of testing, the specimen was removed from moist cure and
surface dried by blotting with paper towels. This was done to avoid any mass loss due to
moisture loss. A completed specimen after all three abrasion tests is shown in Figure
2.15.

D-40
Figure 2.11 - Schematic of Abrasion Rotating Cutter (ASTM C944) (1 in = 25.4 mm)
Figure 2.12 - Rotating Cutter
D-41
Figure 2.13 - Abrasion Resistance Test In Progress
Figure 2.14 - Depth of Wear Measurement Points
D-42
Figure 2.15 - Abrasion Resistance Specimen After Testing
D-43
3. SCC RESULTS AND DISCUSSION
3.1. SHRINKAGE
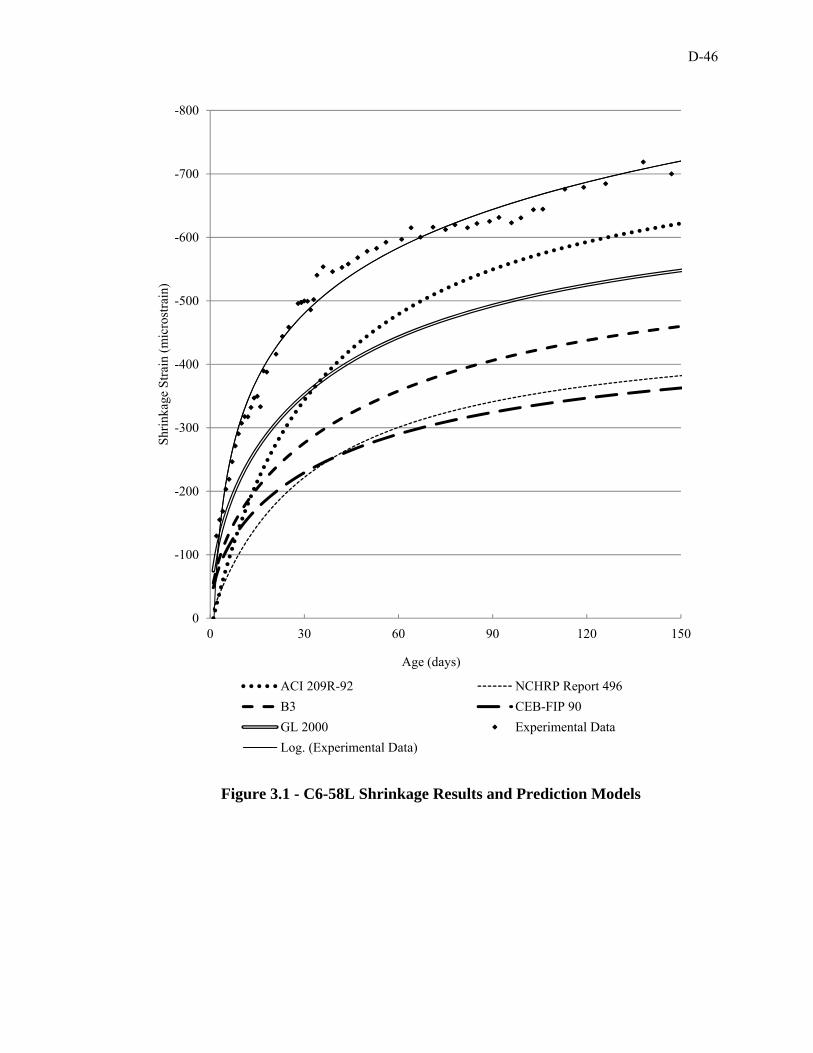
3.1.1. Results. Figures 3.1 – 3.4 show the experimental data obtained from
shrinkage tests of SCC plotted with the various prediction models discussed in Section 1.
Figure 3.5 shows the experimental results of all four mixes plotted with one another. In
figures where different data sources are together, the source of the data can be found in
parentheses after the data label in the legend of its respective figure. All data obtained in
this study was gathered at Missouri S&T.
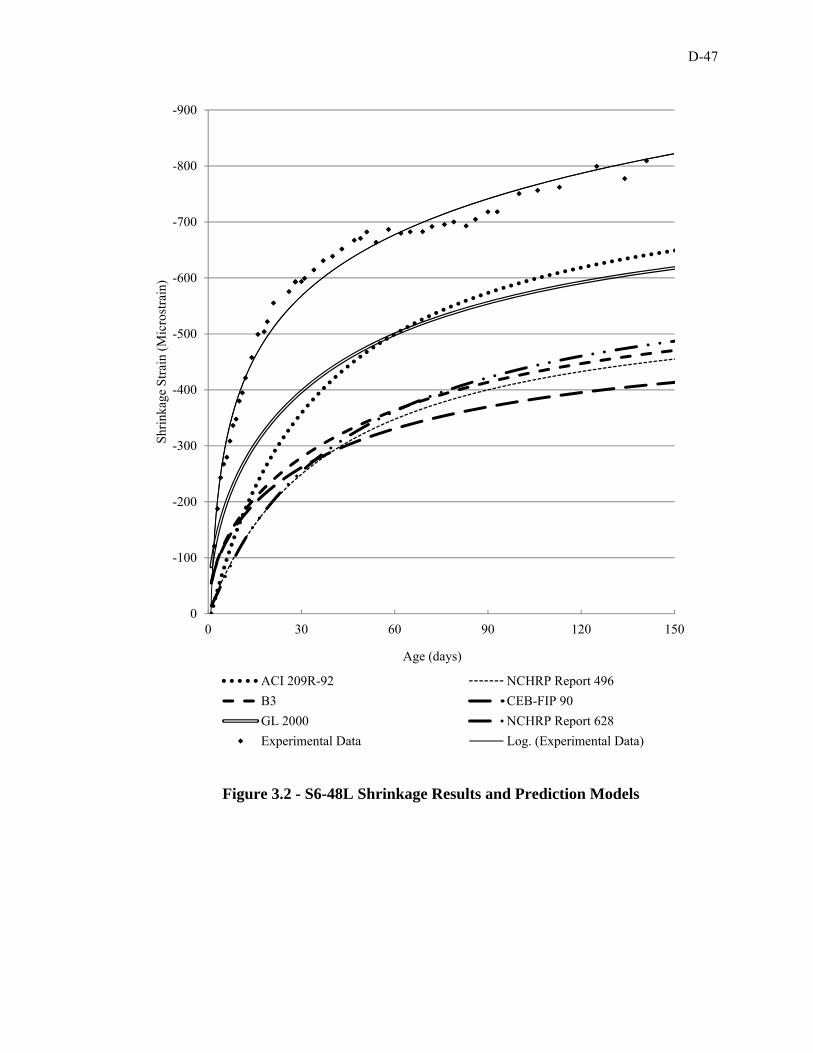
3.1.2. Discussion and Conclusions. For the lower strength variations, C6-58L
and S6-48L, the relative shrinkage strains are not consistent with the SCC prediction
model found in NCHRP Report 628. This model was a modification of the AASHTO
prediction model, with an added factor to account for the effects of SCC. In the NCHRP
Report 628 model, SCC made using Type I/II cement should show a reduction in
shrinkage strain. The reduction factor in NCHRP Report 628 for SCC with Type I/II
cement is 0.918, therefore it is expected that S6-48L would have a reduction in shrinkage
strain. The reason for this inconsistency with previous data could be the difference in
mix designs used in this project compared to others. Since shrinkage of concrete is most
related to shrinkage of paste, it would be expected that mixes with higher paste volumes
would experience more shrinkage. Relative to all mixes tested by Schindler, et. al., S6-
48L had a greater cement content, fine aggregate content, and FA/CA ratio. In a similar
study done by Long, Khayat and Xing, it was concluded that shrinkage is highly affected
by binder content. The relatively high binder content and low coarse aggregate content
of S6-48L could be the reason for the large shrinkage strains.

D-44
For high strength variations, C10-58L and S10-48L, the experimental results are
very consistent with previous findings. Schindler, et. al. reported that high strength SCC
mixes show a reduction in shrinkage relative to high strength conventional concrete.
Therefore it can be expected that, in terms of shrinkage, high strength SCC is an adequate
alternative to conventional high strength concrete.
Besides the mix designs themselves, the environment the specimens were exposed
to seemed to have a significant effect on shrinkage. As seen in Appendix A, there is a
correlation between shrinkage and relative humidity. The unexpected decreases in
shrinkage that were measured tend to correspond to days with unusually high relative
humidity. This confirms the relationship given by Eq. 1.1 from ACI 209.1R-05 which
states that shrinkage is inversely related to relative humidity.
Comparing the results to previous studies, both SCC mixes perform adequately.
Table 3.1 and Figure 3.6 show the shrinkage data of S6-48L and S10-48L relative to the
database compiled in Fernandez-Gomez and Landsberger, Shindler et. al., and
Holshemacher and the equations developed by Long, et.al. The 112 day shrinkage strains
calculated from Long et. al. are the 56 day autogenous shrinkage (Eq. 1.48) added to the
112 day drying shrinkage (Eq. 1.49). This is acceptable as it has been shown that
autogenous shrinkage reaches stable values after 56 days (Long, Khayat, and Xing).
Results from this study are consistent with the database compiled by Fernandez-Gomez
and Landsberger, which includes 93 SCC mixes. At all ages that were tested in this study
the results for both S6-48L and S10-48L fall within the limits of the database. When
comparing to the shrinkage prediction equations developed by Long et. al., however, S6-
48L doesn’t seem to perform quite as well. Again, when comparing S10-48L to this

D-45
previous SCC shrinkage study, it performs very well. Below is a summary figure
showing the SCC mixes tested in this program shown with the databases compiled by
Fernandez-Gomez and Landsberger, Shindler et. al., and Holschemacher. The shrinkage
from Schindler et. al. is likely lower due to the specimens being submerged in a lime bath
for the first 7 days.
Finally, results for the normal strength variations are consistent with the
observation made by Holschemacher (2004) that “In the majority of the evaluated data
the shrinkage of SCC is 10 to 50% higher than the one of conventional concrete.” At 150
days, S6-48L had experienced 24% greater shrinkage than C10-58L. This trend,
however, does not hold true for the high strength variations.
D-46
Figure 3.1 - C6-58L Shrinkage Results and Prediction Models
-800
-700
-600
-500
-400
-300
-200
-100
00 30 60 90 120 150
Shr
inka
ge S
trai
n (m
icro
stra
in)
Age (days)
ACI 209R-92 NCHRP Report 496
B3 CEB-FIP 90
GL 2000 Experimental Data
Log. (Experimental Data)
D-47
Figure 3.2 - S6-48L Shrinkage Results and Prediction Models
-900
-800
-700
-600
-500
-400
-300
-200
-100
00 30 60 90 120 150
Shr
inka
ge S
trai
n (M
icro
stra
in)
Age (days)
ACI 209R-92 NCHRP Report 496
B3 CEB-FIP 90
GL 2000 NCHRP Report 628
Experimental Data Log. (Experimental Data)

D-48
Figure 3.3 - C10-58L Shrinkage Results and Prediction Models
-800
-700
-600
-500
-400
-300
-200
-100
00 30 60 90 120 150
Shr
inka
ge S
trai
n (m
icro
stra
in)
Age (days)
ACI 209R-92 NCHRP Report 496
Model B3 CEB-FIP 90
GL 2000 Experimental Data
Log. (Experimental Data)

D-49
Figure 3.4 - S10-58L Shrinkage Results and Prediction Models
-800
-700
-600
-500
-400
-300
-200
-100
00 30 60 90 120 150
Shr
inka
ge S
trai
n (m
icro
stra
in)
Age (days)
ACI 209R-92 NCHRP Report 496Model B3 CEB-FIP 90GL 2000 NCHRP Report 628Experimental Data Log. (Experimental Data)
D-50
Figure 3.5 - SCC Shrinkage Results (Best fit Logarithmic)
-900
-800
-700
-600
-500
-400
-300
-200
-100
00 30 60 90 120 150
Shr
inka
ge S
trai
n (m
icro
stra
in)
Age (days)
Log. (C6-58L) Log. (S6-48L) Log. (C10-58L) Log. (S10-48L)

D-51
Figure 3.6 – SCC Results with Shrinkage Databases (Fernandez-Gomez, Shindler et. al., and Holshemacher)
-900
-800
-700
-600
-500
-400
-300
-200
-100
00 10 20 30 40 50 60 70 80 90 100 110 120 130 140 150
Shr
inka
ge S
trai
n (m
icro
stra
in)
Age (days)Fernandez-Gomez and Landsberger Schindler et. al.
Log. (S6-48L (S&T)) Log. (S10-48L (S&T))
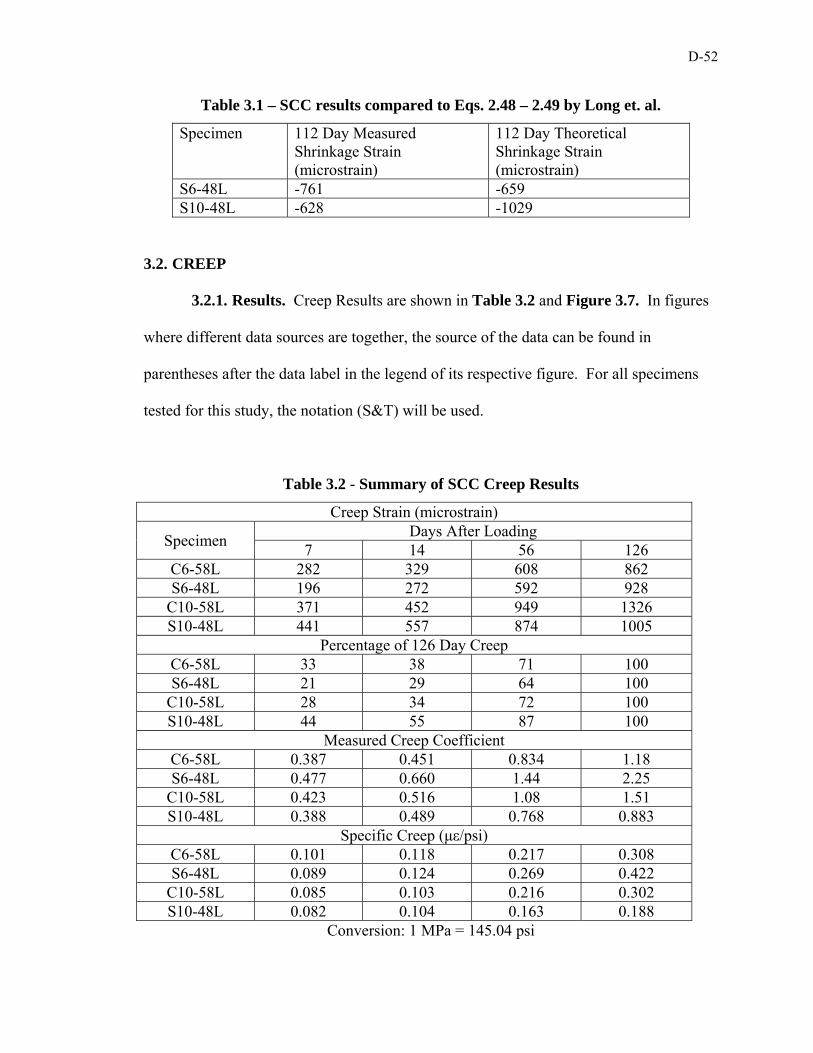
D-52
Table 3.1 – SCC results compared to Eqs. 2.48 – 2.49 by Long et. al.
Specimen 112 Day Measured Shrinkage Strain (microstrain)
112 Day Theoretical Shrinkage Strain (microstrain)
S6-48L -761 -659 S10-48L -628 -1029
3.2. CREEP
3.2.1. Results. Creep Results are shown in Table 3.2 and Figure 3.7. In figures
where different data sources are together, the source of the data can be found in
parentheses after the data label in the legend of its respective figure. For all specimens
tested for this study, the notation (S&T) will be used.
Table 3.2 - Summary of SCC Creep Results
Creep Strain (microstrain)
Specimen Days After Loading
7 14 56 126 C6-58L 282 329 608 862 S6-48L 196 272 592 928
C10-58L 371 452 949 1326 S10-48L 441 557 874 1005
Percentage of 126 Day Creep C6-58L 33 38 71 100 S6-48L 21 29 64 100
C10-58L 28 34 72 100 S10-48L 44 55 87 100
Measured Creep Coefficient C6-58L 0.387 0.451 0.834 1.18 S6-48L 0.477 0.660 1.44 2.25
C10-58L 0.423 0.516 1.08 1.51 S10-48L 0.388 0.489 0.768 0.883
Specific Creep (με/psi) C6-58L 0.101 0.118 0.217 0.308 S6-48L 0.089 0.124 0.269 0.422
C10-58L 0.085 0.103 0.216 0.302 S10-48L 0.082 0.104 0.163 0.188
Conversion: 1 MPa = 145.04 psi

D-53
3.2.2. Discussion and Conclusions. Like the shrinkage results, for normal
strength specimens, the conventional concrete variation outperformed SCC. Also like the
shrinkage results, for the high strength specimens, SCC outperformed conventional
concrete.
For normal strength concrete, these results are supported by every prediction
model that was analyzed. Every model predicts that C6-58L would have a lower creep
coefficient than S6-48L after 126 days being loaded. The models were not as consistent
when predicting the creep behavior of high strength concrete. The model identified by
Long and Khayat (2011) as best predicting SCC creep behavior, CEB-FIP 90, does
predict the behavior of specimens in this study. CEB-FIP 90 predicts that, like the
results, S10-48L would have a lower creep coefficient than C10-58L after 126 days being
loaded. Additionally, NCHRP Report 628 (2009), the model which is specifically for
SCC, also predicts the same relationship.
In terms of comparing the results to previous research, both specimens performed
very well. Long and Khayat (2011) investigated the creep strain on 16 SCC mixes. Eight
of these mixes Nos. 1-8, were all very similar to S6-48L in terms of compressive
strength, with Nos. 1-4 having a w/c of .34 and Nos. 5-8 with a w/c of .40. When plotted
against these mixes, as shown in Figure 3.8, S6-48L performs very well. The same
relationship exists between S10-48L and Nos. 9-12 from Long and Khayat (2011). These
mixes have a similar amount of cement, however did not achieve the compressive
strength of S10-48L. Creep results from S10-48L are shown with mix Nos. 9-12 in
Figure 3.9. All specimens tested in Long and Khayat (2011) were loaded to 40% of their
measured compressive strength, but at 18 hours age. The lower creep strain experienced

D-54
by the specimens in this study relative to Long and Khayat are possibly due to the
concrete in the study being loaded at a later age when the strength and stiffness has
increased relative to that of 18 hour old concrete.
Figure 3.7 – SCC Coefficient of Creep Results
0
0.5
1
1.5
2
2.5
0 14 28 42 56 70 84 98 112 126
Coe
ffic
ient
of
Cre
ep
Days After Loading
C6-58L S6-48L C10-58L S10-48L

D-55
Figure 3.8 – S6-48L Plotted Against Results from Long and Khayat (2011)
0
200
400
600
800
1000
1200
0 14 28 42 56 70 84 98 112 126
Cre
ep S
trai
n (m
icro
stra
in)
Days After Loading
S6-48L (S&T) Mix Nos. 1-8 (Khayat)

D-56
Figure 3.9 – S10-48L Plotted Against Results from Long and Khayat (2011)
0
200
400
600
800
1000
1200
1400
0 14 28 42 56 70 84 98 112 126
Cre
ep S
trai
n (m
icro
stra
in)
Days After Loading
S10-48L (S&T) Mix Nos. 9-16 (Khayat)
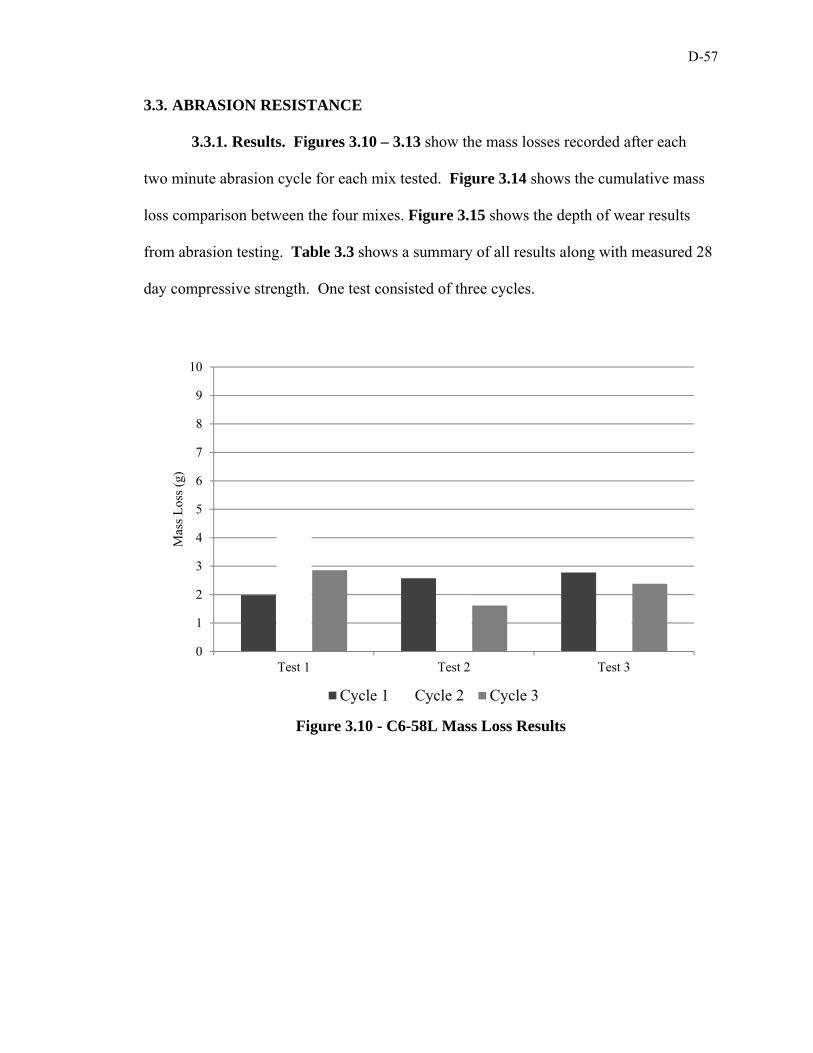
D-57
3.3. ABRASION RESISTANCE
3.3.1. Results. Figures 3.10 – 3.13 show the mass losses recorded after each
two minute abrasion cycle for each mix tested. Figure 3.14 shows the cumulative mass
loss comparison between the four mixes. Figure 3.15 shows the depth of wear results
from abrasion testing. Table 3.3 shows a summary of all results along with measured 28
day compressive strength. One test consisted of three cycles.
Figure 3.10 - C6-58L Mass Loss Results
0
1
2
3
4
5
6
7
8
9
10
Test 1 Test 2 Test 3
Mas
s L
oss
(g)
Cycle 1 Cycle 2 Cycle 3

D-58
Figure 3.11 - S6-48L Mass Loss Results
Figure 3.12 - C10-58L Mass Loss Results
0
1
2
3
4
5
6
7
8
9
10
Test 1 Test 2 Test 3
Mas
s L
oss
(g)
Cycle 1 Cycle 2 Cycle 3
0
1
2
3
4
5
6
7
8
9
10
Test 1 Test 2 Test 3
Mas
s L
oss
(g)
Cycle 1 Cycle 2 Cycle 3
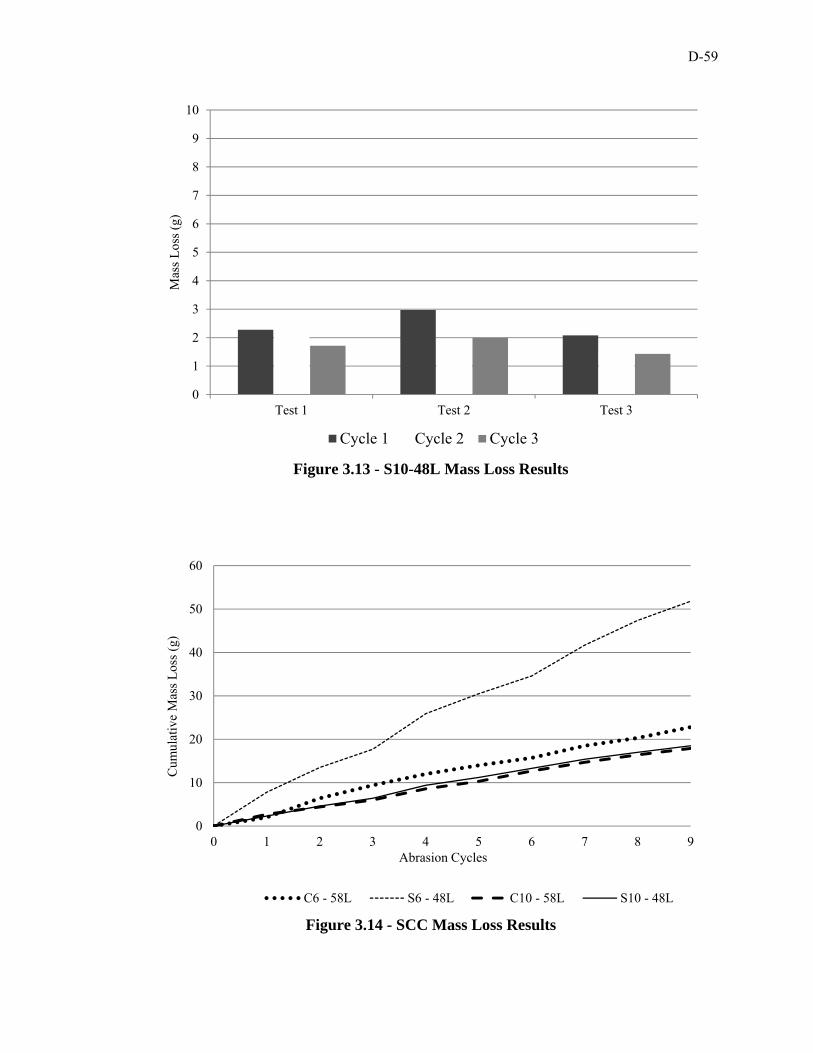
D-59
Figure 3.13 - S10-48L Mass Loss Results
Figure 3.14 - SCC Mass Loss Results
0
1
2
3
4
5
6
7
8
9
10
Test 1 Test 2 Test 3
Mas
s L
oss
(g)
Cycle 1 Cycle 2 Cycle 3
0
10
20
30
40
50
60
0 1 2 3 4 5 6 7 8 9
Cum
ulat
ive
Mas
s L
oss
(g)
Abrasion Cycles
C6 - 58L S6 - 48L C10 - 58L S10 - 48L

D-60
Figure 3.15 - SCC Depth of Wear Results
Table 3.3 - Summary of Results Shown with 28 Day Measured Compressive
Strength
C6-58L S6-48L C10-58L S10-48L 28 Day Compressive Strength (psi)
7,000 5,500 11,000 13,500
Avg. Mass loss (g)
2.53 5.76 1.99 2.06
Avg. Depth of Wear (mm)
0.59 1.07 0.54 0.47
Conversion: 1 MPa = 145.04 psi 1 lb. = 453.59 g 1 in. = 25.4 mm
3.3.2. Discussion and Conclusions. The results obtained are very consistent
with trends found in previous studies. As was concluded in both Atis and Naik, the
abrasion resistance of concrete is primarily dependent on compressive strength. For both
0
0.2
0.4
0.6
0.8
1
1.2
C6-58L S6-48L C10-58L S10-48L
Dep
th o
f W
ear
(mm
)
Test 1 Test 2 Test 3
D-61
criteria (mass loss and depth of abrasion), the abrasion resistance of concrete increased as
the compressive strength of the specimens increased, except for the mass loss of S10-48L
relative to C10-58L. Additionally, when comparing concrete mixes with the same design
strength, the SCC mix generally showed a lower resistance to wear. This is most likely
due to the decreased amount of coarse aggregate in the SCC mixes. Based on
observations during and after testing, the majority of mass loss due to abrasion was from
the cement paste, as opposed to the aggregate. Generally, for each test, cycle 1 shows the
greatest amount of mass loss. The general decrease in measured mass loss for each
subsequent cycle indicates that as the depth of wear gets larger, the presence of aggregate
begins to take effect. This would explain why the SCC mixes showed a decrease in
abrasion resistance relative to their conventional concrete equivalents.
D-62
APPENDIX A.
SHRINKAGE DATA WITH RELATIVE HUMIDITY DATA

D-63
Figure A.1 – C6-58L shrinkage data shown with recorded relative humidity
0
10
20
30
40
50
60
70
80-800
-700
-600
-500
-400
-300
-200
-100
05/19/2011 7/18/2011 9/16/2011 11/15/2011 1/14/2012
Rel
ativ
e H
umid
ity
(%)
Shr
inka
ge S
trai
n (m
icro
stra
in)
C6-58L Relative Humidity
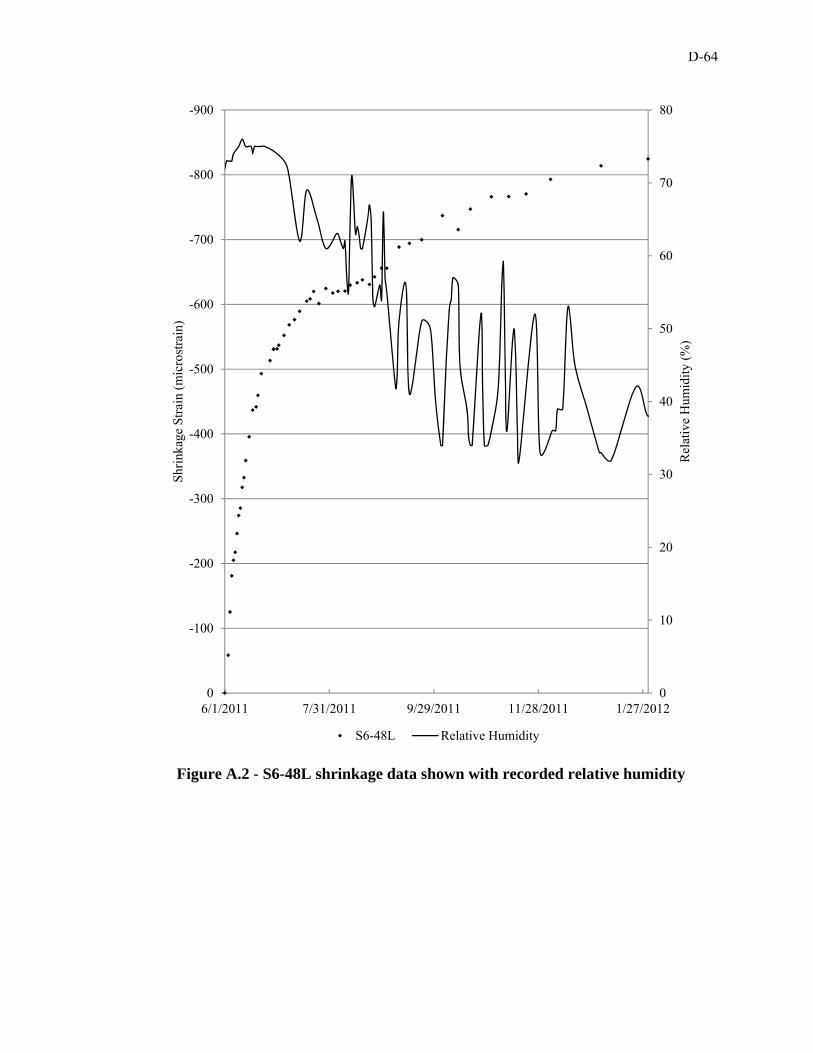
D-64
Figure A.2 - S6-48L shrinkage data shown with recorded relative humidity
0
10
20
30
40
50
60
70
80-900
-800
-700
-600
-500
-400
-300
-200
-100
06/1/2011 7/31/2011 9/29/2011 11/28/2011 1/27/2012
Rel
ativ
e H
umid
ity
(%)
Shr
inka
ge S
trai
n (m
icro
stra
in)
S6-48L Relative Humidity

D-65
Figure A.3 – C10-58L shrinkage data shown with recorded relative humidity
0
10
20
30
40
50
60
70
80-800
-700
-600
-500
-400
-300
-200
-100
06/16/2011 8/15/2011 10/14/2011 12/13/2011
Rel
ativ
e H
umid
ity
(%)
Shr
inka
ge S
trai
n (m
icro
stra
in)
C10-58L Relative Humidity
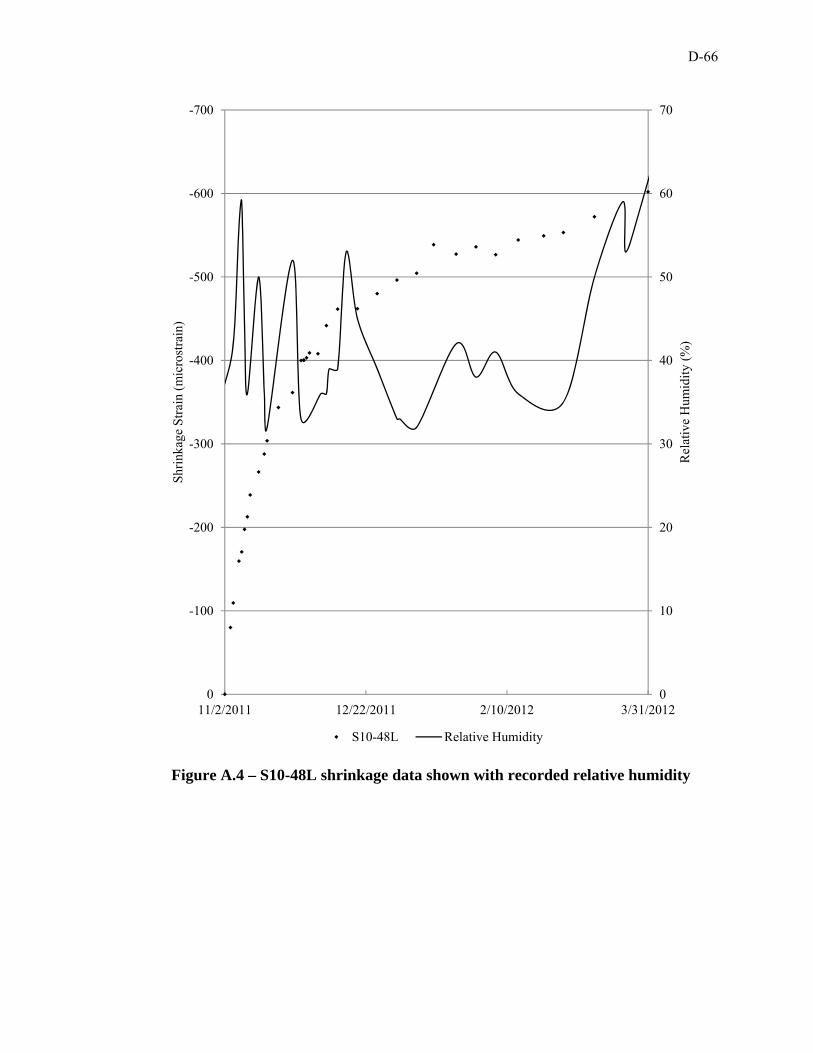
D-66
Figure A.4 – S10-48L shrinkage data shown with recorded relative humidity
0
10
20
30
40
50
60
70-700
-600
-500
-400
-300
-200
-100
011/2/2011 12/22/2011 2/10/2012 3/31/2012
Rel
ativ
e H
umid
ity
(%)
Shr
inka
ge S
trai
n (m
icro
stra
in)
S10-48L Relative Humidity

D-67
APPENDIX B.
EXAMPLE STRAIN CALCULATIONS

D-68
Figure B.1 – Example shrinkage and creep strain calculation
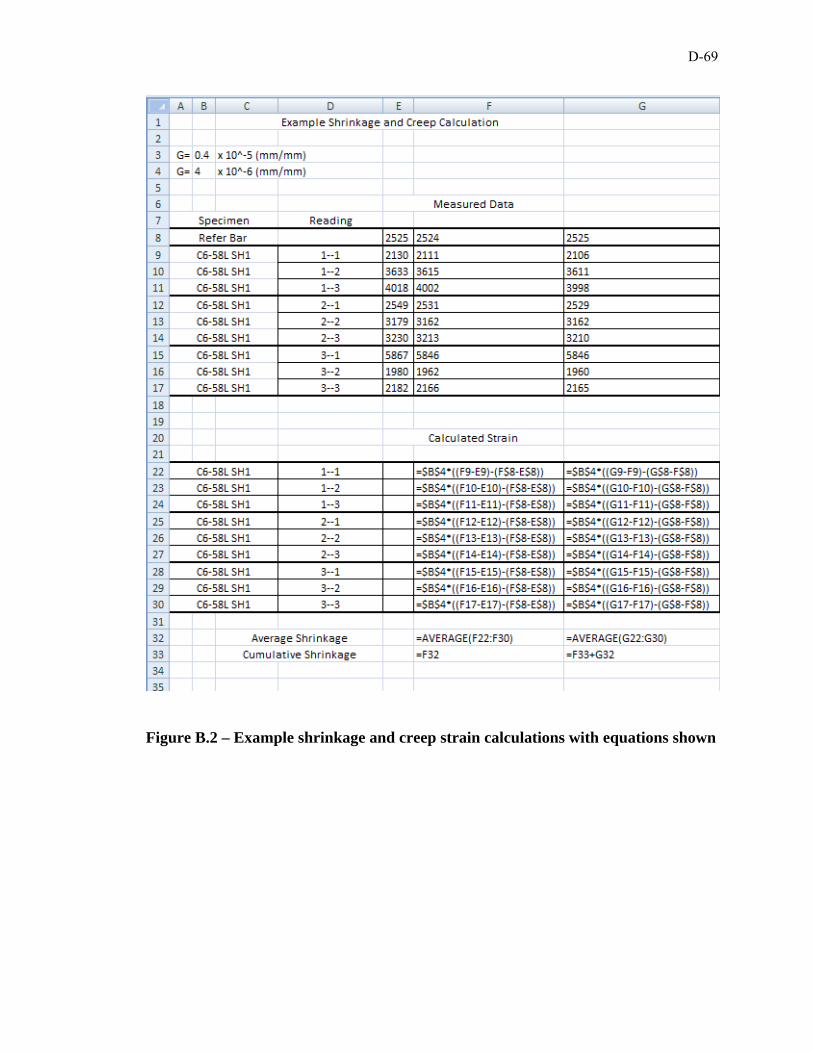
D-69
Figure B.2 – Example shrinkage and creep strain calculations with equations shown

D-70
APPENDIX C.
COEFFICIENT OF VARIATION DATA

D-71
Figure C.1 – C6-58L and S6-48L COV Data

D-72
Figure C.2 – C10-58L and S10-48L COV Data

D-73
BIBLIOGRAPHY
American Concrete Institute (ACI 116R-00) (2000), “Cement and Concrete
Terminology.” American Concrete Institute, Detroit, Michigan. American Concrete Institute (ACI 209R-92) (1997), “Prediction of Creep, Shrinkage, and
Temperature Effects in Concrete Structures.” American Concrete Institute, Detroit, Michigan.
American Concrete Institute (ACI 209.1R-05) (2005), “Report on Factors Affecting
Shinkage and Creep of Hardened Concrete.” American Concrete Institute, Detroit, Michigan.
American Concrete Institute (ACI 237R-07) (2007), “Self-Consolidating Concrete.”
American Concrete Institute, Detroit, Michigan. American Concrete Institute (ACI 318-08) (2008), “Buiding Code Requirements for
Structural Concrete and Commentary.” American Concrete Institute, Detroit, Michigan.
ASTM C31/C31 M-09 (2009). “Standard Practice for Making and Curing Concrete Test
Specimens in the Field.” American Society for Testing and Materials, West Conshohocken, Pennsylvania.
ASTM C39/C39 M-05 (2005). “Standard Test Method for Compressive Strength of
Cylindrical Concrete Specimens.” American Society for Testing and Materials, West Conshohocken, Pennsylvania.
ASTM C157/C157 M-08 (2008). “Standard Practice for Length Change of Hardened
Hydraulic-Cement Mortar and Concrete.” American Society for Testing and Materials, West Conshohocken, Pennsylvania.
ASTM C3512/C512 M-10 (2010). “Standard Practice for Creep of Concrete in
Compression.” American Society for Testing and Materials, West Conshohocken, Pennsylvania.
ASTM C944/C944 M-99 (2005). “Standard Practice for Abrasion Resistance of Concrete
of Mortar Surfaces by the Rotating-Cutter Method.” American Society for Testing and Materials, West Conshohocken, Pennsylvania.

D-74
Bazant, Z. P. and Baweja, S. (2000). “Creep and Shrinkage Prediction Model for Analysis and Design of Concrete Structures: Model B3” Adam Neville Symposium: Creep and Shrinkage—Structural Design Effects, ACI SP–194, A. Al-Manaseer, ed., Am. Concrete Institute, Farmington Hills, Michigan, 2000, 1–83.
Branson, D. E., and Christiason, M. L. (1971) "Time-Dependent Concrete Properties
Related to Design-Strength and Elastic Properties,” Designing for Effects of Creep, Shrinkage, Temperature in Concrete Structures, SP-27, American Concrete Institute, Detroit, MI, pp. 257-277.
Comite Euro – International Du Beton (CEB) (1990), “CEB-FIP Model Code 1990”
Thomas Telford, 1990-1993, 53-58. Fernandez-Gomez, J. and Landsberger, G.A. (2007). “Evaluation of Shrinkage Prediction
Models for Self-Consolidating Concrete.” ACI Materials Journal, October 2007, 464-473.
Freyermuth, C.L. (1969). “Design of Continuous Highway Bridges with Precast,
Prestressed Concrete Girders.” Journal of the Prestressed Concrete Institute, Vol. 14, No. 2, 14-39.
Gardner, N.J., and Lockman, M.J. (2001), “Design Provisions for Drying Shrinkage and
Creep of Normal-Strength Concrete” ACI Materials Journal, 159-167. Holschemacher, K (2004). “Hardened Material Properties of Self-Compacting Concrete”
Journal of Civil Engineering and Management, Vol X, No 4, 261-266. Khayat, K.H., and Mitchell, D. (2009). “Self-Consolidating Concrete for Precast,
Prestressed Concrete Bridge Elements.” National Cooperative Highway Research Program Report 628, Transportation Research Board, Washington, D.C.
Long, W., Khayat, K.H., and Xing, F. (2011). “Autogenous Shrinkage of Prestressed
Self-Consolidating Concrete.” The Open Civil Engineering Journal, 2011, 5, 116-123.
Long, et. al. (2011). “Statistical Models to Predict Fresh and Hardened Properties of Self-
Consolidating Concrete.” RILEM Materials and Structures, 2001. Myers, J.J., Carrasquillo, R.L. (1999). “The Production and Quality Control of High
Performance Concrete in Texas Bridge Structures,” Center for Transportation Research, Report Number 580-589-1, November 1999, pp 564.
Myers, J.J. and Yang, Y. (2004). “High Performance Concrete for Bridge A6130-Route
412 Pemiscot County, MO,” Missouri Department of Transportation, Report RDT 04-016, June 2004.
D-75
Perenchio, W.F., (1997). “The Drying Shrinkage Dilemma-Some Observations and
Questions About Drying Shrinkage and its Consequence,” Concrete Construction, V. 42, No. 4,pp. 379-383.
Schindler, A.K., et. al. (2007). “Properties of Self-Consolidating Concrete for Prestressed
Members.” ACI Materials Journal, January-February 2007, 53-61. Tadros, M.K., Al-Omaishi, N., Seguirant, S.J., and Gallt, J.G. (2003). “Prestress Losses
in Pretensioned High-Strength Concrete Bridge Girders.” National Cooperative Highway Research Program Report 496, Transportation Research Board, National Research Council, Washington, D.C.
Recommended