Sediment Dynamics and the Hydromorphology of Fluvial Systems (Proceedings of a symposium held in Dundee, UK, July 2006). IAHS Publ. 306, 2006.
136
Sediment erosion, transport and deposition during the July 2001 Mawddach extreme flood event GRAHAM HALL & ROGER CRATCHLEY Centre for Arid Zone Studies and School of Agricultural and Forest Sciences, University of Wales, Bangor, Gwynedd LL57 2UW, Wales, UK [email protected] Abstract Modelling has been carried out to investigate sediment redistribution during an estimated 300-year maximal flood event on the River Mawddach, North Wales, on 3 July 2001. Rainfall distribution during the storm has been deduced from a combination of raingauge readings and MM5 mesoscale meteorological modelling. The limited hydrograph data available has been augmented with synthetic hydrographs generated by HEC-1 software. A GSTARS sediment model provides estimates of erosion, transport and deposition during and after the flood event for size classes ranging from fine sand to boulders. Simulation results, consistent with field observations, indicate that erosion predominated throughout the river system, with sand grade material derived from glacial and periglacial deposits making up the majority of the river sediment load. Severe changes in valley profile occurred, particularly at sites where human activity had modified the equilibrium form of the river channel. Success of the modelling activity is heavily dependent on accurate mesoscale rainfall data and sub-catchment hydrographs. Key words cross profile erosion; extreme rainfall; North Wales; sediment transport modelling
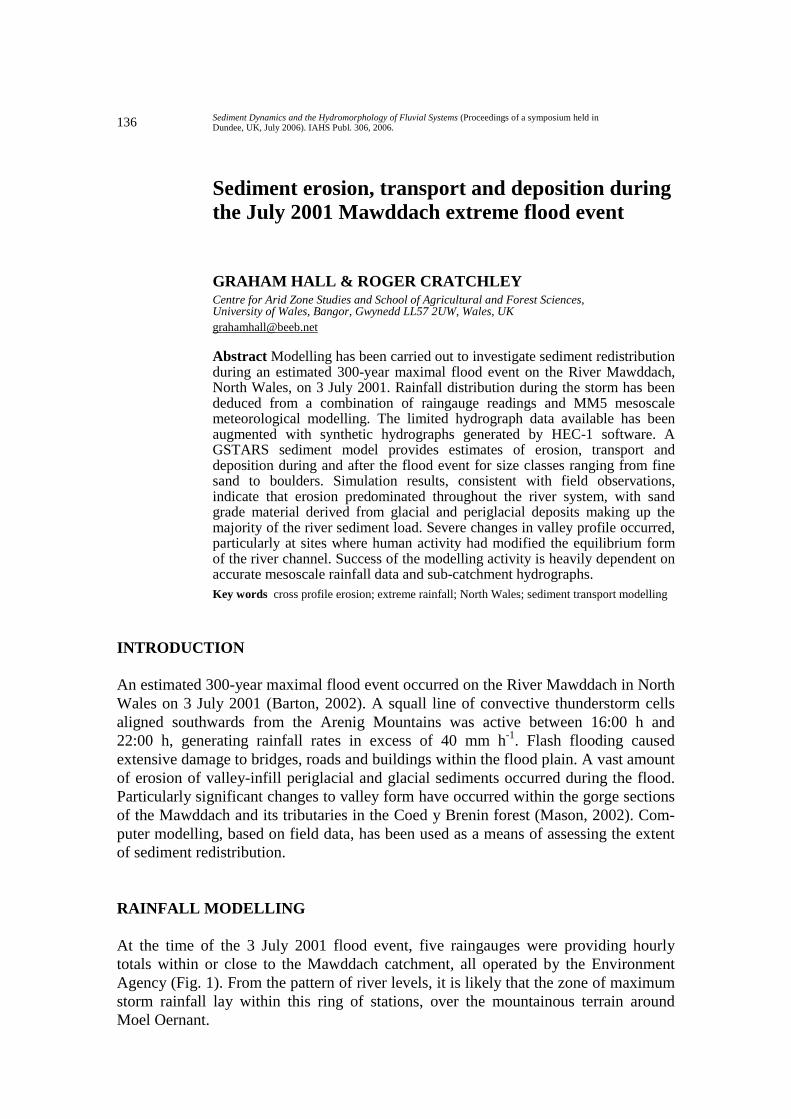
INTRODUCTION An estimated 300-year maximal flood event occurred on the River Mawddach in North Wales on 3 July 2001 (Barton, 2002). A squall line of convective thunderstorm cells aligned southwards from the Arenig Mountains was active between 16:00 h and 22:00 h, generating rainfall rates in excess of 40 mm h-1. Flash flooding caused extensive damage to bridges, roads and buildings within the flood plain. A vast amount of erosion of valley-infill periglacial and glacial sediments occurred during the flood. Particularly significant changes to valley form have occurred within the gorge sections of the Mawddach and its tributaries in the Coed y Brenin forest (Mason, 2002). Com-puter modelling, based on field data, has been used as a means of assessing the extent of sediment redistribution. RAINFALL MODELLING At the time of the 3 July 2001 flood event, five raingauges were providing hourly totals within or close to the Mawddach catchment, all operated by the Environment Agency (Fig. 1). From the pattern of river levels, it is likely that the zone of maximum storm rainfall lay within this ring of stations, over the mountainous terrain around Moel Oernant.
Sediment erosion, transport and deposition during the July 2001 Mawddach extreme flood
137
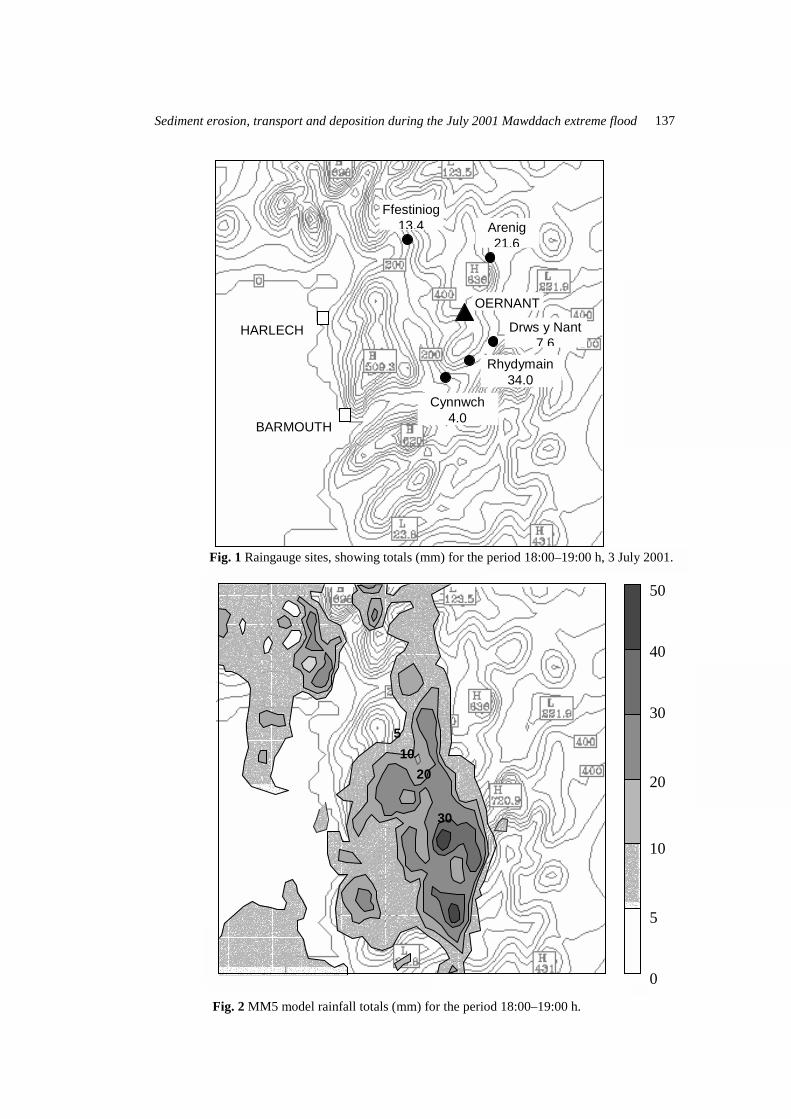
Fig. 2 MM5 model rainfall totals (mm) for the period 18:00–19:00 h.
Ffestiniog13.4 Arenig
21.6
Drws y Nant 7.6
Rhydymain 34.0
Cynnwch 4.0
BARMOUTH
HARLECH
OERNANT
50 40 30 20
10 5 0
105
20
30
Fig. 1 Raingauge sites, showing totals (mm) for the period 18:00–19:00 h, 3 July 2001.

Graham Hall & Roger Cratchley
138
The MM5 mesoscale meteorological model produced by the US Centre for Atmospheric Research (Grell et al., 1995) has been used to obtain further insight into rainfall intensities and distribution during the storm. The system provides a variety of physics-based methods for modelling energy transfer between the ground surface and lower atmosphere, and convective schemes for modelling air motions and rainfall generation within thunderstorms. It is found that the closest correspondence between gauge data and modelled rainfall distribution occurs with the combination of Blackadar planetary boundary layer physics and the Anthes-Kuo convective scheme. An example rainfall prediction for the period 18:00–19:00 h is given in Fig. 2.
Modelling correctly identifies the north–south orientation of the squall line. Localized convective cells with maximum rainfall intensities during the storm of between 45 and 70 mm h-1 are produced. Inaccuracies in the model are likely to be positional, due to the random processes operating within a squall line which make it difficult to predict the exact location where a convective cell will develop. On the basis of field evidence, the convective cells should be displaced approximately 12 km northwards to lie over the southern Arenig plateau. A hypothetical rainfall distribution at Moel Oernant within this area has been constructed (Table 1) and is used in the hydrological model which follows. Table 1 Hourly rainfall totals and total storm rainfall (mm) during the 3 July 2001 storm event.
Ffestiniog Arenig Drws y Nant Rhydymain Llyn Cynnwch Oernant 16:00 0.2 0.4 0 0 5.6 0 17:00 23.6 0 0 6.2 21.6 20 18:00 7.4 17.4 11.4 19.8 13.6 25 19:00 13.4 21.6 7.6 34 4 40 20:00 16 21.4 29.4 25.8 1.2 35 21:00 0.6 0.8 0 0 0 0 22:00 0 0.4 0.2 0.2 1.8 0 Storm total 61.2 62 48.6 86 47.8 120
RIVER DISCHARGE MODELLING Maximum flood levels within the valleys of the Mawddach system have been deduced from flood debris on riverbanks and the height of damage to bridge structures (Fig. 3). A hydrological model was produced using HEC-1 software within the Watershed Modelling System package to generate storm hydrographs for 12 sub-catchments of the Mawddach basin (Fig. 5). HEC-1 is essentially a single storm model which has limited ability to incorporate antecedent conditions (Goldman & Ely, 1990). This was considered adequate for the current application, however, since infiltration-excess runoff was observed over large areas (Fig. 4) and antecedent soil moisture conditions were unlikely to have significantly affected the hydrological processes during the storm event. Runoff was determined in HEC-1 by a unit hydrograph method, with precipitation losses estimated by the US Soil Conservation Service curve numbers method based on

Sediment erosion, transport and deposition during the July 2001 Mawddach extreme flood
139
a mixed woodland-grass land use and clay-loam soils. Rainfall was applied over the model area according to a weighted Thiessen polygon method including estimated gauge totals for the Oernant site in Table 1. River routing then used the Muskingham equation.
Fig. 3 Pont Abergeirw.
Fig. 4 Infiltration-excess runoff in Cwm Prysor.
Graham Hall & Roger Cratchley
140
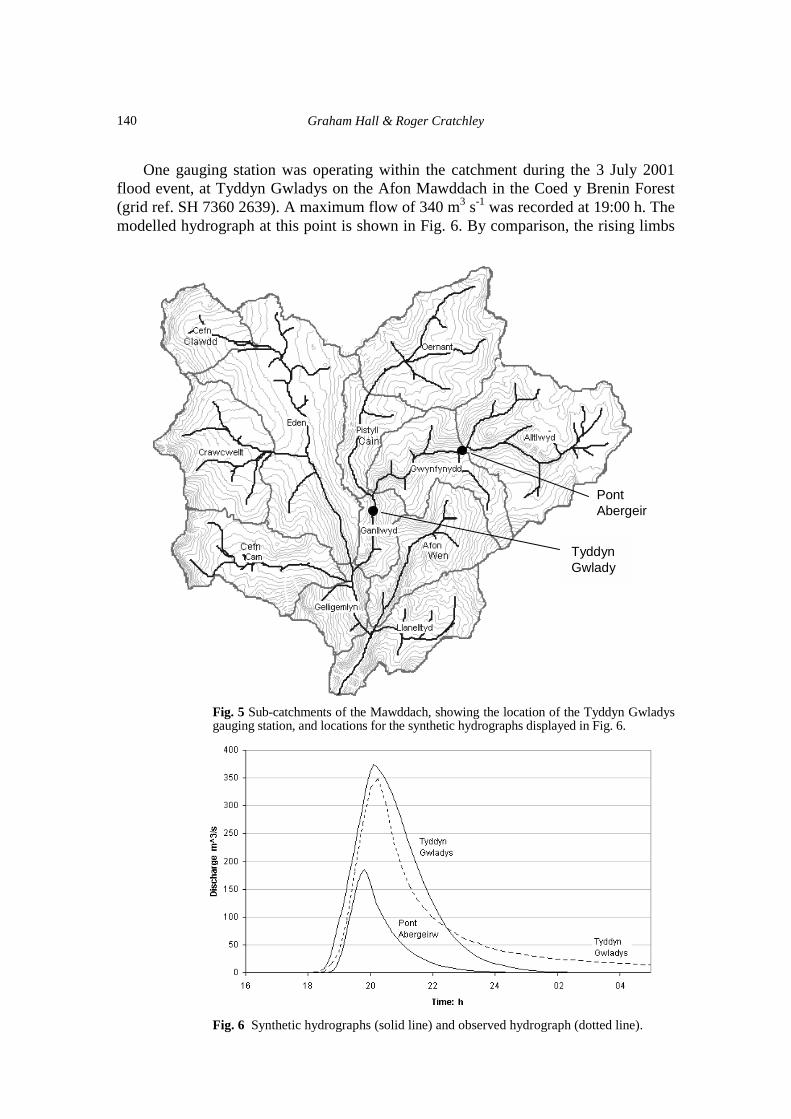
One gauging station was operating within the catchment during the 3 July 2001 flood event, at Tyddyn Gwladys on the Afon Mawddach in the Coed y Brenin Forest (grid ref. SH 7360 2639). A maximum flow of 340 m3 s-1 was recorded at 19:00 h. The modelled hydrograph at this point is shown in Fig. 6. By comparison, the rising limbs
Fig. 5 Sub-catchments of the Mawddach, showing the location of the Tyddyn Gwladys gauging station, and locations for the synthetic hydrographs displayed in Fig. 6.
Fig. 6 Synthetic hydrographs (solid line) and observed hydrograph (dotted line).
Tyddyn Gwlady
Pont Abergeir

Sediment erosion, transport and deposition during the July 2001 Mawddach extreme flood
141
are in reasonable agreement, but the falling limb drops off too steeply in the model. An explanation is the temporary groundwater storage of storm water which is released over the following 24 h (Hall & Cratchley, 2005). However, since a majority of sediment erosion and entrainment is likely to occur at high river discharges, the HEC-1 was considered an adequate means of generating synthetic hydrographs for the ungauged sub-catchments of the Mawddach, as an input to the sediment model. SEDIMENT REDISTRIBUTION MODELLING Modelling of erosion, transport and deposition of river sediment during the July 2001 flood has been carried out using GSTARS (Generalized Stream Tube Alluvial River Simulation) software provided by the US Department of Reclamation (Yang & Simões, 2000). GSTARS is a 1½-dimensional model, reporting erosion and depos-itional volumes within river reaches and computing changes to valley cross profiles at specified points during erosion/deposition events. Channel and flood plain cross profiles are required for the model. These were surveyed in the field, with thalweg base levels determined from a 50-m digital elevation model. Where obvious changes to the cross profile had occurred during the 2001 flood event, the section was restored to the assumed pre-flood profile before running the GSTARS model. Manning roughness coefficients for points across the channel and flood plain were determined by comparison with published photographs of sites of known roughness value (Arcement & Schneider, 2003). The GSTARS model applies energy equations to this data to predict subcritical or supercritical flow conditions within river reaches, and can then compute water surface elevations and flow velocities for stages during the flood event. Five sediment size ranges were chosen for analysis (Table 2). Choice was guided by the gravel nature of most of the Mawddach stream system, and the importance that gravel erosion and deposition appears to play in modifying channel cross profiles. Table 2 Sediment classes.
Sediment grade boundaries Description Class no. (mm) (mm)
0.06 0.8 Silt-coarse sand 1 0.8 4 Very coarse sand-fine gravel 2 4 32 Medium-coarse gravel 3
32 256 Very coarse gravel-cobbles 4 256 2000 Boulders 5 Field measurements of sediment percentages in each size class were required for the channels and river banks at cross section sites. At a number of locations, thick successions of periglacial sands or sandy glacial till have been eroded to form river cliffs, making sand grade material accessible at high levels of river flow. An additional input required by the model was a specification of constraints on horizontal and

Graham Hall & Roger Cratchley
142
vertical erosion for the river channel. At different points, these constraints took the form of rock outcrops, bank reinforcement works and bridge abutments. GSTARS provides a wide choice of sediment transport equations, each suited to particular sediment characteristics. Yang’s sand and gravel formula was selected as giving reliable results for a mixed sediment regime. RESULTS Valley cross-section plots produced by GSTARS appear consistent with profile changes which occurred during the 2001 flood event. An example is the erosion of a river cliff in glacial till at Oernant site 5 (Fig. 10), where vertical and lateral erosion have been simulated, along with deposition on the inner curve of a meander.
Fig. 7 Pre-flood profile (dotted line) and simulated post-flood profile (solid line) at Oernant site 5 marked on Fig. 10.
Fig. 8 Thalweg profiles of the Afon Mawddach and Afon Gain. Horizontal and vertical distances in metres.
245
250
255
260
265
270
275
280
120 140 160 180 200 220 240
Sediment erosion, transport and deposition during the July 2001 Mawddach extreme flood
143
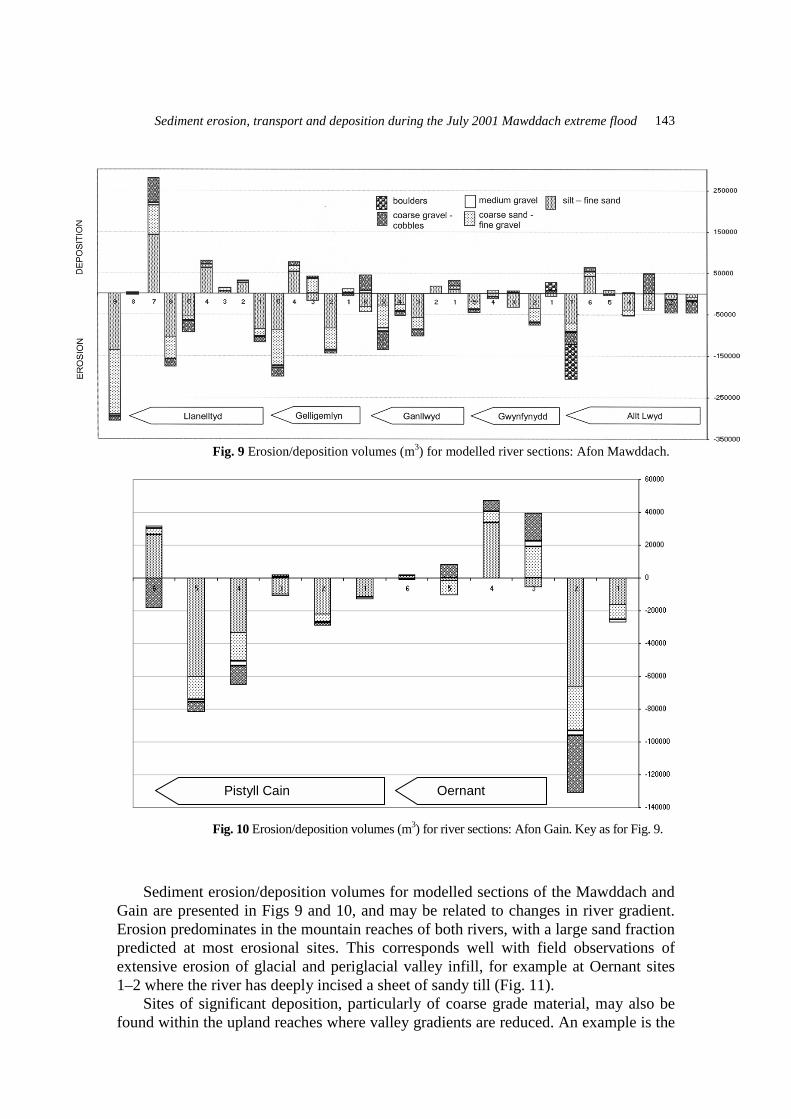
Fig. 9 Erosion/deposition volumes (m3) for modelled river sections: Afon Mawddach.
Fig. 10 Erosion/deposition volumes (m3) for river sections: Afon Gain. Key as for Fig. 9.
Sediment erosion/deposition volumes for modelled sections of the Mawddach and Gain are presented in Figs 9 and 10, and may be related to changes in river gradient. Erosion predominates in the mountain reaches of both rivers, with a large sand fraction predicted at most erosional sites. This corresponds well with field observations of extensive erosion of glacial and periglacial valley infill, for example at Oernant sites 1–2 where the river has deeply incised a sheet of sandy till (Fig. 11). Sites of significant deposition, particularly of coarse grade material, may also be found within the upland reaches where valley gradients are reduced. An example is the
Oernant Pistyll Cain

Graham Hall & Roger Cratchley
144
deposition of gravel on grassland alongside the Afon Gain at Oernant sites 3–4 (Fig. 12). Movement of boulder-grade material is less common, but was predicted for the area of Pont Abergeirw on the upper Mawddach. This site (Fig. 3) has prominent boulder deposits within the channel, derived from glacial till. The simulated hydrograph for Pont Abergeirw indicates a rapid flash flood event close to the centre of the convective storm, where large water discharges from converging high-gradient streams were powerful enough to inflict considerable damage on the historic stone bridge.
Fig. 11 Erosion of glacial till by the Afon Gain at Oernant sites 1–2 marked in Fig. 10.
Fig. 12 Gravel and sand deposition on grassland at Oernant site 4 marked in Fig. 10, along with tree debris washed down from forestry plantations bordering the river.

Sediment erosion, transport and deposition during the July 2001 Mawddach extreme flood
145
Fig. 13 River erosion of a large section of waste tip at the Bedd y Coedwr Mine.
The Mawddach flows through an area of disused metal mines, and considerable quantities of mine spoil were eroded from tips on the river banks (Fig. 13). A section of forestry road along the Mawddach valley within Coed y Brenin was washed away by erosion on the outside of a meander, and has subsequently had to be rebuilt (Fig. 14). These and other sites of erosion were correctly modelled during the GSTARS simulation.
Fig. 14 Section of forestry road rebuilt after the 2001 flood.

Graham Hall & Roger Cratchley
146
Fig. 15 Output of sediment from the Mawddach catchment into the tidal estuary. Legend numbers refer to the sediment classes listed in Table 2: 1, silt-coarse sand; 2, very coarse sand-fine gravel; 3, medium-coarse gravel; 4, very coarse gravel-cobbles; 5, boulders.
Output of sediment from the river system into the Mawddach estuary has been
estimated by the model (Fig. 15). Large amounts of deposition and erosion are recorded for the lower Mawddach close to the tidal limit, which is consistent with field observations of the large unstabilized banks of poorly sorted sand-gravel-cobble sediment which accumulated in this area. Fine sediment output is modelled as continuing at an exceptionally high rate for up to two days after the initial storm event. This is again consistent with field observations. Twelve hours after the storm, the normally gravel bed of the Mawddach at Gelligemlyn was observed to be covered to a depth of several centimetres by coarse to fine sand. This sediment had been washed downstream by the following day and the clean gravel bed restored. CONCLUSIONS The GSTARS modelling program has been valuable in focusing attention on areas of exceptional erosion and deposition within the Mawddach system during the 2001 flood event, and predictions by the model are in good agreement with field observations. Disruption and economic loss was caused during the flood event by high river levels combined with high water velocities, bank erosion, and to a lesser degree, the deposition of sediment around river channels. It is significant that the most severe profile changes occurred where the natural equilibrium channel forms had been modified by mining, roads, bridges and building construction. Combined meteorolog-ical, hydrological and sediment redistribution modelling can provide a valuable tool
Sediment output: Llanelltyd
-5000.0
0.0
5000.0
10000.0
15000.0
20000.0
25000.0
6 12 18 24 30 36 42 48
Hours
Out
put r
ate:
tonn
es/d
ay
Series1Series2Series3Series4Series5
1 2 3 4
Sediment erosion, transport and deposition during the July 2001 Mawddach extreme flood
147
for identifying sites at potential risk from fluvial processes during future flood events on the Mawddach, and may be applied to other mountainous catchments in the region. Experience during the modelling activity has shown that accurate rainfall patterns and sub-catchment hydrographs are required for successful sediment modelling, with results particularly sensitive to the large localized variations which can occur within a mountain area. REFERENCES Arcement G. J. & Schneider V. R. (2003) Guide for selecting Manning’s roughness coefficients for natural channels and
flood plains. US Geological Survey Water Supply Paper 2339. Washington DC, USA. Barton J. (2002) Flooding: past, present and future—a case study of Dolgellau and the Mawddach Catchment. MSc
Dissertation. University of Wales, Bangor, UK (unpublished). Goldman, D. & Ely, P. (1990) HEC-1 Flood hydrograph package user’s manual. Hydrologic Engineering Centre. Davis,
California, USA. Grell G. A., Dudhia, J. & Stauffer, D. R. (1995) A description of the Fifth-generation Penn State/NCAR Mesoscale Model
(MM5). NCAR Technical Note TN-398 + STR. National Centre for Atmospheric Research, Boulder, Colorado, USA. Hall, G. & Cratchley R. (2006) Mechanisms of flooding in the Mawddach catchment. In: Proc. 4th Inter-Celtic
Colloquium on Hydrology and Management of Water Resources (Guimarães, Portugal) (in press). Mason, J. (2002) The July 2001 thunderstorms and their catastrophic effects in Mid-Wales. www.geologywales.co.uk-
/storms. Yang, C. T. & Simões F. J. M. (2000) User’s Manual for GSTARS 2.1 (Generalised Stream Tube model for Alluvial River
Simulation version 2.1). US Department of the Interior Bureau of Reclamation. Denver, Colorado, USA.
Recommended