ASSESSMENT REPORT
Seasonal Precipitation Forecasts Over the Missouri River Basin
An assessment of operational and experimental forecast system skill and reliability
PREFACE ..................................................................................................... 1
EXECUTIVE SUMMARY ............................................................................... 2
1 INTRODUCTION ...................................................................................... 3
2 BACKGROUND ........................................................................................ 3
3 MODELS AND DATA ................................................................................ 7
4 DESCRIPTION OF METRICS .................................................................. 12
5 AVERAGE HISTORICAL SKILL (1982-2009) ............................................ 14
6 HOW DOES SKILL VARY OVER THE MRB? ............................................ 16
7 SUMMARY AND CONCLUSIONS .......................................................... 20
REFERENCES ............................................................................................ 21
AUTHORS
Kathy Pegion1 and Robert Webb2
1 Cooperative Institute for Research in Environmental Sciences (CIRES)University of ColoradoBoulder, Colorado 80309
2 NOAA Office of Oceanic and Atmospheric ResearchEarth System Research LaboratoryPhysical Sciences DivisionBoulder, Colorado 80305
Prepared for the Missouri River Basin Water Management Office and the US Army Corps of Engineers
August 2014
Acknowledgements: Graphic Design, Barb DeLuisi2; Cover Photo by Aimee Castenell, Flickr Creative Commons; Interior cover photo courtesy USACE.
TABLE OF CONTENTS
1
August 2014NOAA Seasonal Precipitation Forecast Asessment Report - Missouri River Basin
PREFACEThis assessment of the predictability of meteorological conditions relevant to the 2011 flood in the Missouri River Basin is a NOAA response to a request by the U.S. Army Corps of Engineers Missouri River Basin Water Management Office and Northwestern Division to provide an expert scientific evaluation of the skill of dynamical predictions of meteorological conditions over the Missouri River Basin on timescales from weeks to seasons.
The effort included climate expertise from the University of Colorado Cooperative Institute for Research in Environmental Sciences (CIRES) and the NOAA Earth System Research Laboratory’s Physical Sciences Division. Given the operational requirement in managing the release or retention of excess water, this research explores the fidelity of model-based predictions of precipitation from mid-to-late summer through the following spring that could provide early warning of late fall moisture conditions, winter snowpack development, and heavy spring rains. The analysis examines a suite of reforecasts from the NOAA operational forecast system and a North American Multi-Model Ensemble (NMME) system. Analyses of the skill and reliability of dynamical predictions focused on meteorological variables, spatial domains and time scales of the extreme conditions that led to the 2011 Missouri River Basin flooding. Consistent with the Secure Water Act (Subtitle F of Public Law 111–11, March 30, 2009) description of NOAA’s role as a source for the credible science required by other agencies, states, and local decision makers, and the private sector, the following report provides an objective, authoritative predictability assessment based on the skill and reliability of forecasts of the meteorological conditions leading to the flooding in the Missouri River Basin. The report also provides an appraisal of the skill and reliability of the state-of-the-art NOAA operational climate forecast system and the experimental NMME to predict seasonal climate conditions relevant to manage flood risk and water supply issues in the Missouri River Basin.
August 2014NOAA Seasonal Precipitation Forecast Assessment Report - Missouri River Basin
2
EXECUTIVE SUMMARYIn 2011, the Missouri River Basin experienced devastating flooding, which caused significant property loss and disrupted thousands of lives. In 2012, the basin experienced extreme drought that impacted water supplies and downstream navigation. Historically, the climate of this region shows a general tendency for both very wet and very dry months in a given year. The ability to accurately predict seasonal flood and drought conditions between one and six months in advance was recognized to be extremely beneficial to water managers, emergency personnel, as well as the general public for planning purposes.
The NOAA Earth System Research Laboratory and the University of Colorado’s Cooperative Institute for Research in Environmental Sciences (CIRES) have performed an assessment study to determine the skill and reliability of current state-of-the-art operational and experimental seasonal forecast systems in predicting the atmospheric conditions that led to the 2011 flood or the 2012 drought. For the study, NOAA operational and experimental modeling systems were analyzed for December 2010 precipitation forecasts for the winter (January-February-March) and spring (April-May-June) of 2011. Likewise, December 2011 precipitation forecasts for 2012 winter and spring were analyzed. These ‘retrospective’ forecasts were compared to actual observations for just the Upper Missouri River Basin, for just the Lower Missouri River Basin, and for the entire Missouri River Basin.
The effects of El Niño and La Niña (together known as ENSO) on seasonal temperature and precipitation are well-known in many part of the U.S.
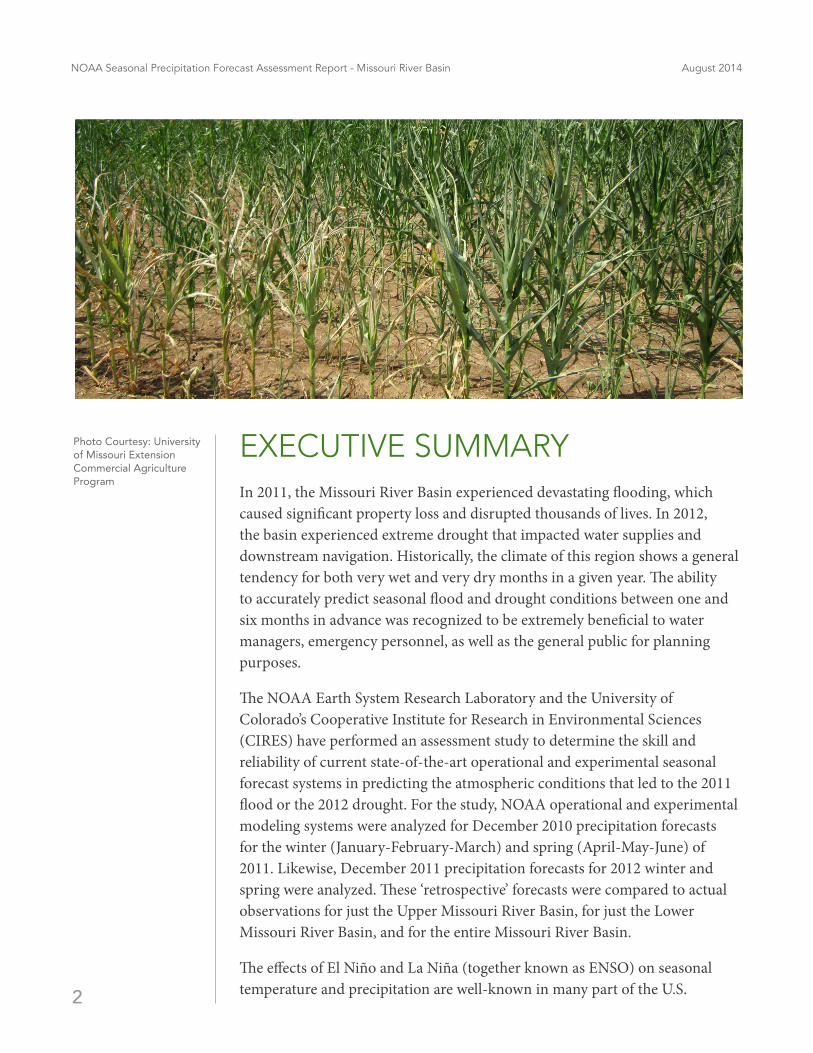
Photo Courtesy: University of Missouri Extension Commercial Agriculture Program
3
August 2014NOAA Seasonal Precipitation Forecast Asessment Report - Missouri River Basin
Previous analyses have found increased forecast skill for the winter and early spring in some regions on the U.S. during El Niño and La Niña events. Thus, as an additional component of the study, data exclusively for neutral, El Niño and La Niña years were analyzed to assess if the forecast skill improved under these conditions.
Monthly and seasonal precipitation in the Upper Basin, in the Lower Basin, and entire Missouri River Basin is highly variable with standard deviations averaging close to 30 percent of the long-term average.
The upper Missouri River Basin received approximately 70 percent more precipitation in May 2011 than would be considered normal based on the monthly climatology. In contrast, during September 2012, rainfall in the upper Missouri River Basin was more than 80 percent below normal for the month, as part of a prolonged dry period lasting from June-September 2012. The lower Missouri River Basin experienced similar wet (2011) and dry (2012) periods to those observed for the Upper Basin, but the precipitation values were not as extreme relative to the monthly long-term averages.
Comparisons of model versus observed precipitation showed similar patterns of wet and dry conditions. However, the forecasts did not provide consistently skillful and reliable predictions of the amplitude and duration of conditions leading to the 2011 flooding and 2012 drought. Thus, the meteorological factors leading to the 2011 flood or the 2012 drought are not accurately predicted at seasonal lead times by current state-of-the-art, operational and experimental forecast systems.
For the lead times and for the times of year of interest, in separate analyses made using all years, only ENSO neutral years, or only La Niña years, the three metrics used to quantify forecast skill in the Missouri River Basin indicate no useful skill in precipitation forecasts for the Upper Basin, for the Lower Basin, or for the entire Missouri River Basin.
The only potentially useful forecast skill was for short lead predictions in the Lower Basin during El Niño events. While perhaps not useful to manage basin-wide flood and water supply risks, analyses did identify potential skill for predictions of precipitation at short lead times during El Niño events in the unregulated lower part of the basin below the mainstem dams. This link between El Niño and precipitation in the Lower Basin may potentially be of value in the Lower Basin to inform a broad range of regional to local regulatory and management practices.
August 2014NOAA Seasonal Precipitation Forecast Assessment Report - Missouri River Basin
4
INTRODUCTIONThe U.S. Army Corps of Engineers (USACE) is responsible for regulation of the reservoirs in the Missouri River Basin (MRB). Advanced knowledge of the potential for flooding or drought may be beneficial to USACE and other agencies to manage flood and water supply risks by informing water releases in this region. In order to provide early warning and inform preparedness, there is a need to understand whether future events could be forecast with sufficient skill to provide useful information for river management decisions in this region. We have therefore conducted a comprehensive assessment of seasonal precipitation skill of current, state-of-the-art models over many years.
Our study investigates the skill of seasonal forecasts of precipitation in the Missouri River Basin with the goal of informing the USACE of the quality of these forecasts. Seasonal outlooks for U.S. temperature and precipitation are issued monthly by the National Centers for Environmental Prediction (NCEP) Climate Prediction Center (CPC) for lead times of 0.5 to 12.5 months (O’Lenic et al. 2008). However, the CPC seasonal outlooks are expert assessments for above, below, or near normal tercile categories, and a long history of these outlooks is not available. Therefore, we use a set of historical reforecasts from the NCEP seasonal prediction model, the Climate Forecast System, version 2 (CFSv2; Saha et al. 2013) and a new experimental seasonal forecast provided by several seasonal prediction models, called the North American Multi-Model Ensemble (NMME; Kirtman et al. 2014), to evaluate the skill of seasonal precipitation forecasts in the Missouri River Basin.
1.
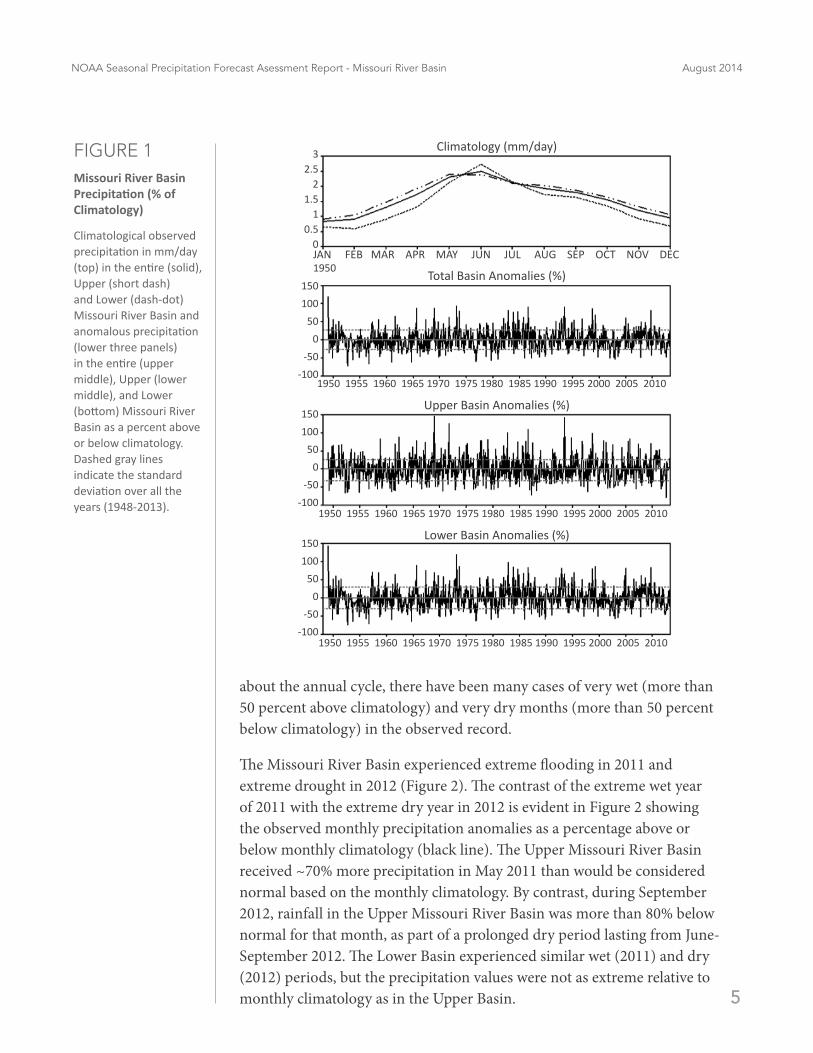
2. BACKGROUND We first evaluated the annual cycle of precipitation in the entire Missouri River Basin (MRB) and the Upper and Lower Basins. The annual cycle of observed precipitation is similar in the Lower, Upper and entire Missouri River Basin (Figure 1, top panel). Climatologically, the precipitation minimum occurs in December and January with less than 1 mm/day in the Upper, Lower, and entire Basin. The precipitation maximum occurs in June for the entire (~2.5 mm/day) and Upper Basin (~2.7 mm/day) and in May for the Lower Basin (~2.5 mm/day). Examination of monthly and seasonal precipitation in the Missouri River Basin (MRB) indicates precipitation is highly variable with average monthly precipitation anomalies in the Upper, Lower, and entire Basin having standard deviations of 27 percent, 33 percent, and 30 percent of climatology, respectively (Figure 1, lower 3 panels). Due to the large variability
5
August 2014NOAA Seasonal Precipitation Forecast Asessment Report - Missouri River Basin
FIGURE 1Missouri River Basin Precipitation (% of Climatology)
Climatological observed precipitation in mm/day (top) in the entire (solid), Upper (short dash) and Lower (dash-dot) Missouri River Basin and anomalous precipitation (lower three panels) in the entire (upper middle), Upper (lower middle), and Lower (bottom) Missouri River Basin as a percent above or below climatology. Dashed gray lines indicate the standard deviation over all the years (1948-2013).
Climatology (mm/day)
Upper Basin Anomalies (%)
JAN FEB MAR APR MAY JUN JUL AUG SEP OCT NOV DEC 1950 Total Basin Anomalies (%)
1950 1955 1960 1965 1970 1975 1980 1985 1990 1995 2000 2005 2010
1950 1955 1960 1965 1970 1975 1980 1985 1990 1995 2000 2005 2010
Lower Basin Anomalies (%)
1950 1955 1960 1965 1970 1975 1980 1985 1990 1995 2000 2005 2010
32.5
21.5
10.5
0
150100
500
-50-100
150100
500
-50-100
150100
500
-50-100
about the annual cycle, there have been many cases of very wet (more than 50 percent above climatology) and very dry months (more than 50 percent below climatology) in the observed record.
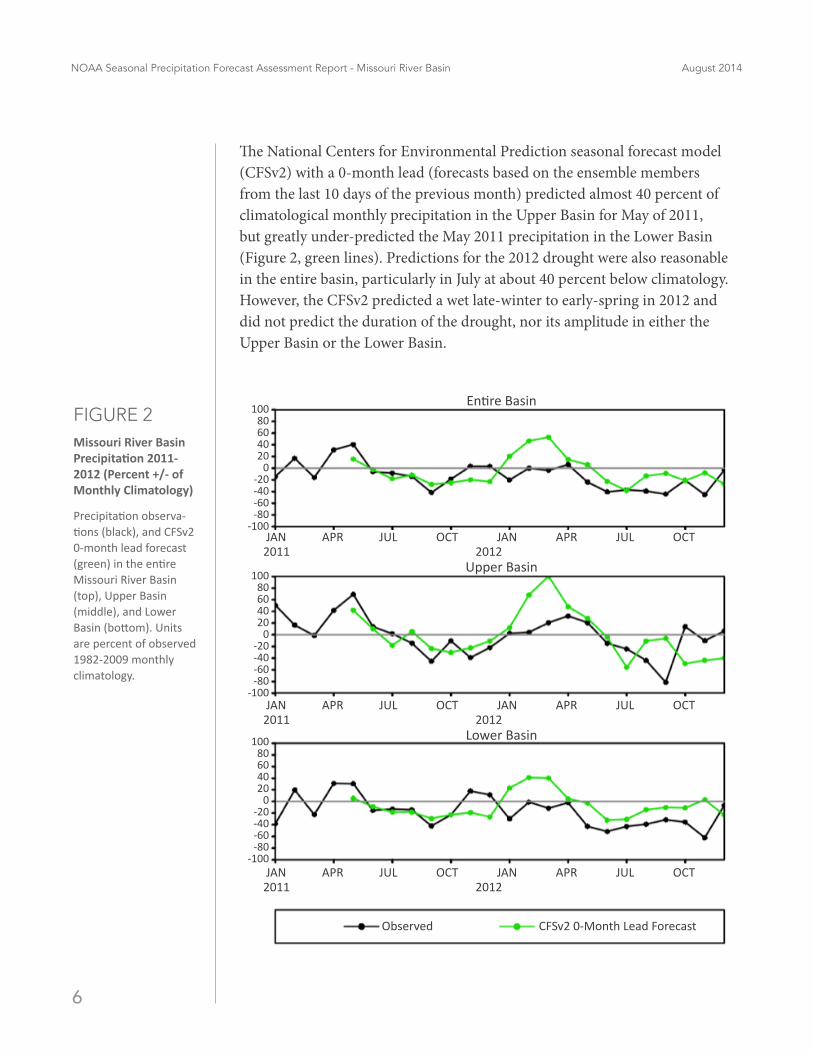
The Missouri River Basin experienced extreme flooding in 2011 and extreme drought in 2012 (Figure 2). The contrast of the extreme wet year of 2011 with the extreme dry year in 2012 is evident in Figure 2 showing the observed monthly precipitation anomalies as a percentage above or below monthly climatology (black line). The Upper Missouri River Basin received ~70% more precipitation in May 2011 than would be considered normal based on the monthly climatology. By contrast, during September 2012, rainfall in the Upper Missouri River Basin was more than 80% below normal for that month, as part of a prolonged dry period lasting from June-September 2012. The Lower Basin experienced similar wet (2011) and dry (2012) periods, but the precipitation values were not as extreme relative to monthly climatology as in the Upper Basin.
August 2014NOAA Seasonal Precipitation Forecast Assessment Report - Missouri River Basin
6
The National Centers for Environmental Prediction seasonal forecast model (CFSv2) with a 0-month lead (forecasts based on the ensemble members from the last 10 days of the previous month) predicted almost 40 percent of climatological monthly precipitation in the Upper Basin for May of 2011, but greatly under-predicted the May 2011 precipitation in the Lower Basin (Figure 2, green lines). Predictions for the 2012 drought were also reasonable in the entire basin, particularly in July at about 40 percent below climatology. However, the CFSv2 predicted a wet late-winter to early-spring in 2012 and did not predict the duration of the drought, nor its amplitude in either the Upper Basin or the Lower Basin.
FIGURE 2Missouri River Basin Precipitation 2011-2012 (Percent +/- of Monthly Climatology)
Precipitation observa-tions (black), and CFSv2 0-month lead forecast (green) in the entire Missouri River Basin (top), Upper Basin (middle), and Lower Basin (bottom). Units are percent of observed 1982-2009 monthly climatology.
JAN APR JUL OCT JAN APR JUL OCT 2011 2012
JAN APR JUL OCT JAN APR JUL OCT 2011 2012
JAN APR JUL OCT JAN APR JUL OCT 2011 2012
Entire Basin
Upper Basin
Lower Basin
Observed CFSv2 0-Month Lead Forecast
10080604020
0-20-40-60-80
-100
10080604020
0-20-40-60-80
-100
10080604020
0-20-40-60-80
-100
7
August 2014NOAA Seasonal Precipitation Forecast Asessment Report - Missouri River Basin
What follows is an assessment of the skill of precipitation prediction in the MRB region using state-of-the-art seasonal prediction models. The models and datasets used in this study are described in section 3. The metrics used to assess the skill are described in section 4. Section 5 presents the results of the skill assessment in terms of average historical skill. Section 6 investigates how the skill varies from year to year and whether there is a relationship between skill in the MRB and the El Niño-Southern Oscillation (ENSO). Section 7 summarizes the results.
3. MODELS AND DATA
3.1 MODELS
A. NCEP/CFSV2We performed our analysis of forecast skill in the Missouri River Basin using the seasonal prediction model from the National Oceanic and Atmospheric Administration, National Weather Service, National Centers for Environmental Prediction (NCEP). This model, the Climate Forecast System version 2 (CFSv2; Saha et al. 2013), is the principal source for NOAA’s dynamical predictions of seasonal climate in the United States. The CFSv2 became operational in March 2011, and forecasts are available from NCEP in real-time at: http://nomads.ncep.noaa.gov/pub/data/nccf/com/cfs/prod/.
To assess the historical skill in the MRB, we used the NCEP/CFS, version 2 (CFSv2) retrospective forecasts (CFSRR; Saha et al. 2013). These reforecasts were made by NCEP for lead times up to nine months over the years 1982-2009, with four initializations (0,6,12,18Z) every five days. This resulted in 24 forecast initializations or ensemble members per month.
B. NORTH AMERICAN MULTI-MODEL ENSEMBLE (NMME)Recently, the NOAA Climate Program Office has supported an experimental forecast project in which a large number of coupled ocean-atmosphere models are run in real time to test the potential for improving seasonal forecasts by using a multi-model ensemble (NMME; Kirtman et al. 2014). The NCEP/CFSv2 model described previously is one of the models participating in the NMME. As part of the first phase of this project, the suite of reforecasts for these models, over the years 1982-
August 2014NOAA Seasonal Precipitation Forecast Assessment Report - Missouri River Basin
8
2009 was made available to the community at http://iridl.ldeo.columbia.edu/SOURCES/.Models/.NMME/. Additionally, the real-time forecasts, beginning in August 2011, are provided to NCEP/CPC on a monthly basis and incorporated into the process of generating their seasonal outlook product. The real-time forecasts are archived and available at http://www.cpc.ncep.noaa.gov/products/NMME/archive/. Seven models participated in the initial phase of the project. Some additional models have been added and some have ceased participating. The details of NMME protocol, each model and globally focused skill assessments can be found in Kirtman et al. (2014). Each of these models provides an ensemble of forecasts initialized each month. The number of ensembles, initialization strategy, and length of each forecast is left up to the modeling center. The number of ensembles ranges from 6 (COLA-RSMAS-CCSM3) to 24 (NCEP/CFSv2). The length of each forecast ranges from 7-12 months. As a result, for lead times up to 7-months, there are forecasts from seven different models, with a total of 89 ensemble members when all models are combined.
The reforecast data provided by the NMME partners from each of the models presented a rich dataset to quantify the average historical skill of precipitation from state-of-the-art seasonal prediction models and to ascertain the potential benefit of using model forecasted seasonal prediction to inform USACE operations in the Missouri River Basin (MRB).
C. OBSERVED PRECIPITATION CLIMATOLOGY AND MODEL BIASESPrior to assessing the skill of the models, it was important to understand what the observed precipitation climatology is in the MRB and to quantify the model errors in representing this climatology.
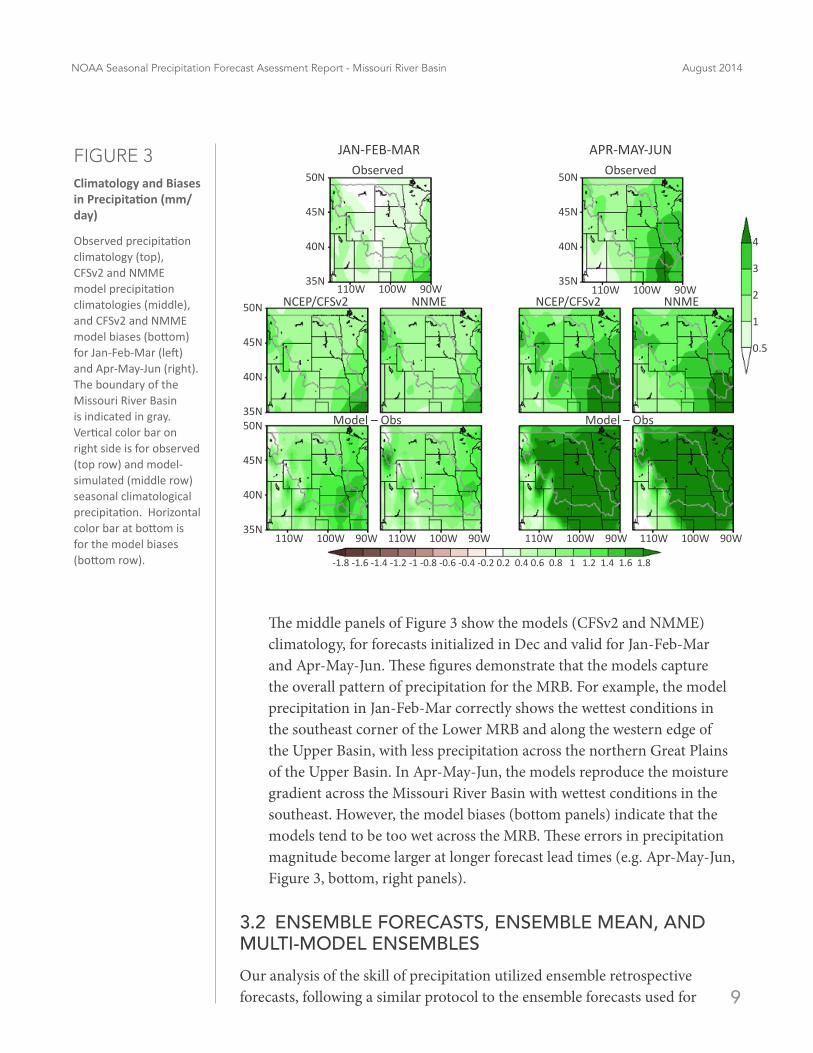
The observed climatological precipitation in the MRB during the seasons of Jan-Feb-Mar and Apr-May-Jun are shown in the top panels of Figure 3 with wettest conditions in the southeastern portion of the Lower Basin and northern Rocky Mountains along the western edge of the Upper MRB. The majority of the MRB receives very little precipitation in Jan-Feb-Mar with most areas less than 1 mm/day. During the spring, precipitation is increased with 3-4 mm/day in the Lower Basin, 2-3 mm/day in the middle part of the basin, and 1-2 mm/day in the Upper Basin.
9
August 2014NOAA Seasonal Precipitation Forecast Asessment Report - Missouri River Basin
The middle panels of Figure 3 show the models (CFSv2 and NMME) climatology, for forecasts initialized in Dec and valid for Jan-Feb-Mar and Apr-May-Jun. These figures demonstrate that the models capture the overall pattern of precipitation for the MRB. For example, the model precipitation in Jan-Feb-Mar correctly shows the wettest conditions in the southeast corner of the Lower MRB and along the western edge of the Upper Basin, with less precipitation across the northern Great Plains of the Upper Basin. In Apr-May-Jun, the models reproduce the moisture gradient across the Missouri River Basin with wettest conditions in the southeast. However, the model biases (bottom panels) indicate that the models tend to be too wet across the MRB. These errors in precipitation magnitude become larger at longer forecast lead times (e.g. Apr-May-Jun, Figure 3, bottom, right panels).
3.2 ENSEMBLE FORECASTS, ENSEMBLE MEAN, AND MULTI-MODEL ENSEMBLESOur analysis of the skill of precipitation utilized ensemble retrospective forecasts, following a similar protocol to the ensemble forecasts used for
FIGURE 3Climatology and Biases in Precipitation (mm/day)
Observed precipitation climatology (top), CFSv2 and NMME model precipitation climatologies (middle), and CFSv2 and NMME model biases (bottom) for Jan-Feb-Mar (left) and Apr-May-Jun (right). The boundary of the Missouri River Basin is indicated in gray. Vertical color bar on right side is for observed (top row) and model-simulated (middle row) seasonal climatological precipitation. Horizontal color bar at bottom is for the model biases (bottom row). -1.8 -1.6 -1.4 -1.2 -1 -0.8 -0.6 -0.4 -0.2 0.2 0.4 0.6 0.8 1 1.2 1.4 1.6 1.8
4
3
2
1
0.5
JAN-FEB-MAR APR-MAY-JUNObserved Observed
NCEP/CFSv2 NNME NCEP/CFSv2 NNME
Model – Obs Model – Obs
50N
45N
40N
35N
50N
45N
40N
35N
50N
45N
40N
35N
50N
45N
40N
35N
110W 100W 90W 110W 100W 90W
110W 100W 90W 110W 100W 90W 110W 100W 90W 110W 100W 90W
August 2014NOAA Seasonal Precipitation Forecast Assessment Report - Missouri River Basin
10
seasonal predictions. Since the atmosphere is chaotic – meaning that even small perturbations in the initial conditions can result in differences in forecasts that are indistinguishable from a random forecast at long lead times – we cannot know or represent the future state of the atmosphere perfectly. Therefore, ensemble forecasts are used to represent the range of possible forecasts given the uncertainties in observations used as initial conditions. The initial conditions for forecasts are perturbed to represent this range of uncertainties. The resulting ensemble of forecasts represents a distribution of possible future states. For example, the envelope of forecasts from the ensemble members may be shifted towards higher precipitation indicating an increased probability of wetter than normal conditions. A common practice when assessing skill and reliability of model forecasts is to use the average of all the ensemble members, known as the ensemble mean, as the single forecast that represents the best available estimate of future conditions (Whitaker and Loughe, 1998).
Within the seasonal prediction community there has been an emphasis on the use of multi-model ensembles as a means to improve seasonal predictions. Because different models have different strengths and weaknesses in predicting certain aspects of the climate, combining the predictions from these models can minimize the weaknesses and take advantages of the strengths. For example, Kirtman and Min (2009) demonstrated a benefit to combining the National Center for Atmospheric Research, Community Climate System Model, version 3 with the NCEP/CFS, version 1 for forecasts of the El Niño Southern Oscillation (ENSO). This improvement was due to the combination of a model that tends to transition from El Niño to La Niña quicker than observed and a model that tends to persist ENSO anomalies longer than observed. When combined, the forecast for ENSO was improved over the forecast from either of the individual models.
3.3 ANOMALIESAll models have a bias or drift as they step forward in time to make a forecast. At initial forecast time, the model climatology is virtually the same as the climatology of the observed climate (referred to as the analysis, as it is a version of the observations assimilated onto the model grid). However, as the forecast steps forward in time, the model forecast climatology will diverge from the analysis climatology. To account for this inherent model drift, it is common practice to remove the forecast climatology from the forecast and the observed climatology from the observations. The resulting model anomalies are then compared with the observed anomalies to assess skill. The forecast climatology is calculated by averaging the reforecasts as a function of initial month and lead time over the years (1982-2009).
11
August 2014NOAA Seasonal Precipitation Forecast Asessment Report - Missouri River Basin
Let Xi,α be the observed seasonal mean for a given season (i) and year (α), then the observed anomalies are computed by removing the climatology calculated by averaging over all M=28 years.
For the model forecast, we calculate the climatology from the ensemble (or average over all ensemble members). The ensemble mean (F) for a given season (i) and year (α) is calculated by averaging the forecasted seasonal mean, Yi,α , over all N=89 ensemble members:
Model forecast anomalies (Fi,j,α) are then calculated by removing the ensemble mean climatology from the model as:
The analysis of forecast skill is performed using the seasonal (i), ensemble mean anomalies, calculated by averaging F’i,j,α over all N=89 ensemble members:
3.4 OBSERVATIONAL DATAThe skill of seasonal precipitation anomalies in the Missouri River Basin was calculated by applying the metrics described below. Assessing skill requires a comparison between what the model predicted and what was observed. We used the NCEP/CPC Unified precipitation (Chen et al. 2002) as the observational dataset to evaluate forecast skill. This dataset is used by CPC to verify their operational seasonal outlook product.
August 2014NOAA Seasonal Precipitation Forecast Assessment Report - Missouri River Basin
12
DESCRIPTION OF METRICSSeveral different skill metrics were used to assess the average historical skill of the NCEP/CFSv2 and NMME in predicting seasonal precipitation. The three metrics are: anomaly correlation (AC), root-mean-square errors (RMSE), and Brier Skill Score (BSS). How they are calculated and their interpretation, are described below. For a detailed reference of the RMSE and anomaly correlation as well as the relationship between these two metrics, see Barnston (1992). For a detailed description of the Brier Skill Score, see Murphy (1973).
4.1 ANOMALY CORRELATIONThe anomaly correlation was used in this study to measure how well the model captures the time series of anomalies for the average precipitation in the entire, Upper, and Lower Missouri River Basin. The formula for the anomaly correlation (AC) as a function of season (i) is:
where the brackets denote averaging over α for M=28 years. In this case, observed (O’i,α) anomalies and ensemble mean forecast (F’i,α) anomalies are first averaged over the Upper, entire, or Lower Basin. The results of these calculations are presented in section 5. It is noted that a common reference of a minimum usable forecast skill requires that the anomaly correlation >= 0.5 (Roads 1986).
4.2 RMSEThe RMSE was used to measure the extent to which the models can capture the amplitude of the observed precipitation anomalies. The RMSE is calculated as:
Similar to the correlation, we calculate and show results for RMSE for the precipitation anomalies averaged over the entire, Upper, and Lower MRB (Section 5). A common reference for minimum usable forecast skill for this metric is RMSE <= 1 (Hollingsworth et al. 1980).
4.

13
August 2014NOAA Seasonal Precipitation Forecast Asessment Report - Missouri River Basin
4.3 BRIER SKILL SCOREThe Brier Skill Score (BSS; Murphy 1973) measures the accuracy of probabilistic forecasts. While the metrics described previously measure the skill in terms of the ensemble mean precipitation anomalies relative to the observation anomalies, the BSS is a measure of how well the ensemble members represent the probability of precipitation being in a specified category. The BSS is similar to the RMSE, but in probability space, and assess skill relative to a reference forecast (e.g., climatology or persistence). We will use the BSS to provide information on how skillful the model forecast probabilities are relative to the skill of using a forecast of climatological precipitation. BSS is calculated by first dividing the observed and modeled precipitation anomalies into terciles (three equally-probable categories: above, below, and near normal). For a given forecast, we calculate what percentage of the ensemble members forecasted each category (Pf,α), and which category actually occurred (Po,α). The squared errors in this probability are summed over all the years. The BSS is calculated by first calculating the Brier Score (BS) as:
The Brier Skill Score (BSS) is then calculated as the Brier Skill (BS) referenced to the climatological BS (BSref), following Murphy (1973):
where BSref is calculated with Po,α=1= 0.3, the climatological probability of the occurrence of any given tercile. For our presentation of BSS, we multiply by 100 to indicate the probability in terms of a percent better or worse than using a climatological forecast.
August 2014NOAA Seasonal Precipitation Forecast Assessment Report - Missouri River Basin
14
AVERAGE HISTORICAL SKILL (1982-2009)
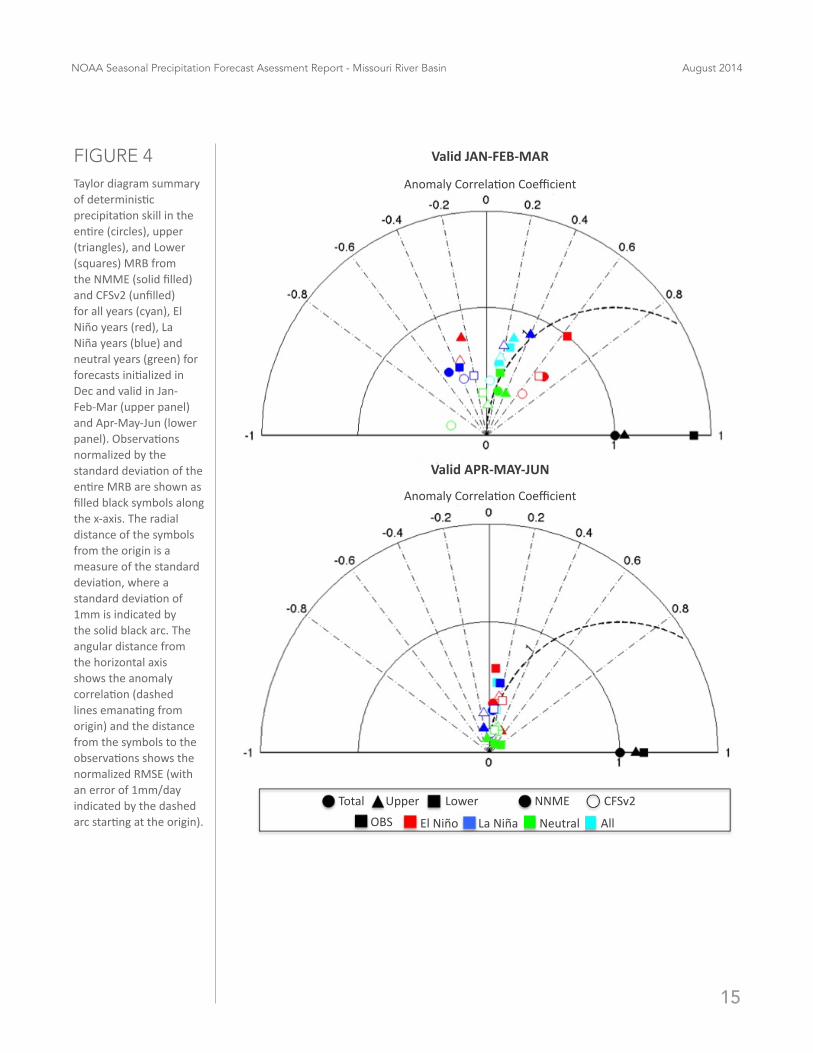
5.1 DETERMINISTIC SKILL – CORRELATION AND RMSETo evaluate the predictability of winter and spring conditions in the MRB, we focused on the skill of forecasts initialized in December and valid for the seasons of Jan-Feb-Mar and Apr-May-Jun. A summary of the correlation and RMSE skill calculations for CFSv2 and NMME reforecasts is presented in the form of a Taylor diagram (Taylor 2001) in Figure 4. In each panel, the symbols represent the skill of precipitation relative to the observations (black symbols along x-axis). The radial distance of the symbols from the origin is a measure of NMME (filled) and CFSv2 (open) standard deviation, normalized by that of the observations. The angular distance from the horizontal axis shows the anomaly correlation and the distance from the symbols to the observations shows the normalized RMSE. The individual colored symbols show the skill for the entire (circle), Upper (triangle) and Lower (square) MRB. The skill is shown for all years (cyan), El Niño years (red), La Niña years (blue), and neutral years (green).
The low skill of predicting precipitation anomalies in the MRB can be seen by looking at the skill of all years (cyan) in the Taylor diagrams of Figure 4. The correlation from the NMME (solid cyan symbols) and CFSv2 (open cyan symbols) for the entire (circles), Upper (triangles), and Lower (squares) Basin have values less than 0.3 for short lead (top panel) and less than 0.2 for long lead (bottom panel) forecasts. For both leads, the RMSE is greater than 1.
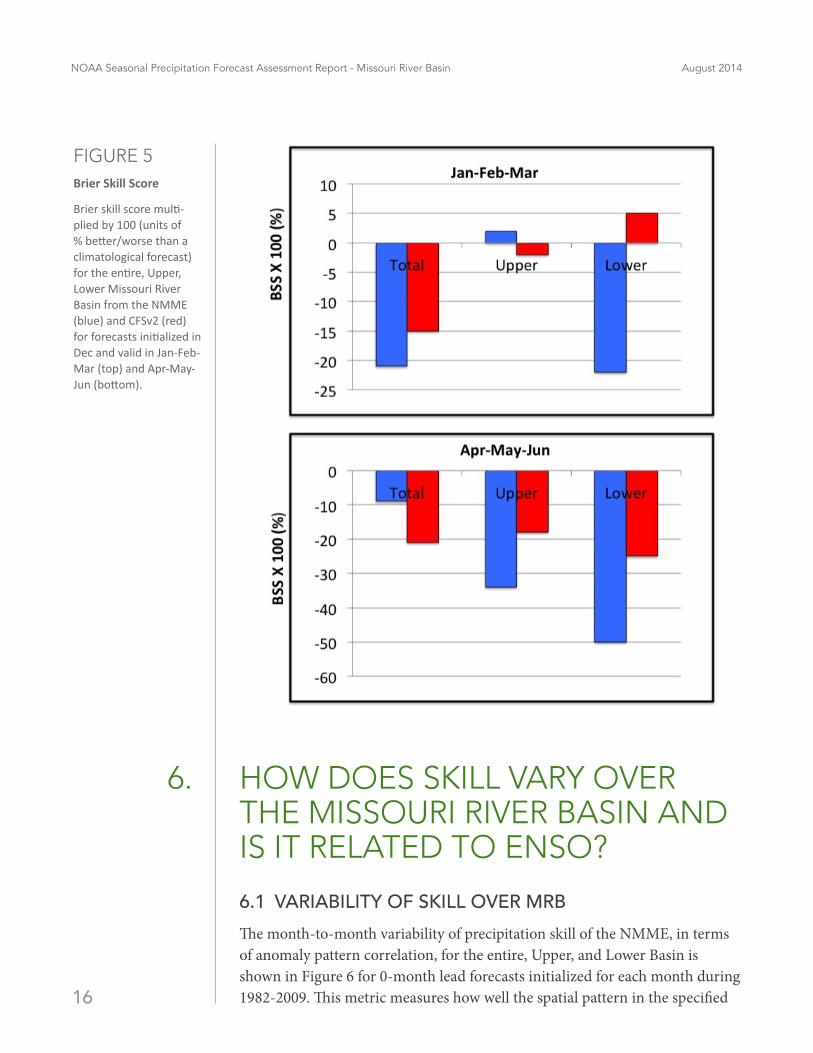
For probabilistic skill, the Brier skill score also indicates that the average historical skill of precipitation in the Missouri River Basin is low (Figure 5). For the entire, Upper, and Lower Basin, the BSS is generally close to or below zero, indicating that the probabilistic skill of precipitation from the models is no better (close to zero), or in many cases worse than using climatology (negative values).
5.
15
August 2014NOAA Seasonal Precipitation Forecast Asessment Report - Missouri River Basin
FIGURE 4Taylor diagram summary of deterministic precipitation skill in the entire (circles), upper (triangles), and Lower (squares) MRB from the NMME (solid filled) and CFSv2 (unfilled) for all years (cyan), El Niño years (red), La Niña years (blue) and neutral years (green) for forecasts initialized in Dec and valid in Jan-Feb-Mar (upper panel) and Apr-May-Jun (lower panel). Observations normalized by the standard deviation of the entire MRB are shown as filled black symbols along the x-axis. The radial distance of the symbols from the origin is a measure of the standard deviation, where a standard deviation of 1mm is indicated by the solid black arc. The angular distance from the horizontal axis shows the anomaly correlation (dashed lines emanating from origin) and the distance from the symbols to the observations shows the normalized RMSE (with an error of 1mm/day indicated by the dashed arc starting at the origin).
Valid JAN-FEB-MAR
Valid APR-MAY-JUN
Anomaly Correlation Coefficient
Anomaly Correlation Coefficient
Total Upper Lower NNME CFSv2OBS El Niño La Niña Neutral All
August 2014NOAA Seasonal Precipitation Forecast Assessment Report - Missouri River Basin
16
HOW DOES SKILL VARY OVER THE MISSOURI RIVER BASIN AND IS IT RELATED TO ENSO?
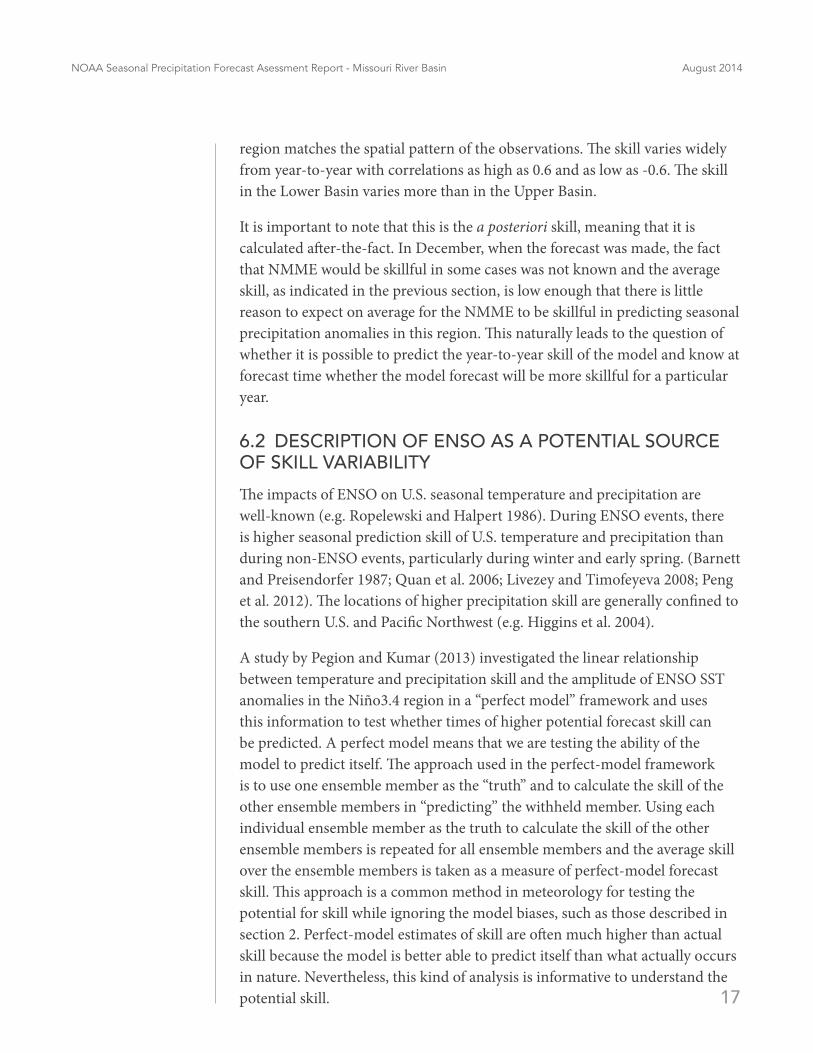
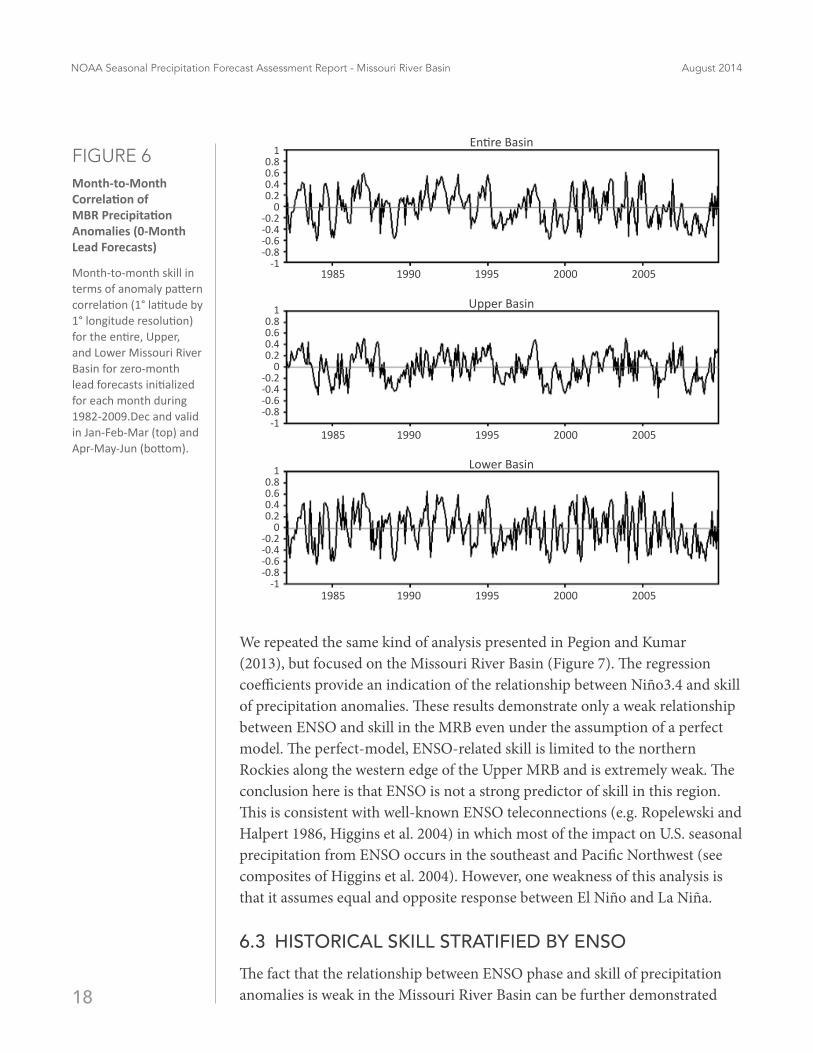
6.1 VARIABILITY OF SKILL OVER MRBThe month-to-month variability of precipitation skill of the NMME, in terms of anomaly pattern correlation, for the entire, Upper, and Lower Basin is shown in Figure 6 for 0-month lead forecasts initialized for each month during 1982-2009. This metric measures how well the spatial pattern in the specified
6.
FIGURE 5Brier Skill Score
Brier skill score multi-plied by 100 (units of % better/worse than a climatological forecast) for the entire, Upper, Lower Missouri River Basin from the NMME (blue) and CFSv2 (red) for forecasts initialized in Dec and valid in Jan-Feb-Mar (top) and Apr-May-Jun (bottom).
17
August 2014NOAA Seasonal Precipitation Forecast Asessment Report - Missouri River Basin
region matches the spatial pattern of the observations. The skill varies widely from year-to-year with correlations as high as 0.6 and as low as -0.6. The skill in the Lower Basin varies more than in the Upper Basin.
It is important to note that this is the a posteriori skill, meaning that it is calculated after-the-fact. In December, when the forecast was made, the fact that NMME would be skillful in some cases was not known and the average skill, as indicated in the previous section, is low enough that there is little reason to expect on average for the NMME to be skillful in predicting seasonal precipitation anomalies in this region. This naturally leads to the question of whether it is possible to predict the year-to-year skill of the model and know at forecast time whether the model forecast will be more skillful for a particular year.
6.2 DESCRIPTION OF ENSO AS A POTENTIAL SOURCE OF SKILL VARIABILITYThe impacts of ENSO on U.S. seasonal temperature and precipitation are well-known (e.g. Ropelewski and Halpert 1986). During ENSO events, there is higher seasonal prediction skill of U.S. temperature and precipitation than during non-ENSO events, particularly during winter and early spring. (Barnett and Preisendorfer 1987; Quan et al. 2006; Livezey and Timofeyeva 2008; Peng et al. 2012). The locations of higher precipitation skill are generally confined to the southern U.S. and Pacific Northwest (e.g. Higgins et al. 2004).
A study by Pegion and Kumar (2013) investigated the linear relationship between temperature and precipitation skill and the amplitude of ENSO SST anomalies in the Niño3.4 region in a “perfect model” framework and uses this information to test whether times of higher potential forecast skill can be predicted. A perfect model means that we are testing the ability of the model to predict itself. The approach used in the perfect-model framework is to use one ensemble member as the ‘‘truth’’ and to calculate the skill of the other ensemble members in ‘‘predicting’’ the withheld member. Using each individual ensemble member as the truth to calculate the skill of the other ensemble members is repeated for all ensemble members and the average skill over the ensemble members is taken as a measure of perfect-model forecast skill. This approach is a common method in meteorology for testing the potential for skill while ignoring the model biases, such as those described in section 2. Perfect-model estimates of skill are often much higher than actual skill because the model is better able to predict itself than what actually occurs in nature. Nevertheless, this kind of analysis is informative to understand the potential skill.
August 2014NOAA Seasonal Precipitation Forecast Assessment Report - Missouri River Basin
18
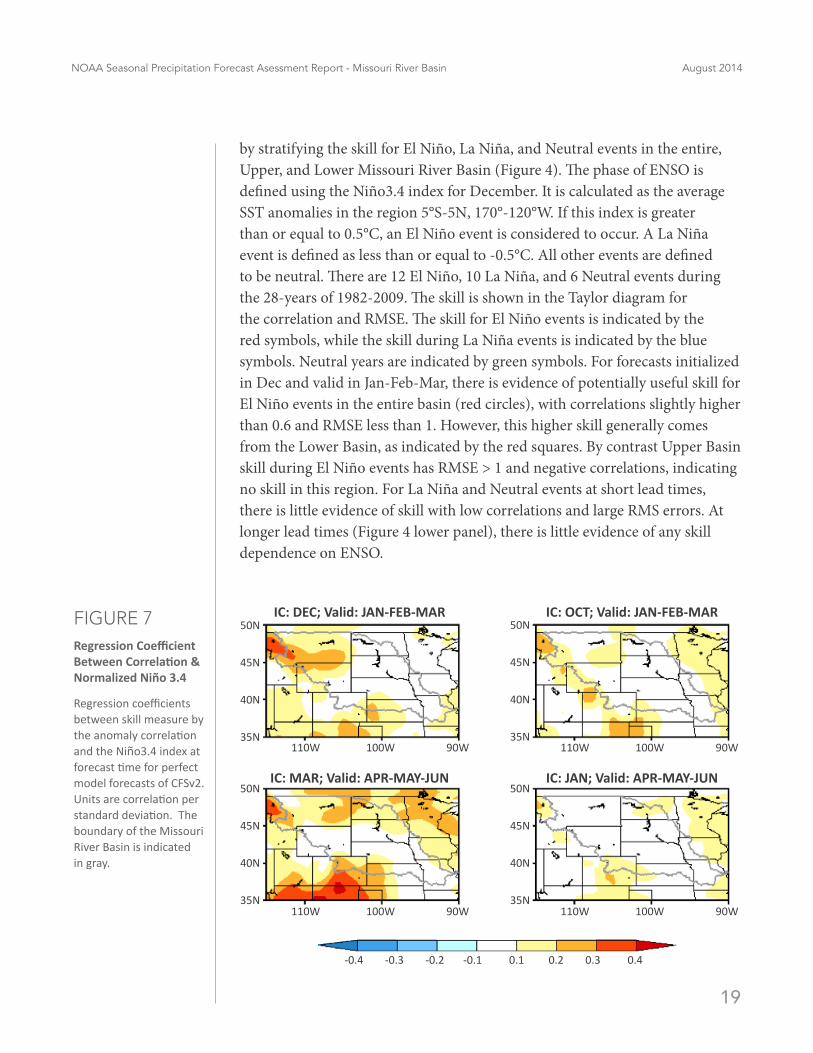
We repeated the same kind of analysis presented in Pegion and Kumar (2013), but focused on the Missouri River Basin (Figure 7). The regression coefficients provide an indication of the relationship between Niño3.4 and skill of precipitation anomalies. These results demonstrate only a weak relationship between ENSO and skill in the MRB even under the assumption of a perfect model. The perfect-model, ENSO-related skill is limited to the northern Rockies along the western edge of the Upper MRB and is extremely weak. The conclusion here is that ENSO is not a strong predictor of skill in this region. This is consistent with well-known ENSO teleconnections (e.g. Ropelewski and Halpert 1986, Higgins et al. 2004) in which most of the impact on U.S. seasonal precipitation from ENSO occurs in the southeast and Pacific Northwest (see composites of Higgins et al. 2004). However, one weakness of this analysis is that it assumes equal and opposite response between El Niño and La Niña.
6.3 HISTORICAL SKILL STRATIFIED BY ENSOThe fact that the relationship between ENSO phase and skill of precipitation anomalies is weak in the Missouri River Basin can be further demonstrated
FIGURE 6Month-to-Month Correlation of MBR Precipitation Anomalies (0-Month Lead Forecasts)
Month-to-month skill in terms of anomaly pattern correlation (1° latitude by 1° longitude resolution) for the entire, Upper, and Lower Missouri River Basin for zero-month lead forecasts initialized for each month during 1982-2009.Dec and valid in Jan-Feb-Mar (top) and Apr-May-Jun (bottom).
1985 1990 1995 2000 2005
10.80.60.40.2
0-0.2-0.4-0.6-0.8
-1
10.80.60.40.2
0-0.2-0.4-0.6-0.8
-1
10.80.60.40.2
0-0.2-0.4-0.6-0.8
-1
1985 1990 1995 2000 2005
1985 1990 1995 2000 2005
Entire Basin
Upper Basin
Lower Basin
19
August 2014NOAA Seasonal Precipitation Forecast Asessment Report - Missouri River Basin
by stratifying the skill for El Niño, La Niña, and Neutral events in the entire, Upper, and Lower Missouri River Basin (Figure 4). The phase of ENSO is defined using the Niño3.4 index for December. It is calculated as the average SST anomalies in the region 5°S-5N, 170°-120°W. If this index is greater than or equal to 0.5°C, an El Niño event is considered to occur. A La Niña event is defined as less than or equal to -0.5°C. All other events are defined to be neutral. There are 12 El Niño, 10 La Niña, and 6 Neutral events during the 28-years of 1982-2009. The skill is shown in the Taylor diagram for the correlation and RMSE. The skill for El Niño events is indicated by the red symbols, while the skill during La Niña events is indicated by the blue symbols. Neutral years are indicated by green symbols. For forecasts initialized in Dec and valid in Jan-Feb-Mar, there is evidence of potentially useful skill for El Niño events in the entire basin (red circles), with correlations slightly higher than 0.6 and RMSE less than 1. However, this higher skill generally comes from the Lower Basin, as indicated by the red squares. By contrast Upper Basin skill during El Niño events has RMSE > 1 and negative correlations, indicating no skill in this region. For La Niña and Neutral events at short lead times, there is little evidence of skill with low correlations and large RMS errors. At longer lead times (Figure 4 lower panel), there is little evidence of any skill dependence on ENSO.
FIGURE 7Regression Coefficient Between Correlation & Normalized Niño 3.4
Regression coefficients between skill measure by the anomaly correlation and the Niño3.4 index at forecast time for perfect model forecasts of CFSv2. Units are correlation per standard deviation. The boundary of the Missouri River Basin is indicated in gray.
IC: DEC; Valid: JAN-FEB-MAR
IC: JAN; Valid: APR-MAY-JUNIC: MAR; Valid: APR-MAY-JUN
IC: OCT; Valid: JAN-FEB-MAR
110W 100W 90W110W 100W 90W
110W 100W 90W110W 100W 90W
50N
45N
40N
35N
50N
45N
40N
35N
50N
45N
40N
35N
50N
45N
40N
35N
-0.4 -0.3 -0.2 -0.1 0.1 0.2 0.3 0.4
August 2014NOAA Seasonal Precipitation Forecast Assessment Report - Missouri River Basin
20
7.
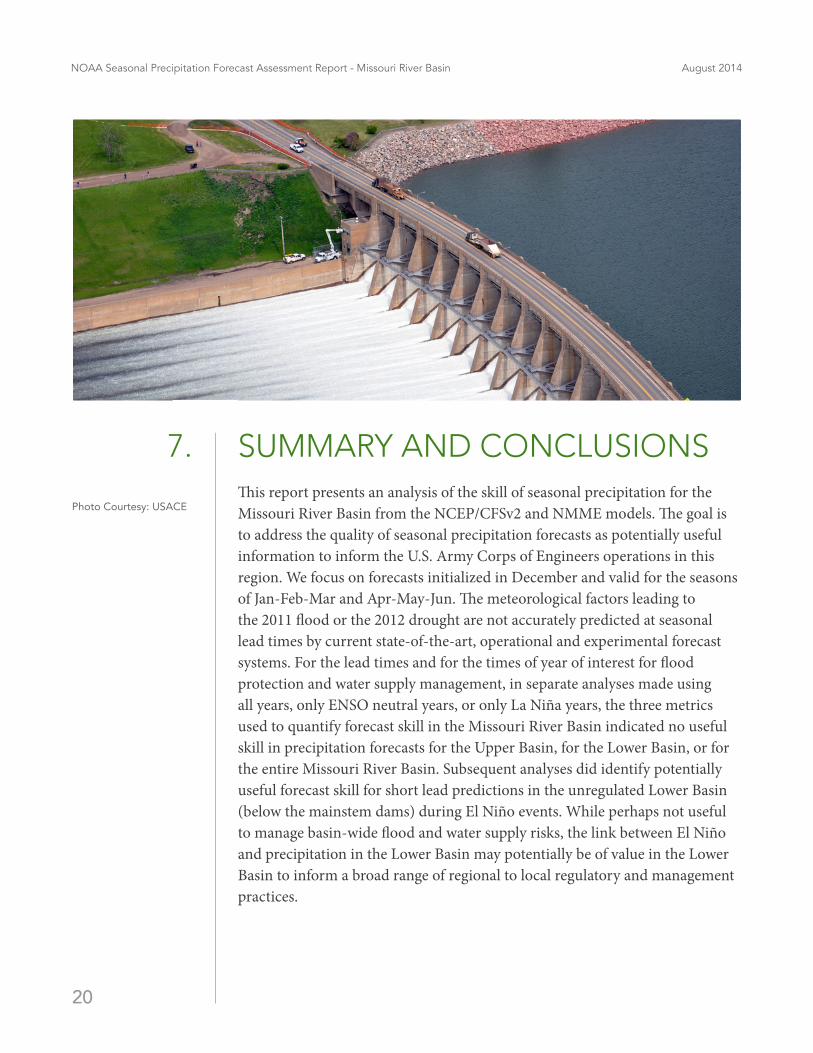
Photo Courtesy: USACE
SUMMARY AND CONCLUSIONSThis report presents an analysis of the skill of seasonal precipitation for the Missouri River Basin from the NCEP/CFSv2 and NMME models. The goal is to address the quality of seasonal precipitation forecasts as potentially useful information to inform the U.S. Army Corps of Engineers operations in this region. We focus on forecasts initialized in December and valid for the seasons of Jan-Feb-Mar and Apr-May-Jun. The meteorological factors leading to the 2011 flood or the 2012 drought are not accurately predicted at seasonal lead times by current state-of-the-art, operational and experimental forecast systems. For the lead times and for the times of year of interest for flood protection and water supply management, in separate analyses made using all years, only ENSO neutral years, or only La Niña years, the three metrics used to quantify forecast skill in the Missouri River Basin indicated no useful skill in precipitation forecasts for the Upper Basin, for the Lower Basin, or for the entire Missouri River Basin. Subsequent analyses did identify potentially useful forecast skill for short lead predictions in the unregulated Lower Basin (below the mainstem dams) during El Niño events. While perhaps not useful to manage basin-wide flood and water supply risks, the link between El Niño and precipitation in the Lower Basin may potentially be of value in the Lower Basin to inform a broad range of regional to local regulatory and management practices.
21
August 2014NOAA Seasonal Precipitation Forecast Asessment Report - Missouri River Basin
REFERENCESBarnett, T. P. and R. Preisendorfer, 1987: Origins and Levels of Monthly and Seasonal Forecast Skill for United States Surface Air Temperatures Determined by Canonical Correlation Analysis, Mon. Wea. Rev., 115, 1825-1950.
Barnston, A. G., 1992: Correspondence among the Correlation, RMSE, and Heidke Forecast Verification Measures; Refinement of the Heidke Score, Weather and Forecasting, 7, 699-709.
Chen, M., P. Xie, and J. E. Janowiak, 2002: Global Land Precipitation: a 50-yr Monthly Analysis Based on Gauge Observations, J. Hydromet., 3, 249-266.
Higgins, R. W. H. -K. Kim, and D. Unger, 2004: Long-Lead Seasonal Temperature and Precipitation Predictions Using Tropical Pacific SST Consolidation Forecasts, 17, J. Climate, 2298-4017.
Hollingsworth, A., K. Arpe, M. Tiedtke, M. Capaldo, And J. Savijarvi, 1980: The performance of a medium-range forecast model in winter – Impact of physical parameterizations. Mon. We. Rev., 108, 1736-1773.
Kirtman, B. P and Coauthors, 2014: The US Multi-Model Ensemble for Intra-Seasonal to Interannual Prediction, Bull. Amer. Met. Soc., 95, 585–601.
Kirtman, B. P. and D. Min, 2009: Multimodel Ensemble ENSO Prediction with CCSM and CFS, Monthly Weather Review, 137, 2908-2930.
Livezey, R. E. and M. M. Timofeyeva, 2008: The First Decade of Long-Lead U.S. Seasonal Forecasts: Insights from a Skill Analysis, Bull. Amer. Meteor. Soc., 89, 843-854. doi: 10.1175/2008BAMS2488.1
Murphy, A. H., 1973: A New Vector Partition of the Probability Score, Journal of Applied Meteorology, 12, 595-600.
O’lenic, E. A., D. A. Unger, M. S. Halpert, and K. S. Pelman, 2008: Developments in Operational Long-Range Climate Prediction at CPC, Wea. Forecasting, 23, 496-515. doi: 10.1175/2007WAF2007042.1
Pegion, K., and A. Kumar, 2013: A Conditional Skill Mask for Improved Seasonal Predictions, Mon. Wea. Rev., 141, 4515–4533.
August 2014NOAA Seasonal Precipitation Forecast Assessment Report - Missouri River Basin
22
Peng, P., A. Kumar, M. S. Halpert, and A. G. Barnston, 2012: An Analysis of CPC’s Operational 0.5-Month Lead Seasonal Outlooks, Wea. Forecasting., 27, 898-917. Doi:10.1175/WAF-D-11-00143.1
Quan, X., M. Hoerling, J. Whitaker, G. Bates, and T. Xu, 2006: Diagnosing Sources of U.S. Seasonal Forecast Skill, J. Climate, 19, 3279-3293.
Roads, J. O., 1986: Forecasts of time averages with a numerical weather prediction model. J. Atmos. Sci., 43, 871-892.
Ropelewski, C. F., and M.S. Halpert, 1986: North American Precipitation and Temperature Patterns Associated with the El Niño/Southern Oscillation (ENSO), Mon. Wea. Rev., 114, 2352-2362.
Saha, S., and Coauthors, 2014: The NCEP Climate Forecast System Version 2. J. Climate, 27, 2185–2208. doi: 10.1175/JCLI-D-12-00823.1
Taylor, K. E., 2001: Summarizing multiple aspects of model performance in a single diagram. J. Geophys. Res., 106, 7183-7192.
Whitaker, J. S., and A. F. Louge, 1998: The relationship between ensemble spread and ensemble mean skill. Mon. Wea. Rev.126, 3292-3302.


Recommended