September 2012
A Research Report on the Relationship between Examination
Practice and Curriculum Objectives in Tanzania
School Children and National
Examinations: Who Fails Who?

i
School Children and National
Examinations: Who Fails Who?
A Research Report on the Relationship between Examination
Practice and Curriculum Objectives in Tanzania
September 2012

ii
Acknowledgements
This research study report is the result of a collaborative effort between HakiElimu and the Depart-ment of Education Psychology and Curriculum Studies of the University of Dar es Salaam. Alongside HakiElimu staff, Dr Kitila Mkumbo of the Department of Education Psychology and Curriculum Stud-ies designed the study. Dr Mkumbo trained staff on data collection procedures and oversaw the research process.
The following HakiElimu staff served as researchers, travelling to the study sites and collecting data: Eliz-abeth Missokia, Godfrey Boniventura, Elisante Kitulo, Charles Mtoi, Florige Lyelu and Phabiana Francis.
This report was written by Dr Kitila Mkumbo. Editing, feedback, recommendations and advice on the report was provided by Elizabeth Missokia, Godfrey Boniventura, Fausta Musokwa, Robert Mihayo and Elisante Kitulo.
This report would not have been possible without the cooperation of the pupils, parents, school commit-tee members, teachers and district officials interviewed in the course of this research. We are extremely grateful for their contribution and willingness to work with us.
© HakiElimu 2012, HakiElimu,PO Box 79401,Dar es Salaam, TanzaniaTel: (255 22) 2151852/3,Fax: (255 22) 2152449
ISBN: 978-9987-18-030-1
Any part of this document may be reproduced for education or non-commercial purposes, provided at-tribution is made to source and two copies are provided to HakiElimu.

iii
Abbreviations
AIDS Acquired Immunodefiency Syndrome
CA Continuous Assessment
DEO District Education Officer
ETP Education and Training Policy
HIV Human Immunodefiency Virus
ICT Information and Communication Technology
MoEVT Ministry of Education and Vocational Training
NECTA National Examinations Council of Tanzania
NSGRP National Strategy for Growth and Reduction of Poverty
TIE Tanzania Institute of Education
URT United Republic of Tanzania

iv
List of Tables and Figures
LIST OF TABLES AND FIGURES
Tables
Table 1: Summary of Participants and Selection Criteria............................................................................ 4
Table 2: Use of Teaching Methods............................................................................................................. 10
Table 3: Percentage of Teachers Reporting Having Attended various aspects of Professional Development.. 11
Table 4: Percentage Coverage per Level of Cognitive Domain in National Form Four
Examinations for Each Subject .................................................................................................. 12
Figures
Figure 1: Percentage of candidates who passed the national examinations at primary and
secondary education levels between 2005 and 2010......................................................... 7
Figure 2: Percentage of teachers indicating having always and often used textual
materials in teaching.............................................................................................................. 7
Figure 3: Percentage of teachers indicating having always and often used non-textual
materials in teaching............................................................................................................... 8
Figure 4: Percentage of teachers indicating the extent to which they have always/often
used various teaching methods............................................................................................ 9
Figure 5: Percentage of questions arranged according to lower and higher levels........................ 13

v
Table of Contents
ABBREVIATIONS....................................................................................................................................... iii
LIST OF TABLES AND FIGURES......................................................................................................... iv
CHAPTER ONE: INTRODUCTION AND BACKGROUND ......................................... 1
1.1 Introduction ................................................................................................................................. 1
1.2 Objectives of the study .............................................................................................................. 2
1.3 Significance of the Study ........................................................................................................... 3
CHAPTER TWO: METHODOLOGY ............................................................................. .... 4
2.1 Approach.............. ........................................................................................................................ 4
2.2 Data collection tools ................................................................................................................... 4
2.3 Participants and selection procedures ...................................................................................... 4
2.4 Study sites ..................................................................................................................................... 5
2.5 Ethical considerations ................................................................................................................. 5
CHAPTER THREE: RESULTS .......................................................................................... 6
3.1 Introduction ................................................................................................................................. 6
3.2 Results of the questionnaire ...................................................................................................... 6
3.2.1 General and background information ........................................................................ 6
3.2.2 Curriculum implementation environment ................................................................. 6
3.2.3 Teaching and learning methods ................................................................................... 8
3.2.4 Assessment methods ..................................................................................................... 8
3.2.5 Alignment of curriculum implementation and assessment .................................... 10
3.2.6 Professional development opportunities ................................................................... 10
3.3 Results of content analysis ......................................................................................................... 11
3.3.1 Types of questions examined ...................................................................................... 11

vi
3.3.2 Alignment of topics covered in examination question papers and in subject
syllabuses ......................................................................................................................... 13
3.4 Results of interviews .................................................................................................................. 14
3.4.1 Introduction .................................................................................................................... 14
3.4.2 Curriculum development process .............................................................................. 14
3.4.3 Teachers’ involvement in curriculum development and examination setting ..... 15
3.4.4 Contribution of the school continuous assessment (CA) to the final grade ...... 16
CHAPTER FOUR: SUMMARY, CONCLUSIONS AND RECOMMENDATIONS......... 18
4.1 Summary ....................................................................................................................................... 18
4.2 Conclusions .................................................................................................................................. 19
4.3 Recommendations ....................................................................................................................... 19
BIBLIOGRAPHY .................................................................................................................. 21
Appendix 1: Topics examined in National Examination Question Papers 2008-2011 ....................... 22
Appendix 1a: Biology ............................................................................................................................ 22
Appendix 1b: Geography ....................................................................................................................... 24
Appendix 1c: Mathematics .................................................................................................................... 26
Appendix 1d: English language ............................................................................................................. 28
Appendix 2: Analysis of national examinations along the Bloom’s Taxonomy ............................. 30
Appendix 2a: Mathematics .................................................................................................................... 30
Year 2010 ....................................................................................................................................... 30
Year 2011 ....................................................................................................................................... 30
Appendix 2b: Biology ............................................................................................................................ 31
Year 2010 ....................................................................................................................................... 31
Year 2011 ....................................................................................................................................... 32
Appendix 2c: Geography ...................................................................................................................... 33
Year 2010 ....................................................................................................................................... 33
Year 2011 ....................................................................................................................................... 34
Appendix 2d: English ............................................................................................................................. 35
Year 2010 ....................................................................................................................................... 35
Year 2011 ....................................................................................................................................... 36

1
Chapter One: Introduction and Background
1.1 Introduction Performance in public national examinations is a critical factor in assessing the quality of education system. In Tanzania, national examinations are organised and administered by the National Examina-tions Council of Tanzania (NECTA). Public examinations serve many purposes. According to Kellaghan and Greaney (2003), they provide a framework for setting and evaluating educational objectives. Public examinations are also useful in assessing the progress of learners in an education system in addition to serving as a benchmark in planning for the next educational steps (Kellaghan, 2004). As observed by Mansel, James and the Assessment Reform Group (2009), public examinations are a powerful indicator of education standards, used to judge individuals and institutions, as well as the extent to which children have learned. In many countries, including Tanzania, public examinations are the only tools used to se-lect students for successive levels in the education system (Kellaghan & Greaney, 2003). Examinations, therefore, are essential instruments in assessing the quality of education and knowledge productivity at various levels (Aas et al., 2009).
Certainly, there are inherent weaknesses in using public examinations for assessing the quality of educa-tion. As Kellaghan and Greaney (2009) observed, examinations are limited in the areas of knowledge and skills they assess. Moreover, examinations cannot be used to assess the knowledge and skills that students need in their everyday life outside school. Studies also show that examinations do not measure achieve-ments at a high taxonomic level, such as application, analysis and synthesis (Kellaghan, 2004).
Statistics show that there has been a declining trend in the proportion of primary school leavers passing Standard VII. The pass rate fell from 70.5 percent in 2006 to 49.4 percent in 2009. The rate slightly went up again in 2010 when 53.1 percent passed (Ministry of Education and Vocational Training [MOEVT, 2010).
Paradoxically, while the pass rates at primary school level have been decreasing, the proportion of pri-mary school leavers selected to join secondary school has been increasing progressively. In 2005, for example, 64.4 percent of the primary school leavers were selected to join secondary education compared to 61.7 percent who actually passed the Standard VII examinations. In 2009, 90.4 percent were selected to join secondary school despite only about 50 percent of the candidates having passed the Standard VII examinations. It is evident that the rise in the number of pupils joining secondary schools is not wholly based on improved performance in Standard VII examinations, but rather on the availability of places. This is probably understandable given the government’s vision towards attaining a universal secondary education by 2025 (United Republic of Tanzania [URT], 2001). But a gloomier picture of the education system performance is seen when one looks at the performance in secondary education examinations. Pass rates in the national form four examinations have been falling consistently and persistently over the past five years. For example, the pass rate dropped from about 90 percent in 2005 to just about 50 percent in 2010 (see Figure 1).

2
0%
10%
20%
30%
40%
50%
60%
70%
80%
90%
100%
2005 2006 2007 2008 2009 2010
Perc
enta
ge
Primary Secondary
Figure 1: Percentage of candidates who passed the national examinations at primary and
Secondary education levels between 2005 and 2010.
For the past five years, and particularly the years 2010 and 2011, students’ performance in the Form Four National Examinations has steadily declined, with the majority of candidates scor-ing between Divisions IV and zero. For example, of the 354, 042 candidates who sat for the 2010 National Form Four Examinations, 177,021 (50 percent) scored Division 0 and 136, 633 (38.6 percent) scored Division IV. Thus 88.6 percent of the candidates scored division IV and 0. Only 15,335 (4.3 percent) candidates scored Divisions I and II! Strictly speaking, therefore, 86. 6 percent of the candidates failed the 2010 National Examinations as they cannot proceed with any further levels of education training. The consequences of these failures are immerse and far-reaching. This is a group that will not only find it very difficult to secure employment but will also be unemployable due to lack of basic numeracy and literacy skills.
There has been much speculation concerning the poor 2010 and 2011 form four National Ex-amination results. ‘Blame’ has been thrown mainly around the lack of teachers and poor teaching and learning environment. But there are schools that have acceptable numbers of qualified teach-ers, their results were nevertheless disappointingly poor. There has been no systematic examina-tion of the factors behind the poor performance in the national public examinations in Tanzania with respect to the linkage between the curriculum implementation and examination practices. In other words, it is not clear how the poor performance in examination can be explained from the perspective of curriculum implementation and the nature of examinations themselves. The main question we asked in this research was ‘Are the school children failing the national examinations or vice versa; that is, are the national examinations failing the school children?’ This study there-fore sought to systematically examine the causes for poor performance among secondary school candidates with a focus on curriculum implementation and examination practices.
1.2 Objectives of the studyThe main objective of this study was to examine “the relationship between examination practice and cur-riculum objectives in Tanzania”. More specifically, the study sought to:
• critically examine the types of examinations offered by NECTA under the current education curriculum;
3
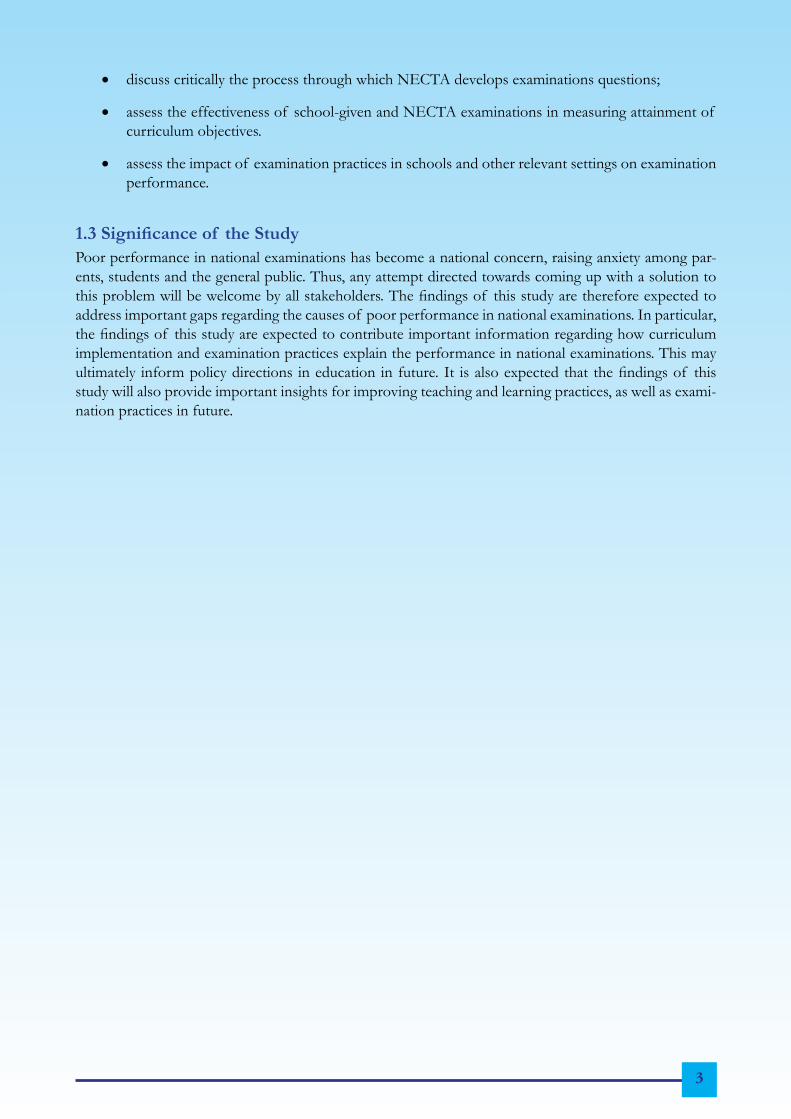
• discuss critically the process through which NECTA develops examinations questions;
• assess the effectiveness of school-given and NECTA examinations in measuring attainment of curriculum objectives.
• assess the impact of examination practices in schools and other relevant settings on examination performance.
1.3 Significance of the StudyPoor performance in national examinations has become a national concern, raising anxiety among par-ents, students and the general public. Thus, any attempt directed towards coming up with a solution to this problem will be welcome by all stakeholders. The findings of this study are therefore expected to address important gaps regarding the causes of poor performance in national examinations. In particular, the findings of this study are expected to contribute important information regarding how curriculum implementation and examination practices explain the performance in national examinations. This may ultimately inform policy directions in education in future. It is also expected that the findings of this study will also provide important insights for improving teaching and learning practices, as well as exami-nation practices in future.
4
Chapter Two: Methodology
2.1 ApproachThis study sought to establish the relationship between examination practice and curriculum objectives. In particular, the study sought to establish how the steady decline in national examination performance may be attributed to the implementation of curriculum objectives. The study examined how the con-tent of examination questions is aligned with the content of the implemented curriculum, and how the examination question setting process takes into account the content and practice of the implemented curriculum.
On the basis of the objectives of the study, two methodological approaches were deemed useful. These are, first, content analysis of the curriculum materials and examination question papers. Secondly, inter-view of selected key informants involved in curriculum development and examination making. Inevita-bly, these were drawn from the Tanzania Institute of Education (TIE), National Examinations Council of Tanzania (NECTA) and teachers in selected secondary schools.
2.2 Data collection toolsThree data collection tools were used in this research. These are highlighted below:
i) Content analysis of curriculum materials and examination papers with a view to establishing linkage and synergies between the two aspects of education processes in Tanzania
ii) Focus group discussions with teachers who have been involved in setting, invigilating and marking examinations, as well as subject teachers. The focus group discussions explored how these informants perceive examination processes in Tanzania, and how these are linked to the implementation of the curriculum
iii) A questionnaire for the purpose of soliciting views and opinions of teachers on the linkage between curriculum practice and examination performance
2.3 Participants and selection proceduresParticipants for this study involved teachers, heads of schools, and officials from the Tanzania Institute of Education (TIE) and National Examinations Council of Tanzania (NECTA). Participants were main-ly selected purposively based on their strategic position in providing relevant information in answering the key objectives and embedded research questions. Table 1 summarises the linkage between objectives and instrument and how participants were selected.
Table 1: Summary of Participants and Selection Criteria
Objectives Instrument Participants Selection Criteria1. To examine the types of
examinations adminis-tered by NECTA
Content analysis and inter-views with examination offi-cials at NECTA
NECTA officials Purposive, on the advice of the NEC-TA
2. To discuss the process through which NECTA develops examination questions
Interview with NECTA of-ficials and teachers who have been involved in examinations setting
NECTA officials
Selected teachers
Purposive on advice of the NECTA of-ficials and Heads of selected schools

5
3. To assess the effective-ness of school given and NECTA examinations in measuring attainment of curriculum objectives
Interview with subject teach-ers
Questionnaire assessing teach-ers’ opinion and effectiveness of school and NECTA exami-nations
Sample of teach-ers of selected schools
Purposive and ran-dom
4. To assess the impact of examination practices in schools and settings on examination perfor-mance
Interviews with heads of schools and other teachers
Physical observation of the teaching and learning contexts in selected schools
Heads and teach-ers of sampled schools
Purpose/random
2.4 Study sitesBecause the education curriculum and national public examination are uniform throughout the country, selection of participating regions was done randomly. However, the schools were selected purposively, selecting four schools based in the headquarters of each selected region. Two schools were the old national schools and two schools were the newly established community schools. These schools were selected purposively on the advice of regional/district education authorities. The selection of study sites were based on the zones established by the Ministry of Educational and Vocational Training (MoEVT). The selected regions were; Mwanza, Tabora, Kilimanjaro, Singida, Morogoro and Iringa.
2.5 Ethical considerationsThis study was conducted in collaboration between the Department of Educational Psychology and Cur-riculum Studies at UDSM and HakiElimu. The ethical clearance was provided by the University of Dar es Salaam Directorate of Research. The introduction letter from UDSM was then used to obtain permission from the respective regional authorities to visit the sampled schools. All ethical guidelines were adhered to, including briefing participants about the objectives of the study, maintaining anonymity and confiden-tiality and ensuring that respondents participated voluntarily having given full consent.

6
Chapter Three: Results
3.1 Introduction To recapitulate, this study addressed four major objectives, namely: to assess the types of examinations administered by NECTA; to examine the process through which NECTA develops examinations; to assess the effectiveness of school and NECTA examinations in measuring attainment of curriculum objectives; and to assess the impact of examination practices in schools and other relevant settings on examination performance.
Inevitably, these objectives required the employment of multiple methods of data collection. Thus, three principal data collection tools were employed to collect data needed to address the objectives. These were content analysis of curriculum materials and examination question papers, interviewing of key stake-holders (curriculum developers, examination officers and teachers) and questionnaires administered to a sample of teachers currently in service. The results reflecting these instruments and the objectives of the study are presented seriatim as follows: questionnaire results, interview results and content analysis results.
3.2 Results of the questionnaireThe questionnaire aimed at assessing teachers’ views about curriculum implementation and how it is associated with examination practices. The questionnaire consisted of the following six main sections: general and background information; curriculum implementation environment; teaching and learning methods; assessment methods; alignment of curriculum and teaching/assessment practice; and profes-sional development opportunities. Below we present the results for each section.
3.2.1 General and background informationOne hundred and seventy eight teachers completed the questionnaire, of whom 55.9 percent were male and 43.5 percent female. The majority of the teachers had teaching qualifications at the level of a bach-elor’s degree (58.4%) or diploma (34.3%).
In a typical week, a teacher taught a mean number of 4.1 classes (SD = 2.3), with the number of classes ranging between one and 15 classes per week. The number of students a teacher handled varied greatly, ranging from 20 to 300 students (mean number of students = 64.8, SD = 44.8). This is far beyond the government approved class size of 45.
3.2.2 Curriculum implementation environmentSince 2005, the Government of the United Republic of Tanzania has been implementing a competence based curriculum, which emphasises the development of certain specified key competences. A set of standards of resources have been identified for effective implementation of a competence based curricu-lum. These include a number of teaching and learning resources such as textbooks, syllabuses, modules and manuals, reference books, charts and maps, newspapers, journals and encyclopaedias, texts in Braille, posters, fliers and photographs and booklets and brochures (Tanzania Institute of Education, 2012, pp. 17-18). In this regard, respondents were provided with several textual and non-textual materials and they were requested to indicate how often they have used such items in teaching. There were five response options, ranging from ‘never to always’.
7
83% 91%
30%
74%
33%
18% 15% 19%
0%
10%
20%
30%
40%
50%
60%
70%
80%
90%
100%
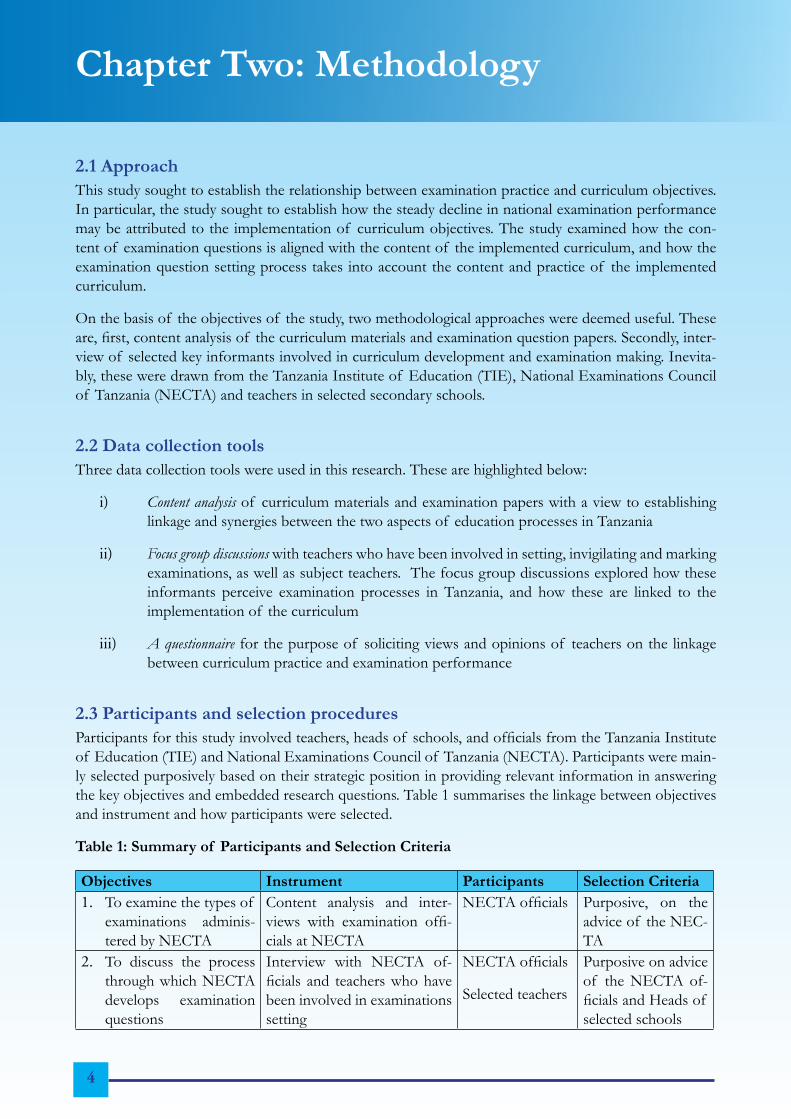
3.2.2.1 Use of textual and non-textual materials in teaching
Respondents were provided with nine items and they were asked to indicate the extent to which they have used these items in teaching. The results are summarised in Figure 2.
The most frequently used items in teaching were books and syllabuses. Less than 40 percent of the teach-ers used other items in teaching. This is clearly therefore one area that is problematic in the implementa-tion of a competence based curriculum. The poor or low use of textual materials in teaching could partly be explained by scarcity of such materials in schools.
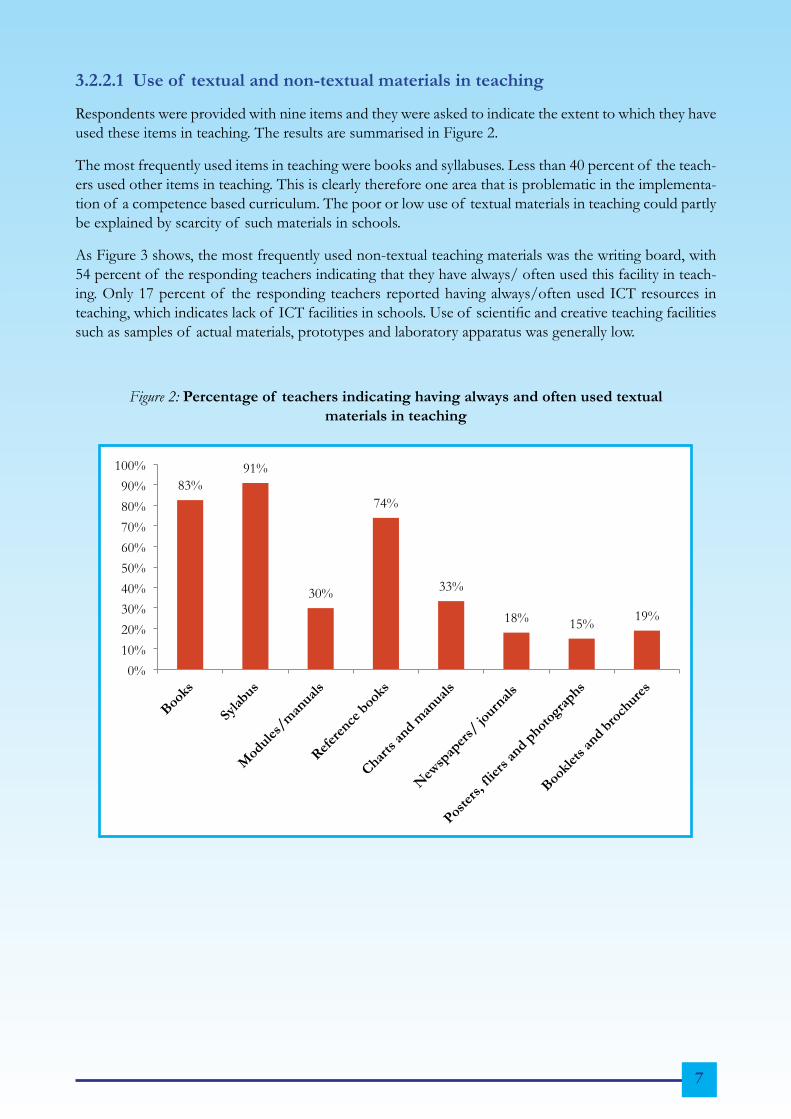
As Figure 3 shows, the most frequently used non-textual teaching materials was the writing board, with 54 percent of the responding teachers indicating that they have always/ often used this facility in teach-ing. Only 17 percent of the responding teachers reported having always/often used ICT resources in teaching, which indicates lack of ICT facilities in schools. Use of scientific and creative teaching facilities such as samples of actual materials, prototypes and laboratory apparatus was generally low.
Figure 2: Percentage of teachers indicating having always and often used textual materials in teaching

8
24%
8%
54%
12%
26%
17%
0%
10%
20%
30%
40%
50%
60%
70%
80%
90%
100%
Laboratory apparatus
Prototypes Writing board Weather stations Samples of actual materials
ICT resources
Figure 3: Percentage of teachers indicating having always and often used non-textual materials in teaching
3.2.3 Teaching and learning methodsCompetence based curriculum emphasises a learner centred approach with a focus on multiple teaching and learning methods. The teaching approach is to encourage learners to be actively involved and take responsibility of their own learning through participatory and interaction teaching and learning methods in the classroom. In this regard, the curriculum envisages several teaching and learning methods. This includes classroom based problem solving and enquiry, demonstrations, debates, group discussions, lec-turing, and conducting searches for relevant materials.
In order to assess the teaching methods employed in their teaching, teachers were provided with a set of teaching methods and were asked to indicate the extent to which they used these methods in their teach-ing, on a five-response option ranging from ‘never’ to ‘always’. The results are summarised in Figure 4.
As Figure 4 shows, teachers reported using a combination of participatory methods in teaching. The most frequently used methods were group work and presentations, problem solving and enquiry and debates and group discussions. Surprisingly, only 35 percent of the responding teachers reported always/often using lecturing. Traditionally, teachers in Tanzania are known to predominantly use lecturing in their teaching and are generally poor in using participatory methods. The contradiction in the results of this study may be attributable to lack of clarity or misinterpretation of the presented teaching methods.
3.2.4 Assessment methodsAssessment in competence based curriculum is part and parcel of the curriculum implementation pro-cess and is supposed to be competence based as well. Several assessment methods are envisaged to be used in competence based curriculum. These include the use of portfolios, rating scales, checklists, oral presentations, project work, practical tasks to demonstrate performance skills, written essays or reports, analysis of texts and in-class tests and end of terms written examinations.
In the light of the above guidelines, respondents were presented with a set of possible assessment meth-ods and were asked to indicate the extent to which they used such methods in assessing their students’

9
69%
57%
31%
56%
26%
60%
70%
35%
0%
10%
20%
30%
40%
50%
60%
70%
80%
90%
100%
performance. There were five response options: 0-15%; 16-30%; 31-45%; 46-60% and 76-100%. The results are summarised in Table 2. The most frequently used methods of assessment were in-class tests and end of terms written examinations, written essays or reports, analysis of texts and practical tasks. Project work and use of portfolios, though envisaged in competence based curriculum as important assessment methods, were among the least used assessment methods by teachers. Conclusively, on this aspect, the assessment methods employed by the majority of teachers were traditional and not wholly competence based.
Figure 4: Percentage of teachers indicating the extent to which they have always/often used various teaching methods

10
Table 2: Use of Teaching Methods
Method% teachers reporting having used various teaching methods by indicated proportion
0-15% 16-30% 31-45% 46-60% 76-100%1. Use of portfolios 35.0 11.7 17.2 23.3 12.92. Use of rating scales 32.9 15.9 22.6 15.9 12.83. Oral presentations 6.5 8.9 17.8 30.8 36.14. Project work 22.2 15.0 25.1 24.0 13.85. Practical tasks 9.5 8.9 19.5 29.6 31.46. Written essays or reports 7.1 6.5 20.7 34.3 31.47. Analysis of texts 8.8 10.5 16.4 29.2 34.58. In-class tests and end of
terms written examina-tions
4.1 1.8 7.0 28.7 58.5
3.2.5 Alignment of curriculum implementation and assessment In a competence based curriculum, the curriculum implementation needs to be aligned with assessment practices. That is, the assessment tasks should reflect what was covered and implemented in the curricu-lum. In order to assess how the assessment practice is aligned with curriculum implementation, teach-ers were asked to comment on several aspects on this regard, including how fair they thought NECTA examinations were, how much they covered the syllabus and whether what was covered in the syllabus was reflected in the examinations.
Overall, the majority of teachers were of the opinion that the NECTA examinations were fair and re-flected what was covered in the syllabus. For example, more than two thirds (68.6%) of the respondents reported that more than 60 percent of the NECTA examination questions were based on the syllabus of the subjects they taught. Additionally, almost 80 percent of teachers reported that they were able to cover the syllabus of the subjects they taught. Furthermore, more than 80 percent of the respondents felt that the NECTA examinations were fair.
3.2.6 Professional development opportunitiesContinuous professional development opportunities for teachers is an important factor in effective im-plementation of competence based curriculum and teachers’ professional development in general. In this regard, teachers were asked to indicate whether they had ever attended professional development training programme in the past five years.
On average, just about a third (33.5%) of the teachers reported to have attended some professional development training opportunity in the past five years. Though the competence based curriculum was introduced way back in 2005, just about a third of the teachers reported to have received any training in this area (See Table 3). Clearly, therefore, the implementation of this curriculum approach is problematic.

11
Table 3: Percentage of Teachers Reporting Having Attended various aspects of Professional Development
Have you ever attended a training programme on: % Yes
1. Developing content knowledge in your subject 39.2%
2. Focusing on understanding students’ thinking and behaviours 30.2%
3. Focusing on teaching strategies 42.1%
4. Focusing on the use of competence based education 37.3%
5. Focusing on how to assess students in competence based education 35.7%
6. Observing other teachers teaching your subject and discuss with them their teaching strategies
40.4%
7. Meeting regularly with a group of teachers in your local area to discuss teaching issues in your subject
37.2%
8. Attending national conference meeting in your subject 5.9%
3.3 Results of content analysisContent analysis was carried out on examination question papers and subject syllabuses to investigate how the topics examined were aligned with the topics covered in syllabuses. In particular, three aspects were looked at. First, what types of questions were examined? Second, how much the topics covered in the examination questions featured in the subject syllabuses? Third, what level of knowledge and com-petences was assessed in the national examination questions? These issues are presented in the sections below.
3.3.1 Types of questions examinedFour subjects were sampled for analysis. These are mathematics, biology (science), geography (social sci-ences) and english language (Languages). The analysis of the type of questions was done with respect to two aspects, namely the structure/format of examination questions and the content focus of the ques-tions.
Regarding the format/structure of the questions, with the exception of mathematics, the national ex-amination papers usually consisted of four types of questions. These are multiple choice items, matching items short answer questions and essay questions. There were no multiple questions for Mathematics, but a variety of questions were adopted which required students to undertake some mathematical calcula-tions.
The content focus of examination questions was analysed with respect to the six levels of Bloom’s Tax-onomy. The Bloom’s Taxonomy is a classification of learning objectives developed by Benjamin Blooms, which categorises learning objectives into three domains, namely cognitive, affective and psychomotor domains. The cognitive domain is further classified into six major levels, namely knowledge, comprehen-sion, application, analysis, synthesis and evaluation. Knowledge and comprehension are categorised as

12
lower levels and the other four aspects are categorised as higher levels of learning achievement. In the context of competence based curriculum, teaching and learning should focus on all the six levels and, as such, assessment of learning achievement should address all these levels as well.
In order to understand the extent to which these six levels are reflected in the examination questions, a team of three experts in education assessed each of the national examination papers of the sampled sub-jects for analysis covering 2010 and 2011 examinations. All the members of the team went through each of the examination question rating each question alongside the six cognitive levels. This process resulted into a matrix indicated in Appendix 2.
The results show that the mathematics examination questions tend to focus on higher levels of learning, with three quarters of the questions assessing application, analysis, synthesis and evaluation, while just about a quarter of the questions focus on knowledge and comprehension. In contrast, the majority of the questions in the biology examination papers tend to focus on knowledge and comprehension, with only 27 percent of the questions addressing the higher levels of learning (application, analysis, synthesis and evaluation). Questions for geography examination papers are fairly evenly distributed around the six levels of learning, though a higher proportion (57%) of questions focuses on knowledge and com-prehension. Most of the questions in the english language examination tend to focus on higher level of learning, with 59 percent of the questions assessing application, analysis, synthesis and evaluation (see Figure 5 and Table 4).
In terms of the level of difficulty, three quarters of questions in Mathematics can be said to be of higher level compared to 59 percent of the questions in english language, 27 percent biology and 43 percent geography. Conclusively, therefore, using the Bloom’s Taxonomy, mathematics examination can be said to be the most difficult examination followed by english language, and biology examinations can be said to be the ‘easiest’.
Table 4: Percentage Coverage per Level of Cognitive Domain in National Form Four Examinations for Each Subject
Subject% Coverage/Domain
Knowledge Comprehension Application Analysis Synthesis Evaluation
Mathematics 13 13 31 16 25 3
Biology 47 26 13 4 6 4
Geography 26 31 5 26 7 5
English 6 35 6 24 0 29

13
26%
73%
57%
41%
75%
27%
43%
59%
0%
10%
20%
30%
40%
50%
60%
70%
80%
90%
100%
Mathematics Biology Geography English
Lower Level Questions Higher Level Questions
Figure 5: Percentage of questions arranged according to lower and higher levels
3.3.2 Alignment of topics covered in examination question papers and in subject syllabuses
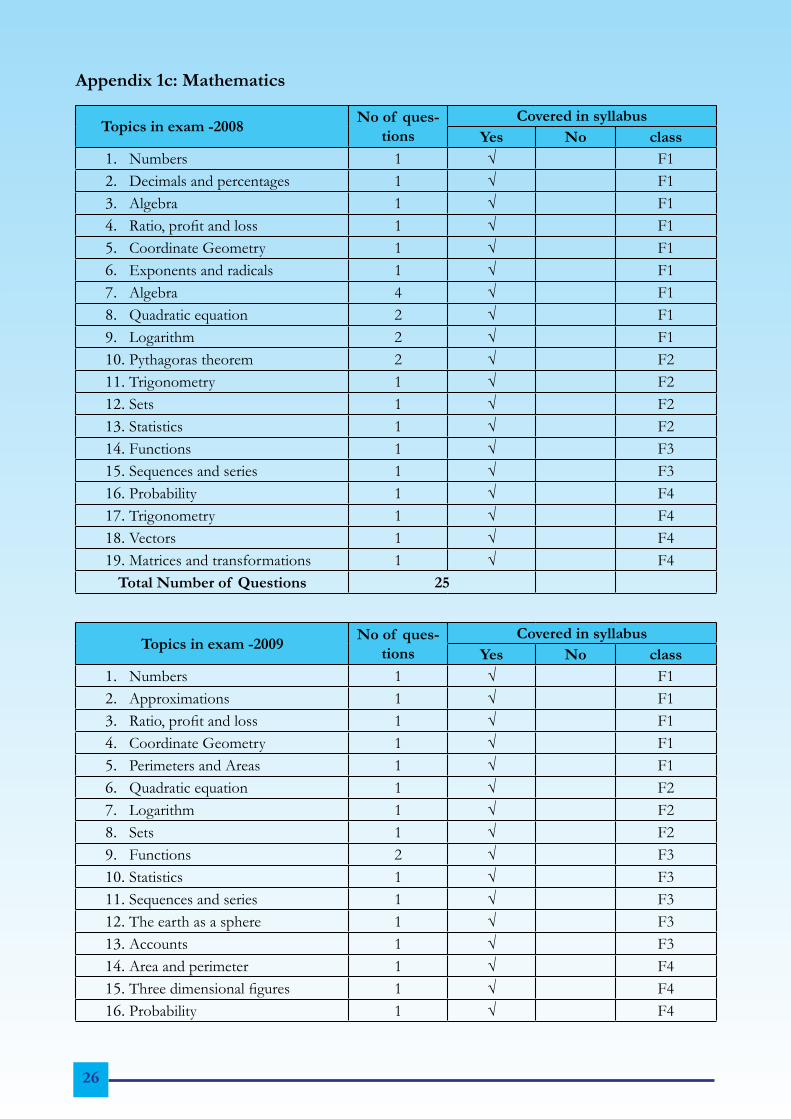
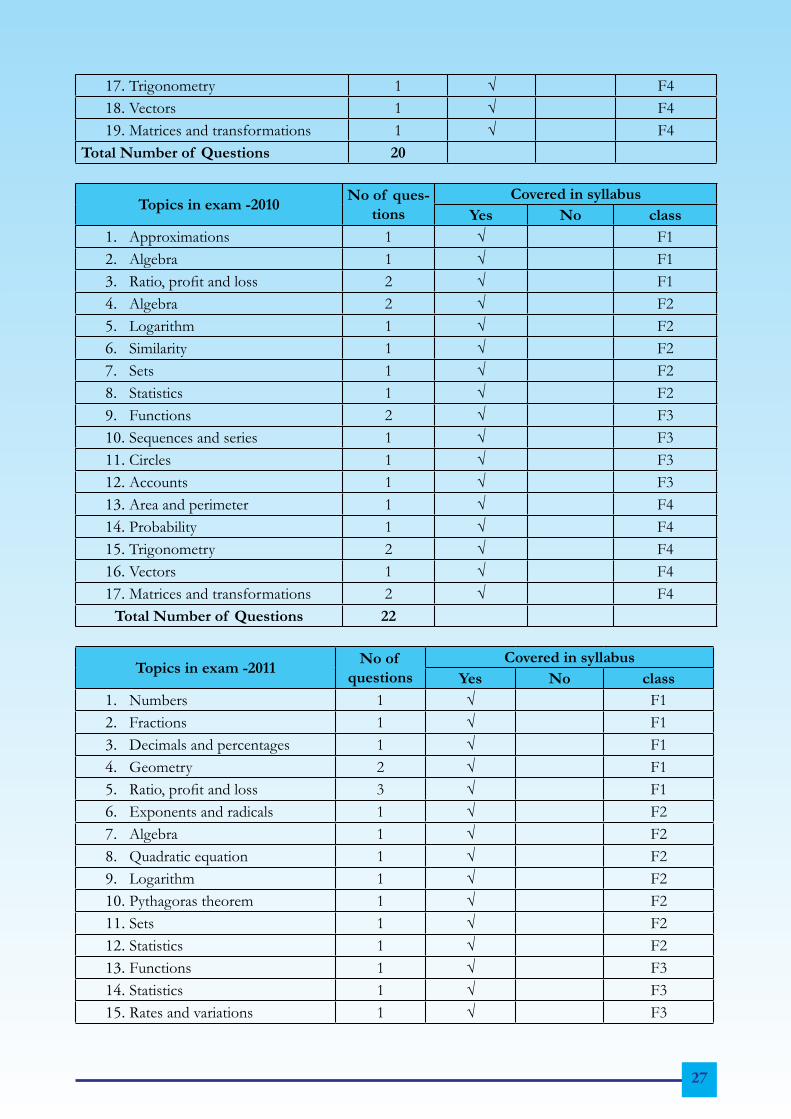
In order to assess the extent to which the topics covered in syllabuses featured in examination question papers, and vice versa, each examination question was examined and a relevant topic listed down. Then the numbers of questions examined in each topic were also listed down. Finally, each examination topic was assessed to see whether it featured in the respective subject syllabus or not. In order to increase the reliability and validity of the content analysis, this assignment was carried out by three researchers and four different examination papers for each subject were analysed for years 2008, 2009, 2010 and 2011.
The results are summarised in Appendix 1. The results show that topics covered in the examination ques-tion papers are generally well reflected in the subject syllabuses. Indeed, almost all topics covered in the examination question papers were included in the subject syllabuses. For example, for geography, all top-ics examined in the question papers were covered in the Geography subject syllabus. This was the same for mathematics and english language subjects. Only one question examined in biology in 2008 and 2009 does not explicitly appear in the biology Syllabus. This question is related to topics on ‘Risk Behaviour’ and ‘Soil’ respectively, which do not explicitly appear in the syllabuses.
Two anomalies are observable. First, some topics tend to be consistently overrepresented in examina-tions. For example, in biology, of the 16 topics examined in 29 questions, five questions (17%) came from one topic (safety in our environment). Similarly, in 2009 biology examination, five questions (16%) came from only one topic (Coordination). Again, in 2009 Geography examination, a quarter of the questions examined came from one topic, namely ‘structure of earth’. This was also the case for the geography examination in 2011, where five questions (20%) came from this topic alone. In the english language examination, much attention seems to be placed on ‘reading literary works, whereby more than a quarter of the questions examined in the four years focused on this topic.
Second, some topics, though they seem to be covered in the syllabuses, are not examined. For example, a topic on HIV/AIDS and sexually transmitted diseases is covered in Biology throughout the four years of secondary education, but it has never been examined, save for year 2008 where there was one question on this topic.

14
3.4 Results of interviews
3.4.1 IntroductionQualitative research was conducted to further understand and follow up on the results of the question-naire and content analysis. This involved focus group discussions with teachers and curriculum devel-opers and face to face interviews with the officials of the National Examinations Council of Tanzania. Interviews were conducted with curriculum developers and examination authorities to understand the processes of developing the curriculum and setting up of examination, as well as the linkage between them.
Seven focus group discussions were conducted, six with secondary school teachers in the participating regions, and one with curriculum developers at the Tanzania Institute of Education (TIE). One inter-view was conducted with a senior official working with the National Examination Council of Tanzania (NECTA).
The proceedings of the interviews and focus group discussions were tape-recorded and transcribed verbatim. The transcriptions were read several times until patterns started to emerge and codes and themes were identified. The themes formed the basis of the analysis for understanding the context of the interviewees’ views. Three major themes relevant to the objectives of the study were identified during the analysis of qualitative data. These were curriculum development process, teachers’ involvement in curriculum development and examination setting and the role and contribution of school given examina-tions in the final assessment of candidates. These are highlighted and illustrated below.
3.4.2 Curriculum development processDuring focus group discussions participants explained that curriculum development involved three key processes, namely review of national policy documents, needs assessment and preparation of draft sub-ject syllabuses and other accompanying relevant curriculum materials such as teachers’ teaching guides and manuals. In this process, several national philosophy and policy framework documents are reviewed. These include Education Training Policy (ETP), education sector development plan, the National Strat-egy for Growth and Reduction of Poverty (NSGRP) and National Vision 2025. Participants’ remarks about the key processes adopted in curriculum development in Tanzania are illustrated below.
“…as we have said curriculum development passes through the following processes. First you review the national policy documents and conduct research to collect ideas from various education stakeholders. Then you develop a draft curriculum and the curricular materials. Thirdly, you pilot the developed cur-riculum and its materials. You involve the stakeholders. Then the fourth thing you orient teachers and then implementation. Then the fifth thing is monitoring. What comes next is examining the curriculum, however, in the process you assess. Lastly you review. This is what actually happens”.
“…basically the process starts with the understanding of the national education philosophy right ….national education philosophy…You have got the policy that stands there, and you come and say which are national government documents which interpret this policy, so the first document is the educa-tion for self-reliance, what does it say about education, what does it say has been the major competence the kid, the child should be given or should acquire right. If you have gone through the education training policy you will find a list of competences, the list of critical skills which have been stipulated…”
“…you have to go to what people, the audience say, right, what are the parents saying, what are the policy makers are saying, what are the curriculum developers saying, what are the university lecturers saying, what are the employers saying, what are they saying. So what we usually do we make sure we conduct research the way you are doing to gather ideas from them yes…to gather ideas around the issues

15
stipulated in the national philosophy document, national policy document and in various development programs right”.
“….After the study you come back here you put the notes you prepare the research report.Of course the major reflection of this is made of recommendations once you have the research report plus the recom-mendation. You call a dissemination workshop and this dissemination workshop has to be represented by the people who participated in the study from the university, NECTA, Ministry, from school, from among stakeholders who run education in this country, inspectors, and tell them that this is what the respondents across the country said…”
3.4.3 Teachers’ involvement in curriculum development and examination settingCurriculum development process requires that the key stakeholders such as teachers should be fully involved in the development and implementation process. When teachers are adequately involved in the development of the curriculum, they tend to implement the curriculum more enthusiastically and optimistically (Ramparsad, 2001). Generally, teachers reported that they are seldom involved in the cur-riculum development process. Teachers complained that the curriculum they implement was prepared in a top-down approach and in many cases it is not relevant to their context and they don’t feel part of it. Some of the teachers’ comments in this regard are illustrated below.
“To be honest, I haven’t been involved, what I know is that teachers are completely not involved in anyhow”.
“Most of the time we are just told to implement but we are not involved at all in this process of prepar-ing the curriculum. If we were involved, then it could be just few teachers and especially those in Dar es Salaam or in big cities rather than those in interior areas”.
“…. the curriculum planners just choose a few representatives to join the panel in this process. But this type of participation is not enough”.
“No one was involved in developing these materials, and this could be the main reason for students’ failure because we are just implementing what had been set by the ministry. They just provide us with text books to use without giving us seminars on how to implement the new curriculum. May be teachers in Dar es Salaam are involved”.
Teachers also observed that, while the focus of the curriculum has recently changed from content to competence based, they have never been given any orientation on the philosophy of this curriculum and how to implement it in the actual classroom teaching. As a result teachers were implementing the cur-riculum based on their experiences. Indeed, many teachers expressed that they were not even clear with the concept of competence based curriculum. Under these circumstances, it cannot be expected that teachers will be able to implement such a curriculum effectively. Some of participants’ comments are quoted below.
“This (orientation) does not or happens very rarely because of the available constraints in various re-sources. It is the ministry that is supposed to avail capacity building resources. Now if the ministry and the government do not have adequate resources here we are. So you could find a teacher in secondary school implementing a revised curriculum without having been given any orientation, without having been pre-pared….And this is basically over all, almost 99% of secondary school teachers in the country have not been inducted not been prepared for the reviewed curriculum” (Teacher).

16
Secondary school teachers were not oriented on a newly (2005) developed curriculum because we did not have funds. Therefore implementation started without orientation. It is just God’s blessings which make teachers do what they are doing. It is their efforts for sure…we told them that you can start anyhow…” (Curriculum developer)
“…our curriculum has been changed from content based to competence based curriculum, but teachers have not been trained on how to implement it. You find a teacher cannot distinguish content and competent curriculum in teaching environment” (curriculum developer).
“…Teachers are just provided with the ready-made curriculum. Curriculum developers just come and tell us now it is competence based curriculum or it is this and that…how do you deliver the material in the sense of competence based curriculum if you were not trained or oriented to the new curriculum”? (Teacher)
“No I was not involved and this could be the main reason for students’ failure because we are just imple-menting what had been set by the ministry. They just provide us with text books to use without giving us seminars on how to implement the new curriculum. May be teachers in Dar es Salaam are involved”.
Regarding examination setting, two main issues were examined. First, the study sought to understand the key processes and procedures involved in setting up national examinations. Secondly, the study sought to establish the role and contribution of the school continuous assessment towards the final examination grades. To gather the necessary information in this regard, curriculum developers, teachers and examina-tion officials were interviewed.
To understand the processes involved in setting national examination administered by NECTA, a senior official from NECTA was interviewed. Though the interviewee was reluctant in providing much detail regarding the examination setting processes, he provided some useful guidelines. According to the NEC-TA official, four main processes are involved in setting up national examinations in Tanzania. These are setting examination items, moderation, typesetting, and finalization.
Setting of examinations is done by a few carefully selected professionals including, teachers and curricu-lum developers. The role of these setters is basically to set examination items based on the curriculum in implementation. It was further reported that after this process the items were expected to be moderated by a few selected moderators who were professional teachers and other academicians. After moderation typesetting of examination and finalization follow.
It is expected that curriculum developers and examination setters work hand in hand in examination set-ting. In this regard, during interviews we explored how NECTA and TIE cooperate in the examination setting process. According to members of TIE who participated in the focus group discussions, TIE was seldom involved in examination setting as an institution. Nevertheless, a few individual specialists are consulted at different points during the examination setting process. For example, one participant remarked during discussion that:
“…NECTA employs an individual curriculum developer to set some examination items…there is gener-ally no official institutionalized consultation between NECTA and TIE regarding examination setting”.
3.4.4 Contribution of the school continuous assessment (CA) to the final gradeIn the context of competence based curriculum, assessment ought to be continuous throughout the school duration. Additionally, in competence based curriculum, continuous assessment is expected to contribute significantly to the final grade of a student upon graduation. In this regard, the study sought to examine the extent to which school continuous assessment counts towards the final grade. Data in this aspect were collected from teachers and examination officials at NECTA.

17
There was contradictory information about the contribution of the school continuous assessment in the final students’ grade. While the examination official interviewed categorically explained that continuous assessment contributes half of the marks towards the final students’ grade, teachers did not believe this was the case. Teachers explained that if CA marks were used in the final grading, there would not be as high failure rates as we currently witness in our education system. Teachers insisted that, though schools were required to submit students’ continuous assessment marks every year, they did not believe that these were of any value to the students’ final grade. Some of the teachers’ remarks about the contribution of CA to the final grade are illustrated below.
“I don’t think that these assessments bring any effect to students NECTA results. It has just been a tendency to submit but they don’t make use of them at all”.
What I can say is that continuous assessment scores are just demanded as a formality. I am sure if con-tinuous assessment were used they would decrease students’ failure rates. Students would be working hard knowing that continuous assessment would contribute in the final examinations results. What I believe is that NECTA do not make use of continuous assessment”.
“, I don’t believe even for a second that continuous assessment contributes to the final national examina-tions results. It has been like propaganda, because they do not add anything.
Curriculum developers also did not believe school continuous assessment results were used in the final grading of students. They insisted that if these were used effectively, they would reduce the failure rates significantly. One curriculum developer observed during the interviews:
“I think if continuous assessment scores were used by NECTA there would be no failures. NECTA should trust and make use of continuous assessment from teachers. They should take them and use as they are. If continuous assessments are added to the final examinations, we would not experience massive students’ failures.
Conversely, the NECTA official interviewed strongly emphasized that CA marks from schools were used and contribute to the students’ national examination score. The official clearly explained that CA score is incorporated in the student’s final examination result by using a special formula. Nevertheless, the official also observed that school CA marks were not reliable. As such, they were standardized before adding them to the final grading of candidates. Some of the NECTA official’s remarks are as quoted below.
“There are three things regarding continuous assessment from schools. First, we use them. Second, prin-cipally, as a matter of policy, it is supposed to be fifty percent by fifty percent. However, as a matter of practice continuous assessments are not reliable. There are a lot of cheating and inflation. Some students cannot even read but in their continuous assessment scores are high. In fact we use continuous assessment scores after standardizing them with a special formula which is internationally recognized. We standardize them to omit flaws before they are added to the national examination score for final grading”.

18
Chapter Four: Summary, Conclusions and Recommendations
4.1 SummaryFor the past five years, the performance in National Form Four Examinations in Tanzania has been de-clining, and many reasons have been given for this trend. These include, for example, lack of teaching and learning resources, poor teachers’ working conditions and poor teachers’ qualifications and teaching commitment. There has been no attempt to systematically examine how this poor performance can be explained from the point of view of curriculum objectives and examination practices. This study sought to examine the relationship between curriculum objectives and examination practice and how these two may explain the poor performance in national examinations.
Specifically, the objectives of the study was to: critically examine the types of examinations offered by NECTA under the current education curriculum; discuss critically the process through which NECTA develops examinations questions; assess the effectiveness of school-given and NECTA examinations in measuring attainment of curriculum objectives; and assess the impact of examination practices in schools and other relevant settings on examination performance.
The study was mainly quantitative employing questionnaire and content analysis as data collection tools. However, focus group discussions and interviews were conducted to supplement and clarify information gathered from the two instruments. The study was conducted in six regions of Mwanza, Tabora, Kili-manjaro, Singida, Morogoro and Iringa involving teachers as main participants. Curriculum developers and examination officials were also key informants for the study.
The results show that different sets of examinations are prepared by NECTA employing four main formats, namely multiple choice items, matching items, short answer questions and essay questions. The examinations tend to measure different levels of learning achievement, but for most subjects the focus is mainly on lower levels of achievement, which are knowledge and comprehension. The mathematics and english language examination questions tend to focus on higher levels of learning achievement, includ-ing application, analysis, synthesis and evaluation. This probably partly explains why pass rates in these subjects are generally poorer than in other subjects.
Interviews with teachers, curriculum developers and NECTA officials show that the examination setting process is mainly a business of NECTA officials, though different experts are consulted from time to time. The majority of curriculum developers and teachers, the implementers of the curriculum, are sel-dom involved in the examination setting processes and are generally unaware of these processes.
The results of the questionnaire and interviews with teachers show that teachers are generally ill- pre-pared in implementing the curriculum in action. More critically, though the Government has been imple-menting the competence based curriculum since 2005, only a third of teachers reported having oriented on the concept of competence based curriculum and how it is implemented. The majority of teachers have no idea what a competence based curriculum is. Apparently, even the examination setting body is not that conversant with the dictates of the new curriculum.
The content analysis of the curriculum materials and examination question papers show that the two are closely associated, with the examination questions heavily based on the content of the curriculum. As such, the content validity of the examinations is very high as the questions are generally based on what ought to have been covered in the curriculum.

19
The results have also shown that the assessment practices are not wholly competence based as they should be. One indication of this claim is the fact that there is no consensus between NECTA, on the one hand, and teachers and curriculum developers, on the other, whether school continuous assessments marks are integrated in the final grading of candidates. While NECTA officials claimed that these assess-ments are reflected in the final grading of candidates, teachers and curriculum developers did not believe that this is the case.
4.2 ConclusionsThe study has clearly shown that there is a good linkage between curriculum objectives and examina-tion content in that examination questions tend to reflect the content of the implemented curriculum. As such, the poor performance in national examinations cannot evidently be attributed to the mismatch between examination and curriculum content. There is, however, clear evidence that the curriculum is poorly implemented because the majority of teachers do not aptly understand the requirements of the curriculum, and the teaching and learning environment is generally poor in supporting the effective implementation of the curriculum. Therefore, the poor performance in national examination is due to poor curriculum implementation rather than the examination papers themselves.
It is particularly notable that, though the Government has been implementing the competence based curriculum since 2005, very few teachers are aware of the concept and philosophy of this curriculum orientation. While the content of the curriculum seems to be competence based, the assessment proce-dures are not wholly based on this philosophy. This is exemplified by the fact that the school continuous assessment does not seem to contribute significantly to the final grading of candidates. This therefore reinforces the earlier conclusion that it is not the content of examinations that is the cause of poor per-formance among students, but rather the poor conceptualization and implementation of the curriculum.
4.3 RecommendationsOn the basis of the results of this study, the following recommendations are made for policy action and further research.
i. The results show that the majority of teachers are not conversant with the concept and require-ments of a competent based curriculum, which is being implemented in schools. There is there-fore a need, as a matter of urgency, to devise a mechanism through which teachers could be given proper orientation on the concept, philosophy and requirements of a competence based curriculum. Additionally, the majority of teachers reported that they have never attended any professional development training opportunity in the past five years. This is not healthy in the professional standing of teachers. For teachers to be competent, conversant and committed in their profession, they need, among other things, continuous professional development opportu-nities, which should be provided on regular basis. The MoEVT and other relevant stakeholders should devise sustainable mechanisms1 for providing professional development opportunities for teachers regularly and sustainably.
ii. There is a need to re-examine the role and contribution of school continuous assessment in the final grading of candidates. The competence based curriculum requires that assessment of learn-ing objectives should also be competence based as measured by, among other things, the conti-nuity and diversity of such assessments and by adequately taking into consideration the school continuous assessment grades. At the moment, it is clear that the school continuous assessments are not give due weight in the final candidates’ grading.
1 TOT could be one of them to make sure that all Head teachers, DEOs, WEO, SLOs etc are equipped with such skills, but also every teacher who will be trained on CBC (at the college level) should be able to train others as well, of course besides in service training. This should be a requirement for all teacher training colleges.

20
iii. There should be close collaboration and consultation between NECTA and TIE so as to have a common understanding of the competence based curriculum regarding its conception, philoso-phy, and in particular, how its objectives and intended learning outcomes should be assessed.
iv. The competence based curriculum has shifted the teaching and learning paradigm from content based to competent based. The whole process is now learner centered with the aim of enabling the leaner to acquire creative thinking, communication skills, numeracy skills, technology, literacy, personal and social life skills and independent learning. These skills can only be acquired if there are adequate teaching and learning materials in schools. Consequently, the government has hence-forth, to monitor and ensure the effective provision of capitation grants in secondary schools to facilitate the availability of teaching and learning materials to teachers and students. The compe-tence based curriculum will not achieve much if there are limited funds to purchase teaching and learning materials for our secondary schools.
v. Poor/little understanding and implementation of policies and regulation is one of the biggest challenges teachers face because most implementers have no idea what these policies entails! Most of the time policies are set from the higher level with little understanding of what is hap-pening on the ground, and they are not fed back to implementers, e.g. teachers, DEOs etc. But also there are a lot of directives from above which do not consider the existing policies that task teachers to implement certain agenda or plan with no consideration of funding or capacity.
vi. Frequent change of the curriculum without adequate preparation in terms of the teaching and learning materials also negatively affects students’ performance as well as teaching and learning processes. According to majority of curriculum developers and teachers, the implementers of the curriculum, are seldom involved in the examination setting processes and are generally unaware of these processes. The curriculum changes therefore often come as a thunderclap from a blue sky to teachers which affect The competence based curriculum implementation in the teaching process. Moreover, frequent changes in the type of books which students are supposed to read as well as frequent changes in examination formats also affects students. TIE and NECTA should provide enough time and training to implementers whenever changes are made in curriculum and examinations format before students sit for examination under the new curriculum to enable them internalize the new curriculum.
vii. The welfare of teachers should be considered. The expected benefits of educational changes will not be realized if the question of incentives to teachers is neglected. The current (July to August 2012) teachers’ strike is an indication that our teachers are not satisfied with the current teaching environment; which needs special attention. Incentives here are the positive benefits realized by all stakeholders of education that encourage them to work for positive change. The government and the community should therefore, recognize the efforts of the teachers by paying them satis-factory salaries and other incentives that satisfy their needs including creating conducive working environment. It is through motivating teachers that the set education goals can be achieved.
viii. The present analysis is limited in that it is based on the curriculum content rather what and how the curriculum is actually implemented in a classroom context. This cannot give a full picture on how curriculum objectives affect the performance in national examinations. Future studies should therefore focus on assessing how the curriculum is actually implemented by engaging teachers’ actual classroom activities. This approach will provide a more comprehensive picture regarding how the curriculum is implemented and how this may be associated with performance in examinations.

21
Bibliography
Aas, G.H., Askling, B., Dittrich, K., Froestad, W., Hang, P., Lycke, K.H., Moitus, S. et al. (2009). Assessing educational quality: Knowledge production and the role of experts. Helsink, Finland: European Association for Quality Assurance in Higher Education. Retrieved from www.enqa.eu/files/Assessing_educational_qual-ity_wr6.pdf
Kellaghan, T. & Greaney, V. (2003). Monitoring and performance: Assessment and examinations i n Africa. Paris: Association for the Development of Education in Africa (ADEA). Retrieved from toolkit.ineesite.org/.../Monitoring_Performance_Assessment_Examin
Kellaghan, T. (2004). Public examinations, national and international assessments, and educational policy. Retrieved from siteresources.worldbank.org/.../Resources/paper_Kellaghan.pdf.
Mansell, W., James, M., & the Assessment Reform Group (2009). Assessment in schools. Fit for purpose? A commentary by the Teaching and Learning Programme. London: Economic and Social Research Council, Teach-ing and Learning Research Programme. Retrieved from www.tlrp.org/pub/documents/assessment.pdf.
National Examinations Council of Tanzania (NECTA, 2011). Examination results-Statistics for October 2010 results.
Ramparsad, R. (2001). A strategy for teacher involvement in curriculum development. South African Jour-nal of Education. 21, 287-291.

22
Appendix 1: Topics examined in National Examination Question Papers 2008-2011
Appendix 1a: Biology
Topics in exam -2008No of
questionsCovered in syllabus
Yes No class1. Safety in our environment 5 √ F12. Cell structure and organization 2 √ F13. Nutrition 1 √ F24. Balance of nature 2 √ F25. Transport of materials in living things 1 √ F26. Gaseous exchange and respiration 2 √ F27. Classification of living things 1 √ F38. Movement 1 √ F39. Risk behaviour 1 √ F310. Excretion 1 √ F311. Regulation 2 √ F312. Reproduction 3 √ F313. Growth 1 √ F414. Genetics 4 √ F415. Evolution 1 √ F416. HIV, AIDS and sexually transmitted
diseases1 √ F4
Total Number of Questions 29
Topics in exam - 2009No of
questionsCovered in syllabus
Yes No class1. Introduction to biology 1 √ F12. Safety in our environment 4 √ F13. Cell structure and organization 3 √ F14. Classification of living things 2 √ F15. Soil 1 √6. Nutrition 4 √ F27. Transport of materials in living things 1 √ F28. Gaseous exchange and respiration 2 √ F29. Classification of living things 1 √ F310. Movement 1 √ F311. Coordination 5 √ F312. Excretion 1 √ F313. Growth 1 √ F414. Genetics 2 √ F415. Classification of living things 1 √ F416. Evolution 1 √ F417. HIV, AIDS and sexually transmitted diseases 0
Total Number of Questions 31

23
Topics in exam-2010 No of questionsCovered in syllabus
Yes No Class Level
1. Introduction to biology 1 √ F1
2. Classification of living things 2 √ F1
3. Nutrition 3 √ F2
4. Balance of nature 3 √ F2
5. Transport of materials in living things 3 √ F2
6. Gaseous exchange and respiration 2 √ F2
7. Classification of living things 2 √ F3
8. Movement 1 √ F3
9. Coordination 4 √ F3
10. Excretion 2 √ F3
11. Reproduction 4 √ F3
12. Growth 2 √ F4
13. Genetics 3 √ F4
14. Classification of living things 1 √ F4
15. Evolution 1 √ F4
16. HIV, AIDS and sexually transmitted diseases
Topics in exam-2011No of
questionsCovered in syllabus
Yes No class
1. Introduction to biology 1 √ F1
2. Classification of living things 2 √ F1
3. Nutrition 4 √ F2
4. Balance of nature 2 √ F2
5. Female circumcision 1 √
6. Transport of materials in living things 3 √ F2
7. Classification of living things 2 √ F3
8. Movement 2 √ F3
9. Coordination 4 √ F3
10. Excretion 1 √ F3
11. Regulation 1 √ F3
12. Reproduction 5 √ F3
13. Growth 1 √ F4
14. Genetics 2 √ F4
Total Number of Questions 31

24
Appendix 1b: Geography
Topics in exam -2008No of
questionsCovered in syllabus
Yes No Class Level1. The solar system 3 √ F12. Major features of the earth’s surface 1 √ F13. Climate 1 √ F14. Agriculture 1 √ F25. Water management for economic
development1 √ F2
6. Structure of the earth 4 √ F37. Forces that affect the earth 1 √ F38. Soil 2 √ F39. Elementary surveying and map 1 √ F310. Map reading and map interpretation 1 √ F311. Photograph reading and interpreta-
tion1 √ F3
12. Application of statistics 1 √ F313. Introduction to research 1 √ F414. Climate and natural regions 1 √ F415. Settlements 1 √ F4
Total Number of Questions 21
Topics in exam -2009No of
questionsCovered in syllabus
Yes No class
1. The solar system 4 √ F1
2. Major features of the earth’s surface 1 √ F1
3. Climate 1 √ F1
4. Agriculture 1 √ F2
5. Sustainable use of power and en-ergy resources
1 √ F2
6. Structure of the earth 6 √ F3
7. Soil 2 √ F3
8. Elementary surveying and map 1 √ F3
9. Map reading and map interpretation 1 √ F3
10. Photograph reading and interpreta-tion
1 √ F3
11. Application of statistics 1 √ F3
12. Introduction to research 1 √ F4
13. Climate and natural regions 1 √ F4
14. Human population 1 √ F4
15. Environmental 1 √ F4
Total Number of Questions 24

25
Topics in exam -2010No of
questionsCovered in syllabus
Yes No class
1. The solar system 1 √ F1
2. Major features of the earth’s surface 1 √ F1
3. Agriculture 1 √ F2
4. Manufacturing industry 1 √ F2
5. Transport 1 √ F2
6. Structure of the earth 9 √ F3
7. Forces that affect the earth 2 √ F3
8. Soil 1 √ F3
9. Elementary surveying and map 2 √ F3
10. Map reading and map interpretation 1 √ F3
11. Photograph reading and interpreta-tion
1 √ F3
12. Application of statistics 1 √ F3
13. Introduction to research 1 √ F4
14. Human population 1 √ F4
15. Environmental 1 √ F4
Total Number of Questions 25
Topics in exam -2011No of
questionsCovered in syllabus
Yes No class1. The solar system 4 √ F1
2. Weather 1 √ F1
3. Climate 1 √ F1
4. Agriculture 1 √ F2
5. Sustainable mining 1 √ F2
6. Structure of the earth 5 √ F3
7. Soil 2 √ F3
8. Elementary surveying and map 2 √ F3
9. Map reading and map interpretation 1 √ F3
10. Photograph reading and interpreta-tion
1 √ F3
11. Application of statistics 1 √ F3
12. Introduction to research 1 √ F4
13. Human population 1 √ F4
14. Environmental 2 √
Total Number of Questions 25
26
Appendix 1c: Mathematics
Topics in exam -2008No of ques-
tionsCovered in syllabus
Yes No class1. Numbers 1 √ F12. Decimals and percentages 1 √ F13. Algebra 1 √ F14. Ratio, profit and loss 1 √ F15. Coordinate Geometry 1 √ F16. Exponents and radicals 1 √ F17. Algebra 4 √ F18. Quadratic equation 2 √ F19. Logarithm 2 √ F110. Pythagoras theorem 2 √ F211. Trigonometry 1 √ F212. Sets 1 √ F213. Statistics 1 √ F214. Functions 1 √ F315. Sequences and series 1 √ F316. Probability 1 √ F417. Trigonometry 1 √ F418. Vectors 1 √ F419. Matrices and transformations 1 √ F4
Total Number of Questions 25
Topics in exam -2009No of ques-
tionsCovered in syllabus
Yes No class1. Numbers 1 √ F12. Approximations 1 √ F13. Ratio, profit and loss 1 √ F14. Coordinate Geometry 1 √ F15. Perimeters and Areas 1 √ F16. Quadratic equation 1 √ F27. Logarithm 1 √ F28. Sets 1 √ F29. Functions 2 √ F310. Statistics 1 √ F311. Sequences and series 1 √ F312. The earth as a sphere 1 √ F313. Accounts 1 √ F314. Area and perimeter 1 √ F415. Three dimensional figures 1 √ F416. Probability 1 √ F4
27
17. Trigonometry 1 √ F418. Vectors 1 √ F419. Matrices and transformations 1 √ F4
Total Number of Questions 20
Topics in exam -2010No of ques-
tionsCovered in syllabus
Yes No class1. Approximations 1 √ F12. Algebra 1 √ F13. Ratio, profit and loss 2 √ F14. Algebra 2 √ F25. Logarithm 1 √ F26. Similarity 1 √ F27. Sets 1 √ F28. Statistics 1 √ F29. Functions 2 √ F310. Sequences and series 1 √ F311. Circles 1 √ F312. Accounts 1 √ F313. Area and perimeter 1 √ F414. Probability 1 √ F415. Trigonometry 2 √ F416. Vectors 1 √ F417. Matrices and transformations 2 √ F4
Total Number of Questions 22
Topics in exam -2011No of
questionsCovered in syllabus
Yes No class1. Numbers 1 √ F12. Fractions 1 √ F13. Decimals and percentages 1 √ F14. Geometry 2 √ F15. Ratio, profit and loss 3 √ F16. Exponents and radicals 1 √ F27. Algebra 1 √ F28. Quadratic equation 1 √ F29. Logarithm 1 √ F210. Pythagoras theorem 1 √ F211. Sets 1 √ F212. Statistics 1 √ F213. Functions 1 √ F314. Statistics 1 √ F315. Rates and variations 1 √ F3

28
16. Sequences and series 1 √ F317. Accounts 1 √ F318. Coordinate Geometry 1 √ F419. Vectors 1 √ F420. Matrices and transformations 1 √ F4Total Number of Questions
Appendix 1d: English language
Topics in exam -2008No of
questionsCovered in syllabus
Yes No Class Level 1. Reading for information from different
sources1 √ F3
2. Vocabulary 2 √ F1-43. Patterns and structure 2 √ F1-44. Using appropriate language content and
styles in speaking1 √ F3
5. Writing using appropriate language content and styles
3 √ F4
6. Speaking using appropriate language con-tent and style
1 √ F4
7. Writing application letters 1 √ F48. Writing cards and messages 1 √ F29. Reading literary works 5 √ F2-4
Total Number of Topics 17
Topics in exam -2009No of
questionsCovered in syllabus
Yes No Class Level 1. Reading for information from different
sources2 √ F3
2. Patterns and structure 4 √ F1-43. Writing using appropriate language content
and styles3 √ F4
4. Speaking using appropriate language con-tent and style
1 √ F4
5. Writing application letters 1 √ F46. Reading literary works 4 √ F2-47. Talking about one’s family relations 2 √ F1
Total Number of Topics 17

29
Topics in exam -2010No of
questionsCovered in syllabus
Yes No Class level
1. Reading for information from different sources
1 √ F3
2. Vocabulary 1 √ F1-4
3. Patterns and structure 4 √ F1-4
4. Writing using appropriate language content and styles
2 √ F4
5. Speaking using appropriate language con-tent and style
2 √ F4
6. Reading literary works 4 √ F2-4
7. Expressing ongoing activities 1 √ F1
8. Writing personal letters 1 √ F1
Total Number of Topics 16
Topics in exam -2011No of
questionsCovered in syllabus
Yes No Class Level
1. Vocabulary 4 √ F1-4
2. Patterns and structure 3 √ F1-4
3. Writing using appropriate language content and styles
1 √ F4
4. Speaking using appropriate language con-tent and style
1 √ F4
5. Reading literary works 4 √ F2-4
6. Talking about past events 1 √ F1
7. Talking about one’s family relations 1 √ F1
Total Number of Questions 15

30
Appendix 2: Analysis of national examinations along the Bloom’s Taxonomy
Appendix 2a: Mathematics
Year 2010
Question No
KnowledgeComprehen-sion
Applica-tion
Analysis SynthesisEvalua-tion
1 X X
2
3 X
4 X
5 X
6 X
7 X
8 X
9 X
10 X
11 X
12 X
13 X
14 X
15 X
16 X
Total 2 3 5 2 4
Year 2011
Question No
KnowledgeComprehen-sion
Applica-tion
Analysis SynthesisEvalua-tion
1 X
2 X
3 X
4 X
5 X
6 X
7 X
8 X
9 X

31
10 X
11 X
12 X
13 X
14 X
15 X
16 X
Total 2 1 5 3 4 1
Appendix 2b: Biology
Year 2010
Ques-tion No
Knowledge Comprehen-sion
Applica-tion
Analysis Synthesis Evaluation
1 X
2 X
3 X
4 X
5 X
6 X
7 X
8 X
9 X
10 X
11 X
12 X
13 X
14 X
15 X
16 X
17 X
18 X
19 X
20 X
21 X
22 X
Total 10 6 2 2 2 0

32
Year 2011
Question No
Knowledge Comprehen-sion
Applica-tion
Analysis Synthesis Evaluation
1 X
2 X
3 X
4 X
5 X
6 X
7 X
8 X
9 X
10 X
11 X
12 X
13 X
14 X
15 X
16 X
17 X
18 X
19 X
20 X
21 X
22 X
Total 12 6 4 0 0 0

33
Appendix 2c: Geography
Year 2010
Question No
Knowledge Comprehen-sion
Applica-tion
Analysis Synthesis Evaluation
1 X
2 X
3 X
4 X
5 X
6 X
7 X
8 X
9 X
10 X
11 X
12 X
13 X X
14 X
15 X
16 X
17 X
18 X
19 X
20 X
21
22
Total 6 6 2 4 1 2

34
Year 2011
Question No
Knowledge Comprehen-sion
Applica-tion
Analysis Synthesis Evaluation
1 X
2 X
3 X
4 X
5 X
6 X
7 X
8 X
9 X
10 X
11 X
12 X
13 X
14 X
15 X
16 X
17 X
18 X
19 X
20 X
21 X
22
Total 5 7 0 7 2 0

35
Appendix 2d: English
Year 2010
Question No
Knowledge Comprehen-sion
Applica-tion
Analysis Synthesis Evaluation
1 X
2 X
3 X
4 X
5 X
6 X
7 X
8 X
9 X
10 X
11 X
12 X
13
14 X
15 X
16 X
17 X
18 X
19
20
21
22
Total 1 6 1 4 5

36
Year 2011
Question No
Knowledge Comprehension Application Analysis Synthesis Evaluation
1 X
2 X
3 X
4 X
5 X
6 X
7 X
8 X
9 X
10 X
11 X
12 X
13
14 X
15 X
16 X
17 X
18 X
19
20
21
22
Total 1 6 1 4 5

Recommended