Santander Consumer USA Holdings Inc.3Q15 Company Update
10.29.2015

2IMPORTANT INFORMATIONForward-Looking Statements This presentation contains forward-looking statements within the meaning of the Private Securities Litigation Reform Act of 1995. Any statements aboutour expectations, beliefs, plans, predictions, forecasts, objectives, assumptions, or future events or performance are not historical facts and may be forward-looking. These statements are often, but not always, made through the use of words or phrases such as “anticipates,” “believes,” “can,” “could,” “may,”“predicts,” “potential,” “should,” “will,” “estimates,” “plans,” “projects,” “continuing,” “ongoing,” “expects,” “intends,” and similar words or phrases. Althoughwe believe that the expectations reflected in these forward-looking statements are reasonable, these statements are not guarantees of future performanceand involve risks and uncertainties which are subject to change based on various important factors, some of which are beyond our control. For additionaldiscussion of these risks, refer to the section entitled “Risk Factors” and elsewhere in our Annual Report on Form 10-K and our Quarterly Reports on Form10-Q filed by us with the SEC. Among the factors that could cause our financial performance to differ materially from that suggested by the forward-lookingstatements are: (a) we operate in a highly regulated industry and continually changing federal, state, and local laws and regulations could materiallyadversely affect our business; (b) adverse economic conditions in the United States and worldwide may negatively impact our results; (c) our businesscould suffer if our access to funding is reduced; (d) we face significant risks implementing our growth strategy, some of which are outside our control; (e)we may incur unexpected costs and delays in connection with exiting our personal lending portfolio; (f) our agreement with FCA US LLC may not result incurrently anticipated levels of growth and is subject to certain performance conditions that could result in termination of the agreement; (g) our businesscould suffer if we are unsuccessful in developing and maintaining relationships with automobile dealerships; (h) our financial condition, liquidity, and resultsof operations depend on the credit performance of our loans; (i) loss of our key management or other personnel, or an inability to attract such managementand personnel, could negatively impact our business; (j) we are subject to certain regulations, including oversight by the Office of the Comptroller of theCurrency, the CFPB, the European Central Bank, and the Federal Reserve, which oversight and regulation may limit certain of our activities, including thetiming and amount of dividends and other limitations on our business; and (k) future changes in our relationship with Santander could adversely affect ouroperations. If one or more of the factors affecting our forward-looking information and statements proves incorrect, our actual results, performance orachievements could differ materially from those expressed in, or implied by, forward-looking information and statements. Therefore, we caution not to placeundue reliance on any forward-looking information or statements. The effect of these factors is difficult to predict. Factors other than these also couldadversely affect our results, and the reader should not consider these factors to be a complete set of all potential risks or uncertainties. New factors emergefrom time to time, and management cannot assess the impact of any such factor on our business or the extent to which any factor, or combination offactors, may cause results to differ materially from those contained in any forward-looking statement. Any forward-looking statements only speak as of thedate of this document, and we undertake no obligation to update any forward-looking information or statements, whether written or oral, to reflect anychange, except as required by law. All forward-looking statements attributable to us are expressly qualified by these cautionary statements.

3
THIRD QUARTER HIGHLIGHTS

43Q15: HIGHLIGHTSNet income of $223.9 million, or $0.62 per diluted common share
Revenue driven by increasing balances via strong originations across the business
Net finance and other interest income in line with second quarter commentary
Expenses in line with expectations; increase driven by seasonally worse credit performance inthe second half of the year and one-time expense related to former CEO departure
Personal lending portfolio designated as held for sale as SC explores strategic alternatives1
Credit performing in line with expectations; adjusted net charge-off ratio1 increase driven by the year-over-year asset mix shift
Provision model refined to remove volatility associated with seasonality assumptions
Continued success with asset sales, leading to growth in the serviced for others portfolio
1 In connection with the reclassification of personal loan portfolio to held for sale, SC adjusted the allowance for credit losses associated with the portfolio to reflect the valuation of theportfolio at the lower of cost or market through provision for credit losses, and the adjusted credit loss allowance was released through provision for credit losses. The net impact ofthe reclassification of the personal loan portfolio to held for sale was a decrease to provision expense of $14 million. Future loan originations and purchases under SC's personallending platform will also be classified as held for sale.

5
▪ QoQ decrease in net income in line with normal seasonalitytrends
▪ Refinement of the auto provision models to removevolatility associated with seasonal assumptions reducedprovision for credit losses by $134 million
▪ Absence of CCART transaction reduced investment gains
▪ YoY increase due to growth in average portfolio andrefinement of the provision model
▪ Internal capital target is in line with Q3 2015 levels, expectcapital levels to increase over time as we continue to retainadditional equity
1 As defined in public filings2 Retained portfolio only3 Non-GAAP measure; see reconciliation in Appendix4 Regulatory calculation; calculated as common equity tier 1 capital over risk-weighted assets
Three Months Ended(Dollars in Thousands)
September30, 2015
June 30,2015
September30, 2014
Interest on finance receivables and loans $ 1,334,655 $ 1,321,245 $ 1,177,828Net leased vehicle income 93,185 74,019 62,751Other finance and interest income 9,334 6,738 2,512Interest expense 171,420 150,622 129,135Net finance and other interest income 1,265,754 1,251,380 1,113,956Provision for credit losses 744,140 738,735 769,689Profit sharing 11,818 21,501 10,556Total other income 130,553 208,978 149,961Total operating expenses 287,343 253,428 201,906Income before tax 353,006 446,694 281,766Income tax expense 129,106 161,230 90,397Net income $ 223,900 $ 285,464 $ 191,369Diluted EPS ($) $ 0.62 $ 0.79 $ 0.54
Key ratiosYield on Earning Assets1 (%) 15.5% 15.6% 15.7%Cost of Debt (%) 2.3% 2.0% 1.9%Net Interest Margin1 (%) 13.7% 13.9% 14.1%Expense Ratio1 (%) 2.3% 2.1% 2.0%ROA (%) 2.5% 3.2% 2.5%ROE (%) 21.1% 28.2% 23.9%RIC Average APR2 (%) 16.9% 16.9% 16.3%
End of PeriodSeptember
30, 2015June 30,
2015September
30, 2014TCE/TA3 (%) 11.8% 11.5% 10.4%
CET14 (%) 11.2% 10.8% 9.4%
3Q15: OPERATING METRICS AND DRIVERS
▪ QoQ and YoY increase driven by increase in average portfolio
▪ Yield and Net Interest Margin continue to gradually declinedue to growth in leases as a percentage of the portfolio,partially offset by retail installment contract APRs increasing
▪ QoQ increase, adjusted for $22.2 million non-recurringexpense related to former CEO departure, consistent withseasonal expectations
▪ Adjusted expense ratio for the quarter equals 2.1%3, in linewith Q2
▪ Adjusted for non-recurring CEO expense, 31% YoY increasedriven by 26% growth in average managed assets
Net Finance and Other Interest Income
Expenses
Profit
Capital

6
Three Months EndedSeptember
30, 2015June 30,
2015September
30, 2014
Net Charge-Offs ($) $1,105,795 $398,872 $565,468
Adjusted Net Charge-Offs ($)1 $664,057 $398,872 $565,468
Net Charge-Off Ratio (%) 14.4% 5.3% 8.4%
Adjusted Net Charge-Off Ratio (%)1 8.7% 5.3% 8.4%
Provision for Credit Losses ($) $744,140 $738,735 $769,689
September30, 2015
June 30,2015
September30, 2014
Delinquency Ratio (%) 3.8% 3.6% 4.1%
Credit Loss Allowance2 ($) $3,173,327 $3,530,919 $3,100,378
Allowance Ratio2 (%) 11.8% 12.4% 12.1%
3Q15: CREDIT METRICS AND DRIVERS
▪ Adjusted net charge-off ratio up QoQ as performanceseasonally worsens in the second half of the year
▪ Adjusted YoY credit performance is reflective of currentasset mix and in line with expectations
▪ Retail installment contract APR shift from 16.3% to16.9%
▪ QoQ increase expected given seasonal portfolio trends3
▪ YoY decrease due to shift in mix within the held forinvestment portfolio3
▪ QoQ increase driven by increase in charge-offs in line withseasonality trends
▪ $134 million reduction due to refinement of the autoprovision models
▪ YoY decrease driven by the refinement of the auto loanprovision models
1 Q3 2015 adjusted for lower of cost or market adjustments on loans sold and held for sale; see reconciliation in the Appendix2 Excludes purchased receivables portfolios and finance receivables held for sale3 Ratio excludes receivables held for sale. As of September 30, 2015, held for sale assets included the entire personal lending portfolio, which had an aggregate delinquency ratio of
8.8% as of that date
Net Charge-Offs
Delinquency
Provisions
Allowance Ratio▪ QoQ and YoY decrease driven by designation of personal
loans as held for sale and the refinement of the autoprovision models to remove seasonal volatility

7
BUSINESS AND STRATEGY

8
SC's fundamentals are strong, and the Company is focused on maintaining disciplined underwritingstandards to deliver strong returns, robust profitability and value to its shareholders
1 As of September 30, 20152 DDFS LLC is an entity owned by former Chairman and Chief Executive Officer, Tom Dundon. This purchase would result in SHUSA owning approximately 68.6% of SC3 Chrysler Capital is a dba of Santander Consumer USA
▪ Santander Consumer USA Holdings Inc. (NYSE:SC) ("SC") is approximately 59.0%1 owned by Santander Holdings USA,Inc. ("SHUSA"), a wholly-owned subsidiary of Banco Santander, S.A. (NYSE:SAN) ("Santander")▪ On July 3, 2015, SHUSA elected to exercise the right to purchase shares of SC common stock owned by DDFS LLC,
subject to regulatory approval and applicable law2
▪ SC is a full-service, technology-driven consumer finance company focused on consumer lending, third-party servicing andproviding superior customer service▪ Historically focused on nonprime markets; established and continued presence in prime and lease
▪ Approximately 4,900 full-time, 400 part-time and 900 vendor-based employees across multiple locations in the U.S. andthe Caribbean
Overview
▪ Our strategy is to continue leveraging our efficient, scalable infrastructure and data to underwrite, originate and serviceprofitable assets while treating employees, customers and all stakeholders in a simple, personal and fair manner▪ Continued focus on compliance transparency and consumer protection
▪ Focus on optimizing the mix of retained assets vs. assets sold and serviced for others
▪ Continued presence in prime markets through Chrysler Capital3
▪ Efficient funding through key third-party relationships and Santander
Strategy
SANTANDER CONSUMER USA

9
▪ Originate loans through select dealers and original equipment manufacturers (OEMs), and leasesthrough Fiat Chrysler Automobiles US LLC ("Chrysler")
▪ Substantial dealer network throughout the United States
▪ Originate and refinance loans via SC's branded tech-enabled platform, RoadLoans.com
VehicleFinance
Direct Auto Finance
Indirect Auto Finance and OEM Relationships
▪ Exploring strategic alternatives for Personal Lending businessPersonalLending
▪ Proprietary systems leverage SC's robust database and knowledge of consumer behavior across thefull credit spectrum, and enables SC to effectively price, manage and monitor risk
▪ Scalability evidenced by acquisitions and/or conversions and originations of more than $125 billion ofassets since 2008
▪ Capital-efficient, higher-ROE serviced for others platform
Origination &ServicingPlatforms
SANTANDER CONSUMER USA TODAY

10
Chrysler Capital Overview Chrysler Relationship Highlights
▪ 10-year private-label agreement, effective May 1, 2013
▪ Substantial dealer network in the U.S.
▪ Products include: retail loans, lease and dealer lending
▪ Chrysler subvention dollars enhance access to prime andnonprime customers
▪ Ability to sell higher quality loans with lower margins andretain servicing increases servicing revenue
▪ Residual risk-sharing agreement with Chrysler for leases
The optimal success, per the terms of the agreement between Chrysler and SC, is dependent upon the ability of both parties to meet and uphold certain agreed-upon standards
Since its May 1, 2013 launch, Chrysler Capital has originated approximately $28 billion in retail loans and $11 billion inleases, and facilitated the origination of approximately $3 billion in leases and dealer loans for an affiliate2
Chrysler interfaces with SCin a manner consistent with
comparable OEMs'treatment of their captive
finance providers
SC attempts to meetpenetration and approval
rate targets, and maintainsservice-level standards
Chrysler Sales(units in millions)
2010 2011 2012 2013 2014
1.1
1.4
1.71.8
2.114% CAGR
1 Company filings; total sales2 As of September 30, 2015
1
CHRYSLER CAPITAL

11SERVICED FOR OTHERS (SFO) STRATEGY
Runoff Over Period Asset Sales
20,000
18,000
16,000
14,000
12,000
10,000
8,000
6,000
4,000
2,000
0
$(M
illio
ns)
4Q13 1Q14 2Q14 3Q14 4Q14 1Q15 2Q15 3Q15 Runoff Ending Balance
14,788
$4,537
$1,686
$1,753
$2,431
$1,137$1,480
$2,772
$3,058
$4,066
SFO Composition at 9/30/15
Retail Installment 69%
Leases 24%
RV/Marine 7%
Total 100%
96% CAGR
▪ In addition to SC's strategy to optimize retained balance sheet assets, SC continues to develop a higher-ROE, capital-efficient serviced for others platform, leading to a stable fee income stream
▪ Servicing fee income in Q3 2015 increased to $35.9 million from $20.5 million in Q3 2014
1 Runoff over period includes principal paid or charged-off from 12/31/2013 to 09/30/2015
1
Highlights

12
RESULTS

13
Average Managed Assets Operating Expenses
Expense Ratio
Q3 2014 Q4 2014 Q1 2015 Q2 2015 Q3 2015
$40,397 $42,676 $44,782$48,113
$50,961
2.0% 2.2% 2.2% 2.1% 2.3%
$202 $230 $245 $253 $2651
Net Finance and Other Interest Income
Net Income
Net Interest Margin
Q3 2014 Q4 2014 Q1 2015 Q2 2015 Q3 2015
$1,114 $1,073$1,148
$1,251 $1,266
$191 $247 $289 $285 $224
14.1% 13.1% 13.4% 13.9% 13.7%
$287$22
Expenses and Expense Ratio($ in millions)
Income($ in millions)
▪ Q3 2015 net income of $223.9 million, representing 17% year-over-year growth
▪ $0.62 per diluted common share and ROE and ROA of 21.1% and 2.5%, respectively
▪ Q3 2015 net finance and other interest income increased $152 million or 14% from Q3 2014, driven by the 17% year-over-year increase in the average portfolio
▪ SC continues to demonstrate disciplined expense management, evidencing continued ability to scale
▪ Q3 2015 expenses include a $22.2 million non-recurring expense related to former CEO departure
▪ Adjusted for non-recurring former CEO expense, total operating expenses increased 31% to $265 million in Q3 2015from Q3 2014 driven by a 26% year-over-year increase in average managed assets
Highlights
INCOME & OPERATING EXPENSES
1 Q3 2015 includes a $22.2 million non-recurring expense related to former CEO departure; adjusted operating expenses of $265 million and expense ratio of 2.1%; reconciliation inAppendix
11

14
Provision Expense and Net Charge-offs($ in millions)Delinquency Trends1
31-60 Day Delinquency 61+ Day Delinquency
Q3 2014 Q4 2014 Q1 2015 Q2 2015 Q3 2015
8.5%9.0%
6.6%7.3%
8.2%
4.1%4.5%
3.2%3.6% 3.8%
Provision Expense Net Charge-offs
Net Charge-off Ratio
Q3 2014 Q4 2014 Q1 2015 Q2 2015 Q3 2015
$770
$560$606
$739 $744
$565 $591
$475
$399
8.4% 8.6%6.7% 5.3%
14.4%
▪ Consistent with expected seasonal patterns, the net charge-off ratio in Q3 2015 increased from the previous quarter
▪ Net charge-off ratio of 14.4% in Q3 2015 increased from 8.4% in the prior year third quarter driven primarily by anegative impact from non-recurring lower of cost or market adjustments on loans sold and held for sale; less the non-recurring items, the 8.7% charge-off ratio2 is reflective of the current asset mix
▪ Provision expense increased marginally quarter-over-quarter primarily due to seasonally higher charge-offs
▪ During the quarter, the provision model was refined to remove forward-looking seasonal volatility. Under the priormethodology, this quarter's provision expense would have been higher
Highlights
CREDIT
1 Ratio excludes receivables held for sale. As of September 30, 2015, held for sale assets included the entire personal lending portfolio, which had an aggregate delinquency ratio of8.8.% as of that date
2 Q3 2015 includes lower of cost or market adjustments on loans sold and held for sale; adjusted net charge-offs of $644 million and net charge-off ratio of 8.7%; see reconciliation inthe Appendix
$1,1062
$442
$6642

15
1 Unpaid principal balance; does not include loans owned by SC serviced by others 2 Includes capital leases3 Securitizations sold through the residual are accounted for as sales
SC retains servicing on loans sold to third parties andaffiliates or facilitated for affiliates, through bulk sales,
flow programs and securitizations3
Originations(in millions)
Total Serviced Portfolio1
(in millions)
Three Months Ended
September 30,2014 June 30, 2015 September 30,
2015
Retail Installment Contracts $ 5,206 $ 5,693 $ 5,894
Personal Loans 249 258 158
Receivables from Dealers 2 — —
Leases2 1,299 1,432 1,569
Subtotal - SC $ 6,756 $ 7,383 $ 7,621
Originations for an affiliate 604 229 —
Total Originations $ 7,360 $ 7,612 $ 7,621
Owned and Serviced Serviced for Others
September 30, 2014 June 30, 2015 September 30, 2015
$30,112$34,080 $34,957
$10,248
$13,121 $14,788$40,361
$47,201 $49,746
23%
ORIGINATION TRENDS
▪ Produced strong originations during Q3 2015, originating $7.6 billion in loans and leases
▪ Consistent with capital-efficient, higher ROE servicing strategy, the serviced for others portfolio grew 13% from prior quarter,driven by the $3.1 billion in asset sales during the quarter
Highlights

16
$4.8 billion in long-term committed revolving credit facilities fromSantander and SHUSA▪ Ongoing initiative to diversify and strengthen funding strategy
Diverse Funding Sources($ in billions)
Santander and Related Subsidiaries Third-Party Revolving
Privately Issued Amortizing Notes Public Securitizations
4.8 4.3 4.8 3.5
11.66.0
10.76.7
6.8
6.8
6.7
6.7
13.6
13.6
13.4
13.4
1 Reflects weighted average FICO of more recent transactions2 Net bonds sold of $1.2 billion
Committed Utilized
Monthly flow agreements with Bank of America, Citizens Bank ofPennsylvania and SBNA, as well as other asset sale relationships▪ Q3 2015:
▪ Seasoned Nonprime Residual Sales - $1.7 billion▪ Flow Programs - $1.3 billion
Committed Utilized
$36.7
$30.6
September 30, 2015 June 30, 2015
FUNDING & LIQUIDITY
Sold and Serviced for Others
$35.6
$30.3
ABS Platforms
Residual Interest Retained at Initial Close DRIVE - relaunched platform. ~550 weighted average FICO▪ Q3 2015: $1.7 billion issuedSDART - ~590 weighted average FICO1
▪ Q3 2015: $1.3 billion2 issuedResidual Interest SoldCCART - SC continues to service these assets earnings stableservicing fee income. ~705 weighted average FICO
Third-Party Funding
14 bank relationships provide more than $17 billion in revolvingfunding through warehouses and private-term amortizingtransactions▪ Q3 2015: $987 million of advances on new and existing private
term amortizing facilities
Intragroup Funding

17OUTLOOKQ4 2015 2016
RevenueConsistent with Q2 2015 commentary of flat net financeand other interest income in the second half of the yearcompared to the first half of 2015
As personal loans are sold and replaced with auto assets,there could be a potential timing gap between revenueforegone on sold assets vs. revenue received on newlyoriginated assets
Provision for credit lossesIncrease driven by removal of seasonality assumptions inthe provision model and asset mix vs. the same quarterlast year
a) Removing seasonality assumptions from the provisionmodel should result in less quarterly volatility,adjusted for any shift in mix
b) Timing impact related to the replacement of personalloans with auto loans, requiring upfront provisioning
Expenses Increased expenses expected due to seasonally higherdelinquency and loss in the second half of the year Typical seasonal patterns expected
Cost of debt Consistent with current trends
Increase expected as we further diversify and strengthenour funding strategy:
a) Issuance of unsecured corporate debt, subject tomarket conditions
b) Additional interest costs related to contingent liquiditycommitted by SHUSA which will gradually replaceand add to current liquidity lines provided by BancoSantander; these lines will further strengthen ourbackup funding and align our liquidity riskmanagement practices with Bank Holding Company(BHC) expectations
Capital Continue to increase as we retain additional equity Internal capital target is in line with Q3 2015 levels,expect capital levels to increase over time
Liquidity and capital leading to further stability, and continued growth in managed assets

18
APPENDIX FINANCIAL AND SUPPLEMENTAL INFORMATION

19PROVISION MODEL REFINEDProvision model refined to remove volatility associated with
forward-looking seasonality assumptions
Prior Model Refined Model
Forward-looking seasonal volatility as model capturesmultiple better performing/worse performing quarters
Volatility associated with forward-looking seasonalityassumptions removed, will result in less quarterly
volatility, adjusted for any shift in mix
Q3 2015 provision would have been higher as theforward-looking model captured two full fourth quarters
Q3 2015 saw a $134 million reduction in provision byremoving seasonal volatility
Q4 2015 would have likely seen a benefit related toseasonal assumptions
Assuming no external factors, the Q4 2015 benefitshould no longer happen as seasonality is no longer
impacting the provision model

20
Q3 Allowance Walk
Total Company excluding operating lease &purchased receivables portfolios
Beginning of Period Q3
CoverageAllowance% UPBEOP Gross UnpaidPrincipal Balance
28,507.0 3,530.9 12.4%
Total Company excluding operating lease &purchased receivables portfolios
End of Period Q31 26,907.3 3,173.3 11.8%
1 Quarter-end balance of loans originated during the quarter; the initial coverage for new loans is lower than the overall portfolio as the loans have not yet seasoned and developeddelinquency
2 Includes performing loan paydowns, which may not significantly alter future unit loss forecast
Individually acquired retail installment contracts Beginning of Period Q3 26,027.7 3,129.6 12.0%
New Originations in Q3, net of sales1 3,944.1 325.7 8.3%
Net Liquidations2 (2,325.7) (168.0) 7.2%
Other - (25.8)
End of Period Q3 26,718.6 99.3% 3,159.1 11.8%
Seasonality, Performance & Model Inputs
Receivables from dealers
Personal loans
Capital leases
Beginning of Period Q3 End of Period Q3
Beginning of Period Q3 End of Period Q3
Beginning of Period Q3 End of Period Q3
91.676.3
1.00.9
1.1%1.2%
0.3%0.3%
2,261.7-
384.7-
17.0%n/a
7.9%-
126.0112.4
15.613.3
12.4%11.8%
0.4%0.4%
Sold & Held for Sale (927.5) (102.4) 11.0%
($ in millions)
LOAN LOSS ALLOWANCE - Q3 2015
91.3%

21
1 Held for investment; excludes assets held for sale ($826 million held for sale as of September 30, 2015); percentages may not sum to 100% due to rounding
Retail Installment Contracts1
Q3 2014 Q4 2014 Q1 2015 Q2 2015 Q3 2015
40
35
30
25
20
15
10>640 639-600 599-540 <540
FICO
19.2%20.7%
33.2%
26.9%
20.5% 20.5%
32.6%
26.4%
17.2%
20.5%
34.2%
28.1%
14.7%
20.5%
35.8%
29.0%
15.2%
20.4%
36.2%
28.2%
CREDIT PROFILES
2015 mix shift toward higher margin assets in sub-600 FICO retail installment contract buckets, consistent with balance sheet optimization strategy. Higher margin assets require more upfront provision,
but are critical to long-term profitability.

22
(units in millions)
Consumer Sentiment Index1 Motor Vehicle Sales1
100
90
80
70
60
50
Sep-07
Mar-08
Sep-08
Mar-09
Sep-09
Mar-10
Sep-10
Mar-11
Sep-11
Mar-12
Sep-12
Mar-13
Sep-13
Mar-14
Sep-14
Mar-15
Sep-15
HIGH, 98.1
LOW, 55.3
18
16
14
12
10
8
6
Sep-07
Mar-08
Sep-08
Mar-09
Sep-09
Mar-10
Sep-10
Mar-11
Sep-11
Mar-12
Sep-12
Mar-13
Sep-13
Mar-14
Sep-14
Mar-15
Sep-15
HIGH, 17.7
AVERAGE, 13.9
LOW, 9.0
AVERAGE, 74.3
▪ Consumer sentiment is down 9.3% quarter overquarter and up 3.1% year over year
▪ Consumer demand for motor vehicles has remainedhigh; sales on pace to exceed 17 million in 2015
1Source: Bloomberg September 30, 2015
ECONOMIC INDICATORS
87.2

23
(units in millions)
Manheim Index1
60+ Day Delinquency Rates3
1 Manheim, Inc.; Indexed to a basis of 100 at 1995 levels2 On a mix-, mileage-, and seasonally-adjusted basis 3 Standard & Poor’s Ratings Services (ABS Auto Trust Data – two month lag on data)
▪ Wholesale used vehicle prices2 rose 0.4% inSeptember
▪ Year over year, the Manheim Index is up 2.8%
Prime (left scale) Subprime (right scale)
0.80.70.60.50.40.30.20.10.0
6
5
4
3
2
1
Jul-0
7
Jan-0
8Ju
l-08
Jan-0
9Ju
l-09
Jan-1
0Ju
l-10
Jan-1
1Ju
l-11
Jan-1
2Ju
l-12
Jan-1
3Ju
l-13
Jan-1
4Ju
l-14
Jan-1
5Ju
l-15
130
125
120
115
Jul-1
1
Dec-11
May-12
Oct-12
Mar-13
Aug-13
Jan-1
4
Jun-1
4
Nov-14
Apr-15
Sep-15
Source: Bloomberg 10/7/2015
124.8
Net Loss Rates3
Prime (left scale) Subprime (right scale)
2.5
2.0
1.5
1.0
0.5
0.0
14
12
10
8
6
4
2
0
Jul-0
7
Jan-0
8Ju
l-08
Jan-0
9Ju
l-09
Jan-1
0Ju
l-10
Jan-1
1Ju
l-11
Jan-1
2Ju
l-12
Jan-1
3Ju
l-13
Jan-1
4Ju
l-14
Jan-1
5Ju
l-15
CONSUMER FINANCE ENVIRONMENT
LOW, 119.1

24
Other Subsidiaries
100% Ownership
Santander Holdings USA, Inc.("SHUSA")
59.0% Ownership2
Santander Consumer USA Holdings Inc.("SC")
Santander Bank, N.A.Other Subsidiaries
9.8% Ownership(11.5% Beneficial Ownership)2
DDFS LLCand Tom Dundon
0.1% Ownership(0.4% Beneficial Ownership)1
31.2% Ownership
Other Management
PublicShareholders
**Ownership percentages are approximates as of September 30, 20151 Beneficial ownership includes options currently exercisable or exercisable within 60 days of September 30, 20152 On July 3, 2015, SHUSA elected to exercise the right to purchase shares of SC common stock owned by DDFS LLC, an entity owned by former Chairman and Chief Executive
Officer, Thomas Dundon, subject to regulatory approval and applicable law. This purchase would result in SHUSA owning approximately 68.6% of SC
Banco Santander, S.A. Spain
COMPANY ORGANIZATION

25(Unaudited, dollars in thousands, except per share amounts) September 30,
2015December 31,
2014AssetsCash and cash equivalents $ 104,552 $ 33,157Finance receivables held for sale, net 2,709,944 46,585Finance receivables held for investment, net 23,464,030 23,915,551Restricted cash 2,217,879 1,920,857Accrued interest receivable 394,692 364,676Leased vehicles, net 6,078,865 4,862,783Furniture and equipment, net 50,642 41,218Federal, state and other income taxes receivable 256,956 502,035Related party taxes receivable — 459Deferred tax asset 14,488 21,244Goodwill 74,056 74,056Intangible assets 53,710 53,682
Due from affiliates 63,924 102,457Other assets 507,490 403,416
Total assets $ 35,991,228 $ 32,342,176Liabilities and EquityLiabilities:
Notes payable — credit facilities $ 6,654,184 $ 6,402,327Notes payable — secured structured financings 20,027,111 17,718,974Notes payable — related party 3,525,000 3,690,000Accrued interest payable 19,855 17,432Accounts payable and accrued expenses 378,552 315,130Federal, state and other income taxes payable 417 319Deferred tax liabilities, net 698,509 492,303Related party taxes payable 396 —
Due to affiliates 148,250 48,688Other liabilities 178,113 98,654
Total liabilities 31,630,387 28,783,827
Equity:Common stock, $0.01 par value 3,579 3,490Additional paid-in capital 1,592,100 1,560,519Accumulated other comprehensive income (loss), net (24,239) 3,553Retained earnings 2,789,401 1,990,787
Total stockholders’ equity 4,360,841 3,558,349Total liabilities and equity $ 35,991,228 $ 32,342,176
CONSOLIDATED BALANCE SHEET

26For the Three Months Ended
(Unaudited, dollars in thousands, except per share amounts) September 30,2015
September 30,2014
Interest on finance receivables and loans $ 1,334,655 $ 1,177,828Leased vehicle income 389,537 263,148
Other finance and interest income 9,334 2,512Total finance and other interest income 1,733,526 1,443,488Interest expense 171,420 129,135
Leased vehicle expense 296,352 200,397Net finance and other interest income 1,265,754 1,113,956
Provision for credit losses 744,140 769,689
Net finance and other interest income after provision for credit losses 521,614 344,267Profit sharing 11,818 10,556Net finance and other interest income after provision for credit losses and profit sharing 509,796 333,711
Investment gains, net 1,567 38,015
Servicing fee income 35,910 20,547
Fees, commissions, and other 93,076 91,399Total other income 130,553 149,961
Salary and benefits expense 136,291 88,940
Repossession expense 60,770 50,738Other operating costs 90,282 62,228
Total operating expenses 287,343 201,906Income before income taxes 353,006 281,766Income tax expense 129,106 90,397
Net income $ 223,900 $ 191,369
Net income per common share (basic) $ 0.63 $ 0.55
Net income per common share (diluted) $ 0.62 $ 0.54Weighted average common shares (basic) 357,846,564 348,955,505
Weighted average common shares (diluted) 362,221,918 355,921,570
CONSOLIDATED INCOME STATEMENT
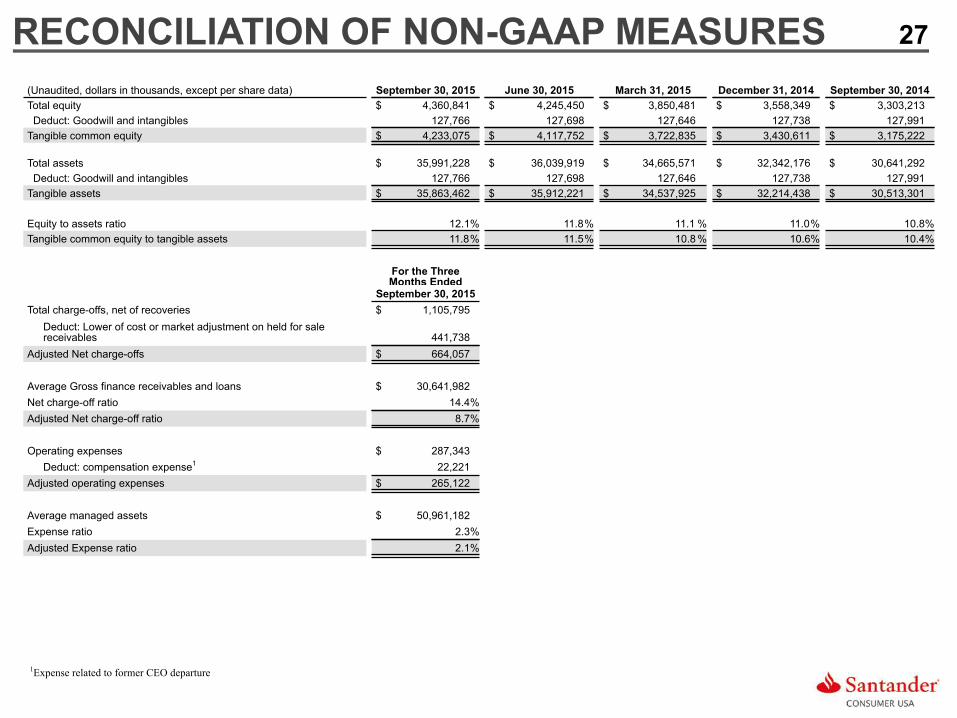
27
(Unaudited, dollars in thousands, except per share data) September 30, 2015 June 30, 2015 March 31, 2015 December 31, 2014 September 30, 2014Total equity $ 4,360,841 $ 4,245,450 $ 3,850,481 $ 3,558,349 $ 3,303,213 Deduct: Goodwill and intangibles 127,766 127,698 127,646 127,738 127,991Tangible common equity $ 4,233,075 $ 4,117,752 $ 3,722,835 $ 3,430,611 $ 3,175,222
Total assets $ 35,991,228 $ 36,039,919 $ 34,665,571 $ 32,342,176 $ 30,641,292 Deduct: Goodwill and intangibles 127,766 127,698 127,646 127,738 127,991Tangible assets $ 35,863,462 $ 35,912,221 $ 34,537,925 $ 32,214,438 $ 30,513,301
Equity to assets ratio 12.1% 11.8% 11.1 % 11.0% 10.8%Tangible common equity to tangible assets 11.8% 11.5% 10.8 % 10.6% 10.4%
For the ThreeMonths Ended
September 30, 2015Total charge-offs, net of recoveries $ 1,105,795
Deduct: Lower of cost or market adjustment on held for salereceivables 441,738
Adjusted Net charge-offs $ 664,057
Average Gross finance receivables and loans $ 30,641,982Net charge-off ratio 14.4%Adjusted Net charge-off ratio 8.7%
Operating expenses $ 287,343Deduct: compensation expense1 22,221
Adjusted operating expenses $ 265,122
Average managed assets $ 50,961,182Expense ratio 2.3%Adjusted Expense ratio 2.1%
RECONCILIATION OF NON-GAAP MEASURES
1Expense related to former CEO departure

Recommended