Published: May 16, 2011
r 2011 American Chemical Society 11192 dx.doi.org/10.1021/jp202254u | J. Phys. Chem. C 2011, 115, 11192–11203
ARTICLE
pubs.acs.org/JPCC
SAMs under Water: The Impact of Ions on the Behavior of Waterat Soft Hydrophobic SurfacesAdam J. Hopkins,*,†,§ Cathryn L. McFearin,^,† and Geraldine L. Richmond*,†,‡
†Department of Chemistry and ‡Materials Science Institute, University of Oregon, Eugene, Oregon, United States
bS Supporting Information
’ INTRODUCTION
Since hydrophobic surfaces are by definition “water hating”,one might assume from a simplistic perspective that solvated ions inthe water would avoid a hydrophobic surface. While this might betrue for idealized solid hydrophobic surfaces,1�3 it is certainly notthe case for solvated ions near more complex biological assemblieswhere ions not only approach but also transport across theseboundary layers. Unraveling the various factors that influence ionbehavior in these complex biological systems relative to theiridealized solid systems is not an easy task. For example, what rolesdo the polar groups of a biological assembly play, or that the morefluid nature of the hydrophobic boundary layer plays? At the air/water and solid/liquid interfaces, the polarity of adsorbates such asproteins andmacromolecules alters the structure of interfacial waterand affects ion adsorption behavior.4�6 Recent studies of aqueousionic solutions near simple hydrophobic liquids are shedding lighton the effect of ions on water at an extended hydrophobic fluidinterface.7�11 From these spectroscopic7,8 and computationalstudies9�11 it is clear that inorganic ions do penetrate into theaqueous/hydrophobic liquid interface. Experimental support forthese conclusions comes from spectroscopically observed changesof the molecular orientation and hydrogen bonding of interfacialwater molecules when ions are present at the liquid/liquid interface.These studies show that the weak interactions between water andthe hydrophobic liquid assist in the formation of an interfacialpotential that creates an environment that can draw ions into
the interfacial region. The behavior is found to be quite distinctfrom what has been observed for interfacial water in similarexperimental12�19 and computational studies conducted at theair/water interface.17,20�30 Comparison of the experimental resultsobtained at the air/water and CCl4/water interface using similarions and techniques show that there is a greater tendency for theions to go to the organic liquid/water interface than the air/waterinterface. The case has recently been made that other ions, such asOH�, are also attracted to hydrophobic liquid interfaces because ofthe stabilization afforded by the approach of the OH� ions, whichreduces the dielectric constant at the interface and the dipolefluctuations.31,32 These ions are estimated to have a density max-imum some 6�7 Å from the Gibbs dividing surface at the liquid/liquid and air/water interfaces.31,32
Recently, there has been an increased interest in usinghydrophobic self-assembled monolayers (SAMs) chemicallyattached to a silica substrate as model systems for understandingwater and ion behavior at more complex soft hydrophobicsurfaces.33 If the behavior of water molecules at the SAM/waterjunction is largely determined by the nature of the water/hydrophobic interactions at the terminus of the monolayer, thenone can use such SAM/water systems as a model for exploring a
Received: March 9, 2011Revised: April 19, 2011
ABSTRACT: Understanding the behavior of water at hydrophobic surfaceshas been a topic of much interest for many decades. In most areas of biological,environmental, or technological relevance, the aqueous phase is not pure water,but comprises a host of ions including those associated with the acidity orbasicity of the solution. The notion that ions, including hydroxide and/orhydronium, accrue at hydrophobic interfaces is increasingly invoked as apossible explanation for the behavior of water adjacent to soft hydrophobicinterfaces such as liquids and monolayers. The focus of this study is onexploring the behavior of aqueous solutions of salts, acids and bases in contactwith hydrocarbon and fluorocarbon self-assembled monolayers (SAMs) usingvibrational sum frequency spectroscopy (VSFS). The studies take a systematicapproach to understanding how each component of the SAMs’ interfacescontribute to the overall observed behavior of ions and water in the overallboundary region. To achieve this, the spectroscopy of the SAM/water interface in the presence and absence of aqueous phase ions,acids and bases is compared with similar measurements taken at the substrate (SiO2)/water interface and the hydrophobic liquid/water interface. The results show that the behavior of water and ions at the SAM/aqueous interface is significantly influenced by thesubstrate surface for both hydrocarbon and fluorocarbon SAM systems. Conditions where water and ions near a SAM interfacemimic that of a liquid hydrophobic surface are identified.
11193 dx.doi.org/10.1021/jp202254u |J. Phys. Chem. C 2011, 115, 11192–11203
The Journal of Physical Chemistry C ARTICLE
variety of ionic andmolecular adsorption processes atmore complexhydrophobic interfaces of biological and technological importance.One caveat to this premise is that these SAMsystems are themselvescomplex with regards to water and ion adsorption. For example,defects in the monolayers could lead to water and ions penetratingto the SiO2 substrate, potentially altering the overall interfacialelectrostatics and subsequent behavior of ions and water moleculesat the terminus of the monolayer.
The focus of this study is on exploring the behavior of aqueoussolutions of salts and acids in contact with hydrocarbon andfluorocarbon SAMs using vibrational sum-frequency spectroscopy(VSFS). The studies take a systematic approach to understandinghow each component of the SAM/water interface contributes to theoverall observed behavior of ions and water in the boundary region.Spectroscopic comparison of hydrocarbon- and fluorocarbon-termi-nated SAMs exploits the sensitivity of VSFS to differences in themolecular interactions of water with these two chemical functional-ities at the interface. We are able to distinguish between the behaviorof water at the terminus of these twomonolayer systems from that ofH2O in other regions of the interface, such as those closer to thesubstrate or deeper into the bulk liquid. Contributions from thesubstrate are determined by examining and comparing the VSFSresponse from SiO2 in contact with various ion and acid solutions.Further insights into the influence of the substrate and monolayerson interfacial water and electrolytes are obtained from both newstudies of acids and bases at the CCl4/H2O interface and previousstudies7,8,34�36 of water and aqueous solutions of ions in contact withvarious hydrophobic organic liquids where a substrate is not a factor.
’VSFS BACKGROUND
VSFS is uniquely suited for these studies because of itsinherent sensitivity to the orientation and dynamics of watermolecules in the interfacial region of monolayers and otherhydrophobic surfaces.37�45 Detailed explanations of VSFS canbe found in the literature;46�52 thus, a concise description will begiven here. The VSFS experiments within utilize a fixed frequencyvisible beam (ωvis) that is overlapped spatially and temporally witha tunable infrared (IR) beam (ωIR) at the interface, whichgenerates a beam at the sum of the two incident frequencies(ωSF). Using the electric dipole approximation, this beam isgenerated only by molecules in a non-centrosymmetric environ-ment such as that at the solid/liquid interface. No contribution tothe VSFS beam originates from molecules in the bulk liquid orsolid environments, and thus, the signal is limited to the fewmolecular layers experiencing net orientation at the interface.
The intensity of ωSF is given by eq 1:
IðωSFÞ � jχð2Þeff j2IðωIRÞIðωvisÞ � ∑n
i¼ 0jχð2Þυi
þ χð2ÞNR j2 ð1Þ
where I(ωIR) is the intensity of the IR beam and I(ωvis) is theintensity of the visible beam. χeff
(2) is the effective macroscopicnonlinear susceptibility and is composed of a sum of resonantterms, χυi
(2), and a nonresonant term, χNR(2). χNR
(2) was found to besmall in the experiments within. Each resonant term can bedescribed by a discrete resonance of the form shown in eq 2.
χð2Þυi�
NAυi
ωυi �ωIR � iΓυi
ð2Þ
In eq 2, N is the number density of molecules, and Aυiis the
product of the Raman and IR transition moments. ωυiis the
frequency of the IR transition,ωIR is the frequency of the tunable
IR, and Γυiis the line width of the transition. These quantities
that are normally complex result in terms with both amplitudeand phase that can interfere with other vibrational terms. Theresonant macroscopic susceptibility, χυi
(2), is related to themolecular hyperpolarizability (β) by eq 3,
χð2Þυi¼ N
ε0Æβæð3Þ
in which ε0 is the permittivity of free space and the angle bracketsdenote an ensemble average over the different molecular orienta-tions. Choosing different polarizations of the visible, IR, and VSFspectra allows different elements of χυi
(2) to be investigated. Thespectra within have all been collected in the SSP polarizationscheme (S-VSF, S-vis, P-IR), which probes transition dipolemoment components normal to the interfacial plane.
The spectra have been analyzed using a nonlinear global curve-fitting routine in IgorPro (Wavemetrics, Beaverton, OR) whichaccounts for spectral interferences and the deviations from idealtransition line shape by convoluting the expressions for Gaussian andLorentzian curves as initially developed by Bain and co-workers.53,54
The global fit allows all spectra within a series to be analyzedsimultaneously. Each resonant mode in eq 1 is fitted to eq 4:
χð2Þυi¼ Ai expðiφiÞ
Z ¥
0
1ωυi �ωIR þ iΓυi
exp �ωυi �ωIR
Γυi
!
ð4Þwhere Ai , φi , ωυi
, ΓLυi, and Γυi
are fittable parameters for theamplitude, phase, resonant frequency, Lorentzian line width, andGaussian line width of the ith mode. To reduce the number offittable parameters, Lorentzian line widths were fixed at 2 cm�1
for CH modes and 5 cm�1 for OH modes, and the resonantphases were only allowed values of 0 or π.
’EXPERIMENTAL SECTION
Liquid/Liquid Experiments. The CCl4/H2O experimentspresented here were performed using a commercially availableVSFS system from Ekspla (Vilnius, Lithuania) and sample cellthat has been previously described.7,34 For the VSFS experi-ments, a 532 nm visible beam from the frequency doubled outputof picosecond Nd:YAG laser is overlapped spatially and tempo-rally with the output of an IR generator pumped by the samesource. The IR is tunable from 1000 to 4300 cm�1. The beamenergies used were 80 μJ and∼200�250 μJ for the visible and IRbeams, respectively. The beam angles were chosen to maintain atotal internal reflection geometry for the visible beam for allconcentrations examined: 69.5� and 75� for the visible and IRbeams, respectively. Multiple spectra of each interface were takenand averaged to achieve an acceptable signal-to-noise level. Eachspectrumwas normalized for the IR and 532 nm output as well asthe absorption of the prism.The VSFS spectra are extremely sensitive to chemical impu-
rities, so great care was taken to eliminate any effects from these.CCl4 (g99.9% þ, Chromosolv HPLC grade) was purchasedfrom Sigma-Aldrich and twice distilled before use. The HCl andNaOH were both purchased from Sigma-Aldrich. The HCl wasACS reagent grade, 37%, andwas used from the bottle formakingacidic solutions. NaOHpellets, 99.998%metals basis purity, wereused for the basic experiments. Although of high-grade purity,using the NaOH pellets as purchased yielded inconsistent results
11194 dx.doi.org/10.1021/jp202254u |J. Phys. Chem. C 2011, 115, 11192–11203
The Journal of Physical Chemistry C ARTICLE
and often gave spectra similar to those containing small con-centrations of surfactants. To overcome this, the NaOH pelletswere baked in an oven at 220� for ∼12 h prior to use. Freshsolutions were prepared each day, and the pH was tested prior touse with indicator strips. The sample cell and all glassware werecleaned in NoChromix (Godax Laboratories) dissolved in con-centrated sulfuric acid, then rinsed copiously with water from aNanopure II system.Solid/Liquid Experiments. VSFS experiments at solid/liquid
interfaces were performed using a custom-built IR generationsystem. The master oscillator is a Spectra-Physics Lab 110 Nd:YAG laser (10 Hz, 600 mJ, 6.5 ns, 1064 nm) the output of whichis split to pump a potassium titanyl phospate (KTP) frequencydoubler and an optical parametric oscillator (OPA). The fre-quency doubled output of 60 mJ is used to pump a double-passKTP optical parametric oscillator (OPO). The remainder of the532 nm doubled output is then attenuated and polarizationselected before being sent toward the interface. Typically, 1.5 mJof 532 nmwas used at the sample area. OPO output is mixed with∼120 mJ of the 1064 nm fundamental in a two-stage (four-crystal) potassium titanyl arsenate OPA. The tunable OPAoutput ranges from 2600 cm�1 to 4000 cm�1 (1�4 mJ) with a2 cm�1 bandwidth.
Samples were compression fitted onto a Kel-F sample cell witha Kalrez O-ring. IR and visible beams were directed at the samplethrough a 23.1�, triangular IR grade fused silica prism with a 1 in.2
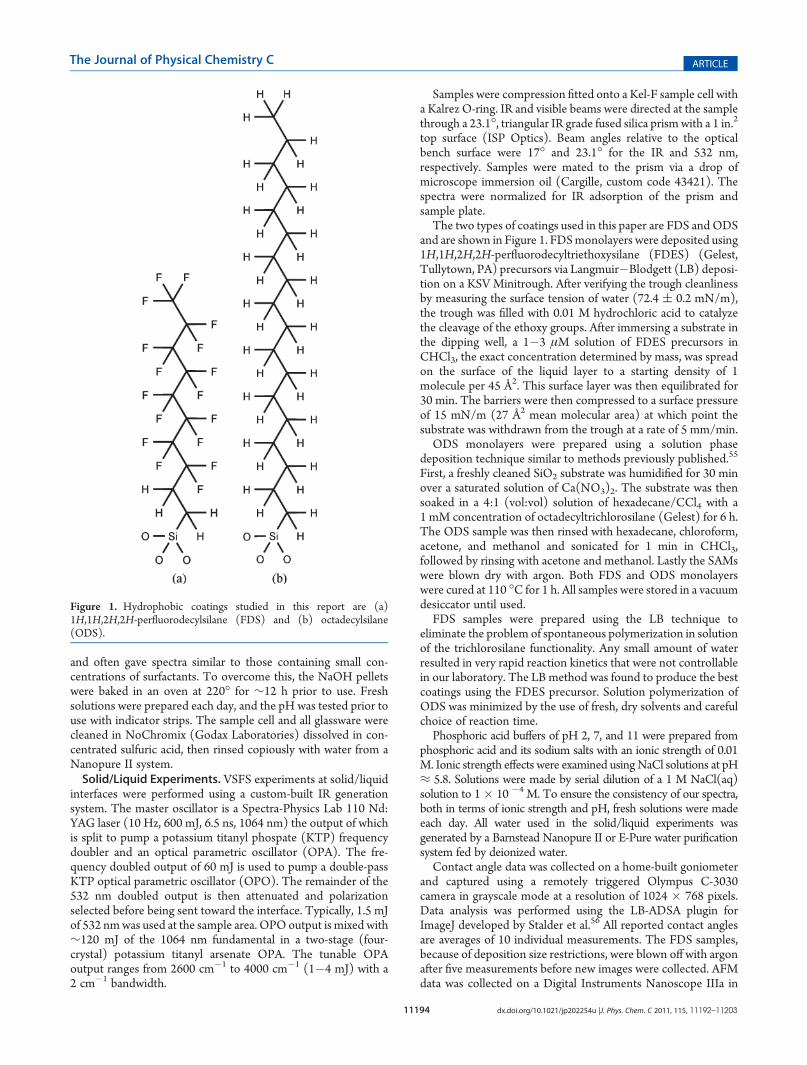
top surface (ISP Optics). Beam angles relative to the opticalbench surface were 17� and 23.1� for the IR and 532 nm,respectively. Samples were mated to the prism via a drop ofmicroscope immersion oil (Cargille, custom code 43421). Thespectra were normalized for IR adsorption of the prism andsample plate.The two types of coatings used in this paper are FDS and ODS
and are shown in Figure 1. FDSmonolayers were deposited using1H,1H,2H,2H-perfluorodecyltriethoxysilane (FDES) (Gelest,Tullytown, PA) precursors via Langmuir�Blodgett (LB) deposi-tion on a KSV Minitrough. After verifying the trough cleanlinessby measuring the surface tension of water (72.4 ( 0.2 mN/m),the trough was filled with 0.01 M hydrochloric acid to catalyzethe cleavage of the ethoxy groups. After immersing a substrate inthe dipping well, a 1�3 μM solution of FDES precursors inCHCl3, the exact concentration determined by mass, was spreadon the surface of the liquid layer to a starting density of 1molecule per 45 Å2. This surface layer was then equilibrated for30 min. The barriers were then compressed to a surface pressureof 15 mN/m (27 Å2 mean molecular area) at which point thesubstrate was withdrawn from the trough at a rate of 5 mm/min.ODS monolayers were prepared using a solution phase
deposition technique similar to methods previously published.55
First, a freshly cleaned SiO2 substrate was humidified for 30 minover a saturated solution of Ca(NO3)2. The substrate was thensoaked in a 4:1 (vol:vol) solution of hexadecane/CCl4 with a1 mM concentration of octadecyltrichlorosilane (Gelest) for 6 h.The ODS sample was then rinsed with hexadecane, chloroform,acetone, and methanol and sonicated for 1 min in CHCl3,followed by rinsing with acetone and methanol. Lastly the SAMswere blown dry with argon. Both FDS and ODS monolayerswere cured at 110 �C for 1 h. All samples were stored in a vacuumdesiccator until used.FDS samples were prepared using the LB technique to
eliminate the problem of spontaneous polymerization in solutionof the trichlorosilane functionality. Any small amount of waterresulted in very rapid reaction kinetics that were not controllablein our laboratory. The LB method was found to produce the bestcoatings using the FDES precursor. Solution polymerization ofODS was minimized by the use of fresh, dry solvents and carefulchoice of reaction time.Phosphoric acid buffers of pH 2, 7, and 11 were prepared from
phosphoric acid and its sodium salts with an ionic strength of 0.01M. Ionic strength effects were examined usingNaCl solutions at pH≈ 5.8. Solutions were made by serial dilution of a 1 M NaCl(aq)solution to 1� 10 �4 M. To ensure the consistency of our spectra,both in terms of ionic strength and pH, fresh solutions were madeeach day. All water used in the solid/liquid experiments wasgenerated by a Barnstead Nanopure II or E-Pure water purificationsystem fed by deionized water.Contact angle data was collected on a home-built goniometer
and captured using a remotely triggered Olympus C-3030camera in grayscale mode at a resolution of 1024 � 768 pixels.Data analysis was performed using the LB-ADSA plugin forImageJ developed by Stalder et al.56 All reported contact anglesare averages of 10 individual measurements. The FDS samples,because of deposition size restrictions, were blown offwith argonafter five measurements before new images were collected. AFMdata was collected on a Digital Instruments Nanoscope IIIa in
Figure 1. Hydrophobic coatings studied in this report are (a)1H,1H,2H,2H-perfluorodecylsilane (FDS) and (b) octadecylsilane(ODS).
11195 dx.doi.org/10.1021/jp202254u |J. Phys. Chem. C 2011, 115, 11192–11203
The Journal of Physical Chemistry C ARTICLE
intermittent contact mode using Nanosensors PPP-NCST tips.AFM data were analyzed in Gwyddion 2.12. More detailedsample analysis is included in the Supporting Information andshows that the samples have nearly ideal chain structure anddensity.
’RESULTS AND DISCUSSION
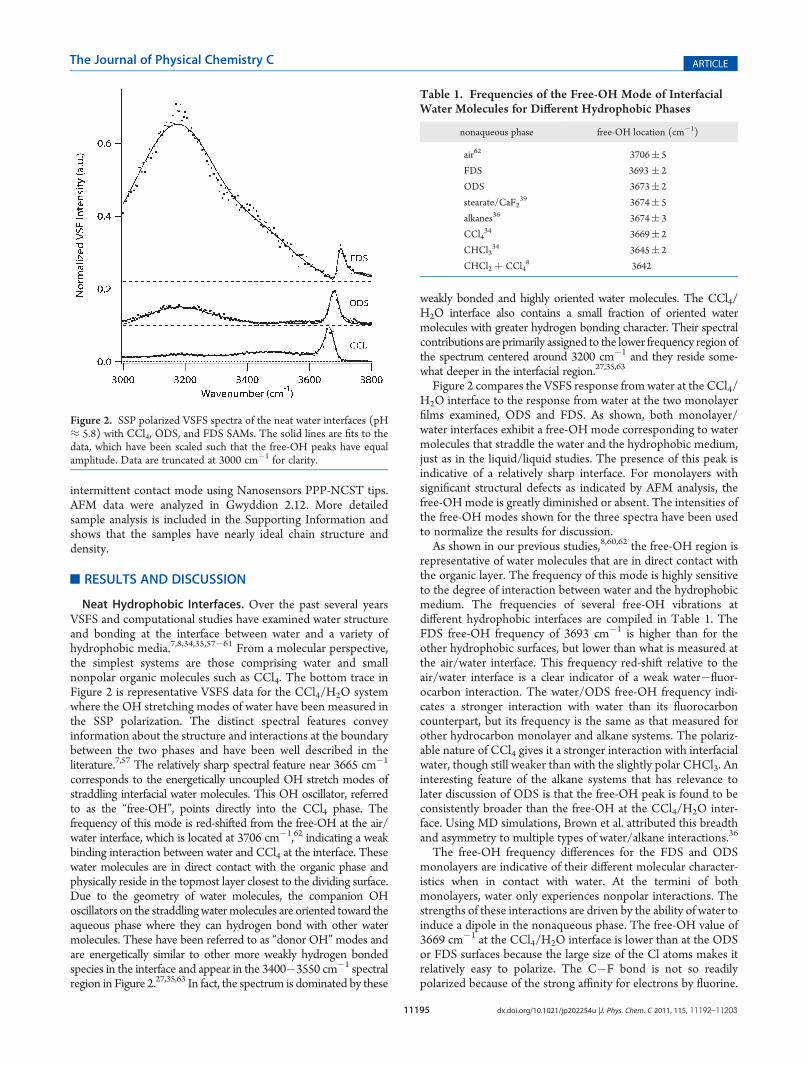
Neat Hydrophobic Interfaces. Over the past several yearsVSFS and computational studies have examined water structureand bonding at the interface between water and a variety ofhydrophobic media.7,8,34,35,57�61 From a molecular perspective,the simplest systems are those comprising water and smallnonpolar organic molecules such as CCl4. The bottom trace inFigure 2 is representative VSFS data for the CCl4/H2O systemwhere the OH stretching modes of water have been measured inthe SSP polarization. The distinct spectral features conveyinformation about the structure and interactions at the boundarybetween the two phases and have been well described in theliterature.7,57 The relatively sharp spectral feature near 3665 cm�1
corresponds to the energetically uncoupled OH stretch modes ofstraddling interfacial water molecules. This OH oscillator, referredto as the “free-OH”, points directly into the CCl4 phase. Thefrequency of this mode is red-shifted from the free-OH at the air/water interface, which is located at 3706 cm�1,62 indicating a weakbinding interaction between water and CCl4 at the interface. Thesewater molecules are in direct contact with the organic phase andphysically reside in the topmost layer closest to the dividing surface.Due to the geometry of water molecules, the companion OHoscillators on the straddlingwatermolecules are oriented toward theaqueous phase where they can hydrogen bond with other watermolecules. These have been referred to as “donor OH”modes andare energetically similar to other more weakly hydrogen bondedspecies in the interface and appear in the 3400�3550 cm�1 spectralregion in Figure 2.27,35,63 In fact, the spectrum is dominated by these
weakly bonded and highly oriented water molecules. The CCl4/H2O interface also contains a small fraction of oriented watermolecules with greater hydrogen bonding character. Their spectralcontributions are primarily assigned to the lower frequency region ofthe spectrum centered around 3200 cm�1 and they reside some-what deeper in the interfacial region.27,35,63
Figure 2 compares the VSFS response fromwater at the CCl4/H2O interface to the response from water at the two monolayerfilms examined, ODS and FDS. As shown, both monolayer/water interfaces exhibit a free-OH mode corresponding to watermolecules that straddle the water and the hydrophobic medium,just as in the liquid/liquid studies. The presence of this peak isindicative of a relatively sharp interface. For monolayers withsignificant structural defects as indicated by AFM analysis, thefree-OH mode is greatly diminished or absent. The intensities ofthe free-OH modes shown for the three spectra have been usedto normalize the results for discussion.As shown in our previous studies,8,60,62 the free-OH region is
representative of water molecules that are in direct contact withthe organic layer. The frequency of this mode is highly sensitiveto the degree of interaction between water and the hydrophobicmedium. The frequencies of several free-OH vibrations atdifferent hydrophobic interfaces are compiled in Table 1. TheFDS free-OH frequency of 3693 cm�1 is higher than for theother hydrophobic surfaces, but lower than what is measured atthe air/water interface. This frequency red-shift relative to theair/water interface is a clear indicator of a weak water�fluor-ocarbon interaction. The water/ODS free-OH frequency indi-cates a stronger interaction with water than its fluorocarboncounterpart, but its frequency is the same as that measured forother hydrocarbon monolayer and alkane systems. The polariz-able nature of CCl4 gives it a stronger interaction with interfacialwater, though still weaker than with the slightly polar CHCl3. Aninteresting feature of the alkane systems that has relevance tolater discussion of ODS is that the free-OH peak is found to beconsistently broader than the free-OH at the CCl4/H2O inter-face. Using MD simulations, Brown et al. attributed this breadthand asymmetry to multiple types of water/alkane interactions.36
The free-OH frequency differences for the FDS and ODSmonolayers are indicative of their different molecular character-istics when in contact with water. At the termini of bothmonolayers, water only experiences nonpolar interactions. Thestrengths of these interactions are driven by the ability of water toinduce a dipole in the nonaqueous phase. The free-OH value of3669 cm�1 at the CCl4/H2O interface is lower than at the ODSor FDS surfaces because the large size of the Cl atoms makes itrelatively easy to polarize. The C�F bond is not so readilypolarized because of the strong affinity for electrons by fluorine.
Figure 2. SSP polarized VSFS spectra of the neat water interfaces (pH≈ 5.8) with CCl4, ODS, and FDS SAMs. The solid lines are fits to thedata, which have been scaled such that the free-OH peaks have equalamplitude. Data are truncated at 3000 cm�1 for clarity.
Table 1. Frequencies of the Free-OH Mode of InterfacialWater Molecules for Different Hydrophobic Phases
nonaqueous phase free-OH location (cm�1)
air62 3706( 5
FDS 3693 ( 2
ODS 3673( 2
stearate/CaF239 3674( 5
alkanes36 3674( 3
CCl434 3669( 2
CHCl334 3645( 2
CHCl2 þ CCl48 3642
11196 dx.doi.org/10.1021/jp202254u |J. Phys. Chem. C 2011, 115, 11192–11203
The Journal of Physical Chemistry C ARTICLE
This has the effect of making water unable to interact strongly withfluorocarbon groups. Hydrocarbons have nearly equal electronsharing between the carbon and hydrogen atoms; however, withno strong affinities for electrons, water is readily able to perturb thisbond, resulting in the large frequency shift of the free-OH modefrom the air/water value of 3706 cm�1. It is important to note thatthe effect of molecular size on hydrophobicity has been recentlystudied by Dalvi and Rossky64 and cited as the reason for theenhanced hydrophobicity of fluorocarbons relative to hydrocarbons.However, size alone does not seem to sufficiently explain the free-OH frequency shifiting trend seen here.The most striking difference between the three spectra in
Figure 2 is in the coordinated water region around 3200 cm�1.The dominant feature for FDS peaks near 3200 cm�1 andcontinues to be strong up to the free-OH peak. The ODS/H2O interface shows a much smaller peak near 3200 cm�1 fromthese highly coordinated water molecules, as well as a smallamount of signal near 3600 cm�1. In contrast, the CCl4/H2Osystem shows very little signal throughout this region, as is thecase for all of the other organic liquids cited in Table 1 that havebeen studied to date. The striking difference in the water spectraat frequencies below ∼3600 cm�1 at the SAM/H2O interfacesleads us to conclude that these larger signals, relative to what isobserved in the liquid/liquid systems, are due to the influence ofthe SiO2 substrate on interfacial water molecules. Water mol-ecules contributing to this region of the spectrum are known tobe highly sensitive to interfacial charge and polarity, which caninfluence the number and degree of orientation of water mol-ecules in the double layer region adjacent to the substrate.65
Further discussion of such effects follows in later sections.pH Effects on Hydrophobic Interfaces. The above studies
suggest water orientation in the interfacial region is influenced byboth the hydrophobic monolayer as well as the underlyingsubstrate. To test this assumption further and also explore ionadsorption at these interfaces, similar studies of ODS and FDSinterfaces upon variation of the pH have been conducted. The
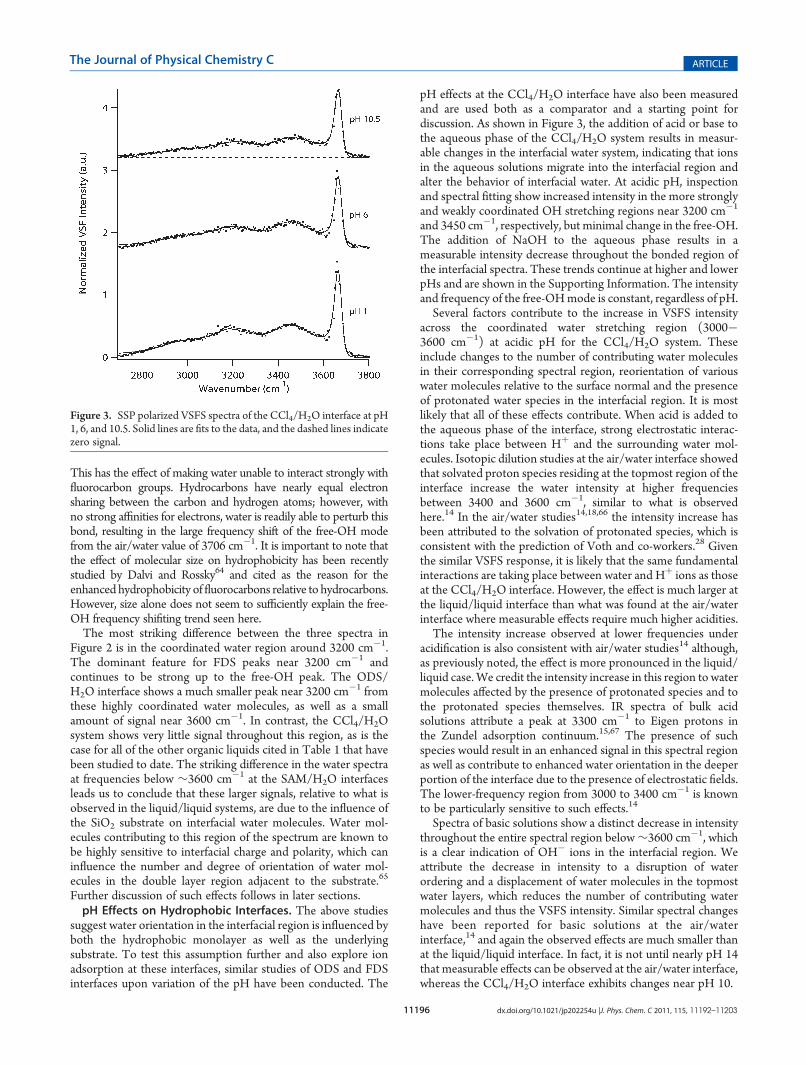
pH effects at the CCl4/H2O interface have also been measuredand are used both as a comparator and a starting point fordiscussion. As shown in Figure 3, the addition of acid or base tothe aqueous phase of the CCl4/H2O system results in measur-able changes in the interfacial water system, indicating that ionsin the aqueous solutions migrate into the interfacial region andalter the behavior of interfacial water. At acidic pH, inspectionand spectral fitting show increased intensity in the more stronglyand weakly coordinated OH stretching regions near 3200 cm�1
and 3450 cm�1, respectively, but minimal change in the free-OH.The addition of NaOH to the aqueous phase results in ameasurable intensity decrease throughout the bonded region ofthe interfacial spectra. These trends continue at higher and lowerpHs and are shown in the Supporting Information. The intensityand frequency of the free-OHmode is constant, regardless of pH.Several factors contribute to the increase in VSFS intensity
across the coordinated water stretching region (3000�3600 cm�1) at acidic pH for the CCl4/H2O system. Theseinclude changes to the number of contributing water moleculesin their corresponding spectral region, reorientation of variouswater molecules relative to the surface normal and the presenceof protonated water species in the interfacial region. It is mostlikely that all of these effects contribute. When acid is added tothe aqueous phase of the interface, strong electrostatic interac-tions take place between Hþ and the surrounding water mol-ecules. Isotopic dilution studies at the air/water interface showedthat solvated proton species residing at the topmost region of theinterface increase the water intensity at higher frequenciesbetween 3400 and 3600 cm�1, similar to what is observedhere.14 In the air/water studies14,18,66 the intensity increase hasbeen attributed to the solvation of protonated species, which isconsistent with the prediction of Voth and co-workers.28 Giventhe similar VSFS response, it is likely that the same fundamentalinteractions are taking place between water and Hþ ions as thoseat the CCl4/H2O interface. However, the effect is much larger atthe liquid/liquid interface than what was found at the air/waterinterface where measurable effects require much higher acidities.The intensity increase observed at lower frequencies under
acidification is also consistent with air/water studies14 although,as previously noted, the effect is more pronounced in the liquid/liquid case. We credit the intensity increase in this region to watermolecules affected by the presence of protonated species and tothe protonated species themselves. IR spectra of bulk acidsolutions attribute a peak at 3300 cm�1 to Eigen protons inthe Zundel adsorption continuum.15,67 The presence of suchspecies would result in an enhanced signal in this spectral regionas well as contribute to enhanced water orientation in the deeperportion of the interface due to the presence of electrostatic fields.The lower-frequency region from 3000 to 3400 cm�1 is knownto be particularly sensitive to such effects.14
Spectra of basic solutions show a distinct decrease in intensitythroughout the entire spectral region below∼3600 cm�1, whichis a clear indication of OH� ions in the interfacial region. Weattribute the decrease in intensity to a disruption of waterordering and a displacement of water molecules in the topmostwater layers, which reduces the number of contributing watermolecules and thus the VSFS intensity. Similar spectral changeshave been reported for basic solutions at the air/waterinterface,14 and again the observed effects are much smaller thanat the liquid/liquid interface. In fact, it is not until nearly pH 14that measurable effects can be observed at the air/water interface,whereas the CCl4/H2O interface exhibits changes near pH 10.
Figure 3. SSP polarized VSFS spectra of the CCl4/H2O interface at pH1, 6, and 10.5. Solid lines are fits to the data, and the dashed lines indicatezero signal.
11197 dx.doi.org/10.1021/jp202254u |J. Phys. Chem. C 2011, 115, 11192–11203
The Journal of Physical Chemistry C ARTICLE
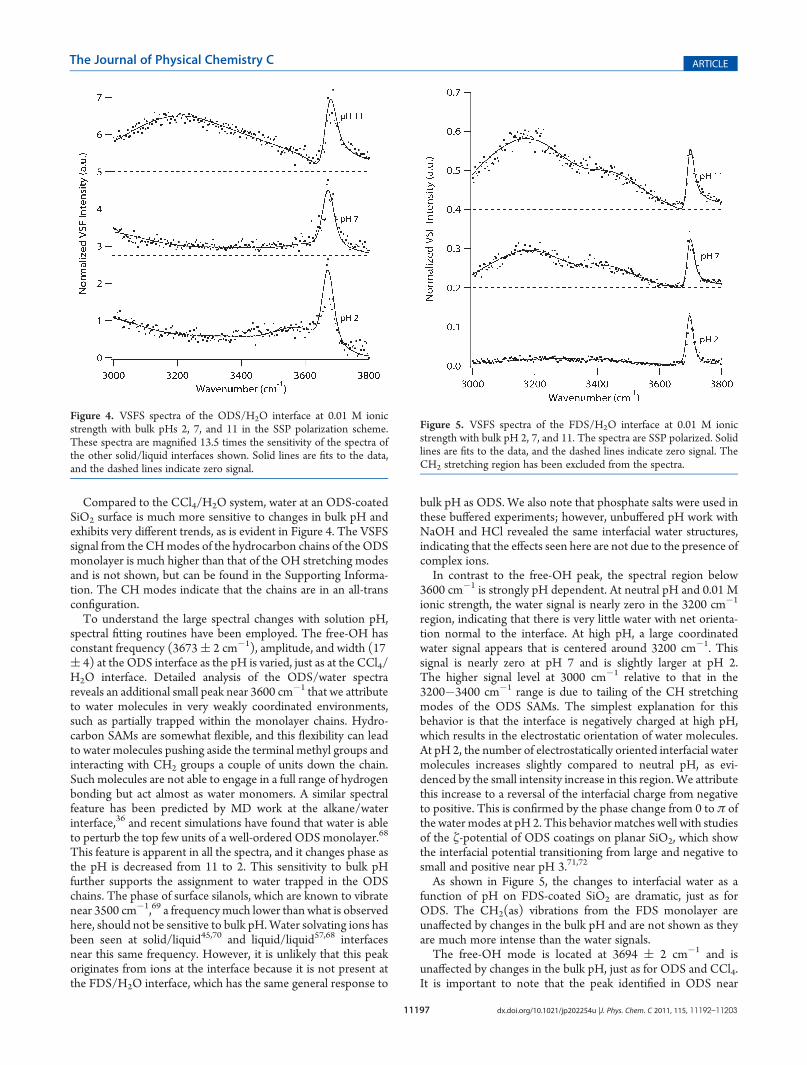
Compared to the CCl4/H2O system, water at an ODS-coatedSiO2 surface is much more sensitive to changes in bulk pH andexhibits very different trends, as is evident in Figure 4. The VSFSsignal from the CHmodes of the hydrocarbon chains of the ODSmonolayer is much higher than that of the OH stretching modesand is not shown, but can be found in the Supporting Informa-tion. The CH modes indicate that the chains are in an all-transconfiguration.To understand the large spectral changes with solution pH,
spectral fitting routines have been employed. The free-OH hasconstant frequency (3673( 2 cm�1), amplitude, and width (17( 4) at the ODS interface as the pH is varied, just as at the CCl4/H2O interface. Detailed analysis of the ODS/water spectrareveals an additional small peak near 3600 cm�1 that we attributeto water molecules in very weakly coordinated environments,such as partially trapped within the monolayer chains. Hydro-carbon SAMs are somewhat flexible, and this flexibility can leadto water molecules pushing aside the terminal methyl groups andinteracting with CH2 groups a couple of units down the chain.Such molecules are not able to engage in a full range of hydrogenbonding but act almost as water monomers. A similar spectralfeature has been predicted by MD work at the alkane/waterinterface,36 and recent simulations have found that water is ableto perturb the top few units of a well-ordered ODS monolayer.68
This feature is apparent in all the spectra, and it changes phase asthe pH is decreased from 11 to 2. This sensitivity to bulk pHfurther supports the assignment to water trapped in the ODSchains. The phase of surface silanols, which are known to vibratenear 3500 cm�1,69 a frequencymuch lower than what is observedhere, should not be sensitive to bulk pH.Water solvating ions hasbeen seen at solid/liquid45,70 and liquid/liquid57,68 interfacesnear this same frequency. However, it is unlikely that this peakoriginates from ions at the interface because it is not present atthe FDS/H2O interface, which has the same general response to
bulk pH as ODS. We also note that phosphate salts were used inthese buffered experiments; however, unbuffered pH work withNaOH and HCl revealed the same interfacial water structures,indicating that the effects seen here are not due to the presence ofcomplex ions.In contrast to the free-OH peak, the spectral region below
3600 cm�1 is strongly pH dependent. At neutral pH and 0.01 Mionic strength, the water signal is nearly zero in the 3200 cm�1
region, indicating that there is very little water with net orienta-tion normal to the interface. At high pH, a large coordinatedwater signal appears that is centered around 3200 cm�1. Thissignal is nearly zero at pH 7 and is slightly larger at pH 2.The higher signal level at 3000 cm�1 relative to that in the3200�3400 cm�1 range is due to tailing of the CH stretchingmodes of the ODS SAMs. The simplest explanation for thisbehavior is that the interface is negatively charged at high pH,which results in the electrostatic orientation of water molecules.At pH 2, the number of electrostatically oriented interfacial watermolecules increases slightly compared to neutral pH, as evi-denced by the small intensity increase in this region.We attributethis increase to a reversal of the interfacial charge from negativeto positive. This is confirmed by the phase change from 0 to π ofthe water modes at pH 2. This behavior matches well with studiesof the ζ-potential of ODS coatings on planar SiO2, which showthe interfacial potential transitioning from large and negative tosmall and positive near pH 3.71,72
As shown in Figure 5, the changes to interfacial water as afunction of pH on FDS-coated SiO2 are dramatic, just as forODS. The CH2(as) vibrations from the FDS monolayer areunaffected by changes in the bulk pH and are not shown as theyare much more intense than the water signals.The free-OH mode is located at 3694 ( 2 cm�1 and is
unaffected by changes in the bulk pH, just as for ODS and CCl4.It is important to note that the peak identified in ODS near
Figure 4. VSFS spectra of the ODS/H2O interface at 0.01 M ionicstrength with bulk pHs 2, 7, and 11 in the SSP polarization scheme.These spectra are magnified 13.5 times the sensitivity of the spectra ofthe other solid/liquid interfaces shown. Solid lines are fits to the data,and the dashed lines indicate zero signal.
Figure 5. VSFS spectra of the FDS/H2O interface at 0.01 M ionicstrength with bulk pH 2, 7, and 11. The spectra are SSP polarized. Solidlines are fits to the data, and the dashed lines indicate zero signal. TheCH2 stretching region has been excluded from the spectra.
11198 dx.doi.org/10.1021/jp202254u |J. Phys. Chem. C 2011, 115, 11192–11203
The Journal of Physical Chemistry C ARTICLE
3600 cm�1 as water in the ODS chains is not apparent at thisinterface. We ascribe this difference to the greater stiffness of thefluorocarbon chains, which are much larger in diameter than theODS chains, making water less able to partially penetrate intothe SAM.The more coordinated water signal between 3000 and
3500 cm�1 behaves similarly to that of ODS; the intensity inthis spectral region is greatest at pH 11, and it decreases withdecreasing pH. We attribute changes in the signal primarily tochanges in the interfacial potential; the difference between thecoordinated water signal in this spectral region on FDS and ODSis principally due to the shorter FDS chains. Measurements of theζ-potential of the aqueous FDS interface found that the potentialdecreases from ∼�60 to �30 mV between pH 11 and pH 7,consistent with the intensity decrease near 3200 cm�1 inFigure 5.71,72 At pH 2, the VSFS signal is nearly flat in thecoordinated water region; the spectrum can be well-fit using verybroad water peaks with phases of either 0 or π. Thus, it is unclearfrom the fits whether the interfacial water molecules havereversed their orientation at this pH. However, ζ-potentialmeasurements have found the potential to be slightly positiveat pH 3 for this interface, suggesting that the interfacial charge hasswitched from negative to positive by pH 2.71,72
While the two monolayer chains have different hydrophobi-cities, as is reflected in the frequency shifts of the free-OH mode,the similar spectral features of hydrogen-bonded interfacial watermolecules as a function of pH at ODS, and FDS is indicative ofsimilar orientation and bonding of the more strongly bondedinterfacial water. This is in contrast to the very differentobservations for the CCl4 interface. These results are consistentwith the conclusion in the previous section that a large amount ofthe water signal in the coordinated spectral region originatesfrom some common feature of the SAMs, such as the influence ofthe substrate.It has previously been suggested that ions can access the SiO2
substrate and generate an electrostatic field that orients watermolecules above the chains.73 The most likely means for this tooccur is through defects in the SAM, which allowwatermoleculesto penetrate through small gaps in the coverage and access thesubstrate. The procedure used to prepare the ODS surface hasbeen shown to create high initial coverage that fills in over time,55
but these same conditions lead to the deposition of occasionalpolymerized silanes on the surface, where water may find access.Similarly, the variations in surface pressure and transfer functionduring deposition of FDS lead to defects in FDS monolayers.Thus, a small number of SiO2 surface sites are available to reactwith acid or base and create a field to orient water. Substrateaccess is thus granted by pinhole defects in the SAMs, notthrough penetration of the monolayer chains themselves. Mo-lecular dynamics simulations have shown that dense, well-ordered regions of ODS and FDS SAMs are not greatly disturbedby the presence of water.68,74 If water penetrated to the substratethrough the well-ordered regions of the SAMs, the coatingswould degrade rapidly, which we do not see. However, smalldefects can fill with water and leave the remainder of the SAMrelatively unaffected.68 It is unlikely that water is able to access alarge number of silanols given the high contact angle of the SAMsand the durability of these types of surfaces.To determine how important these water�silanol interactions
are for the SAM systems, we compare their behavior to that at thebare SiO2/H2O interface. The SiO2/H2O interface, which hasbeen well-explored in the literature,40,75�77 can be described via
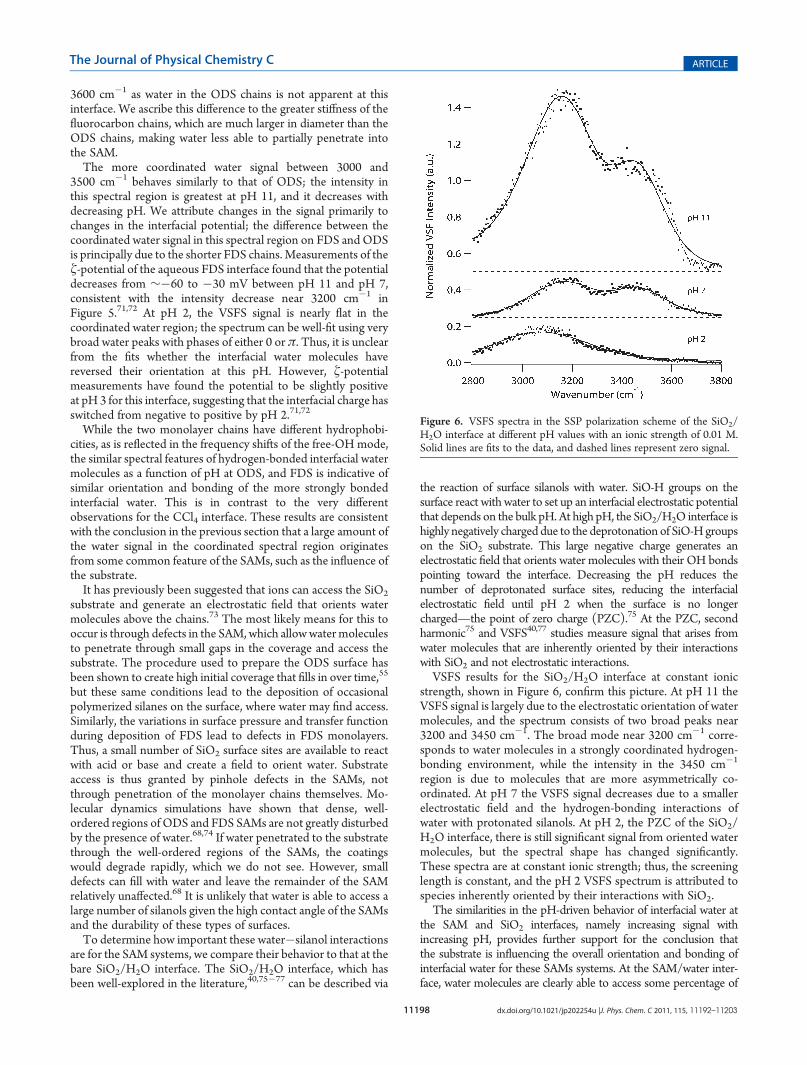
the reaction of surface silanols with water. SiO-H groups on thesurface react with water to set up an interfacial electrostatic potentialthat depends on the bulk pH. At high pH, the SiO2/H2O interface ishighly negatively charged due to the deprotonation of SiO-Hgroupson the SiO2 substrate. This large negative charge generates anelectrostatic field that orients water molecules with their OH bondspointing toward the interface. Decreasing the pH reduces thenumber of deprotonated surface sites, reducing the interfacialelectrostatic field until pH 2 when the surface is no longercharged—the point of zero charge (PZC).75 At the PZC, secondharmonic75 and VSFS40,77 studies measure signal that arises fromwater molecules that are inherently oriented by their interactionswith SiO2 and not electrostatic interactions.VSFS results for the SiO2/H2O interface at constant ionic
strength, shown in Figure 6, confirm this picture. At pH 11 theVSFS signal is largely due to the electrostatic orientation of watermolecules, and the spectrum consists of two broad peaks near3200 and 3450 cm�1. The broad mode near 3200 cm�1 corre-sponds to water molecules in a strongly coordinated hydrogen-bonding environment, while the intensity in the 3450 cm�1
region is due to molecules that are more asymmetrically co-ordinated. At pH 7 the VSFS signal decreases due to a smallerelectrostatic field and the hydrogen-bonding interactions ofwater with protonated silanols. At pH 2, the PZC of the SiO2/H2O interface, there is still significant signal from oriented watermolecules, but the spectral shape has changed significantly.These spectra are at constant ionic strength; thus, the screeninglength is constant, and the pH 2 VSFS spectrum is attributed tospecies inherently oriented by their interactions with SiO2.The similarities in the pH-driven behavior of interfacial water at
the SAM and SiO2 interfaces, namely increasing signal withincreasing pH, provides further support for the conclusion thatthe substrate is influencing the overall orientation and bonding ofinterfacial water for these SAMs systems. At the SAM/water inter-face, water molecules are clearly able to access some percentage of
Figure 6. VSFS spectra in the SSP polarization scheme of the SiO2/H2O interface at different pH values with an ionic strength of 0.01 M.Solid lines are fits to the data, and dashed lines represent zero signal.
11199 dx.doi.org/10.1021/jp202254u |J. Phys. Chem. C 2011, 115, 11192–11203
The Journal of Physical Chemistry C ARTICLE
the SiO2 substrate and engage in protonation/deprotonation reac-tions. The deviation from the exact behavior of SiO2 is due to thesmall number of sites available for protonation/deprotonationreactions. There is no free-OH at the SiO2/H2O interface becausethe silanols are engaged in hydrogen bonding with the aqueousphase.The free-OH amplitudes are unaffected by changes in bulk pH
for all of the hydrophobic interfaces examined within, indicatingthat Hþ and OH� ions are neither displacing straddling watermolecules nor is the hydrophobic interface becoming moredisorganized, as this would reduce the intensity of the free-OHby increasing the angular distribution of the OH oscillators. Thissuggests that the direct interactions of H2O with FDS, ODS andCCl4 are similar and that the topmost H2O layers are nearlyidentical. Differences observed between the two SAMs for themore coordinated water region is due to a combination of thedifferences in the electrostatic potential at the monolayer sur-faces, arising primarily from the chain length and chemicalcomposition differences of the two SAMs which mask thesubstrate charge and possibly have different affinities for OH�
and Hþ ions at the two hydrophobic surfaces. The watermolecules at the FDS interface may also be more highly orientednormal to the interface, resulting in a greater VSFS responsebased on the sharpness of the interface, which shows no signs ofwater molecules trapped within or disrupting the monolayerchains as is seen in ODS by the resonance near 3600 cm�1.Ionic Strength Effects on Hydrophobic Interfaces. The pH
experiments show the effects of changing interfacial charge onwater structure at hydrophobic interfaces. However, the picturerevealed is incomplete without complementary data that probeselectrostatic field effects explicitly. As noted above, the strongerthe field strength and subsequent depth, the larger the number oforiented water molecules that contribute to the VSFS signal. Toreduce this effect, high concentrations of nonspecifically adsorb-ing ions, Naþ and Cl� have been employed to screen theelectrostatic field at the SiO2 and SAM interfaces and then
compared with recent similar studies for CCl4. This method ofelectrostatic field screening has been used to reveal the structureof surface water layers at aqueous CaF2
45 and SiO278 interfaces.
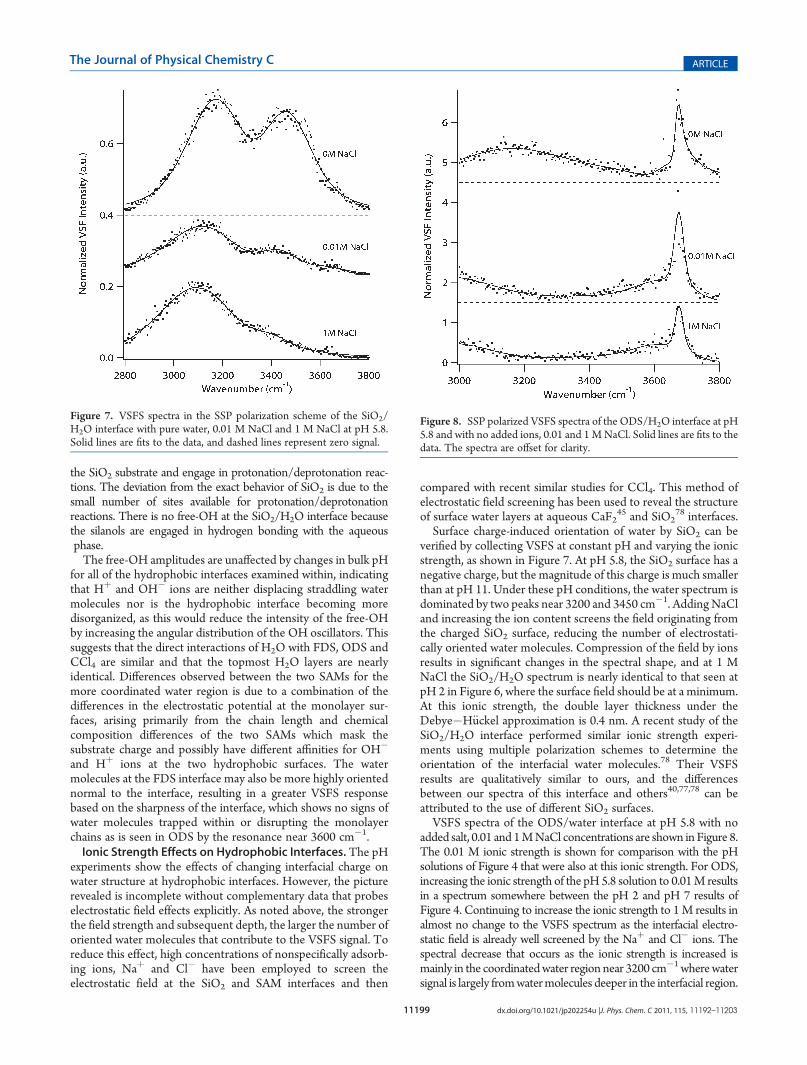
Surface charge-induced orientation of water by SiO2 can beverified by collecting VSFS at constant pH and varying the ionicstrength, as shown in Figure 7. At pH 5.8, the SiO2 surface has anegative charge, but the magnitude of this charge is much smallerthan at pH 11. Under these pH conditions, the water spectrum isdominated by two peaks near 3200 and 3450 cm�1. AddingNaCland increasing the ion content screens the field originating fromthe charged SiO2 surface, reducing the number of electrostati-cally oriented water molecules. Compression of the field by ionsresults in significant changes in the spectral shape, and at 1 MNaCl the SiO2/H2O spectrum is nearly identical to that seen atpH 2 in Figure 6, where the surface field should be at a minimum.At this ionic strength, the double layer thickness under theDebye�H€uckel approximation is 0.4 nm. A recent study of theSiO2/H2O interface performed similar ionic strength experi-ments using multiple polarization schemes to determine theorientation of the interfacial water molecules.78 Their VSFSresults are qualitatively similar to ours, and the differencesbetween our spectra of this interface and others40,77,78 can beattributed to the use of different SiO2 surfaces.VSFS spectra of the ODS/water interface at pH 5.8 with no
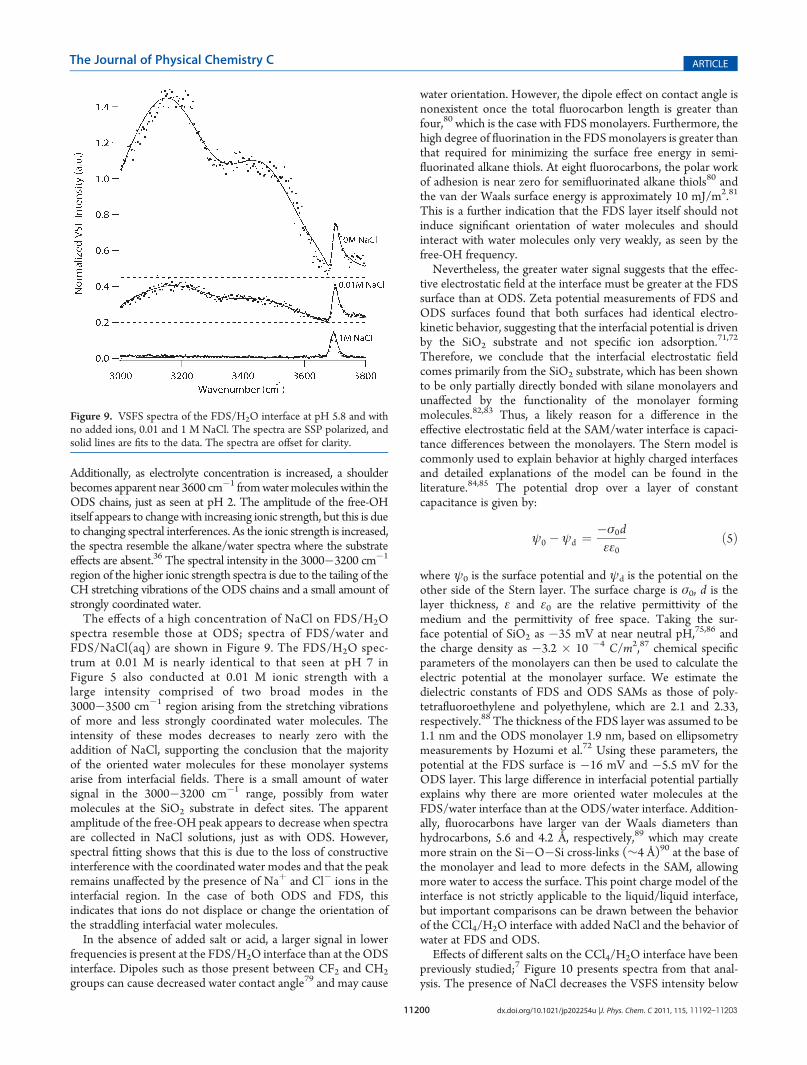
added salt, 0.01 and 1MNaCl concentrations are shown inFigure 8.The 0.01 M ionic strength is shown for comparison with the pHsolutions of Figure 4 that were also at this ionic strength. For ODS,increasing the ionic strength of the pH 5.8 solution to 0.01M resultsin a spectrum somewhere between the pH 2 and pH 7 results ofFigure 4. Continuing to increase the ionic strength to 1M results inalmost no change to the VSFS spectrum as the interfacial electro-static field is already well screened by the Naþ and Cl� ions. Thespectral decrease that occurs as the ionic strength is increased ismainly in the coordinatedwater region near 3200 cm�1 wherewatersignal is largely fromwatermolecules deeper in the interfacial region.
Figure 7. VSFS spectra in the SSP polarization scheme of the SiO2/H2O interface with pure water, 0.01 M NaCl and 1 M NaCl at pH 5.8.Solid lines are fits to the data, and dashed lines represent zero signal.
Figure 8. SSP polarized VSFS spectra of the ODS/H2O interface at pH5.8 and with no added ions, 0.01 and 1MNaCl. Solid lines are fits to thedata. The spectra are offset for clarity.
11200 dx.doi.org/10.1021/jp202254u |J. Phys. Chem. C 2011, 115, 11192–11203
The Journal of Physical Chemistry C ARTICLE
Additionally, as electrolyte concentration is increased, a shoulderbecomes apparent near 3600 cm�1 fromwatermolecules within theODS chains, just as seen at pH 2. The amplitude of the free-OHitself appears to change with increasing ionic strength, but this is dueto changing spectral interferences. As the ionic strength is increased,the spectra resemble the alkane/water spectra where the substrateeffects are absent.36 The spectral intensity in the 3000�3200 cm�1
region of the higher ionic strength spectra is due to the tailing of theCH stretching vibrations of the ODS chains and a small amount ofstrongly coordinated water.The effects of a high concentration of NaCl on FDS/H2O
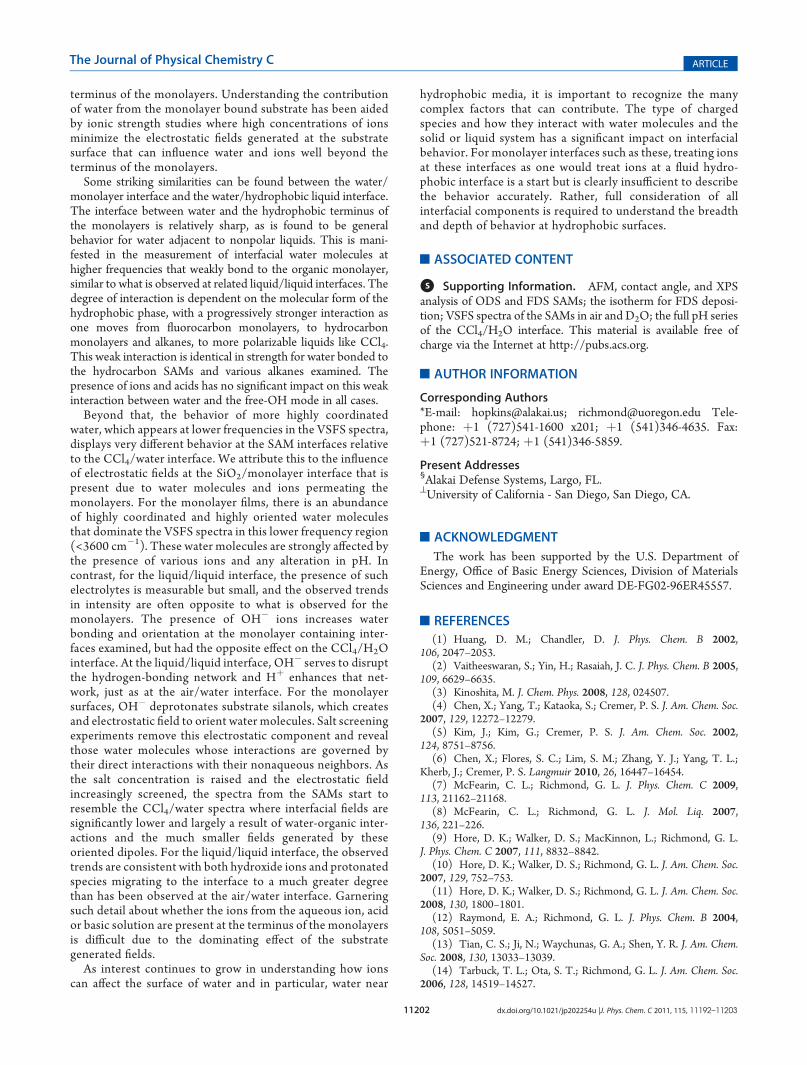
spectra resemble those at ODS; spectra of FDS/water andFDS/NaCl(aq) are shown in Figure 9. The FDS/H2O spec-trum at 0.01 M is nearly identical to that seen at pH 7 inFigure 5 also conducted at 0.01 M ionic strength with alarge intensity comprised of two broad modes in the3000�3500 cm�1 region arising from the stretching vibrationsof more and less strongly coordinated water molecules. Theintensity of these modes decreases to nearly zero with theaddition of NaCl, supporting the conclusion that the majorityof the oriented water molecules for these monolayer systemsarise from interfacial fields. There is a small amount of watersignal in the 3000�3200 cm�1 range, possibly from watermolecules at the SiO2 substrate in defect sites. The apparentamplitude of the free-OH peak appears to decrease when spectraare collected in NaCl solutions, just as with ODS. However,spectral fitting shows that this is due to the loss of constructiveinterference with the coordinated water modes and that the peakremains unaffected by the presence of Naþ and Cl� ions in theinterfacial region. In the case of both ODS and FDS, thisindicates that ions do not displace or change the orientation ofthe straddling interfacial water molecules.In the absence of added salt or acid, a larger signal in lower
frequencies is present at the FDS/H2O interface than at the ODSinterface. Dipoles such as those present between CF2 and CH2
groups can cause decreased water contact angle79 and may cause
water orientation. However, the dipole effect on contact angle isnonexistent once the total fluorocarbon length is greater thanfour,80 which is the case with FDS monolayers. Furthermore, thehigh degree of fluorination in the FDSmonolayers is greater thanthat required for minimizing the surface free energy in semi-fluorinated alkane thiols. At eight fluorocarbons, the polar workof adhesion is near zero for semifluorinated alkane thiols80 andthe van der Waals surface energy is approximately 10 mJ/m2.81
This is a further indication that the FDS layer itself should notinduce significant orientation of water molecules and shouldinteract with water molecules only very weakly, as seen by thefree-OH frequency.Nevertheless, the greater water signal suggests that the effec-
tive electrostatic field at the interface must be greater at the FDSsurface than at ODS. Zeta potential measurements of FDS andODS surfaces found that both surfaces had identical electro-kinetic behavior, suggesting that the interfacial potential is drivenby the SiO2 substrate and not specific ion adsorption.71,72
Therefore, we conclude that the interfacial electrostatic fieldcomes primarily from the SiO2 substrate, which has been shownto be only partially directly bonded with silane monolayers andunaffected by the functionality of the monolayer formingmolecules.82,83 Thus, a likely reason for a difference in theeffective electrostatic field at the SAM/water interface is capaci-tance differences between the monolayers. The Stern model iscommonly used to explain behavior at highly charged interfacesand detailed explanations of the model can be found in theliterature.84,85 The potential drop over a layer of constantcapacitance is given by:
ψ0 �ψd ¼ �σ0dεε0
ð5Þ
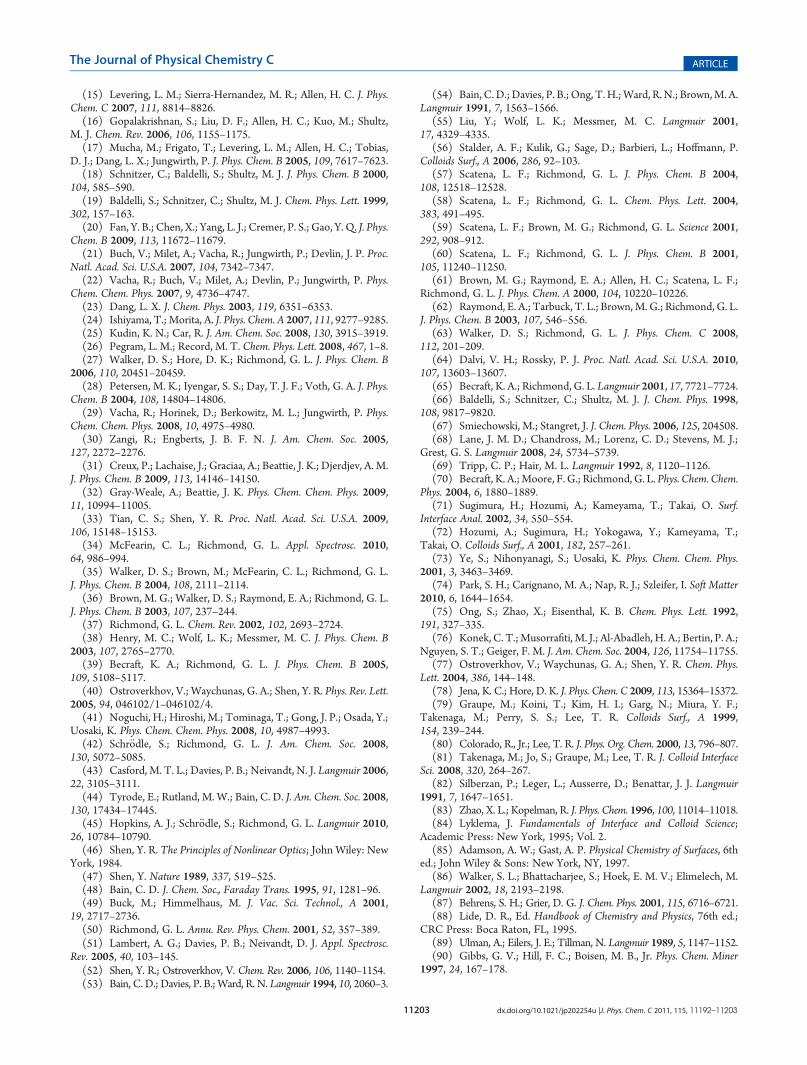
where ψ0 is the surface potential and ψd is the potential on theother side of the Stern layer. The surface charge is σ0, d is thelayer thickness, ε and ε0 are the relative permittivity of themedium and the permittivity of free space. Taking the sur-face potential of SiO2 as �35 mV at near neutral pH,75,86 andthe charge density as �3.2 � 10 �4 C/m2,87 chemical specificparameters of the monolayers can then be used to calculate theelectric potential at the monolayer surface. We estimate thedielectric constants of FDS and ODS SAMs as those of poly-tetrafluoroethylene and polyethylene, which are 2.1 and 2.33,respectively.88 The thickness of the FDS layer was assumed to be1.1 nm and the ODS monolayer 1.9 nm, based on ellipsometrymeasurements by Hozumi et al.72 Using these parameters, thepotential at the FDS surface is �16 mV and �5.5 mV for theODS layer. This large difference in interfacial potential partiallyexplains why there are more oriented water molecules at theFDS/water interface than at the ODS/water interface. Addition-ally, fluorocarbons have larger van der Waals diameters thanhydrocarbons, 5.6 and 4.2 Å, respectively,89 which may createmore strain on the Si�O�Si cross-links (∼4 Å)90 at the base ofthe monolayer and lead to more defects in the SAM, allowingmore water to access the surface. This point charge model of theinterface is not strictly applicable to the liquid/liquid interface,but important comparisons can be drawn between the behaviorof the CCl4/H2O interface with added NaCl and the behavior ofwater at FDS and ODS.Effects of different salts on the CCl4/H2O interface have been
previously studied;7 Figure 10 presents spectra from that anal-ysis. The presence of NaCl decreases the VSFS intensity below
Figure 9. VSFS spectra of the FDS/H2O interface at pH 5.8 and withno added ions, 0.01 and 1 M NaCl. The spectra are SSP polarized, andsolid lines are fits to the data. The spectra are offset for clarity.

11201 dx.doi.org/10.1021/jp202254u |J. Phys. Chem. C 2011, 115, 11192–11203
The Journal of Physical Chemistry C ARTICLE
3600 cm�1 with the majority of the change occurring around3200 cm�1. This reflects the fact that those molecules in the3200 cm�1 region are somewhat deeper in the interfacial regionand are largely oriented by field effects that arise from theinherent orientation of water immediately in contact with theorganic liquid. The intensity near 3500 cm�1 which is due to thedonor OH mode and other weakly hydrogen-bonded watermolecules in the topmost layer are only slightly affected by thepresence of Cl�. The free-OH intensity is unaffected by thepresence of the salt. It is clear that ions are attracted to thisinterface, but their overall effect on interfacial water structure isless dramatic than for either of the monolayer samples.These NaCl experiments show that there are fundamental
differences and similarities between the FDS, ODS, and CCl4interfaces that are consistent with the pH studies. At all threehydrophobic interfaces, the free-OH remains unaffected bythe addition of ions or acid. The fields produced at thesubstrate greatly enhance the orientation of water both atthe substrate and just beyond the monolayer over thosedirectly in contact with the hydrophobic portions of themonolayer. Reduction of this field by either pH or by theaddition of high concentrations of salt reveals a spectrum atthe monolayer/water interface that more closely mimics thatfound for the nonpolar organic liquids with much weakerinterfacial water-bonding interactions. Clearly visible in theODS spectra under these high salt conditions, and alsoapparent in the spectral fitting of the pH results, is a peaknear 3600 cm�1 that is not replicated in the FDS spectra. Weattribute this feature, which was seen in the pH studies shownin Figure 4 to water molecules in the ODS chains, as wasdiscussed earlier. Similar spectral features have been predictedby molecular dynamics studies of alkanes, and oriented watermonomers penetrating into the CCl4 have been found in thisspectral region also.57 Recent molecular dynamics studieshave shown that immersion of such monolayers in wateraffects the orientation of ODS chains in even ideal SAMsand that this effect becomes greater with increasing number ofdefects in the SAM.68 Under high salt concentrations thisadditional feature is not apparent for FDS, consistent with the
greater hydrophobicity of FDS which prevents water frompenetrating into the chains in monomeric form. A recentsimulation of fluorocarbon monolayers in contact with waterfound that at the molecular areas used to prepare these SAMswater neither perturbs nor penetrates into the chains.74
The addition of salt has a smaller but non-negligible effect onthe liquid/liquid interface. The neat CCl4 interface has beenshown through experimental and computational results to becomposed of water molecules with a relatively high degree ofmolecular orientation.7,63 At the topmost layer, water moleculesat the CCl4 interface adopt a specific orientation due to contactwith the hydrophobic phase. Additionally the nonaqueous phasealso can adopt a preferred and layered orientation.7,10 The resultis that the orientation on both sides of the interface contributes tointerfacial potential and orient additional water molecules some-what deeper in the interfacial region. These more highly co-ordinated water molecules are the ones most affected by theadded salt.At the CCl4/H2O interface, different ions were found to have
different effects on the interfacial structure based on their size andpolarizability.7 This ion-specific behavior is something not seenin the SAM studies within. However, the effects of pH and ionicstrength on the CCl4/H2O interface are much weaker that at theSAM surfaces, which shows that the electrostatic field at theinterface is much smaller and that ions have to reach a higherconcentration to perturb interfacial water structure at the CCl4interface. For the SAM systems, the large coordinated watersignals with their high dependency on bulk pH and ionic strengthshow that water orientation extends deep into liquid phase, andthe behavior observed gives rise to the ability to model theinterface using the method above. It may be that at sufficientlylow surface charge or at high ionic strength, specific ion adsorp-tion behavior is present, but those studies are beyond the scopeof this paper.It is worth noting that when the FDS and ODS interfaces were
exposed to dilute solutions of NaCl (1� 10 �4 M), the intensityof the VSFS spectra in the coordinated water region increasedslightly. This can be attributed to a small preferential attraction ofCl� ions to the interface which increases the net electrostaticfield and thus the number and/or degree of water orientation.This fits with the recent conclusions drawn by Tian and Shen,that Cl� andOH� ions are attracted to hydrophobic interfaces.33
However, it seems unlikely that the presence of ions alone, giventhe known chemistry of the SiO2 substrate, can explain theobservations here.
’CONCLUSION
These studies have examined the behavior of water at thesurface of hydrocarbon and fluorocarbon SAMs in solutionscontaining different concentrations of ions and acids. Themotivation for these studies has been to understand how theinterfacial water might be affected by these added electrolytes,and if effects are observed, the origin of these effects. Toachieve these goals we have taken a systematic approach tomeasuring the vibrational spectroscopy of interfacial water viaVSFS from different regions of the interface. This has beenfacilitated by comparative studies of similar electrolyte solu-tions in contact with related organic liquids where theinfluence of a substrate is not present. Such liquid/liquidstudies also assist in deriving information about water inter-actions and the possible presence of ions at the hydrophobic
Figure 10. SSP polarized VSFS spectra of the neat CCl4/H2O interfaceat pH 5.8 and with 1 M NaCl. Solid lines are fits to the data. The spectraare offset for clarity.
11202 dx.doi.org/10.1021/jp202254u |J. Phys. Chem. C 2011, 115, 11192–11203
The Journal of Physical Chemistry C ARTICLE
terminus of the monolayers. Understanding the contributionof water from the monolayer bound substrate has been aidedby ionic strength studies where high concentrations of ionsminimize the electrostatic fields generated at the substratesurface that can influence water and ions well beyond theterminus of the monolayers.
Some striking similarities can be found between the water/monolayer interface and the water/hydrophobic liquid interface.The interface between water and the hydrophobic terminus ofthe monolayers is relatively sharp, as is found to be generalbehavior for water adjacent to nonpolar liquids. This is mani-fested in the measurement of interfacial water molecules athigher frequencies that weakly bond to the organic monolayer,similar to what is observed at related liquid/liquid interfaces. Thedegree of interaction is dependent on the molecular form of thehydrophobic phase, with a progressively stronger interaction asone moves from fluorocarbon monolayers, to hydrocarbonmonolayers and alkanes, to more polarizable liquids like CCl4.This weak interaction is identical in strength for water bonded tothe hydrocarbon SAMs and various alkanes examined. Thepresence of ions and acids has no significant impact on this weakinteraction between water and the free-OH mode in all cases.
Beyond that, the behavior of more highly coordinatedwater, which appears at lower frequencies in the VSFS spectra,displays very different behavior at the SAM interfaces relativeto the CCl4/water interface. We attribute this to the influenceof electrostatic fields at the SiO2/monolayer interface that ispresent due to water molecules and ions permeating themonolayers. For the monolayer films, there is an abundanceof highly coordinated and highly oriented water moleculesthat dominate the VSFS spectra in this lower frequency region(<3600 cm�1). These water molecules are strongly affected bythe presence of various ions and any alteration in pH. Incontrast, for the liquid/liquid interface, the presence of suchelectrolytes is measurable but small, and the observed trendsin intensity are often opposite to what is observed for themonolayers. The presence of OH� ions increases waterbonding and orientation at the monolayer containing inter-faces examined, but had the opposite effect on the CCl4/H2Ointerface. At the liquid/liquid interface, OH� serves to disruptthe hydrogen-bonding network and Hþ enhances that net-work, just as at the air/water interface. For the monolayersurfaces, OH� deprotonates substrate silanols, which createsand electrostatic field to orient water molecules. Salt screeningexperiments remove this electrostatic component and revealthose water molecules whose interactions are governed bytheir direct interactions with their nonaqueous neighbors. Asthe salt concentration is raised and the electrostatic fieldincreasingly screened, the spectra from the SAMs start toresemble the CCl4/water spectra where interfacial fields aresignificantly lower and largely a result of water-organic inter-actions and the much smaller fields generated by theseoriented dipoles. For the liquid/liquid interface, the observedtrends are consistent with both hydroxide ions and protonatedspecies migrating to the interface to a much greater degreethan has been observed at the air/water interface. Garneringsuch detail about whether the ions from the aqueous ion, acidor basic solution are present at the terminus of the monolayersis difficult due to the dominating effect of the substrategenerated fields.
As interest continues to grow in understanding how ionscan affect the surface of water and in particular, water near
hydrophobic media, it is important to recognize the manycomplex factors that can contribute. The type of chargedspecies and how they interact with water molecules and thesolid or liquid system has a significant impact on interfacialbehavior. For monolayer interfaces such as these, treating ionsat these interfaces as one would treat ions at a fluid hydro-phobic interface is a start but is clearly insufficient to describethe behavior accurately. Rather, full consideration of allinterfacial components is required to understand the breadthand depth of behavior at hydrophobic surfaces.
’ASSOCIATED CONTENT
bS Supporting Information. AFM, contact angle, and XPSanalysis of ODS and FDS SAMs; the isotherm for FDS deposi-tion; VSFS spectra of the SAMs in air and D2O; the full pH seriesof the CCl4/H2O interface. This material is available free ofcharge via the Internet at http://pubs.acs.org.
’AUTHOR INFORMATION
Corresponding Authors*E-mail: [email protected]; [email protected] Tele-phone: þ1 (727)541-1600 x201; þ1 (541)346-4635. Fax:þ1 (727)521-8724; þ1 (541)346-5859.
Present Addresses§Alakai Defense Systems, Largo, FL.^University of California - San Diego, San Diego, CA.
’ACKNOWLEDGMENT
The work has been supported by the U.S. Department ofEnergy, Office of Basic Energy Sciences, Division of MaterialsSciences and Engineering under award DE-FG02-96ER45557.
’REFERENCES
(1) Huang, D. M.; Chandler, D. J. Phys. Chem. B 2002,106, 2047–2053.
(2) Vaitheeswaran, S.; Yin, H.; Rasaiah, J. C. J. Phys. Chem. B 2005,109, 6629–6635.
(3) Kinoshita, M. J. Chem. Phys. 2008, 128, 024507.(4) Chen, X.; Yang, T.; Kataoka, S.; Cremer, P. S. J. Am. Chem. Soc.
2007, 129, 12272–12279.(5) Kim, J.; Kim, G.; Cremer, P. S. J. Am. Chem. Soc. 2002,
124, 8751–8756.(6) Chen, X.; Flores, S. C.; Lim, S. M.; Zhang, Y. J.; Yang, T. L.;
Kherb, J.; Cremer, P. S. Langmuir 2010, 26, 16447–16454.(7) McFearin, C. L.; Richmond, G. L. J. Phys. Chem. C 2009,
113, 21162–21168.(8) McFearin, C. L.; Richmond, G. L. J. Mol. Liq. 2007,
136, 221–226.(9) Hore, D. K.; Walker, D. S.; MacKinnon, L.; Richmond, G. L.
J. Phys. Chem. C 2007, 111, 8832–8842.(10) Hore, D. K.; Walker, D. S.; Richmond, G. L. J. Am. Chem. Soc.
2007, 129, 752–753.(11) Hore, D. K.; Walker, D. S.; Richmond, G. L. J. Am. Chem. Soc.
2008, 130, 1800–1801.(12) Raymond, E. A.; Richmond, G. L. J. Phys. Chem. B 2004,
108, 5051–5059.(13) Tian, C. S.; Ji, N.; Waychunas, G. A.; Shen, Y. R. J. Am. Chem.
Soc. 2008, 130, 13033–13039.(14) Tarbuck, T. L.; Ota, S. T.; Richmond, G. L. J. Am. Chem. Soc.
2006, 128, 14519–14527.
11203 dx.doi.org/10.1021/jp202254u |J. Phys. Chem. C 2011, 115, 11192–11203
The Journal of Physical Chemistry C ARTICLE
(15) Levering, L. M.; Sierra-Hernandez, M. R.; Allen, H. C. J. Phys.Chem. C 2007, 111, 8814–8826.(16) Gopalakrishnan, S.; Liu, D. F.; Allen, H. C.; Kuo, M.; Shultz,
M. J. Chem. Rev. 2006, 106, 1155–1175.(17) Mucha, M.; Frigato, T.; Levering, L. M.; Allen, H. C.; Tobias,
D. J.; Dang, L. X.; Jungwirth, P. J. Phys. Chem. B 2005, 109, 7617–7623.(18) Schnitzer, C.; Baldelli, S.; Shultz, M. J. J. Phys. Chem. B 2000,
104, 585–590.(19) Baldelli, S.; Schnitzer, C.; Shultz, M. J. Chem. Phys. Lett. 1999,
302, 157–163.(20) Fan, Y. B.; Chen, X.; Yang, L. J.; Cremer, P. S.; Gao, Y. Q. J. Phys.
Chem. B 2009, 113, 11672–11679.(21) Buch, V.; Milet, A.; Vacha, R.; Jungwirth, P.; Devlin, J. P. Proc.
Natl. Acad. Sci. U.S.A. 2007, 104, 7342–7347.(22) Vacha, R.; Buch, V.; Milet, A.; Devlin, P.; Jungwirth, P. Phys.
Chem. Chem. Phys. 2007, 9, 4736–4747.(23) Dang, L. X. J. Chem. Phys. 2003, 119, 6351–6353.(24) Ishiyama, T.; Morita, A. J. Phys. Chem. A 2007, 111, 9277–9285.(25) Kudin, K. N.; Car, R. J. Am. Chem. Soc. 2008, 130, 3915–3919.(26) Pegram, L. M.; Record, M. T. Chem. Phys. Lett. 2008, 467, 1–8.(27) Walker, D. S.; Hore, D. K.; Richmond, G. L. J. Phys. Chem. B
2006, 110, 20451–20459.(28) Petersen, M. K.; Iyengar, S. S.; Day, T. J. F.; Voth, G. A. J. Phys.
Chem. B 2004, 108, 14804–14806.(29) Vacha, R.; Horinek, D.; Berkowitz, M. L.; Jungwirth, P. Phys.
Chem. Chem. Phys. 2008, 10, 4975–4980.(30) Zangi, R.; Engberts, J. B. F. N. J. Am. Chem. Soc. 2005,
127, 2272–2276.(31) Creux, P.; Lachaise, J.; Graciaa, A.; Beattie, J. K.; Djerdjev, A. M.
J. Phys. Chem. B 2009, 113, 14146–14150.(32) Gray-Weale, A.; Beattie, J. K. Phys. Chem. Chem. Phys. 2009,
11, 10994–11005.(33) Tian, C. S.; Shen, Y. R. Proc. Natl. Acad. Sci. U.S.A. 2009,
106, 15148–15153.(34) McFearin, C. L.; Richmond, G. L. Appl. Spectrosc. 2010,
64, 986–994.(35) Walker, D. S.; Brown, M.; McFearin, C. L.; Richmond, G. L.
J. Phys. Chem. B 2004, 108, 2111–2114.(36) Brown, M. G.; Walker, D. S.; Raymond, E. A.; Richmond, G. L.
J. Phys. Chem. B 2003, 107, 237–244.(37) Richmond, G. L. Chem. Rev. 2002, 102, 2693–2724.(38) Henry, M. C.; Wolf, L. K.; Messmer, M. C. J. Phys. Chem. B
2003, 107, 2765–2770.(39) Becraft, K. A.; Richmond, G. L. J. Phys. Chem. B 2005,
109, 5108–5117.(40) Ostroverkhov, V.; Waychunas, G. A.; Shen, Y. R. Phys. Rev. Lett.
2005, 94, 046102/1–046102/4.(41) Noguchi, H.; Hiroshi, M.; Tominaga, T.; Gong, J. P.; Osada, Y.;
Uosaki, K. Phys. Chem. Chem. Phys. 2008, 10, 4987–4993.(42) Schr€odle, S.; Richmond, G. L. J. Am. Chem. Soc. 2008,
130, 5072–5085.(43) Casford, M. T. L.; Davies, P. B.; Neivandt, N. J. Langmuir 2006,
22, 3105–3111.(44) Tyrode, E.; Rutland, M. W.; Bain, C. D. J. Am. Chem. Soc. 2008,
130, 17434–17445.(45) Hopkins, A. J.; Schr€odle, S.; Richmond, G. L. Langmuir 2010,
26, 10784–10790.(46) Shen, Y. R. The Principles of Nonlinear Optics; John Wiley: New
York, 1984.(47) Shen, Y. Nature 1989, 337, 519–525.(48) Bain, C. D. J. Chem. Soc., Faraday Trans. 1995, 91, 1281–96.(49) Buck, M.; Himmelhaus, M. J. Vac. Sci. Technol., A 2001,
19, 2717–2736.(50) Richmond, G. L. Annu. Rev. Phys. Chem. 2001, 52, 357–389.(51) Lambert, A. G.; Davies, P. B.; Neivandt, D. J. Appl. Spectrosc.
Rev. 2005, 40, 103–145.(52) Shen, Y. R.; Ostroverkhov, V. Chem. Rev. 2006, 106, 1140–1154.(53) Bain, C. D.; Davies, P. B.; Ward, R. N. Langmuir 1994, 10, 2060–3.
(54) Bain, C. D.; Davies, P. B.; Ong, T.H.;Ward, R. N.; Brown,M. A.Langmuir 1991, 7, 1563–1566.
(55) Liu, Y.; Wolf, L. K.; Messmer, M. C. Langmuir 2001,17, 4329–4335.
(56) Stalder, A. F.; Kulik, G.; Sage, D.; Barbieri, L.; Hoffmann, P.Colloids Surf., A 2006, 286, 92–103.
(57) Scatena, L. F.; Richmond, G. L. J. Phys. Chem. B 2004,108, 12518–12528.
(58) Scatena, L. F.; Richmond, G. L. Chem. Phys. Lett. 2004,383, 491–495.
(59) Scatena, L. F.; Brown, M. G.; Richmond, G. L. Science 2001,292, 908–912.
(60) Scatena, L. F.; Richmond, G. L. J. Phys. Chem. B 2001,105, 11240–11250.
(61) Brown, M. G.; Raymond, E. A.; Allen, H. C.; Scatena, L. F.;Richmond, G. L. J. Phys. Chem. A 2000, 104, 10220–10226.
(62) Raymond, E. A.; Tarbuck, T. L.; Brown,M. G.; Richmond, G. L.J. Phys. Chem. B 2003, 107, 546–556.
(63) Walker, D. S.; Richmond, G. L. J. Phys. Chem. C 2008,112, 201–209.
(64) Dalvi, V. H.; Rossky, P. J. Proc. Natl. Acad. Sci. U.S.A. 2010,107, 13603–13607.
(65) Becraft, K. A.; Richmond, G. L. Langmuir 2001, 17, 7721–7724.(66) Baldelli, S.; Schnitzer, C.; Shultz, M. J. J. Chem. Phys. 1998,
108, 9817–9820.(67) Smiechowski, M.; Stangret, J. J. Chem. Phys. 2006, 125, 204508.(68) Lane, J. M. D.; Chandross, M.; Lorenz, C. D.; Stevens, M. J.;
Grest, G. S. Langmuir 2008, 24, 5734–5739.(69) Tripp, C. P.; Hair, M. L. Langmuir 1992, 8, 1120–1126.(70) Becraft, K. A.;Moore, F. G.; Richmond, G. L. Phys. Chem. Chem.
Phys. 2004, 6, 1880–1889.(71) Sugimura, H.; Hozumi, A.; Kameyama, T.; Takai, O. Surf.
Interface Anal. 2002, 34, 550–554.(72) Hozumi, A.; Sugimura, H.; Yokogawa, Y.; Kameyama, T.;
Takai, O. Colloids Surf., A 2001, 182, 257–261.(73) Ye, S.; Nihonyanagi, S.; Uosaki, K. Phys. Chem. Chem. Phys.
2001, 3, 3463–3469.(74) Park, S. H.; Carignano, M. A.; Nap, R. J.; Szleifer, I. Soft Matter
2010, 6, 1644–1654.(75) Ong, S.; Zhao, X.; Eisenthal, K. B. Chem. Phys. Lett. 1992,
191, 327–335.(76) Konek, C. T.;Musorrafiti, M. J.; Al-Abadleh, H. A.; Bertin, P. A.;
Nguyen, S. T.; Geiger, F. M. J. Am. Chem. Soc. 2004, 126, 11754–11755.(77) Ostroverkhov, V.; Waychunas, G. A.; Shen, Y. R. Chem. Phys.
Lett. 2004, 386, 144–148.(78) Jena, K. C.; Hore, D. K. J. Phys. Chem. C 2009, 113, 15364–15372.(79) Graupe, M.; Koini, T.; Kim, H. I.; Garg, N.; Miura, Y. F.;
Takenaga, M.; Perry, S. S.; Lee, T. R. Colloids Surf., A 1999,154, 239–244.
(80) Colorado, R., Jr.; Lee, T. R. J. Phys. Org. Chem. 2000, 13, 796–807.(81) Takenaga, M.; Jo, S.; Graupe, M.; Lee, T. R. J. Colloid Interface
Sci. 2008, 320, 264–267.(82) Silberzan, P.; Leger, L.; Ausserre, D.; Benattar, J. J. Langmuir
1991, 7, 1647–1651.(83) Zhao, X. L.; Kopelman, R. J. Phys. Chem. 1996, 100, 11014–11018.(84) Lyklema, J. Fundamentals of Interface and Colloid Science;
Academic Press: New York, 1995; Vol. 2.(85) Adamson, A. W.; Gast, A. P. Physical Chemistry of Surfaces, 6th
ed.; John Wiley & Sons: New York, NY, 1997.(86) Walker, S. L.; Bhattacharjee, S.; Hoek, E. M. V.; Elimelech, M.
Langmuir 2002, 18, 2193–2198.(87) Behrens, S. H.; Grier, D. G. J. Chem. Phys. 2001, 115, 6716–6721.(88) Lide, D. R., Ed. Handbook of Chemistry and Physics, 76th ed.;
CRC Press: Boca Raton, FL, 1995.(89) Ulman, A.; Eilers, J. E.; Tillman, N. Langmuir 1989, 5, 1147–1152.(90) Gibbs, G. V.; Hill, F. C.; Boisen, M. B., Jr. Phys. Chem. Miner
1997, 24, 167–178.
Recommended