Role of nitrification and denitrification on the nitrous oxide cycle in
the eastern tropical North Pacific and Gulf of California
Hiroaki Yamagishi,1,2,3,4 Marian B. Westley,5,6 Brian N. Popp,7 Sakae Toyoda,2,8
Naohiro Yoshida,1,2,3,8,9 Shuichi Watanabe,1,2,10 Keisuke Koba,1,2,11
and Yasuhiro Yamanaka12,13
Received 16 May 2006; revised 23 November 2006; accepted 22 December 2006; published 4 May 2007.
[1] Nitrous oxide (N2O) is an important atmospheric greenhouse gas and is involvedin stratospheric ozone depletion. Analysis of the isotopomer ratios of N2O (i.e., theintramolecular distribution of 15N within the linear NNO molecule and the conventionalN and O isotope ratios) can elucidate the mechanisms of N2O production and destruction.We analyzed the isotopomer ratios of dissolved N2O at a site in the eastern tropicalNorth Pacific (ETNP) and a site in the Gulf of California (GOC). At these sites, the flux ofN2O to the atmosphere is extremely high but denitrification activity in the oxygenminimum zone (OMZ) also reduces N2O to N2. We estimated the isotopomeric enrichmentfactors for N2O reduction by denitrification. The factor was �11.6 ± 1.0% for the bulk(average) N, �19.8 ± 2.3% for the center N (a-site nitrogen), �3.4 ± 0.3% for theend N (b-site nitrogen), and �30.5 ± 3.2% for the 18O of N2O. Isotopomer analysisof N2O suggests that nitrifiers should contribute to N2O production more than denitrifiersat the oxycline above the OMZs in the ETNP (50–80 m) and in the GOC (80–300 m).In contrast, denitrifiers should largely contribute to the N2O production andconsumption in the OMZs both in the ETNP (120–130 m) and in the GOC (600–800 m).The N2O isotopomer analysis will be a useful tool for resolving the distribution of watermasses that carry a signal of N loss by denitrification.
Citation: Yamagishi, H., M. B. Westley, B. N. Popp, S. Toyoda, N. Yoshida, S. Watanabe, K. Koba, and Y. Yamanaka (2007), Role
of nitrification and denitrification on the nitrous oxide cycle in the eastern tropical North Pacific and Gulf of California, J. Geophys.
Res., 112, G02015, doi:10.1029/2006JG000227.
1. Introduction
[2] Nitrous oxide (N2O) is an important greenhouse gas[Ramanathan et al., 1985], and also plays a role instratospheric ozone chemistry [Crutzen, 1970]. The oceanis an important source of N2O to the atmosphere; howeverestimates of its annual emission vary widely, for example,3.0 ± 2 TgN [Intergovernmental Panel on Climate Change,2001] (17% of the total emission) and 5.8 ± 2 TgN[Nevison et al., 2003] (33% of the total emission), becauseobservations are limited and models of the oceanic N2Ocycle are still evolving. Nitrification and denitrification arethe main processes affecting the N2O cycle in the oceans[Suntharalingam and Sarmiento, 2000]. Under aerobic con-ditions, N2O is thought to be produced by autotrophic nitrifiersby chemical decomposition of hydroxylamine or of an inter-mediate between hydroxylamine and nitrite. Under low–oxygen conditions, N2O production by autotrophic nitrifiersis enhanced, because ammonia oxidation to nitrite is accom-panied by reduction of nitrite to N2O [Poth and Focht, 1985;Ritchie and Nicholas, 1972], a process called nitrifier denitri-fication [Poth and Focht, 1985; Wrage et al., 2001].[3] The eastern tropical North Pacific (ETNP) is one of
the three major low-oxygen regions of the world’s ocean,which account for most of the world’s water columndenitrification [Gruber and Sarmiento, 1997]. Annual
JOURNAL OF GEOPHYSICAL RESEARCH, VOL. 112, G02015, doi:10.1029/2006JG000227, 2007ClickHere
for
FullArticle
1Department of Environmental Science and Technology, Interdiscip-linary Graduate School of Science and Engineering, Tokyo Institute ofTechnology, Yokohama, Japan.
2SORST Project, Japan Science and Technology Agency (JST),Kawaguchi, Japan.
3Research Center for the Evolving Earth and Planets, Tokyo Institute ofTechnology, Okayama, Japan.
4Now at Atmospheric Environmental Division, National Institute forEnvironmental Studies, Tsukuba, Japan.
5Department of Oceanography, School of Ocean and Earth Science andTechnology, University of Hawaii, Honolulu, Hawaii, USA.
6Now at Geophysical Fluid Dynamics Laboratory, National Oceanicand Atmospheric Administration, Princeton, New Jersey, USA.
7Department of Geology and Geophysics, School of Ocean and EarthScience and Technology, University of Hawaii, Honolulu, Hawaii, USA.
8Department of Environmental Chemistry and Engineering, Inter-disciplinary Graduate School of Science and Engineering, Tokyo Instituteof Technology, Yokohama, Japan.
9Frontier Collaborative Research Center, Tokyo Institute of Technology,Yokohama, Japan.
10Mutsu Institute for Oceanography, Japan Agency for Marine-EarthScience and Technology, Mutsu, Japan.
11Now at Institute of Symbiotic Science and Technology, TokyoUniversity of Agriculture and Technology, Tokyo, Japan.
12Faculty of Environmental Earth Science, Hokkaido University,Sapporo, Japan.
13Frontier Research Center for Global Change, Japan Agency forMarine-Earth Science and Technology, Yokohama, Japan.
Copyright 2007 by the American Geophysical Union.0148-0227/07/2006JG000227$09.00
G02015 1 of 15
N2O emission is high from such low-oxygen regions[Nevison et al., 1995], and has been estimated to be 25–50% of the total oceanic emission [Suntharalingam et al.,2000]. Short-term fluctuations between a nondenitrificationmode and a denitrification mode in the ETNP and theArabian Sea could impact global climate by changes inN2O emission [Suthhof et al., 2001]. Therefore, in order topredict future changes in atmospheric N2O concentrationand to understand the impact of N2O on climate, it isessential to understand the N2O cycle in these low-oxygenregions in the oceans.[4] The production processes of N2O have been the
subject of study for many years. Cohen and Gordon[1978] measured N2O concentration in the ETNP andsuggested that N2O is produced by nitrification and con-sumed by denitrification on the basis of the correlationbetween N2O concentration and apparent oxygen utilization(AOU) and the inverse correlation between N2O concentra-tion and nitrate deficit. In contrast, Pierotti and Rasmussen[1980] suggested that denitrification acts as a net source ofN2O under oxygen concentration of 0.1–0.3 mL L�1,which is equivalent to 4.6–13.7 mmol kg�1 O2 whensigmaq is 26. Yoshida et al. [1984] suggested that thenitrogen isotope ratio of N2O in the ETNP indicates thatsubsurface water is a source of N2O and that the extremelyoxygen-depleted water is a sink. Yoshinari et al. [1997]analyzed nitrogen and oxygen isotope ratios of N2O in theoxic/suboxic boundaries in the ETNP and the Arabian Sea,and suggested that dissolved N2O is enriched in 15N and18O owing to N2O reduction (N2O!N2) by denitrificationand could be an important source of atmospheric N2Oenriched in 15N relative to tropospheric N2O. On the basisof the concentrations of nutrients and the bulk nitrogen andoxygen isotope ratios of N2O in the ETNP, Westley et al.[2001] suggested that N2O at the concentration maximum isproduced by nitrification within the subsurface oxyclinewhereas denitrification consumes N2O in the core of theoxygen minimum zone (OMZ). However, the roles ofmicrobial processes responsible for N2O production havenot been resolved sufficiently, in part owing to a lack ofadequate analytical tools.[5] Recently, techniques have been developed to measure
the isotopomer ratios of N2O (intramolecular distribution of15N within the linear NNO molecule) [Toyoda and Yoshida,1999; Brenninkmeijer and Rockmann, 1999]. Toyoda andYoshida [1999] defined the center and end positions of theN2O molecule as a and b nitrogen, respectively, and thedifference in isotope ratios between a and b-site nitrogen asthe ‘‘15N-site preference’’ (SP = d15Na� d15Nb). Isotopomeranalysis of N2O has been an important tool for resolving theN2O cycle in the oceans. For example, in the subtropicalNorth Pacific gyre, the minima o f d15N and d18O indicatedsubsurface production of N2O and accounted for more than40% of its emission from the surface to the atmosphere[Dore et al., 1998]. Subsequent isotopomer analysis ofN2O constrained the ratio to 40–75% and moreoversuggested that nitrification (via nitrifier-denitrification)accounted for the in situ N2O production [Popp et al.,2002].[6] For relating isotopomer measurements to the produc-
tion and consumption processes of N2O, isotopomericenrichment factors are essential. Recently, isotopomeric
enrichment factors for N2O production by nitrifiers [Sutkaet al., 2003, 2004a] and denitrifiers [Sutka et al., 2006;Toyoda et al., 2005] have been studied. However, there arefew reports on the isotopomeric enrichment factor for N2Oreduction by denitrifiers, which is necessary in order to useN2O isotopomer ratios quantitatively. Thus the objectives ofthis research are, first, to estimate the isotopomeric enrich-ment factor for N2O reduction and, second, to resolvequantitatively production and consumption processes ofnitrous oxide in the ETNP and Gulf of California (GOC)using N2O isotopomer analysis.[7] Here we estimated the isotopomeric enrichment factor
for N2O reduction in the core of the oxygen minimum zonein the ETNP. Applying this enrichment factor in a steadystate model for the N2O release from denitrifiers, weevaluated the contribution of each production process tothe N2O cycle in the ETNP and GOC. The isotopomeranalysis suggests that nitrifiers play a more important rolefor N2O production than denitrifiers in the subsurfacelayers, whereas denitrifiers produce and consume N2O atthe oxygen levels below about 1 mmol kg�1 in the upperand lower portions of the OMZs. We found that the SP ofN2O is a useful tool for resolving the N2O cycle under thesuboxic conditions in the oceans (Here we defined suboxiccondition as 1 � [O2] < 50 mmol kg�1).
2. Methods
2.1. Sampling
[8] Samples were collected in the ETNP (16�N, 107�W)at a site located in the core of the low-oxygen regionduring May–June 2000 on the R/V Revelle. The site is thesame as Station 5 of the Eastern Pacific Redox Experiment(EPREX) research cruise [Sansone et al., 2001; Sutka etal., 2004b; Westley et al., 2001]. Samples were alsocollected in the central GOC (26.30�N, 110.13�W) duringSeptember 2001 on the R/V New Horizon. The oxygenconcentration was determined by Winkler titration[Grasshoff et al., 1983]. Nitrite and ammonium were mea-sured using colorimetry [Grasshoff et al., 1983] and thefluorescence method of Jones [1991], respectively. Samplesfor N2O concentration and isotopomer ratios were collectedin 250-mL glass serum vials, preserved with HgCl2, andsealed with butyl rubber stoppers (see Popp et al. [2002] fordetails).
2.2. N2O Isotopomer Analysis
[9] For isotopomeric analysis, seawater was transferredfrom a serum vial to a sparging column and sparged withultrapure helium (purity > 99.99995%). Water vapor andCO2 were removed by magnesium perchlorate and NaOH(Ascarite II, GL Sciences Inc., Tokyo, Japan), respectively,and then extracted gases were collected on a stainless steeltrap immersed in liquid nitrogen. These gases were carriedby helium through Ascarite II and magnesium perchlorateagain, and then cryofocused. N2O was purified using aPoraPLOT-Q capillary column (25 m, 0.32 mm i.d., df =10 mm, Varian, Inc., Palo Alto, USA) at 27�C. The N2Oisotopomer ratios were determined by duplicate measure-ments on a Finnigan MAT 252 with modified collectors(Thermo electron corporation, Bremen, Germany). First theratios of d(45/44) and d(46/44) and the N2O concentration
G02015 YAMAGISHI ET AL.: N2O CYCLE IN THE ETNP AND GOC
2 of 15
G02015
were measured by monitoring mass (m/z) 44, 45, and 46 ionssimultaneously. Then the ratio of d(31/30) was measuredby monitoring mass (m/z) 30 and 31 fragment ions. Forthe analysis of d(31/30), samples were further purifiedusing a precolumn inserted after the preconcentration trapin order to remove an interfering substance detected inmass (m/z) 31. The substance is most likely a fluorocarbon(m/z 31 from CF+) [Kaiser et al., 2003]. The precolumn isa 1/4 inch o.d., 150-cm-long s.s. tube packed with silicagel (80/100 mesh) [Toyoda et al., 2005]. The final iso-topomer ratios were calculated following Toyoda andYoshida [1999]. We adopted the definition of Toyodaand Yoshida [1999] for the isotopomer/isotope ratios ofN2O, namely d15Na, d15Nb, d15Nbulk (conventional d15N),and d18O. Isotopomer ratios of N2O were calibrated with astandard gas produced by thermal decomposition ofNH4NO3 [Toyoda and Yoshida, 1999]. The precision wasestimated on the basis of the measurement of a laboratoryreference gas dissolved in pure water to be less than±0.2% for d15Nbulk, ±0.4% for d15Na, ±0.5% for d15Nb,±0.4% for d18O, and ±0.9% for SP (1s) of dissolved N2Oin duplicate 100 mL samples containing more than 20 nmolkg�1 N2O. Equilibrium concentration of N2O is calculatedfrom potential temperature and salinity using the equationof Weiss and Price [1980].
2.3. Advection-Diffusion-Reaction Model
[10] We estimated the isotopomeric enrichment factors forN2O reduction from the concentration and isotopomer ratiosof N2O at the ETNP site using one-dimensional, verticaladvection-diffusion-reaction models containing one reac-tion. Assuming steady state and that the vertical diffusioncoefficient (K) is independent of depth, we obtain thefollowing differential equation:
K @2N=@z2� �
� V @N=@zð Þ � Fz ¼ 0; ð1Þ
where K and V are the diffusion coefficient and advectionvelocity, respectively, in the z direction. The concentrationand reduction rate of nitrous oxide are denoted by N and Fz,respectively. The values of each parameter are described inthe Appendix. Assuming that N2O reduction by denitrifierscan be a pseudo-first-order reaction of N2O with the N2Oreduction rate (Fz) proportional only to the concentration ofN2O, the rate Fz is described as follows:
Fz ¼ mN ; ð2Þ
where, m is a reaction rate constant for the concentrationmodel (validation of this assumption is discussed insection 4.2 and section I of auxiliary material Text S11).The differential operators in equation (1) were replaced bythe Euler method of forward-difference approximations.The detailed procedure for estimating enrichment factorsfollows the model of Cline and Kaplan [1975]. In themodels, the step interval was set to 5 m. Fitting the modelto the measured N2O concentration gives N2O reductionrates at each depth.
[11] In our model, we designate N2O isotope or iso-topomer ratios with di:
di 0=00ð Þ ¼ Ri-sample=Ri-std � 1� �
� 1000 ð3Þ
where di is d15Nbulk, d18O, d15Na, or d15Nb, and std is astandard. Ri is
15Rbulk, 18R, 15Ra, or 15Rb, respectively,which are {[14N15N16O] + [15N14N16O]}/2 [14N14N16O],[14N14N18O]/[14N14N16O], [14N15N16O]/[14N14N16O], or[15N14N16O]/[14N14N16O], respectively. The fractionationfactors (ai) are defined following Mariotti et al. [1981],
ai � m=m; ð4Þ
where m is a reaction rate constant of the most abundantisotopomer, namely, 14N14N16O, for N2O reduction, idescribes bulk-N, 18O, a, or b, and mi are reaction rateconstants for either 15N- or 18O-isotopes, or either14N15N16O- (15Na-) or 15N14N16O- (15Nb-) isotopomers,respectively. Enrichment factors (ei) are defined followingMariotti et al. [1981],
ei � ai � 1ð Þ � 1000: ð5Þ
[12] This definition gives a negative value for an isotopic/isotopomeric enrichment factor, which is used in somereports [Mariotti et al., 1981; Ostrom et al., 2002]. Thebenefit of the definition is that it gives consistency betweenthe value of the site preference of produced N2O and theisotopomeric enrichment factors for decomposition of N2O(see section II of auxiliary material Text S1). Substitutingthe concentrations of 15N- and 18O-isotopes, and 15Na- and15Nb-isotopomers into equation (1), and using the defini-tions of di and ai from equations (3) and (4), we obtainequation (6) for the isotopomer model,
K Ndið Þ00�V Ndið Þ0�1000mi ai � 1ð ÞN � miai Ndið Þ ¼ 0; ð6Þ
where the primes refer to successive differentiation withrespect to depth. The differential operators in equation 6were replaced by the Euler method of forward-differenceapproximations [Cline and Kaplan, 1975]. The isotopo-meric enrichment factors were estimated by fitting themodels to the observed isotopomer ratios.
2.4. Interpreting Origins of N2O From IsotopomerAnalysis
[13] When interpreting N2O isotopomer ratios of (d15Na,d15Nb, d18O) quantitatively, it is reasonable to use isotopo-meric enrichment factors of (ea, eb, e18O). However, quan-titative analysis of d18O-N2O is difficult because oxygen ina substrate, nitrite, can exchange with that in water duringdenitrification [Casciotti et al., 2002; Shearer and Kohl,1988], and moreover there are no data on the isotopecomposition of O2 in the ETNP and GOC sites and ofd18O of nitrate in the GOC. On the other hand, the sitepreference of N2O is considered to be independent of theisotope ratios of the substrate during N2O production bynitrifiers and denitrifiers because the SP of N2O producedby nitrifiers [Sutka et al., 2003] and denitrifiers [Toyoda etal., 2005] is nearly constant even if the d15Nbulk and d18O ofN2O are changed owing to the increase of the isotope ratios1Auxiliary material data sets are available at ftp://ftp.agu.org/apend/jg/
2006jg000227. Other auxiliary material files are in the HTML.
G02015 YAMAGISHI ET AL.: N2O CYCLE IN THE ETNP AND GOC
3 of 15
G02015
of residual substrates. Considering that SP of N2O shouldnot be influenced by the isotope ratio of its substrates andthat d15Nbulk of N2O can be interpreted using enrichmentfactors of bulk nitrogen, analyzing N2O on a plot ofSP versus d15Nbulk should have more benefit than on a plotof d15Na versus d15Nb.[14] Thus we demonstrate the validity of the analysis of
isotopomer fractionation of N2O reduction on the plot ofSP versus d15Nbulk (see section II of auxiliary materialText S1 for details) and then we analyze the productionprocesses of N2O in the ETNP and GOC on a plot of SPversus d15Nbulk. In the case of a one step reaction(substrate ! product), we define apparent isotopomericfractionation factors of a-site or b-site nitrogens in N2Ofollowing Mariotti et al. [1981],
aa �15Ra
p
15Ras
!ð7aÞ
ab �15Rb
p
15Rbs
!; ð7bÞ
where subscripts of p and s are product and substrate,respectively. When equations (3) and (5) are inserted intoequations (7a) and (7b), and then the logarithm is taken, thefollowing equations are obtained:
ln 1þ ea1000
� �¼ ln 1þ
d15Nap
1000
!� ln 1þ d15Na
s
1000
� �ð8Þ
ln 1þ eb1000
� �¼ ln 1þ
d15Nbp
1000
!� ln 1þ d15Nb
s
1000
� �: ð9Þ
We define the isotopomeric enrichment factor for SP in N2Oas eSP � ea � eb. When the following conditions (equation(10)) can be applied, equations (8) and (9) can be combinedto give equation (11),
ea1000
;eb
1000;d15Na
p
1000;d15Nb
p
1000;d15Na
s
1000; and
d15Nbs
1000� 1 ð10Þ
SPp � SPs þ eSP: ð11Þ
Therefore a plot of SP versus d15Nbulk can be substituted fora plot of d15Na versus d15Nb during the analysis ofisotopomer effect for N2O production and consumption.[15] Since N2O is an intermediate of denitrification, the
isotopomer ratios of N2O inside the cell of denitrifiers andN2O dissolved in the water column should be different.Here we designate N2O inside denitrifiers and in the watercolumn as N2Ovivo and N2Ositu, respectively. Assuming thatthe flux of N2O released from the cells of denitrifiers duringdenitrification (the flux from N2Ovivo to N2Ositu) and theconsumption flux of dissolved N2O (the flux from N2Ositu
to N2Ovivo) are negligible compared with the rate ofdenitrification (the fluxes from NO3
� to N2Ovivo and N2Ovivo
to N2), isotopomer ratios of N2O released from the cell of
denitrifiers can be calculated [Barford et al., 1999]. TheN2O isotopomer ratios should be controlled by productionand reduction processes as follows:
d-NO�3 �������������!eNaR ;d-N2OD-pro
d-N2OD-rel �������������!eN2OR;d-N2D-pro
d-N2; ð12Þ
where the bold italic symbols of e and d indicate thematrices of (d15Nbulk, SP). The SP of d-NO3
� is recognizedas zero for convenience. The symbols of eNaR and eN2ORindicate the isotopomeric enrichment factors for nitratereduction to N2O and for N2O reduction to N2, respectively.The instantaneous products of N2O and N2 are expressed asd-N2OD-pro and d-N2D-pro, respectively. Barford et al.[1999] suggest the following correlations under steady state:
eNaR ¼ d-N2OD-pro � d-NO�3 ; ð13Þ
eN2OR ¼ d-N2D-pro � d-N2OD-rel; ð14Þ
d-N2D-pro ¼ d-N2OD-pro: ð15Þ
Isotopomer ratios of N2O produced by denitrifiers(d-N2O D-pro) and N2O released from denitrifiers (d-N2O D-rel)are calculated from equations (13), (14), and (15) as follows:
d-N2OD-pro ¼ d-NO�3 þ eNaR ð16Þ
d-N2OD-rel ¼ d-N2OD-pro � eN2OR: ð17Þ
N2O is released by nitrifiers and denitrifiers, and simulta-neously dissolved N2O is consumed by denitrifiers, thereforethe isotopomer ratios of dissolved N2O (d-N2Ositu) can bewritten as follows:
d-N2Ositu ¼ td-N2ON-pro þ 1� tð Þd-N2OD-rel � veN2OR; ð18Þ
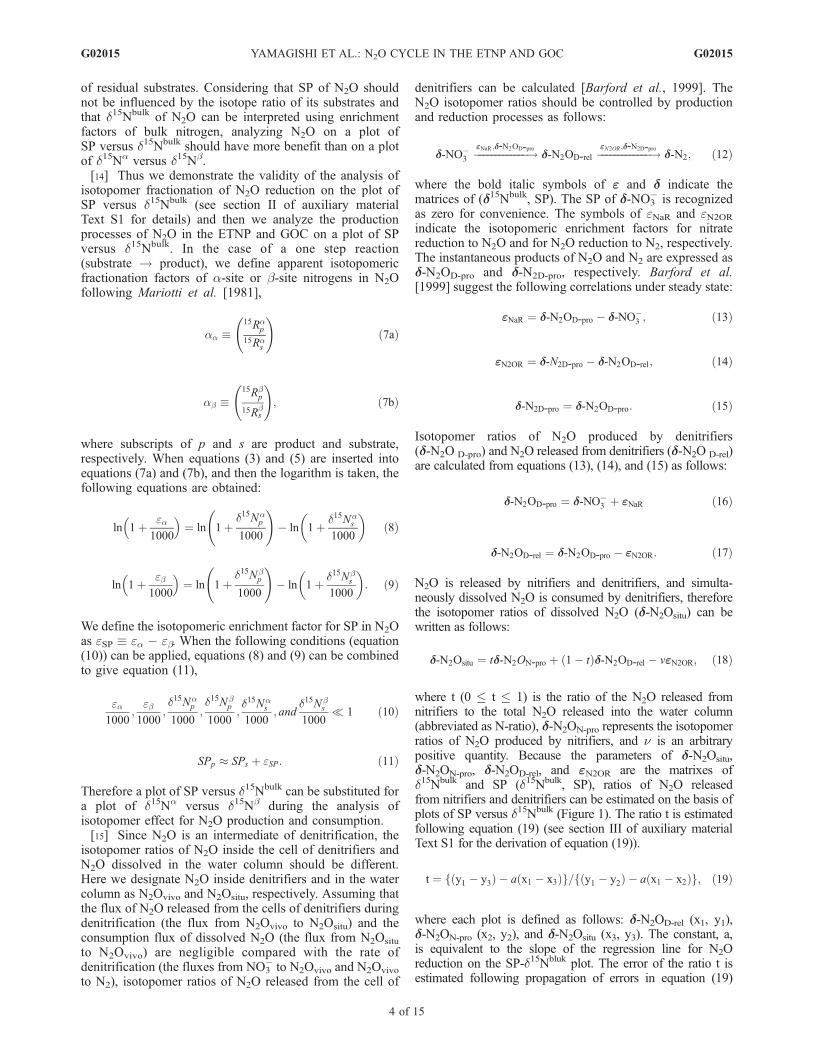
where t (0 � t � 1) is the ratio of the N2O released fromnitrifiers to the total N2O released into the water column(abbreviated as N-ratio), d-N2ON-pro represents the isotopomerratios of N2O produced by nitrifiers, and n is an arbitrarypositive quantity. Because the parameters of d-N2Ositu,d-N2ON-pro, d-N2OD-rel, and eN2OR are the matrixes ofd15Nbulk and SP (d15Nbulk, SP), ratios of N2O releasedfrom nitrifiers and denitrifiers can be estimated on the basis ofplots of SP versus d15Nbulk (Figure 1). The ratio t is estimatedfollowing equation (19) (see section III of auxiliary materialText S1 for the derivation of equation (19)).
t ¼ f y1 � y3ð Þ � a x1 � x3ð Þg=f y1 � y2ð Þ � a x1 � x2ð Þg; ð19Þ
where each plot is defined as follows: d-N2OD-rel (x1, y1),d-N2ON-pro (x2, y2), and d-N2Ositu (x3, y3). The constant, a,is equivalent to the slope of the regression line for N2Oreduction on the SP-d15Nbluk plot. The error of the ratio t isestimated following propagation of errors in equation (19)
G02015 YAMAGISHI ET AL.: N2O CYCLE IN THE ETNP AND GOC
4 of 15
G02015
using a = 1.43 ± 0.14, which was estimated from theregression line over the depth range 400–700 m at theETNP site.
3. Results
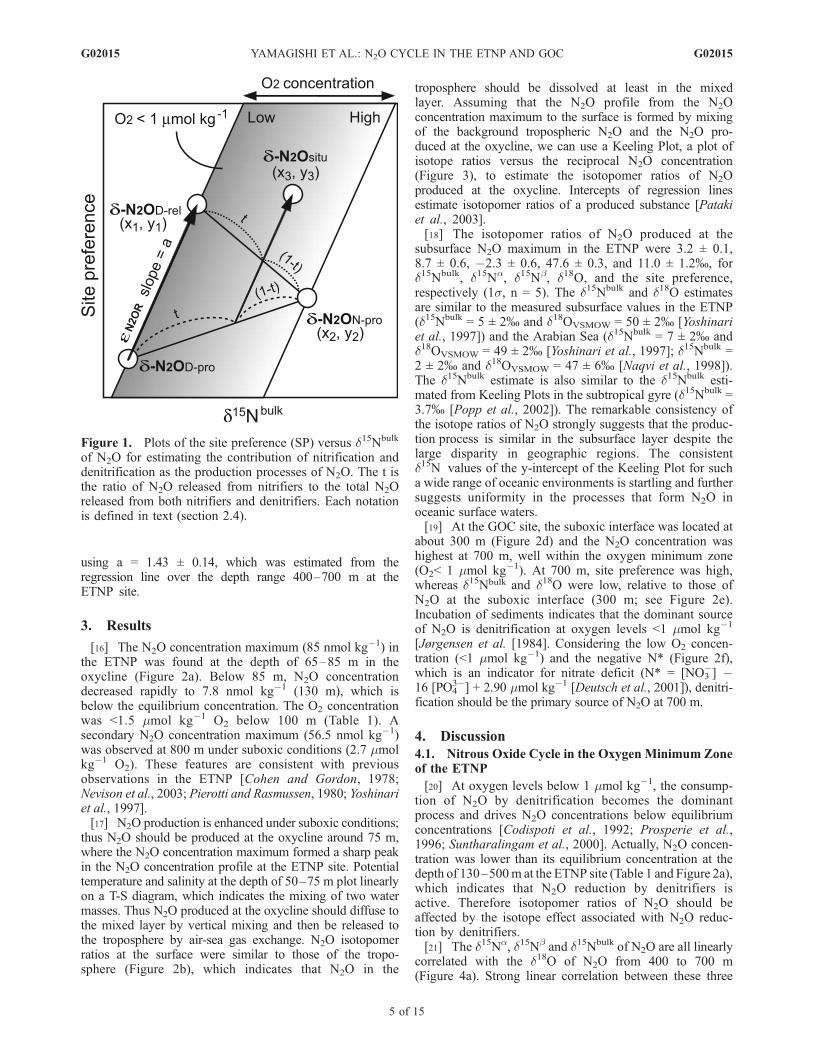
[16] The N2O concentration maximum (85 nmol kg�1) inthe ETNP was found at the depth of 65–85 m in theoxycline (Figure 2a). Below 85 m, N2O concentrationdecreased rapidly to 7.8 nmol kg�1 (130 m), which isbelow the equilibrium concentration. The O2 concentrationwas <1.5 mmol kg�1 O2 below 100 m (Table 1). Asecondary N2O concentration maximum (56.5 nmol kg�1)was observed at 800 m under suboxic conditions (2.7 mmolkg�1 O2). These features are consistent with previousobservations in the ETNP [Cohen and Gordon, 1978;Nevison et al., 2003; Pierotti and Rasmussen, 1980; Yoshinariet al., 1997].[17] N2O production is enhanced under suboxic conditions;
thus N2O should be produced at the oxycline around 75 m,where the N2O concentration maximum formed a sharp peakin the N2O concentration profile at the ETNP site. Potentialtemperature and salinity at the depth of 50–75 m plot linearlyon a T-S diagram, which indicates the mixing of two watermasses. Thus N2O produced at the oxycline should diffuse tothe mixed layer by vertical mixing and then be released tothe troposphere by air-sea gas exchange. N2O isotopomerratios at the surface were similar to those of the tropo-sphere (Figure 2b), which indicates that N2O in the
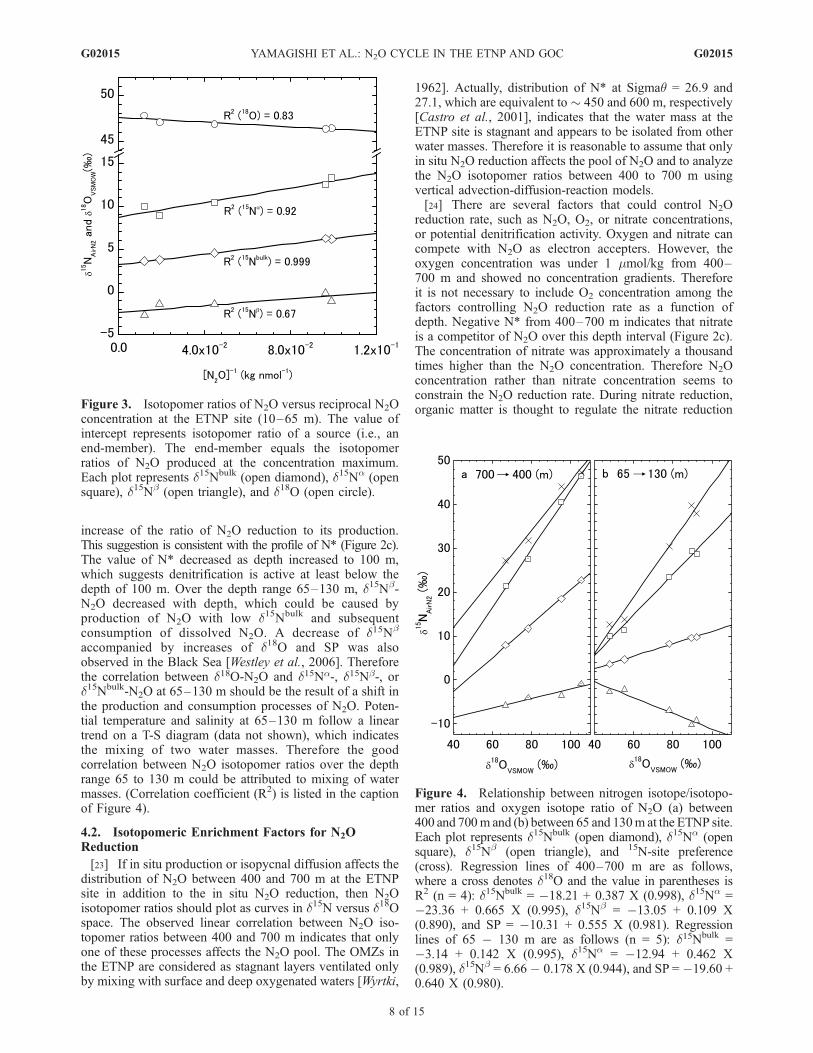
troposphere should be dissolved at least in the mixedlayer. Assuming that the N2O profile from the N2Oconcentration maximum to the surface is formed by mixingof the background tropospheric N2O and the N2O pro-duced at the oxycline, we can use a Keeling Plot, a plot ofisotope ratios versus the reciprocal N2O concentration(Figure 3), to estimate the isotopomer ratios of N2Oproduced at the oxycline. Intercepts of regression linesestimate isotopomer ratios of a produced substance [Patakiet al., 2003].[18] The isotopomer ratios of N2O produced at the
subsurface N2O maximum in the ETNP were 3.2 ± 0.1,8.7 ± 0.6, �2.3 ± 0.6, 47.6 ± 0.3, and 11.0 ± 1.2%, ford15Nbulk, d15Na, d15Nb, d18O, and the site preference,respectively (1s, n = 5). The d15Nbulk and d18O estimatesare similar to the measured subsurface values in the ETNP(d15Nbulk = 5 ± 2% and d18OVSMOW = 50 ± 2% [Yoshinariet al., 1997]) and the Arabian Sea (d15Nbulk = 7 ± 2% andd18OVSMOW = 49 ± 2% [Yoshinari et al., 1997]; d15Nbulk =2 ± 2% and d18OVSMOW = 47 ± 6% [Naqvi et al., 1998]).The d15Nbulk estimate is also similar to the d15Nbulk esti-mated from Keeling Plots in the subtropical gyre (d15Nbulk =3.7% [Popp et al., 2002]). The remarkable consistency ofthe isotope ratios of N2O strongly suggests that the produc-tion process is similar in the subsurface layer despite thelarge disparity in geographic regions. The consistentd15N values of the y-intercept of the Keeling Plot for sucha wide range of oceanic environments is startling and furthersuggests uniformity in the processes that form N2O inoceanic surface waters.[19] At the GOC site, the suboxic interface was located at
about 300 m (Figure 2d) and the N2O concentration washighest at 700 m, well within the oxygen minimum zone(O2< 1 mmol kg�1). At 700 m, site preference was high,whereas d15Nbulk and d18O were low, relative to those ofN2O at the suboxic interface (300 m; see Figure 2e).Incubation of sediments indicates that the dominant sourceof N2O is denitrification at oxygen levels <1 mmol kg�1
[Jørgensen et al. [1984]. Considering the low O2 concen-tration (<1 mmol kg�1) and the negative N* (Figure 2f),which is an indicator for nitrate deficit (N* = [NO3
�] �16 [PO4
3�] + 2.90 mmol kg�1 [Deutsch et al., 2001]), denitri-fication should be the primary source of N2O at 700 m.
4. Discussion
4.1. Nitrous Oxide Cycle in the Oxygen Minimum Zoneof the ETNP
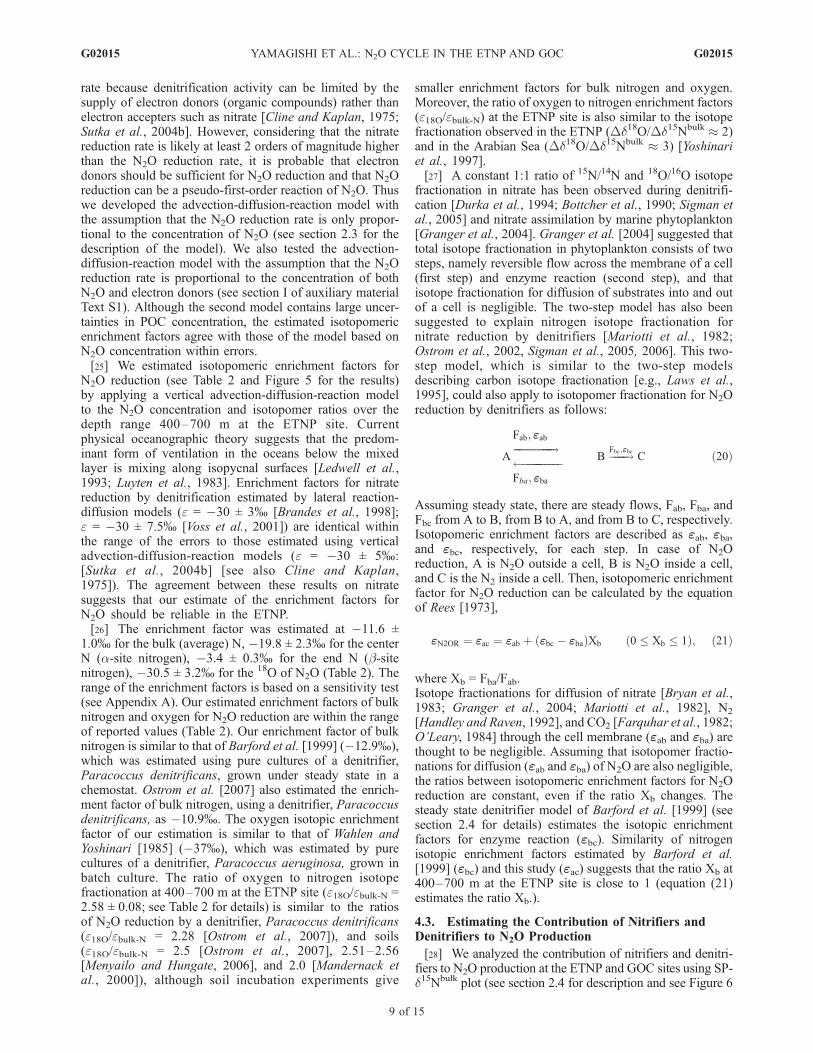
[20] At oxygen levels below 1 mmol kg�1, the consump-tion of N2O by denitrification becomes the dominantprocess and drives N2O concentrations below equilibriumconcentrations [Codispoti et al., 1992; Prosperie et al.,1996; Suntharalingam et al., 2000]. Actually, N2O concen-tration was lower than its equilibrium concentration at thedepth of 130–500m at the ETNP site (Table 1 and Figure 2a),which indicates that N2O reduction by denitrifiers isactive. Therefore isotopomer ratios of N2O should beaffected by the isotope effect associated with N2O reduc-tion by denitrifiers.[21] The d15Na, d15Nb and d15Nbulk of N2O are all linearly
correlated with the d18O of N2O from 400 to 700 m(Figure 4a). Strong linear correlation between these three
Figure 1. Plots of the site preference (SP) versus d15Nbulk
of N2O for estimating the contribution of nitrification anddenitrification as the production processes of N2O. The t isthe ratio of N2O released from nitrifiers to the total N2Oreleased from both nitrifiers and denitrifiers. Each notationis defined in text (section 2.4).
G02015 YAMAGISHI ET AL.: N2O CYCLE IN THE ETNP AND GOC
5 of 15
G02015
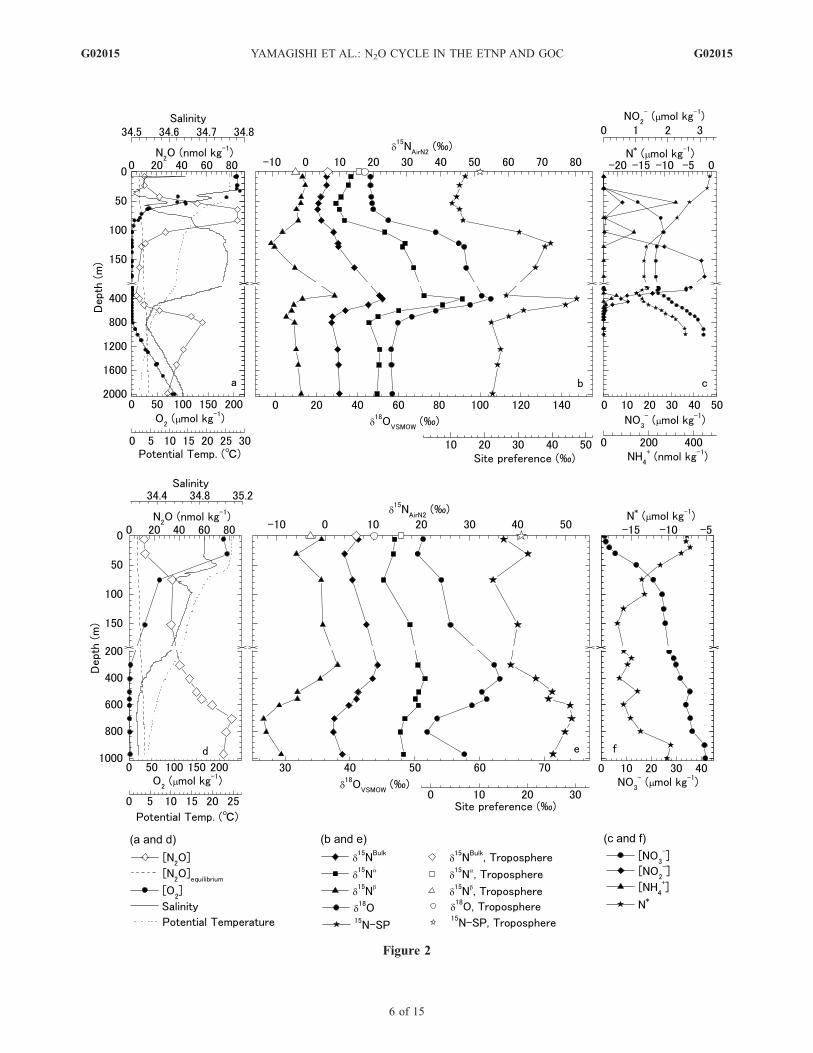
Figure 2
G02015 YAMAGISHI ET AL.: N2O CYCLE IN THE ETNP AND GOC
6 of 15
G02015
independent parameters (d15Nbulk, d18O, and SP) is strongevidence for either isotopomer fractionation associated with aone-step reaction or mixing of two different pools of N2O.Since N2O consumption is surely active at oxygen levelsbelow 1 mmol kg�1 and mixing of waters by cross-isopycnaldiffusion across 300 m is unlikely to account for the linearcorrelation, we suggest that the highly linear correlationsbetween 400 and 700 m (Figure 4a) result from N2Oconsumption by denitrification rather than by mixingbetween isotopically distinct pools of N2O. The d15Nbulk,d15Na, d18O, and SP of N2O increased as N2O concentrationdecreased, and the d15Nb slightly increased from 700 m to400 m (Figures 2a and 2b). This correlation is consistent withkinetic isotope effects associated with the cleavage of theN-O bonds during N2O reduction by denitrification [Popp
et al., 2002; Toyoda et al., 2002; Westley et al., 2006].Therefore the concentration and isotopomer ratios of N2Ofrom 700 to 400 m suggest that the N2O is produced in thesuboxic zone (the area below 750 m, where [O2] � 1 mmolkg�1) and then diffuses and advects into the OMZ up to400 m, which is the strongest anoxic zone at the ETNP siteon the basis of ammonium accumulation (Figure 2c).[22] Linear correlations between d18O-N2O and d15Na-,
d15Nb-, or d15Nbulk-N2O were also observed over the depthrange 65–130 m (Figure 4b). At 65 m, low d15Nbulk, d18O,and SP of N2O relative to that in the troposphere can beattributed to the N2O production under suboxic conditions.From 65 m to 130 m, oxygen concentration decreases withdepth, which results in the shift of the N2O productionprocess from nitrification to denitrification, and the
Table 1. Concentration and Isotopomer Ratios of N2O in the Eastern Tropical North Pacific and Gulf of California
Depth, m Sigmaq O2, mmol kg�1 N2O, nmol kg�1 Saturation,a % d15Nbulk, % d15Na, % d15Nb, % d18O, % SP, %
Eastern Tropical North Pacific (16�N, 107�W)10 22.34 205.41 10.07 172 6.15 13.31 �1.02 46.45 14.3325 22.42 205.49 10.37 177 6.23 12.56 �0.10 46.37 12.6645 22.55 185.64 22.45 379 4.51 10.40 �1.38 46.87 11.7855 23.48 105.94 52.37 810 3.75 8.92 �1.42 47.11 10.3565 25.02 30.77 84.79 1099 3.60 9.93 �2.74 47.81 12.6885 25.67 5.54 84.57 1009 4.62 11.44 �2.20 55.21 13.64105 26.02 0.65 26.89 306 8.26 23.43 �6.91 78.19 30.34120 26.12 1.41 10.58 119 9.58 29.43 �10.27 89.52 39.70130 26.16 0.40 7.84 88 9.70 28.71 �9.30 92.26 38.01165 26.38 0.47 b 6.10 66 14.37 31.96 �3.22 93.34 35.17350 26.73 0.19 3.80 38 21.82 35.08 8.57 100.75 26.50400 26.83 0.39 6.27 60 22.74 46.42 �0.95 105.30 47.37500 26.96 0.76 9.82 91 18.50 40.56 �3.56 95.15 44.12600 27.09 0.28 22.19 198 11.73 27.58 �4.12 78.19 31.70700 27.19 0.45 47.48 411 7.85 21.47 �5.77 66.64 27.24800 27.27 2.70 56.51 477 7.71 18.73 �3.30 59.97 22.031250 27.49 27.50 41.77 330 9.52 21.93 �2.89 56.51 24.821510 27.57 47.49 35.92 277 9.76 21.73 �2.20 56.88 23.931995 27.66 80.13 28.85 216 9.92 21.15 �1.32 57.06 22.47
Gulf of California (26.30�N, 110.13�W)5 23.38 208.81 12.19 194 6.90 14.47 �0.67 51.29 15.1430 23.43 216.77 12.61 201 4.14 14.20 �5.92 50.42 20.1275 24.79 67.88 34.40 459 5.70 12.15 �0.75 54.08 12.89150 25.90 34.21 33.58 385 8.60 17.62 �0.41 55.52 18.03300 26.38 3.05 40.54 411 10.97 19.26 2.68 62.21 16.58405 26.59 1.22 48.20 460 9.90 20.78 �0.99 63.12 21.76505 26.76 0.61 53.87 490 6.89 19.50 �5.72 60.34 25.23555 26.83 0.61 58.04 517 6.55 18.78 �5.69 61.09 24.46605 26.88 0.61 66.59 584 4.95 19.40 �9.49 58.81 28.88705 26.94 0.61 82.17 706 1.94 16.55 �12.67 53.39 29.22805 27.03 1.22 77.84 652 1.76 15.68 �12.17 51.88 27.85970 27.12 2.44 75.40 614 3.62 16.30 �9.06 57.60 25.35aSaturation (%) = [N2O]measured/[N2O]equilibrium � 100. Equilibrated concentration was calculated following Weiss and Price [1980].bOxygen concentration was measured from a different cast with the cast of N2O.
Figure 2. Concentration and isotopomer ratios of N2O and concentrations of O2 and nitrogen compounds plotted versusdepth in (a, b, c) the ETNP and (d, e, f) the Gulf of California. Figures 2a and 2d show N2O concentration (open diamond),O2 concentration (solid circle), equilibrium N2O concentration (dashed line), salinity (solid line), and potential temperature(dotted line). Figures 2b and 2e show d15Nbulk (solid diamond), d15Na (solid square), d15Nb (solid triangle), d18O (solidcircle), and 15N-site preference (solid star) of dissolved N2O; d
15Nbulk (open diamond), d15Na (open square), d15Nb (opentriangle), d18O (open circle), and 15N-site preference (open star) of tropospheric N2O [Yoshida and Toyoda, 2000].Figures 2c and 2f show nitrate (solid circle), nitrite (solid diamond), and ammonia (solid triangle) concentrations, and N*(solid star). In Figure 2f, nitrate concentration and N* were calculated from the annual analyzed mean nutrient, salinity, andtemperature at 26.5�N, 110.5�W [Boyer et al., 2002; Conkright et al., 2002; Stephens et al., 2002]. All isotopic values areexpressed as permil (%) deviations from atmospheric N2 (for nitrogen) and VSMOW (for oxygen). The equilibriumconcentration of N2O was calculated following Weiss and Price [1980].
G02015 YAMAGISHI ET AL.: N2O CYCLE IN THE ETNP AND GOC
7 of 15
G02015
increase of the ratio of N2O reduction to its production.This suggestion is consistent with the profile of N* (Figure 2c).The value of N* decreased as depth increased to 100 m,which suggests denitrification is active at least below thedepth of 100 m. Over the depth range 65–130 m, d15Nb-N2O decreased with depth, which could be caused byproduction of N2O with low d15Nbulk and subsequentconsumption of dissolved N2O. A decrease of d15Nb
accompanied by increases of d18O and SP was alsoobserved in the Black Sea [Westley et al., 2006]. Thereforethe correlation between d18O-N2O and d15Na-, d15Nb-, ord15Nbulk-N2O at 65–130 m should be the result of a shift inthe production and consumption processes of N2O. Poten-tial temperature and salinity at 65–130 m follow a lineartrend on a T-S diagram (data not shown), which indicatesthe mixing of two water masses. Therefore the goodcorrelation between N2O isotopomer ratios over the depthrange 65 to 130 m could be attributed to mixing of watermasses. (Correlation coefficient (R2) is listed in the captionof Figure 4).
4.2. Isotopomeric Enrichment Factors for N2OReduction
[23] If in situ production or isopycnal diffusion affects thedistribution of N2O between 400 and 700 m at the ETNPsite in addition to the in situ N2O reduction, then N2Oisotopomer ratios should plot as curves in d15N versus d18Ospace. The observed linear correlation between N2O iso-topomer ratios between 400 and 700 m indicates that onlyone of these processes affects the N2O pool. The OMZs inthe ETNP are considered as stagnant layers ventilated onlyby mixing with surface and deep oxygenated waters [Wyrtki,
1962]. Actually, distribution of N* at Sigmaq = 26.9 and27.1, which are equivalent to � 450 and 600 m, respectively[Castro et al., 2001], indicates that the water mass at theETNP site is stagnant and appears to be isolated from otherwater masses. Therefore it is reasonable to assume that onlyin situ N2O reduction affects the pool of N2O and to analyzethe N2O isotopomer ratios between 400 to 700 m usingvertical advection-diffusion-reaction models.[24] There are several factors that could control N2O
reduction rate, such as N2O, O2, or nitrate concentrations,or potential denitrification activity. Oxygen and nitrate cancompete with N2O as electron accepters. However, theoxygen concentration was under 1 mmol/kg from 400–700 m and showed no concentration gradients. Thereforeit is not necessary to include O2 concentration among thefactors controlling N2O reduction rate as a function ofdepth. Negative N* from 400–700 m indicates that nitrateis a competitor of N2O over this depth interval (Figure 2c).The concentration of nitrate was approximately a thousandtimes higher than the N2O concentration. Therefore N2Oconcentration rather than nitrate concentration seems toconstrain the N2O reduction rate. During nitrate reduction,organic matter is thought to regulate the nitrate reductionFigure 3. Isotopomer ratios of N2O versus reciprocal N2O
concentration at the ETNP site (10–65 m). The value ofintercept represents isotopomer ratio of a source (i.e., anend-member). The end-member equals the isotopomerratios of N2O produced at the concentration maximum.Each plot represents d15Nbulk (open diamond), d15Na (opensquare), d15Nb (open triangle), and d18O (open circle).
Figure 4. Relationship between nitrogen isotope/isotopo-mer ratios and oxygen isotope ratio of N2O (a) between400 and 700m and (b) between 65 and 130m at the ETNP site.Each plot represents d15Nbulk (open diamond), d15Na (opensquare), d15Nb (open triangle), and 15N-site preference(cross). Regression lines of 400–700 m are as follows,where a cross denotes d18O and the value in parentheses isR2 (n = 4): d15Nbulk = �18.21 + 0.387 X (0.998), d15Na =�23.36 + 0.665 X (0.995), d15Nb = �13.05 + 0.109 X(0.890), and SP = �10.31 + 0.555 X (0.981). Regressionlines of 65 � 130 m are as follows (n = 5): d15Nbulk =�3.14 + 0.142 X (0.995), d15Na = �12.94 + 0.462 X(0.989), d15Nb = 6.66� 0.178 X (0.944), and SP = �19.60 +0.640 X (0.980).
G02015 YAMAGISHI ET AL.: N2O CYCLE IN THE ETNP AND GOC
8 of 15
G02015
rate because denitrification activity can be limited by thesupply of electron donors (organic compounds) rather thanelectron accepters such as nitrate [Cline and Kaplan, 1975;Sutka et al., 2004b]. However, considering that the nitratereduction rate is likely at least 2 orders of magnitude higherthan the N2O reduction rate, it is probable that electrondonors should be sufficient for N2O reduction and that N2Oreduction can be a pseudo-first-order reaction of N2O. Thuswe developed the advection-diffusion-reaction model withthe assumption that the N2O reduction rate is only propor-tional to the concentration of N2O (see section 2.3 for thedescription of the model). We also tested the advection-diffusion-reaction model with the assumption that the N2Oreduction rate is proportional to the concentration of bothN2O and electron donors (see section I of auxiliary materialText S1). Although the second model contains large uncer-tainties in POC concentration, the estimated isotopomericenrichment factors agree with those of the model based onN2O concentration within errors.[25] We estimated isotopomeric enrichment factors for
N2O reduction (see Table 2 and Figure 5 for the results)by applying a vertical advection-diffusion-reaction modelto the N2O concentration and isotopomer ratios over thedepth range 400–700 m at the ETNP site. Currentphysical oceanographic theory suggests that the predom-inant form of ventilation in the oceans below the mixedlayer is mixing along isopycnal surfaces [Ledwell et al.,1993; Luyten et al., 1983]. Enrichment factors for nitratereduction by denitrification estimated by lateral reaction-diffusion models (e = �30 ± 3% [Brandes et al., 1998];e = �30 ± 7.5% [Voss et al., 2001]) are identical withinthe range of the errors to those estimated using verticaladvection-diffusion-reaction models (e = �30 ± 5%:[Sutka et al., 2004b] [see also Cline and Kaplan,1975]). The agreement between these results on nitratesuggests that our estimate of the enrichment factors forN2O should be reliable in the ETNP.[26] The enrichment factor was estimated at �11.6 ±
1.0% for the bulk (average) N, �19.8 ± 2.3% for the centerN (a-site nitrogen), �3.4 ± 0.3% for the end N (b-sitenitrogen), �30.5 ± 3.2% for the 18O of N2O (Table 2). Therange of the enrichment factors is based on a sensitivity test(see Appendix A). Our estimated enrichment factors of bulknitrogen and oxygen for N2O reduction are within the rangeof reported values (Table 2). Our enrichment factor of bulknitrogen is similar to that of Barford et al. [1999] (�12.9%),which was estimated using pure cultures of a denitrifier,Paracoccus denitrificans, grown under steady state in achemostat. Ostrom et al. [2007] also estimated the enrich-ment factor of bulk nitrogen, using a denitrifier, Paracoccusdenitrificans, as �10.9%. The oxygen isotopic enrichmentfactor of our estimation is similar to that of Wahlen andYoshinari [1985] (�37%), which was estimated by purecultures of a denitrifier, Paracoccus aeruginosa, grown inbatch culture. The ratio of oxygen to nitrogen isotopefractionation at 400–700 m at the ETNP site (e18O/ebulk-N =2.58 ± 0.08; see Table 2 for details) is similar to the ratiosof N2O reduction by a denitrifier, Paracoccus denitrificans(e18O/ebulk-N = 2.28 [Ostrom et al., 2007]), and soils(e18O/ebulk-N = 2.5 [Ostrom et al., 2007], 2.51–2.56[Menyailo and Hungate, 2006], and 2.0 [Mandernack etal., 2000]), although soil incubation experiments give
smaller enrichment factors for bulk nitrogen and oxygen.Moreover, the ratio of oxygen to nitrogen enrichment factors(e18O/ebulk-N) at the ETNP site is also similar to the isotopefractionation observed in the ETNP (Dd18O/Dd15Nbulk � 2)and in the Arabian Sea (Dd18O/Dd15Nbulk � 3) [Yoshinariet al., 1997].[27] A constant 1:1 ratio of 15N/14N and 18O/16O isotope
fractionation in nitrate has been observed during denitrifi-cation [Durka et al., 1994; Bottcher et al., 1990; Sigman etal., 2005] and nitrate assimilation by marine phytoplankton[Granger et al., 2004]. Granger et al. [2004] suggested thattotal isotope fractionation in phytoplankton consists of twosteps, namely reversible flow across the membrane of a cell(first step) and enzyme reaction (second step), and thatisotope fractionation for diffusion of substrates into and outof a cell is negligible. The two-step model has also beensuggested to explain nitrogen isotope fractionation fornitrate reduction by denitrifiers [Mariotti et al., 1982;Ostrom et al., 2002, Sigman et al., 2005, 2006]. This two-step model, which is similar to the two-step modelsdescribing carbon isotope fractionation [e.g., Laws et al.,1995], could also apply to isotopomer fractionation for N2Oreduction by denitrifiers as follows:
A
Fab; eab������������! �����������Fba; eba
B �����!Fbc;ebcC ð20Þ
Assuming steady state, there are steady flows, Fab, Fba, andFbc from A to B, from B to A, and from B to C, respectively.Isotopomeric enrichment factors are described as eab, eba,and ebc, respectively, for each step. In case of N2Oreduction, A is N2O outside a cell, B is N2O inside a cell,and C is the N2 inside a cell. Then, isotopomeric enrichmentfactor for N2O reduction can be calculated by the equationof Rees [1973],
eN2OR ¼ eac ¼ eab þ ebc � ebað ÞXb 0 � Xb � 1ð Þ; ð21Þ
where Xb = Fba/Fab.Isotope fractionations for diffusion of nitrate [Bryan et al.,1983; Granger et al., 2004; Mariotti et al., 1982], N2
[Handley and Raven, 1992], and CO2 [Farquhar et al., 1982;O’Leary, 1984] through the cell membrane (eab and eba) arethought to be negligible. Assuming that isotopomer fractio-nations for diffusion (eab and eba) of N2O are also negligible,the ratios between isotopomeric enrichment factors for N2Oreduction are constant, even if the ratio Xb changes. Thesteady state denitrifier model of Barford et al. [1999] (seesection 2.4 for details) estimates the isotopic enrichmentfactors for enzyme reaction (ebc). Similarity of nitrogenisotopic enrichment factors estimated by Barford et al.[1999] (ebc) and this study (eac) suggests that the ratio Xb at400–700 m at the ETNP site is close to 1 (equation (21)estimates the ratio Xb.).
4.3. Estimating the Contribution of Nitrifiers andDenitrifiers to N2O Production
[28] We analyzed the contribution of nitrifiers and denitri-fiers to N2O production at the ETNP and GOC sites using SP-d15Nbulk plot (see section 2.4 for description and see Figure 6
G02015 YAMAGISHI ET AL.: N2O CYCLE IN THE ETNP AND GOC
9 of 15
G02015
for the results). For the SP-d15Nbulk analysis, we calculated theisotopomer ratios of N2O released by denitrifiers (d-N2OD-rel)and adopted the reference value estimated by Popp et al.[2002] for the isotopomer ratios of N2O released by nitrifiers(d-N2ON-pro) (see Tables 3a and 3b for detail calculations). Weestimated the range of nitrogen isotope ratio in nitrate in theETNP andGOC on the basis of previous studies at the depth of
our observations (see references in Table 3a). The value ofd-N2OD-rel was calculated using equations (16) and (17), andisotopomeric enrichment factors of eNaR (NO3
� ! N2O) andeN2OR (N2O! N2) listed in Table 3b. Variation of d-N2OD-rel
was determined using a propagation of error calculation.[29] There are two choices for the isotopomer ratios of
N2O produced by nitrifiers (d-N2ON-pro): estimation based
Table 2. Isotopomeric Enrichment Factors for N2O Reductiona
Isotopomeric enrichment factor, %
Conditions Referenceebulk-N ea eb e180 e180/ebulk-Nb
�11.6 ± 1.0 �19.8 ± 2.3 �3.4 ± 0.3 �30.5 ± 3.2 2.58 ± 0.08 eastern tropical North Pacific(advection-diffusion-reaction models)
this study (400–700 m in theETNP)
�6.9– �9.8 �12.6– �24.9 2.51 incubation of soil collected under larch in Siberia Menyailo and Hungate [2006]�6.3– �8.3 �16– �21 2.55– 2.56 incubation of soil collected under birch in Siberia Menyailo and Hungate [2006]�12.9c . . . . . . . . . . . . chemostat culture of Paracoccus denitrificans Barford et al. [1999]�39 . . . . . . . . . . . . pure culture of Azotobacter vinelandii at 25�Cd Yamazaki et al. [1987]. . . . . . . . . �42 . . . pure culture of Pseudomonas aeruginosa at 10�C Wahlen and Yoshinari [1985]. . . . . . . . . �37 . . . pure culture of Pseudomonas aeruginosa at 26�C Wahlen and Yoshinari [1985]�2.4 . . . . . . �4.9 2.0 incubation of landfill soil in ambient air at 24�C Mandernack et al. [2000]. . . . . . . . . . . . �2 correlation between d15Nbulk and d18O in N2O
dissolved in the eastern tropical North PacificYoshinari et al. [1997]
. . . . . . . . . . . . �3 correlation between d15Nbulk and d18O in N2Odissolved in the Arabian Sea
Yoshinari et al. [1997]
aN2O ! N2.bThe ratio of e18O/ebulk-N is equivalent to the slope of the regression line on d18O versus d15N plot (n = 4, R2 = 0.998). The error of e18O/ebulk-N is
equivalent to the error of the slope of the regression line.cAverage value of replicate experiments.d A N2-fixing bacterium.
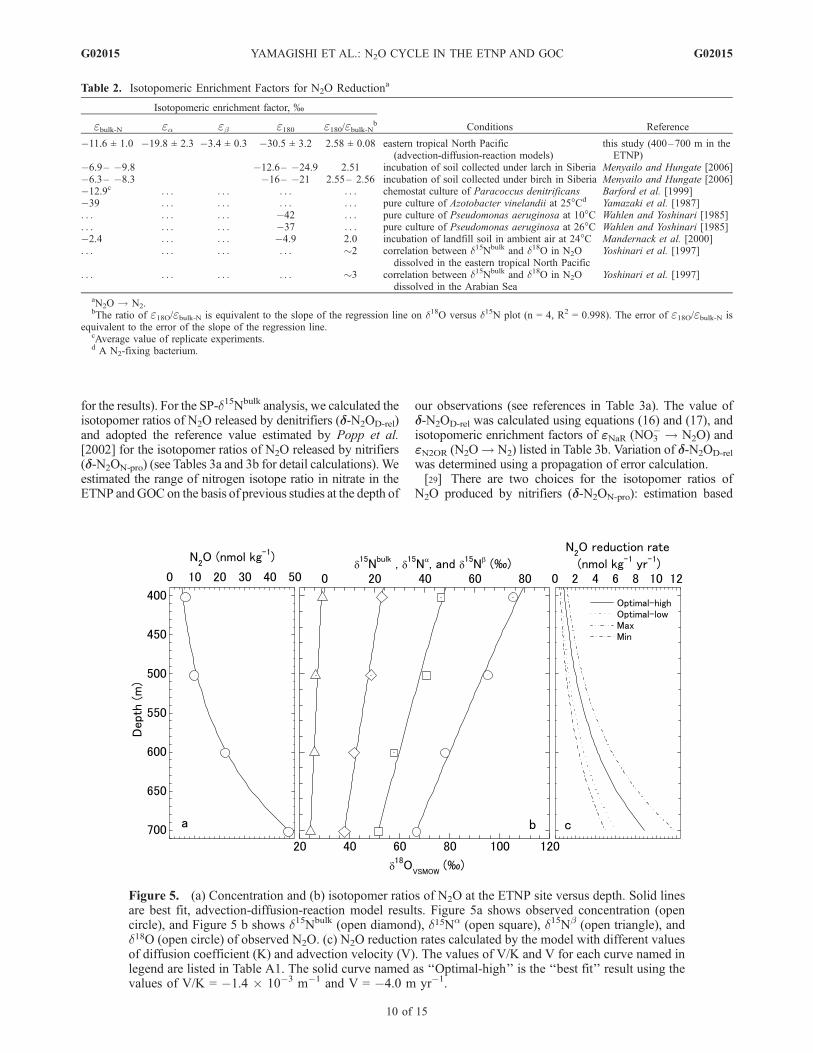
Figure 5. (a) Concentration and (b) isotopomer ratios of N2O at the ETNP site versus depth. Solid linesare best fit, advection-diffusion-reaction model results. Figure 5a shows observed concentration (opencircle), and Figure 5 b shows d15Nbulk (open diamond), d15Na (open square), d15Nb (open triangle), andd18O (open circle) of observed N2O. (c) N2O reduction rates calculated by the model with different valuesof diffusion coefficient (K) and advection velocity (V). The values of V/K and V for each curve named inlegend are listed in Table A1. The solid curve named as ‘‘Optimal-high’’ is the ‘‘best fit’’ result using thevalues of V/K = �1.4 � 10�3 m�1 and V = �4.0 m yr�1.
G02015 YAMAGISHI ET AL.: N2O CYCLE IN THE ETNP AND GOC
10 of 15
G02015
on isotopomer analysis of N2O produced presumably bynitrifier-denitrification in the shallow aphotic zone in thesubtropical North Pacific Gyre [Popp et al., 2002] orcalculation using isotopomeric enrichment factors estimatedfrom pure cultures [Sutka et al., 2006, 2003,2004a]. Sutka etal. [2006, 2003, 2004a] found that for pure culture experi-ments SP of N2O is close to 0% when N2O is produced vianitrite by nitrite reductase and that SP of N2O is around30% when N2O is produced by NH2OH oxidation. Atstation ALOHA (22�450N, 158�000W) in the aphotic zonein the subtropical North Pacific Gyre, SP of N2O producedin situ was estimated at �4% [Popp et al., 2002]. The lowSP observed in this subsurface layer at station ALOHA andthe ETNP site is consistent with the production of N2O bynitrifier denitrification as observed in pure culture experi-
ments by Sutka et al. [2006, 2003, 2004a]. Comparison ofd18O-N2O with d18O-O2 also indicates the contribution ofnitrifier denitrification for N2O production at the depthof 350–500 m at station ALOHA [Ostrom et al., 2000; Poppet al., 2002]. However, we do not adopt the SP of 0% fornitrifier denitrification as the end-member of d-N2ON-pro,because we could not exclude the possibility of contributionof NH2OH oxidation to N2O production in the aerobicoceans. It is also difficult to use isotopic enrichmentfactors for the N2O production by nitrifiers, because thereare no data for nitrogen isotope ratios of substratesavailable and, furthermore, calculation of the nitrogenisotope ratio of N2O produced by marine nitrifiers usingisotopic enrichment factors is not straightforward. Casciottiet al. [2002] found that the extent of isotope fractionation
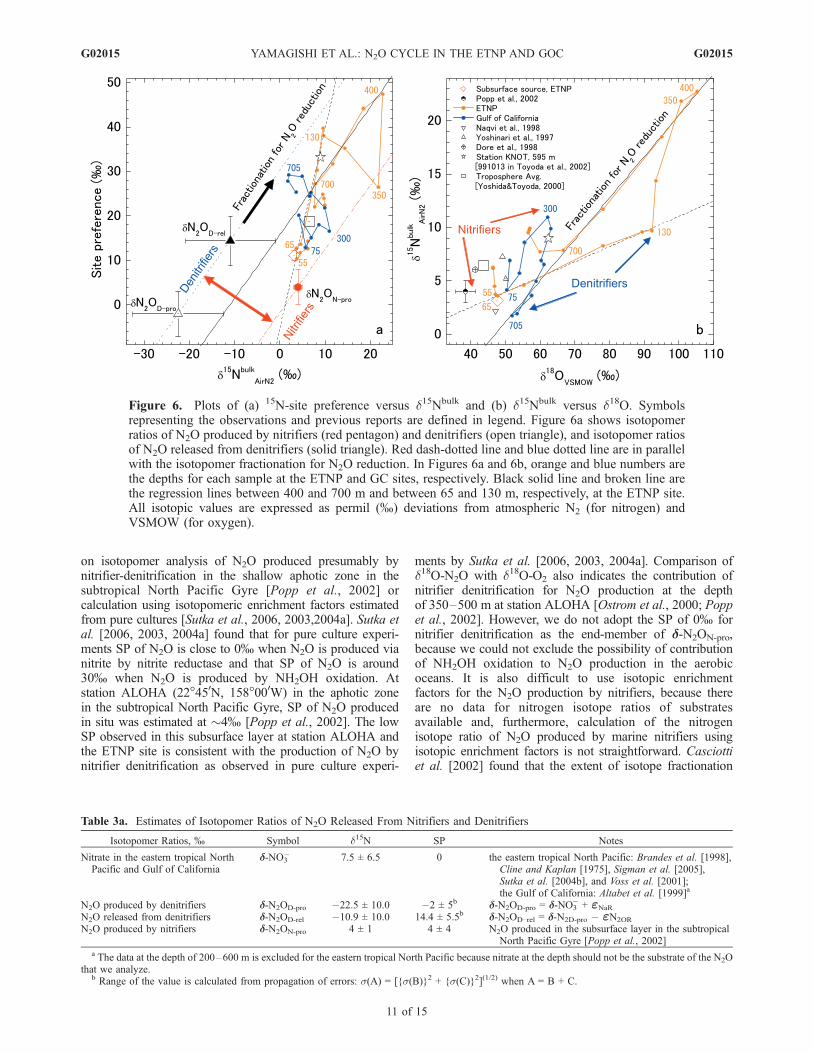
Figure 6. Plots of (a) 15N-site preference versus d15Nbulk and (b) d15Nbulk versus d18O. Symbolsrepresenting the observations and previous reports are defined in legend. Figure 6a shows isotopomerratios of N2O produced by nitrifiers (red pentagon) and denitrifiers (open triangle), and isotopomer ratiosof N2O released from denitrifiers (solid triangle). Red dash-dotted line and blue dotted line are in parallelwith the isotopomer fractionation for N2O reduction. In Figures 6a and 6b, orange and blue numbers arethe depths for each sample at the ETNP and GC sites, respectively. Black solid line and broken line arethe regression lines between 400 and 700 m and between 65 and 130 m, respectively, at the ETNP site.All isotopic values are expressed as permil (%) deviations from atmospheric N2 (for nitrogen) andVSMOW (for oxygen).
Table 3a. Estimates of Isotopomer Ratios of N2O Released From Nitrifiers and Denitrifiers
Isotopomer Ratios, % Symbol d15N SP Notes
Nitrate in the eastern tropical NorthPacific and Gulf of California
d-NO3� 7.5 ± 6.5 0 the eastern tropical North Pacific: Brandes et al. [1998],
Cline and Kaplan [1975], Sigman et al. [2005],Sutka et al. [2004b], and Voss et al. [2001];the Gulf of California: Altabet et al. [1999]a
N2O produced by denitrifiers d-N2OD-pro �22.5 ± 10.0 �2 ± 5b d-N2OD-pro = d-NO3� + eNaR
N2O released from denitrifiers d-N2OD-rel �10.9 ± 10.0 14.4 ± 5.5b d-N2OD�rel = d-N2D-pro � eN2OR
N2O produced by nitrifiers d-N2ON-pro 4 ± 1 4 ± 4 N2O produced in the subsurface layer in the subtropicalNorth Pacific Gyre [Popp et al., 2002]
a The data at the depth of 200–600 m is excluded for the eastern tropical North Pacific because nitrate at the depth should not be the substrate of the N2Othat we analyze.
b Range of the value is calculated from propagation of errors: s(A) = [{s(B)}2 + {s(C)}2](1/2) when A = B + C.
G02015 YAMAGISHI ET AL.: N2O CYCLE IN THE ETNP AND GOC
11 of 15
G02015
for ammonia oxidation by marine nitrifiers is about 10–25%smaller than that of a terrestrial nitrifier such as Nitrosospiratenuis and a well-studied nitrifier, Nitrosomonas europaea.Therefore, considering the difficulties in estimating the valuefor d-N2ON-pro using isotopomer enrichment factors and theconsistency in isotopic values observed in ocean environ-ments, we adopt the isotopomer ratios of N2O produced insitu in the aerobic subsurface layer in the subtropical NorthPacific Gyre [Popp et al., 2002] as the value of d-N2ON-pro
(Table 3a).[30] To calculate the isotopomer ratios of N2O released
from denitrifiers (d-N2OD-rel), we assumed that the ratio Xb
in the two-step model is one. Then we applied our estimatedenrichment factor eN2OR(= eac; N2Ositu ! N2) to ebc(N2Ovivo ! N2) of the steady state denitrifier model tocalculate d-N2OD-rel (Table 3b). However, even if theratio Xb is far from one, the slope of SP to d15Nbulk isconstant. Thus the ratio Xb should not affect the analysisof the origin of N2O.[31] The isotopomer ratios of N2O at 700m at the GOC site
and at 120 m at the ETNP site plot close to the isotopomerfractionation line for N2O reduction from d-N2O D-rel
(blue dotted line at Figure 6a), which suggests that N2O isreleased from and consumed by denitrifiers in these watermasses. On the contrary, the isotopomer ratios of N2Odissolved at the N2O concentration maximum (�65 m) atthe ETNP site and the suboxic zone above the OMZ (�300m)at the GOC site plot close to the isotopomer fractionation lineof N2O reduction from d-N2O N-pro (red dash-dotted line atFigure 6a), which suggests that N2O is mainly released fromnitrifiers in these water masses.[32] We estimated the contribution ratio of N2O produc-
tion by nitrifiers to the total N2O emission (N-ratio) and itserror using equation 19 and propagation of error, respec-tively. Quantitative analysis indicates that 71 ± 17% of thedissolved N2O is released from nitrifiers at the subsurfaceN2O maximum (at 65 m) at the ETNP site. In the suboxiczone under the core of the OMZ (at 800 m) at the ETNPsite, the estimated N-ratio was 60 ± 21%. Nitrifiers primar-ily contribute to N2O production at 55 m at the ETNP site (N-ratio = 79 ± 15%), and at 75 m at the GOC site (N-ratio =80 ± 15%). The model results are consistent with theminimum SP values found at these depths, which is asignal of nitrifier-denitrification (Figures 2b and 2e), andwith the nitrite concentration peak, a signal of ammoniaoxidation by ammonia oxidizers (Figure 2c). N-ratios werealso estimated at 92 ± 13% and 11 ± 43% at 300 m and700 m at the GOC site, respectively.
[33] In order to resolve the contribution of each processmore precisely, evaluation of the tropospheric N2O isnecessary in subsurface layers and aerobic waters. Incontrast, in suboxic zones where N2O is produced andconsumed by denitrification, the modern and preindustrialtropospheric N2O should be consumed and thus should notinfluence the estimates of the N-ratio. Although there arelarge variations in d15N-nitrate and isotopic/isotopomericenrichment factors (see references listed in notes inTables 3a and 3b), we applied unique values for the end-members, d-N2ON-pro and d-N2OD-rel, for estimating N-ratiosusing SP-d15Nbulk analysis. The large errors in N-ratios canbe attributed to the wide range of the end-member valuesof d-N2OD-rel. To reduce errors in d-N2OD-rel, it is essentialto constrain the error in d15N-nitrate and the nitrogenisotopic enrichment factor for nitrate reduction. Further-more, even though we estimated errors in N-ratios, thereremains additional uncertainty relating to the end-memberof d-N2ON-pro. It is essential to establish a methodologyfor estimating the end-member of d-N2ON-pro in theoceans. Given the influence of diffusion and advectionon the distribution of N2O and nitrate, it is insufficient touse d15N-nitrate at each point as the substrate of N2O. Infuture studies, it is desirable to estimate the N-ratio usingan advection-diffusion-reaction model with distribution ofisotope ratios of substrates and isotopic/isotopomeric en-richment factors, which are functions of the concentrationsof substrates and environmental parameters related tomicrobial activities such as temperature.[34] We also plotted the isotopomer ratios of N2O at the
concentration maximum (600 m) at Station KNOT in thewestern North Pacific (data for 991013 from Toyoda et al.[2002]) as the open black star on Figure 6a. Consideringthat d15N-NO3
� in the northern part of the North Pacific is�5% [Casciotti et al., 2002] and that the value of d15N-NO3
�
is within the range of d15N-NO3� for the SP-d15Nbulk analysis
(7.5 ± 6.5%), the contribution of each process to N2Oproduction at Station KNOT can be resolved using a plot ofSP versus d15Nbulk (Figure 6a). The SP-d15Nbulk plot indi-cates that denitrification dominates N2O production in theOMZ at Station KNOT in the North Pacific (N-ratio = 31 ±34%). Thus isotopomer analysis of N2O with steady statemodel for denitrifiers supports the denitrification hypothesisof Yamagishi et al. [2005] and Yoshida et al. [1989].Isotopomer analysis of N2O has a potential to resolve thedispute between the nitrification and denitrification hypoth-eses for the N2O cycle in the oceans.
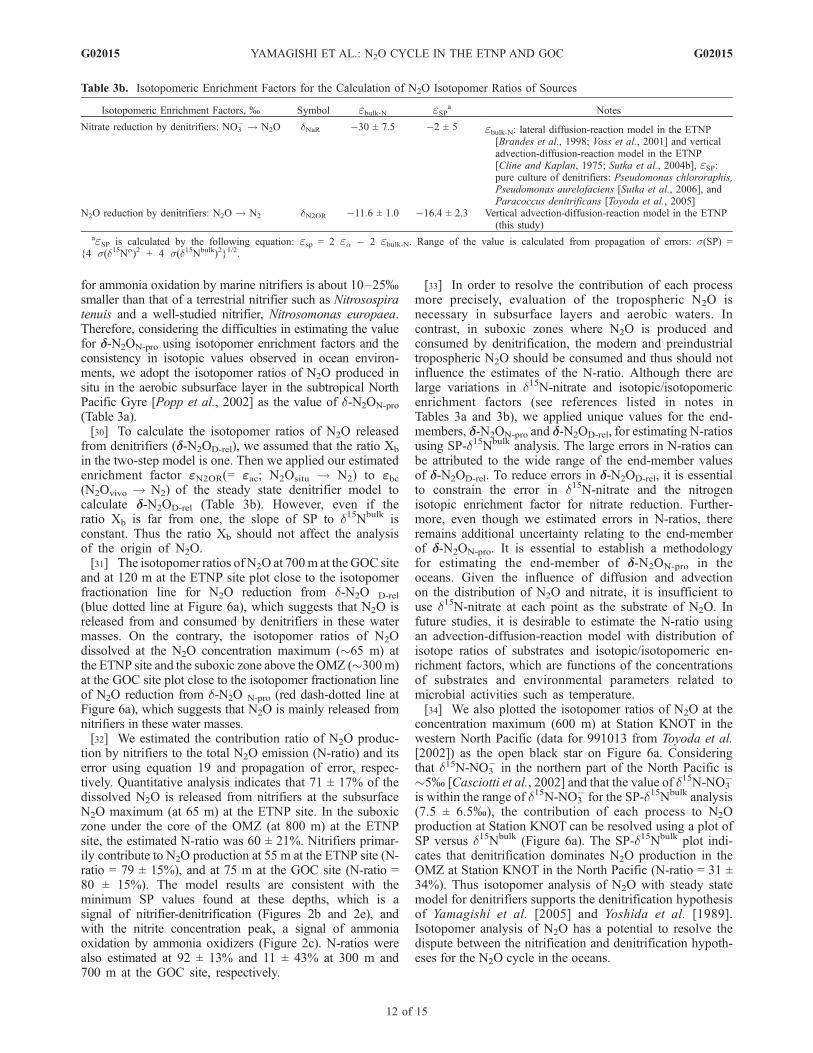
Table 3b. Isotopomeric Enrichment Factors for the Calculation of N2O Isotopomer Ratios of Sources
Isotopomeric Enrichment Factors, % Symbol ebulk-N eSPa Notes
Nitrate reduction by denitrifiers: NO3� ! N2O dNaR �30 ± 7.5 �2 ± 5 ebulk-N: lateral diffusion-reaction model in the ETNP
[Brandes et al., 1998; Voss et al., 2001] and verticaladvection-diffusion-reaction model in the ETNP[Cline and Kaplan, 1975; Sutka et al., 2004b], eSP:pure culture of denitrifiers: Pseudomonas chlororaphis,Pseudomonas aurelofaciens [Sutka et al., 2006], andParacoccus denitrificans [Toyoda et al., 2005]
N2O reduction by denitrifiers: N2O ! N2 dN2OR �11.6 ± 1.0 �16.4 ± 2.3 Vertical advection-diffusion-reaction model in the ETNP(this study)
aeSP is calculated by the following equation: esp = 2 ea � 2 ebulk-N. Range of the value is calculated from propagation of errors: s(SP) ={4 s(d15Na)2 + 4 s(d15Nbulk)2}1/2.
G02015 YAMAGISHI ET AL.: N2O CYCLE IN THE ETNP AND GOC
12 of 15
G02015
[35] The production and consumption processes of N2Oindicated by the SP-d15Nbulk analysis are consistent with theprocesses indicated by N* values and the concentrations ofnitrite and oxygen. However, the conventional analysis ofd15Nbulk and d18O of N2O at the GOC site leads to theopposite conclusion: the smaller d15Nbulk and d18O at 700 mthan those at 300 m indicates that contribution of nitrifica-tion at 700 m is larger than that at 300 m (Figure 6b). Thissuggestion is not consistent with N* and O2 concentration(Figures 2d and 2f). Therefore the analysis of bulk nitrogenand oxygen isotope ratios may not be an effective tool forresolving production processes of N2O under suboxic con-ditions in the oceans. In contrast, the plot of the SP versusd15Nbulk is very useful for resolving production and con-sumption processes.
5. Conclusions and Implications
[36] In the ETNP, N2O is mainly produced by nitrifiers atthe concentration maximum (60–80 m deep) located at thesubsurface oxycline. Isotopomer ratios of N2O produced atthe maximum are 3.2 ± 0.1, 8.7 ± 0.6, �2.3 ± 0.6, 47.6 ±0.3, and 11.0 ± 1.2% (1s, n = 5) for d15Nbulk, d15Na, d15Nb,d18O, and 15N-site preference, respectively. At the bottom ofthe subsurface N2O concentration peak, N2O is producedand consumed by denitrifiers. At the suboxic zone under theOMZ at 800 m, N2O is strongly consumed by denitrifiersafter release by nitrifiers and denitrifiers. In the Gulf ofCalifornia, N2O is dominantly produced by nitrifiers fromthe subsurface to 300 m. At the N2O concentration maximumat the lower OMZ (700 m), N2O is produced and consumedby denitrifiers.[37] Isotopomeric fractionation for N2O reduction was
analyzed using a one-dimensional, vertical advection-diffusion-reaction model over the depth range 400–700 m in the ETNP OMZ, where N2O diffuses andadvects from the suboxic zone under the OMZ at 800 mand where N2O is only consumed by denitrifiers. Iso-topomeric enrichment factors for N2O reduction wereestimated to be �11.6 ± 1.0, �19.8±2.3, �3.4 ± 0.3,and �30.5 ± 3.2% for d15Nbulk, d15Na, d15Nb, andd18O, respectively. Isotopomer analysis of N2O withisotopomeric enrichment factors is a powerful tool forestimating the ratios of N2O released from nitrifiers anddenitrifiers in the oceans. Isotopomer analysis of N2Osuggests that conventional bulk nitrogen and oxygenisotope ratios cannot effectively differentiate the N2Oreleased from denitrifiers and marine nitrifiers in thelow-oxygen regions although the analysis on the plotof d15N versus d18O gives information on the extent ofits consumption. Thus isotopomer analysis is a powerfultool for resolving the N2O cycle in the oceans.[38] Isotopomer ratios of N2O will be a sensitive signal of
N2O reduction, namely N2 production, by denitrification,which is the main process of N loss from the oceans. Ourplot of 15N-site preference versus d15Nbulk indicates thatwater masses under suboxic conditions in the ETNP, Gulf ofCalifornia, and even in the OMZ in the western NorthPacific show evidence of N loss by denitrification. Thesuggestion of N loss from the northern Pacific Ocean isconsistent with the suggestion by Li and Peng [2002], who
estimated remineralization ratios in the northern Pacificfrom nutrient and oxygen concentrations using a three-partmixing model. They argued that the low N/P ratio for thenorthern Pacific basins indicates that organic nitrogen isconverted partly into gaseous N2O and N2 through nitrifi-cation or denitrification processes in low-oxygen regions, orin the reducing microenvironments of organic matter withinan oxygenated water column. N* has been used as a signalof N loss in the oceans. However, N* is affected by severalfactors such as nitrogen fixation, remineralization ratio ofnutrients, and the amount of DON that has not beenremineralized. Isotopomer analysis of N2O will be a usefultool for resolving the distributions of water masses that havelost nitrogen by denitrification.
Appendix A: Model Parameters and SensitivityTest
A1. Ratio of Advection Velocity to Eddy DiffusionCoefficient (V/K)
[39] We estimated the value of V/K using the onedimensional, advection-diffusion model of Tsunogai [1972]and Munk [1966] with the potential temperature from ourcruise (170–810 m at the ETNP site). We selected this depthrange because of a highly linear mixing line exists on a T-Sdiagram. The value of V/K was �1.4 ± 0.4 � 10�3 m�1.
A2. Advection Velocity (V)
[40] We adopt the advection velocity estimated byChung and Craig [1973] using 226Ra. The velocities in thez direction are�2.7m yr�1 forminimum and�4.0m yr�1 formaximum at Station SCAN X-56 (08�070N, 113�550W;Bottom = 4035 m), which is close to our ETNP site(16�100N, 106�590W).
A3. N2O Reduction Rate (Fz)
[41] The reaction rate constant of m was estimated byfitting the concentration model (equations (1) and (2)) to themeasured N2O concentration between 400 and 700 m (O2 <1 mmol kg�1) at the ETNP site, as shown in Figure 5a. Thevalue of m was estimated to make an asymptotic curve closeto 0 nmol kg�1 at 0 m. Several results of the N2O reductionrate are shown in Figure 5c.
A4. Sensitivity
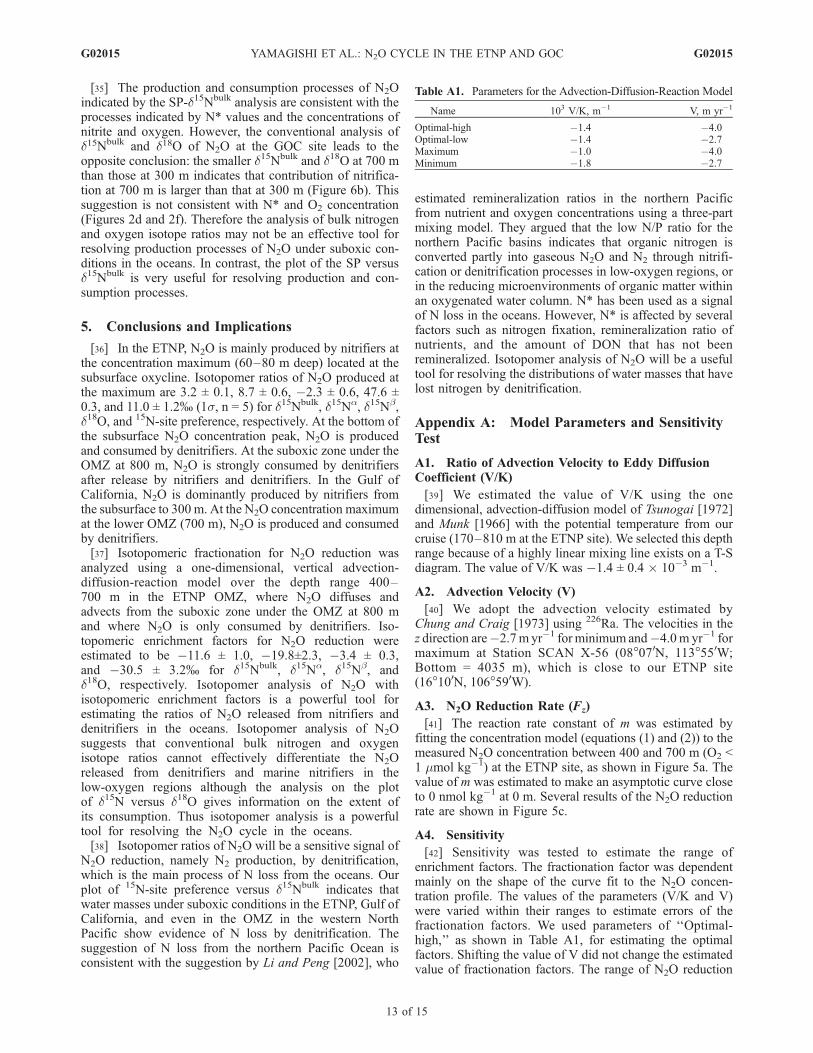
[42] Sensitivity was tested to estimate the range ofenrichment factors. The fractionation factor was dependentmainly on the shape of the curve fit to the N2O concen-tration profile. The values of the parameters (V/K and V)were varied within their ranges to estimate errors of thefractionation factors. We used parameters of ‘‘Optimal-high,’’ as shown in Table A1, for estimating the optimalfactors. Shifting the value of V did not change the estimatedvalue of fractionation factors. The range of N2O reduction
Table A1. Parameters for the Advection-Diffusion-Reaction Model
Name 103 V/K, m�1 V, m yr�1
Optimal-high �1.4 �4.0Optimal-low �1.4 �2.7Maximum �1.0 �4.0Minimum �1.8 �2.7
G02015 YAMAGISHI ET AL.: N2O CYCLE IN THE ETNP AND GOC
13 of 15
G02015
rates was also estimated. Estimated profiles were shown inFigure 5c, and sets of parameters are shown in Table A1.
[43] Acknowledgments. We thank Nils Napp for dissolved O2 mea-surements, and all scientists working on the EPREX for help with samplecollection in the ETNP. We are indebted to A. W. Graham for dissolved O2
measurement, sample collection, and cruise information including CTD datafrom the Gulf of California. We wish to thank the crew of the R/V Revelle forassistance on our cruise in the ETNP, and to thank the crew of the R/V NewHorizon for assistance on the cruise in the Gulf of California. We are indebtedto H. Nara for advice on the advection-diffusion-reaction model and for hiscomments on this paper, and to T. Rust and F. J. Sansone for assistance in thisresearch.We thankR. L. Sutka andN. E.Ostrom for interlaboratory calibrationof N2O isotopomer ratios. We also thank R. L. Sutka, J. van-Haren,L. Farıacute;as, N.Handa, J. P.Montoya, andY. H. Li for valuable discussions.This researchwas supported byU.S. National Science Foundation grants OCE9817064 (BNP, Francis J. Sansone and Edward A. Laws) and OCE 0240787(BNP). Reviews by N. E. Ostrom and two anonymous reviewers were veryhelpful in improving this paper. This is SOEST contribution 7021.
ReferencesAltabet, M. A., C. Pilskaln, R. Thunell, C. Pride, D. Sigman, F. Chavez, andR. Francois (1999), The nitrogen isotope biogeochemistry of sinkingparticles from the margin of the eastern North Pacific, Deep Sea Res.,Part I, 46, 655–679.
Barford, C. C., J. P. Montoya, M. A. Altabet, and R. Mitchell (1999),Steady-state nitrogen isotope effects of N2 and N2O production in Para-coccus denitrificans, Appl. Environ. Microbiol., 65, 989–994.
Bottcher, J., O. Strebel, S. Voerkelius, and H. L. Schmidt (1990), Usingisotope fractionation of nitrate nitrogen and nitrate oxygen for evaluationof microbial denitrification in a sandy aquifer, J. Hydrol., 114(3–4),413–424.
Boyer, T. P., C. Stephens, J. I. Antonov, M. E. Conkright, R. A. Locarnini,T. D. O’Brien, and H. E. Garcia (2002), World Ocean Atlas 2001, vol. 2,Salinity [CD-ROM], edited by S. Levitus, NOAA Atlas NESDIS 50, Natl.Oceanic and Atmos. Admin., Silver Spring, Md.
Brandes, J. A., A. H. Devol, T. Yoshinari, D. A. Jayakumar, and S. W. A.Naqvi (1998), Isotopic composition of nitrate in the central Arabian Seaand eastern tropical North Pacific: A tracer for mixing and nitrogencycles, Limnol. Oceanogr., 43(7), 1680–1689.
Brenninkmeijer, C. A. M., and T. Rockmann (1999), Mass spectrometry ofthe intramolecular nitrogen isotope distribution of environmental nitrousoxide using fragment-ion analysis, Rapid Commun. Mass Spectrom.,13(20), 2028–2033.
Bryan, B. A., G. Shearer, J. L. Skeeters, and D. H. Kohl (1983), Variableexpression of the nitrogen isotope effect associated with denitrification ofnitrite, J. Biol. Chem., 258(14), 8613–8617.
Casciotti, K. L., D. M. Sigman, M. G. Hastings, J. K. Bohlke, andA. Hilkert (2002), Measurement of the oxygen isotopic compositionof nitrate in seawater and freshwater using the denitrifier method,Anal. Chem., 74(19), 4905–4912.
Casciotti, K. L., D. M. Sigman, and B. B. Ward (2003), Linking diver-sity and stable isotope fractionation in ammonia-oxidizing bacteria,Geomicrobiol. J., 20(4), 335–353.
Castro, C. G., F. P. Chavez, and C. A. Collins (2001), Role of the CaliforniaUndercurrent in the export of denitrified waters from the eastern tropicalNorth Pacific, Global Biogeochem. Cycles, 15(4), 819–830.
Chung, Y.-C., and H. Craig (1973), Radium-226 in the eastern equatorialPacific, Earth Planet. Sci. Lett., 17, 306–318.
Cline, J. D., and I. R. Kaplan (1975), Isotopic fractionation of dissolvednitrate during denitrification in the eastern tropical North Pacific Ocean,Mar. Chem., 3, 271–299.
Codispoti, L. A., J. W. Elkins, T. Yoshinari, G. Fredrich, C. Sakamoto, andT. Packard (1992), On the nitrous oxide flux from productive regions thatcontain low oxygen waters, in Oceanography of the Indian Ocean, editedby B. Desai, pp. 271–284, Oxford Univ. Press, New York.
Cohen, Y., and L. I. Gordon (1978), Nitrous oxide production in the oxygenminimum of the eastern tropical North Pacific: Evidence for its consump-tion during denitrification and possible mechanisms for its production,Deep Sea Res., 25, 509–524.
Conkright, M. E., H. E. Garcia, T. D. O’Brien, R. A. Locarnini, T. P. Boyer,C. Stephens, and J. I. Antonov (2002), World Ocean Atlas 2001, vol. 4,Nutrients [CD-ROM], edited by S. Levitus, NOAA Atlas NESDIS 52,Natl. Oceanic and Atmos. Admin., Silver Spring, Md.
Crutzen, P. J. (1970), The influence of nitrogen oxides on the atmosphericozone content, Q. J. R. Meteorol. Soc., 96, 320–325.
Deutsch, C., A. Ganachaud, N. Gruber, R. M. Key, and J. L. Sarmiento(2001), Denitrification and N2 fixation in the Pacific Ocean, GlobalBiogeochem. Cycles, 15(2), 483–506.
Dore, J. E., B. N. Popp, D. M. Karl, and F. J. Sansone (1998), A largesource of atmospheric nitrous oxide from subtropical North Pacific sur-face waters, Nature, 396, 63–66.
Durka, W., E. D. Schulze, G. Gebauer, and S. Voerkelius (1994), Effects offorest decline on uptake and leaching of deposited nitrate determinedfrom N15 and O18 measurements, Nature, 372, 765–767.
Farquhar, G. D., and J. A. Berry (1982), On the relationship between carbonisotope discrimination and the inter-cellular carbon-dioxide concentrationin leaves, Aust. J. Plant Physiol., 9, 121–137.
Granger, J., D. M. Sigman, J. A. Needoba, and P. J. Harrison (2004),Coupled nitrogen and oxygen isotope fractionation of nitrate duringassimilation by cultures of marine phytoplankton, Limnol. Oceanogr.,49(5), 1763–1773.
Grasshoff, K., M. Ehrhardt, and K. Kremling (Eds.) (1983), Methods ofSeawater Analysis, 2nd rev. and extended ed., pp. 61–72, 143–150,Verlag Chemie, New York.
Gruber, N., and J. L. Sarmiento (1997), Global patterns of marine nitrogenfixation and denitrification, Global Biogeochem. Cycles, 11(2), 235–266.
Handley, L. L., and J. A. Raven (1992), The use of natural abundance ofnitrogen isotopes in plant physiology, Plant Cell Environ., 15, 965–985.
Intergovernmental Panel on Climate Change (2001), Atmospheric chemis-try and greenhouse gases, in Climate Change 2001: The Scientific Basis,edited by J. T. Houghton et al., pp. 241–287, Cambridge Univ. Press,New York.
Jones, R. D. (1991), An improved fluorescence method for the determi-nation of nanomolar concentrations of ammonium in natural waters,Limnol. Oceanogr., 36(4), 814–819.
Jørgensen, K. S., H. B. Jensen, and J. Sørensen (1984), Nitrous oxidereduction from nitrification and denitrification in marine sediment atlow oxygen concentrations, Can. J. Microbiol., 30, 1073–1078.
Kaiser, J., T. Rockmann, and C. A. M. Brenninkmeijer (2003), Completeand accurate mass spectrometric isotope analysis of tropospheric nitrousoxide, J. Geophys. Res., 108(D15), 4476, doi:10.1029/2003JD003613.
Laws, E. A., B. N. Popp, R. R. Bidigare, M. C. Kennicutt, and S. A. Macko(1995), Dependence of phytoplankton carbon isotopic composition ongrowth-rate and [CO2]aq: Theoretical considerations and experimentalresults, Geochim. Cosmochim. Acta, 59, 1131–1138.
Ledwell, J. R., A. J. Watson, and C. S. Law (1993), Evidence for slowmixing across the pycnocline from an open-ocean tracer-release experi-ment, Nature, 364, 701–703.
Li, Y. H., and T. H. Peng (2002), Latitudinal change of remineralizationratios in the oceans and its implication for nutrient cycles, GlobalBiogeochem. Cycles, 16(4), 1130, doi:10.1029/2001GB001828.
Luyten, J. R., J. Pedlosky, and H. Stommel (1983), The ventilated thermo-cline, J. Phys. Oceanogr., 13, 292–309.
Mandernack, K. W., T. Rahn, C. Kinney, and M. Wahlen (2000), Thebiogeochemical controls of the d15N and d18O of N2O produced in land-fill cover soils, J. Geophys. Res., 105(D14), 17,709–17,720.
Mariotti, A., J. C. Germon, P. Hubert, P. Kaiser, R. Letolle, A. Tardieux,and P. Tardieux (1981), Experimental determination of nitrogen kineticisotope fractionation: Some principles; illustration for the denitrificationand nitrification processes, Plant Soil, 62, 413–430.
Mariotti, A., J. C. Germon, A. Leclerc, G. Catroux, and R. Letolle (1982),Experimental determination of kinetic isotope fractionation of nitrogenisotopes during denitrification, in Stable Isotopes, edited by H.-L.Schmidt et al., pp. 459–464, Elsevier, New York.
Menyailo, O. V., and B. A. Hungate (2006), Stable isotope discriminationduring soil denitrification: Production and consumption of nitrous oxide,Global Biogeochem. Cycles, 20, GB3025, doi:10.1029/2005GB002527.
Munk, W. H. (1966), Abyssal recipes, Deep Sea Res, 13, 707–730.Naqvi, S. W. A., T. Yoshinari, D. A. Jayakumar, M. A. Altabet, P. V.Narvekar, A. H. Devol, J. A. Brandes, and L. A. Codispoti (1998),Budgetary and biogeochemical implications of N2O isotope signaturesin the Arabian Sea, Nature, 394, 462–464.
Nevison, C. D., R. F. Weiss, and I. D. J. Erickson (1995), Global oceanicemissions of nitrous oxide, J. Geophys. Res., 100(C8), 15,809–15,820.
Nevison, C., J. H. Butler, and J. W. Elkins (2003), Global distributionof N2O and the DN2O-AOU yield in the subsurface ocean, GlobalBiogeochem. Cycles, 17(4), 1119, doi:10.1029/2003GB002068.
O’Leary, M. H. (1984), Measurement of the isotope fractionation associatedwith diffusion of carbon-dioxide in aqueous-solution, J. Phys. Chem., 88,823–825.
Ostrom, N. E., M. E. Russ, B. Popp, T. M. Rust, and D. M. Karl (2000),Mechanisms of nitrous oxide production in the subtropical North Pacificbased on determinations of the isotopic abundances of nitrous oxide anddi-oxygen, Chemosphere Global Change Sci., 2(3–4), 281–290.
Ostrom, N. E., L. O. Hedin, J. C. von Fischer, and G. P. Robertson (2002),Nitrogen transformations and NO3
� removal at a soil-stream interface:A stable isotope approach, Ecol. Appl., 12(4), 1027–1043.
G02015 YAMAGISHI ET AL.: N2O CYCLE IN THE ETNP AND GOC
14 of 15
G02015
Ostrom, N. E., A. Pitt, R. Sutka, P. H. Ostrom, A. S. Grandy, K. M.Huizinga, and G. P. Robertson (2007), Isotopologue effects during N2Oreduction in soils and in pure cultures of denitrifiers, J. Geophys. Res.,doi:10.1029/2006JG000287, in press.
Pataki, D. E., J. R. Ehleringer, L. B. Flanagan, D. Yakir, D. R. Bowling,C. J. Still, N. Buchmann, J. O. Kaplan, and J. A. Berry (2003), Theapplication and interpretation of Keeling plots in terrestrial carbon cycleresearch, Global Biogeochem. Cycles, 17(1), 1022, doi:10.1029/2001GB001850.
Pierotti, D., and R. A. Rasmussen (1980), Nitrous oxide measurements inthe eastern tropical Pacific Ocean, Tellus, 32(1), 56–72.
Popp, B. N., et al. (2002), Nitrogen and oxygen isotopomeric constraintson the origins and sea-to-air flux of N2O in the oligotrophic subtro-pical North Pacific gyre, Global Biogeochem. Cycles, 16(4), 1064,doi:10.1029/2001GB001806.
Poth, M., and D. D. Focht (1985), 15N kinetic analysis of N2O productionby Nitrosomonas europaea: An examination of nitrifier denitrification,Appl. Environ. Microbiol., 49, 1134–1141.
Prosperie, L. F., L. A. Codispoti, S. W. A. Naqvi, J. Aftab, D. Mastern,R. Patrick, and R. Williams (1996), Oxygen deficient (suboxic) con-ditions in the Arabian Sea, Eos Trans. AGU, 77(3), Ocean Sci. Meet.Suppl., OS11A-15.
Ramanathan, V., R. J. Cicerone, H. B. Singh, and J. T. Kiehl (1985), Tracegas trends and their potential role in climate change, J. Geophys. Res.,90(D3), 5547–5566.
Rees, C. E. (1973), A steady-state model for sulphur isotope fractionation inbacterial reduction processes, Geochim. Cosmochim. Acta, 37, 1141–1162.
Ritchie, G. A. F., and D. J. D. Nicholas (1972), Identification of nitrousoxide produced by oxidative and reductive processes in Nitrosomonaseuropaea, Biochem. J., 126, 1181–1191.
Sansone, F. J., B. N. Popp, A. Gasc, A. W. Graham, and T. M. Rust (2001),Highly elevated methane in the eastern tropical North Pacific and asso-ciated isotopically enriched fluxes to the atmosphere, Geophys. Res. Lett.,28(24), 4567–4570.
Shearer, G., and D. H. Kohl (1988), Nitrogen isotopic fractionation and18O exchange in relation to the mechanism of denitrification of nitrite byPseudomonas stutzeri, J. Biol. Chem., 263(26), 13,231–13,245.
Sigman, D. M., J. Granger, P. J. DiFiore, M. M. Lehmann, R. Ho, G. Cane,and A. van Geen (2005), Coupled nitrogen and oxygen isotope measure-ments of nitrate along the eastern North Pacific margin, Global Biogeo-chem. Cycles, 19, GB4022, doi:10.1029/2005GB002458.
Sigman, D. M., J. Granger, P. J. DiFiore, M. F. Lehmann, R. Ho, G. Cane,and A. van Geen (2006), Correction to ‘‘Coupled nitrogen and oxygenisotope measurements of nitrate along the eastern North Pacific margin’’,Global Biogeochem. Cycles, 20, GB1005, doi:10.1029/2005GB002682.
Stephens, C., J. I. Antonov, T. P. Boyer, M. E. Conkright, R. A. Locarnini,T. D. O’Brien, and H. E. Garcia (2002), World Ocean Atlas 2001, vol. 1,Temperature [CD-ROM], edited by S. Levitus, NOAA Atlas NESDIS 49,Natl. Oceanic and Atmos. Admin., Silver Spring, Md.
Suntharalingam, P., and J. L. Sarmiento (2000), Factors governing theoceanic nitrous oxide distribution: Simulations with an ocean generalcirculation model, Global Biogeochem. Cycles, 14(1), 429–454.
Suntharalingam, P., J. L. Sarmiento, and J. R. Toggweiler (2000), Globalsignificance of nitrous-oxide production and transport from oceanic low-oxygen zones: A modeling study, Global Biogeochem. Cycles, 14(4),1353–1370.
Suthhof, A., V. Ittekkot, and B. Gaye-Haake (2001), Millennial-scaleoscillation of denitrification intensity in the Arabian Sea during the lateQuaternary and its potential influence on atmospheric N2O and globalclimate, Global Biogeochem. Cycles, 15(3), 637–649.
Sutka, R. L., N. E. Ostrom, P. H. Ostrom, H. Gandhi, and J. A. Breznak(2003), Nitrogen isotopomer site preference of N2O produced by Nitro-somonas europaea and Methylococcus capsulatus Bath, Rapid Commun.Mass Spectrom., 17(7), 738–745.
Sutka, R. L., N. E. Ostrom, P. H. Ostrom, H. Gandhi, and J. A. Breznak(2004a), Erratum, Nitrogen isotopomer site preference of N2O producedby Nitrosomonas europaea and Methylococcus capsulatus Bath, RapidCommun. Mass Spectrom., 18(12), 1411–1412.
Sutka, R. L., N. E. Ostrom, P. H. Ostrom, and M. S. Phanikumar (2004b),Stable nitrogen isotope dynamics of dissolved nitrate in a transect fromthe North Pacific Subtropical Gyre to the Eastern Tropical North Pacific,Geochim. Cosmochim. Acta, 68, 517–527.
Sutka, R. L., N. E. Ostrom, P. H. Ostrom, J. A. Breznak, H. Gandhi, A. J.Pitt, and F. Li (2006), Distinguishing nitrous oxide production fromnitrification and denitrification on the basis of isotopomer abundances,Appl. Environ. Microbiol., 72, 638–644.
Toyoda, S., and N. Yoshida (1999), Determination of nitrogen isotopomersof nitrous oxide on a modified isotope ratio mass spectrometer, Anal.Chem., 71(20), 4711–4718.
Toyoda, S., N. Yoshida, T. Miwa, Y. Matsui, H. Yamagishi, U. Tsunogai,Y. Nojiri, and N. Tsurushima (2002), Production mechanism and globalbudget of N2O inferred from its isotopomers in the western North Pacific,Geophys. Res. Lett., 29(3), 1037, doi:10.1029/2001GL014311.
Toyoda, S., H. Mutobe, H. Yamagishi, N. Yoshida, and Y. Tanji (2005),Fractionation of N2O isotopomers during production by denitrifier, SoilBiol. Biochem., 37(8), 1535–1545, doi:10.1016/j.soilbio.2005.01.009.
Tsunogai, S. (1972), An estimate of the vertical diffusivity of the deepwater., J. Oceanogr. Soc. Jpn., 28, 145–152.
Voss, M., J. W. Dippner, and J. P. Montoya (2001), Nitrogen isotope pat-terns in the oxygen-deficient waters of the Eastern Tropical North PacificOcean, Deep Sea Res., Part I, 48, 1905–1921.
Wahlen, M., and T. Yoshinari (1985), Oxygen isotope ratios in N2O fromdifferent environments, Nature, 313, 780–782.
Weiss, R. F., and B. A. Price (1980), Nitrous oxide solubility in water andseawater, Mar. Chem., 8, 347–359.
Westley, M. B., B. N. Popp, T. M. Rust, and F. J. Sansone (2001), Sourcesand isotopic compositions of nitrous oxide in the subtropical NorthPacific and the eastern tropical North Pacific, in Proceedings of theFirst International Symposium on Isotopomers, edited by N. Yoshida,pp. 169–175, Jpn. Sci. and Technol. Agency, Yokohama, Japan.
Westley, M. B., H. Yamagishi, B. N. Popp, and N. Yoshida (2006),Nitrous oxide cycling in the Black Sea inferred from stable isotopeand isotopomer distributions, Deep Sea Res., Part, 53, 1802,doi:10.1016/j.dsr2.2006.03.012.
Wrage, N., G. L. Velthof, M. L. van Beusichem, and O. Oenema (2001),Role of nitrifier denitrification in the production of nitrous oxide, SoilBiol. Biochem., 33(12–13), 1723–1732.
Wyrtki, K. (1962), The oxygen minima in relation to ocean circulation,Deep Sea Res., 9, 11–23.
Yamagishi, H., N. Yoshida, S. Toyoda, B. N. Popp, M. B. Westley, andS. Watanabe (2005), Contributions of denitrification and mixing onthe distribution of nitrous oxide in the North Pacific, Geophys. Res.Lett., 32, L04603, doi:10.1029/2004GL021458.
Yamazaki, T., N. Yoshida, E. Wada, and S. Matsuo (1987), N2O reductionby Azotobacter vinelandii with emphasis on kinetic nitrogen isotopeeffects, Plant Cell Physiol., 28, 263–271.
Yoshida, N., and S. Toyoda (2000), Constraining the atmospheric N2Obudget from intramolecular site preference in N2O isotopomers, Nature,405, 330–334.
Yoshida, N., E. Wada, A. Hattori, T. Saino, and S. Matsuo (1984), 15N/14Nratio of dissolved N2O in the eastern tropical Pacific Ocean, Nature, 307,442–444.
Yoshida, N., H. Morimoto, M. Hirano, I. Koike, S. Matsuo, E. Wada,T. Saino, and A. Hattori (1989), Nitrification rates and 15N abundances ofN2O and NO3
� in the western North Pacific, Nature, 342, 895–897.Yoshinari, T., M. A. Altabet, S. W. A. Naqvi, L. Codispoti, A. Jayakumar,M. Kuhland, and A. Devol (1997), Nitrogen and oxygen isotopic com-position of N2O from suboxic waters of the eastern tropical North Pacificand the Arabian Sea – measurement by continuous-flow isotope-ratiomonitoring, Mar. Chem., 56, 253–264.
�����������������������K. Koba, Institute of Symbiotic Science and Technology, Tokyo
University of Agriculture and Technology, Saiwai-cho 3-5-8, Fuchu-city,Tokyo 1838-509, Japan. ([email protected])B. N. Popp, Department of Geology and Geophysics, School of Ocean
and Earth Science and Technology, University of Hawaii, 1680 East-WestRoad, Honolulu, HI 96822, USA. ([email protected])S. Toyoda, Department of Environmental Chemistry and Engineering,
Interdisciplinary Graduate School of Science and Engineering, TokyoInstitute of Technology, Mail-Box G1-17, 4259 Nagatsuta, Midori-ku,Yokohama 226-8502, Japan. ([email protected])S. Watanabe, Mutsu Institute for Oceanography, Japan Agency for
Marine-Earth Science and Technology, 690 Kitasekine, Sekine, Mutsu035-0022, Japan. ([email protected])M. B. Westley, Geophysical Fluid Dynamics Laboratory, National
Oceanic and Atmospheric Administration, 201 Forrestal Road, Princeton,NJ 08540-6649, USA. ([email protected])H. Yamagishi, Atmospheric Environmental Division, National Institute
for Environmental Studies, 16-2 Onogawa, Tsukuba, Ibaraki 305-8506,Japan. ([email protected])Y. Yamanaka, Faculty of Environmental Earth Science, Hokkaido
University, N10W5, Sapporo, Hokkaido 060-0810, Japan. ([email protected])N. Yoshida, Frontier Collaborative Research Center, Tokyo Institute of
Technology, G1-25, 4259 Nagatsuta, Midori-ku, Yokohama 226-8502,Japan. ([email protected])
G02015 YAMAGISHI ET AL.: N2O CYCLE IN THE ETNP AND GOC
15 of 15
G02015
1/12
Auxiliary Material for 2006JG000227 Role of nitrification and denitrification on the nitrous oxide cycle in the eastern tropical North Pacific and Gulf of California
Hiroaki Yamagishi1,2,3,4, Marian B. Westley5,6, Brian N. Popp7, Sakae Toyoda2,8, Naohiro Yoshida1,2,3,8,9, Shuichi Watanabe1,2,10, Keisuke Koba1,2,11, and Yasuhiro Yamanaka12,13
1 Department of Environmental Science and Technology, Interdisciplinary Graduate School of Science and Engineering, Tokyo Institute of Technology, Yokohama, Japan.
2 SORST Project, Japan Science and Technology Agency (JST), Kawaguchi, Japan.
3 Research Center for the Evolving Earth and Planets, Okayama, Tokyo Institute of Technology.
4 Now at Atmospheric Environmental Division, National Institute for Environmental Studies, Tsukuba, Japan.
5 Department of Oceanography, School of Ocean and Earth Science and Technology, University of Hawaii, Honolulu, Hawaii, USA.
6 Now at Geophysical Fluid Dynamics Laboratory, National Oceanic and Atmospheric Administration, Princeton, New Jersey, USA.
7 Department of Geology and Geophysics, School of Ocean and Earth Science and Technology, University of Hawaii, Honolulu, Hawaii, USA.
8 Department of Environmental Chemistry and Engineering, Interdisciplinary Graduate School of Science and Engineering, Tokyo Institute of Technology, Yokohama, Japan.
9 Frontier Collaborative Research Center, Tokyo Institute of Technology, Yokohama, Japan.
10 Mutsu Institute for Oceanography, Japan Agency for Marine-Earth Science and Technology, Mutsu, Japan.
11 Now at Institute of Symbiotic Science and Technology, Tokyo University of Agriculture and Technology, Tokyo, Japan.
12 Faculty of Environmental Earth Science, Hokkaido University, Sapporo, Hokkaido, Japan.
13 Frontier Research Center for Global Change, Japan Agency for Marine-Earth Science and Technology, Yokohama, Japan.
2/12
Auxiliary Materials: Endnotes to main text
Auxiliary Material I. Discussion concerning factors controlling N2O reduction
When we estimated the isotopomeric enrichment factors for N2O reduction from the
concentration and isotopomer ratios of N2O at the ETNP, we developed another
one-dimensional, vertical advection-diffusion-reaction model, in which the N2O
reduction rate is proportional to both the concentrations of particulate organic carbon
and N2O. We call this model the POC-N2O model, whereas we refer to the model in the
main text of this paper (the model in which N2O reduction rate is proportional only to
N2O concentration) as the N2O model. The enrichment factors for N2O reduction
estimated by both models agree well within the error of the estimations. Here we show
the concept and results of the POC-N2O model and compare the two models.
I-1. Concept of the POC-N2O model
Cline and Kaplan [1975] found that the best fit to the concentration profile of
measured nitrate was obtained with an exponentially decreasing denitrification rate.
Nitrate should be sufficient for denitrifiers as an electron accepter, whereas electron
donors supplied from organic matter are thought to regulate denitrification activity in
the OMZ [Cline and Kaplan, 1975]. In addition, denitrification activity is thought to be
regulated by some factors such as population of denitrifiers, activation of denitrifying
enzyme in each cell, and availability of electron donors like dissolved organic carbon
(DOC).
Ostrom et al. [2002] found that supply of dissolved organic carbon (DOC)
regulates denitrification activity in groundwater. DOC is the organic matter most
available to free bacteria. However, the DOC in seawater consists largely of stable
humic substances and more labile compounds such as carbohydrates, amino acids,
hydrocarbons, and carboxylic acids [Aluwihare and Repeta, 1997]. Therefore,
knowledge of the concentration of labile DOC is essential to evaluate the availability of
electron donors for bacteria. However, considering that there is little data available on
the composition and concentration of DOC in the ETNP, we feel that we cannot
parameterize the availability of electron donors based on DOC.
3/12
Bacterial activity in the deep-ocean can be regulated by the limitation of the supply
of labile DOC and temperature [Bendtsen et al., 2002]. The sinking particulate organic
carbon (POC) is thought to be the exclusive source of deep-sea labile DOC [Bendtsen et
al., 2002]. Therefore, potential activity of denitrification may be evaluated from the flux
of POC and temperature. Considering the small variation in temperature, we assume
that potential denitrifying activity is proportional to the flux of POC (we discuss the
limitation of the assumption in section 4 in this auxiliary material.). Considering that
oxygen concentration was under 1 µmol kg−1 and formed no gradient in its
concentration profile, we assumed that denitrifying enzymes are activate over the depth
interval 400-700 m at the ETNP site.
Concentration of nitrous oxide was between 3.8 and ~50 nmol kg-1 in the anoxic
zone (<1 µmol kg-1 O2) at the ETNP site (Figure 2a). The level of N2O concentration is
only one thousandth of the concentration of the total electron acceptors for denitrifiers.
Therefore, N2O concentration should limit the rate of N2O reduction. Concentrations of
oxygen and nitrate are not likely to affect the N2O reduction rate (see section 4.2 for
details). Here, we parameterized microbial activity using the concentration of suspended
POC in the ETNP [Loh and Bauer, 2000] because of the limitation of the data on the
vertical distribution of POC flux in the region. Concentration of POC decreases
exponentially with depth between 100 and 1000m. Thus, to parameterize N2O reduction
rate in the OMZ at the ETNP site, we assumed that the N2O reduction rate (Fz) is
proportional to the concentrations of both suspended POC and nitrous oxide, and then
expressed as follows:
( )NzkCFZ µ−= exp , (B1)
where k is a reaction rate constant, Cexp(-µz) describes the concentration of POC
declining with depth, and N is N2O concentration.
Substituting the concentrations of 15N- and 18O-isotopes, and 15Nα- and 15Nβ-isotopomers into eq.1 (in the main text) and by using the definitions of δι and αi
from eqs.3 and 4, eq.B2 is obtained for the POC-N2O model:
4/12
( ) ( ) ( )( ) ( ) ( ) 0exp1exp1000 =−−−−−′−″iiiiiii NzCkNzCkNVNK δαµαµδδ ,
(B2)
where the primes refer to successive differentiation with respect to depth. The
differential operators in eq.B2 were replaced by the Euler method of forward-difference
approximations [Cline and Kaplan, 1975]. The isotopomeric enrichment factors were
estimated by fitting the model to the observed isotopomer ratios (Figure S1).
I-2. Parameters for the POC-N2O model
An exponentially decreasing factor (µ) was calculated by POC concentration in the
ETNP reported by Loh and Bauer [2000]. The POC concentration at the depth of 1000
m is about one-tenth of that at 100 m. Therefore, the decreasing factor of µ was
estimated at 2.5 ± 0.1 × 10⁻³. Sensitivity was tested in the range. The value of kC in
eq.B1 was estimated by fitting the model (eqs.1 and B1) to the measured N2O
concentration between 400 and 700 m (O2 < 1 µmol kg-1) at the ETNP site, as shown in
Figure 5a. The value of kC was estimated to make an asymptotic curve close to 0 nmol
kg-1 at 0 m.
I-3. Results of the POC-N2O model
The best estimates of the enrichment factor from the two models are listed in Table
S1 and the parameters for the best estimates are listed in Table S2. Comparing the
results of the sensitivity test of the two models, the enrichment factors for N2O
reduction estimated by the two models agree well within the error of the estimation.
Thus, we included both of the results of the sensitivity test in the range of the
enrichment factors shown in Table 2 (in the main text).
I-4. Comparison of the POC-N2O model with the N2O model
We think that the N2O model is more reasonable than the POC-N2O model for
several reasons. First, considering that N2O concentration is lower than nitrate
concentration by about three orders of magnitude, the N2O concentration should be the
rate-determining factor for N2O reduction rather than total denitrification activity, which
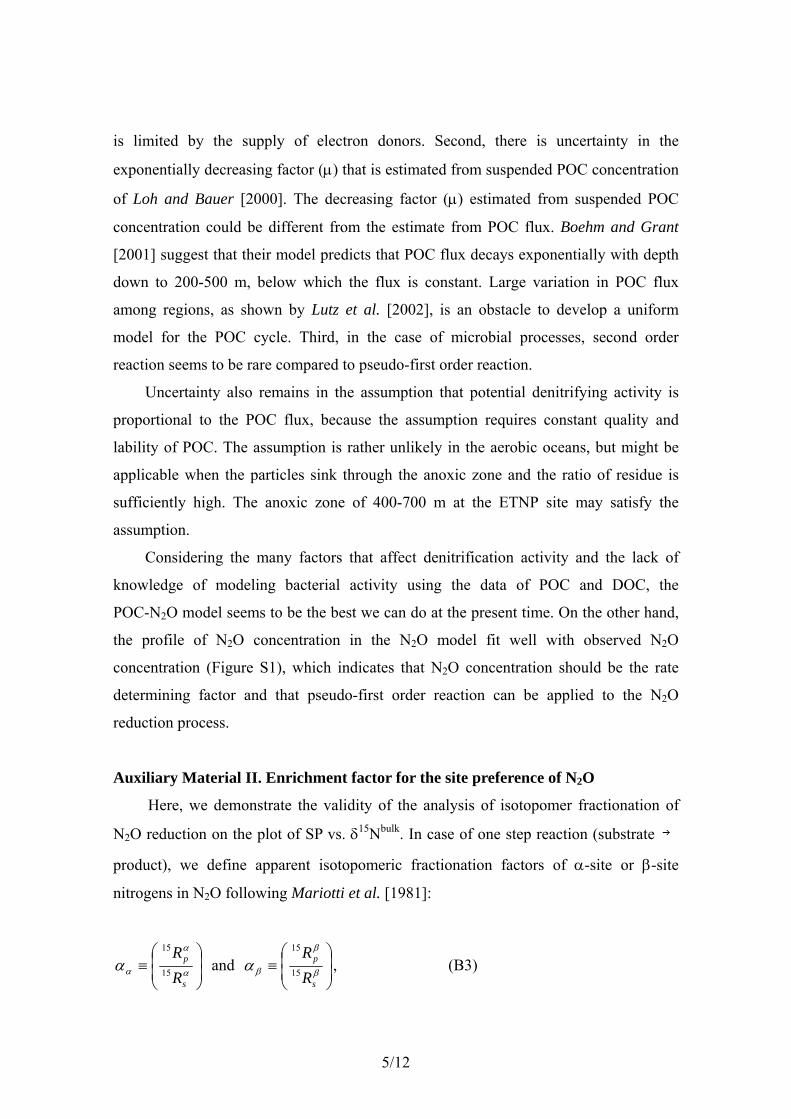
5/12
is limited by the supply of electron donors. Second, there is uncertainty in the
exponentially decreasing factor (µ) that is estimated from suspended POC concentration
of Loh and Bauer [2000]. The decreasing factor (µ) estimated from suspended POC
concentration could be different from the estimate from POC flux. Boehm and Grant
[2001] suggest that their model predicts that POC flux decays exponentially with depth
down to 200-500 m, below which the flux is constant. Large variation in POC flux
among regions, as shown by Lutz et al. [2002], is an obstacle to develop a uniform
model for the POC cycle. Third, in the case of microbial processes, second order
reaction seems to be rare compared to pseudo-first order reaction.
Uncertainty also remains in the assumption that potential denitrifying activity is
proportional to the POC flux, because the assumption requires constant quality and
lability of POC. The assumption is rather unlikely in the aerobic oceans, but might be
applicable when the particles sink through the anoxic zone and the ratio of residue is
sufficiently high. The anoxic zone of 400-700 m at the ETNP site may satisfy the
assumption.
Considering the many factors that affect denitrification activity and the lack of
knowledge of modeling bacterial activity using the data of POC and DOC, the
POC-N2O model seems to be the best we can do at the present time. On the other hand,
the profile of N2O concentration in the N2O model fit well with observed N2O
concentration (Figure S1), which indicates that N2O concentration should be the rate
determining factor and that pseudo-first order reaction can be applied to the N2O
reduction process.
Auxiliary Material II. Enrichment factor for the site preference of N2O
Here, we demonstrate the validity of the analysis of isotopomer fractionation of
N2O reduction on the plot of SP vs. δ15Nbulk. In case of one step reaction (substrate →
product), we define apparent isotopomeric fractionation factors of α-site or β-site
nitrogens in N2O following Mariotti et al. [1981]:
≡ α
α
ααs
p
RR
15
15
and
≡ β
β
βαs
p
RR
15
15
, (B3)
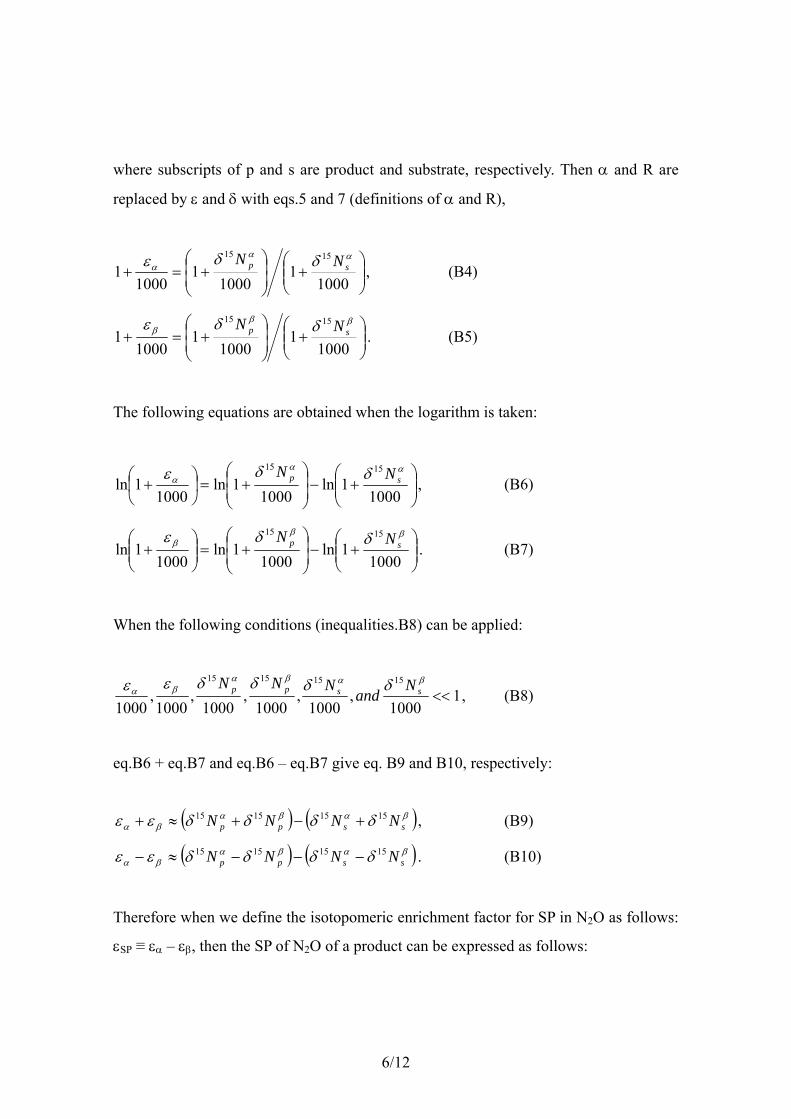
6/12
where subscripts of p and s are product and substrate, respectively. Then α and R are
replaced by ε and δ with eqs.5 and 7 (definitions of α and R),
+
+=+
10001
10001
10001
1515 ααα δδε sp NN
, (B4)
+
+=+
10001
10001
10001
1515 βββ δδε sp NN
. (B5)
The following equations are obtained when the logarithm is taken:
+−
+=
+
10001ln
10001ln
10001ln
1515 ααα δδε sp NN
, (B6)
+−
+=
+
10001ln
10001ln
10001ln
1515 βββ δδε sp NN
. (B7)
When the following conditions (inequalities.B8) can be applied:
11000
,1000
,1000
,1000
,1000
,1000
15151515
<<βαβα
βα δδδδεε sspp NandNNN, (B8)
eq.B6 + eq.B7 and eq.B6 – eq.B7 give eq. B9 and B10, respectively:
( ) ( )βαβαβα δδδδεε sspp NNNN 15151515 +−+≈+ , (B9)
( ) ( )βαβαβα δδδδεε sspp NNNN 15151515 −−−≈− . (B10)
Therefore when we define the isotopomeric enrichment factor for SP in N2O as follows:
εSP ≡ εα – εβ, then the SP of N2O of a product can be expressed as follows:
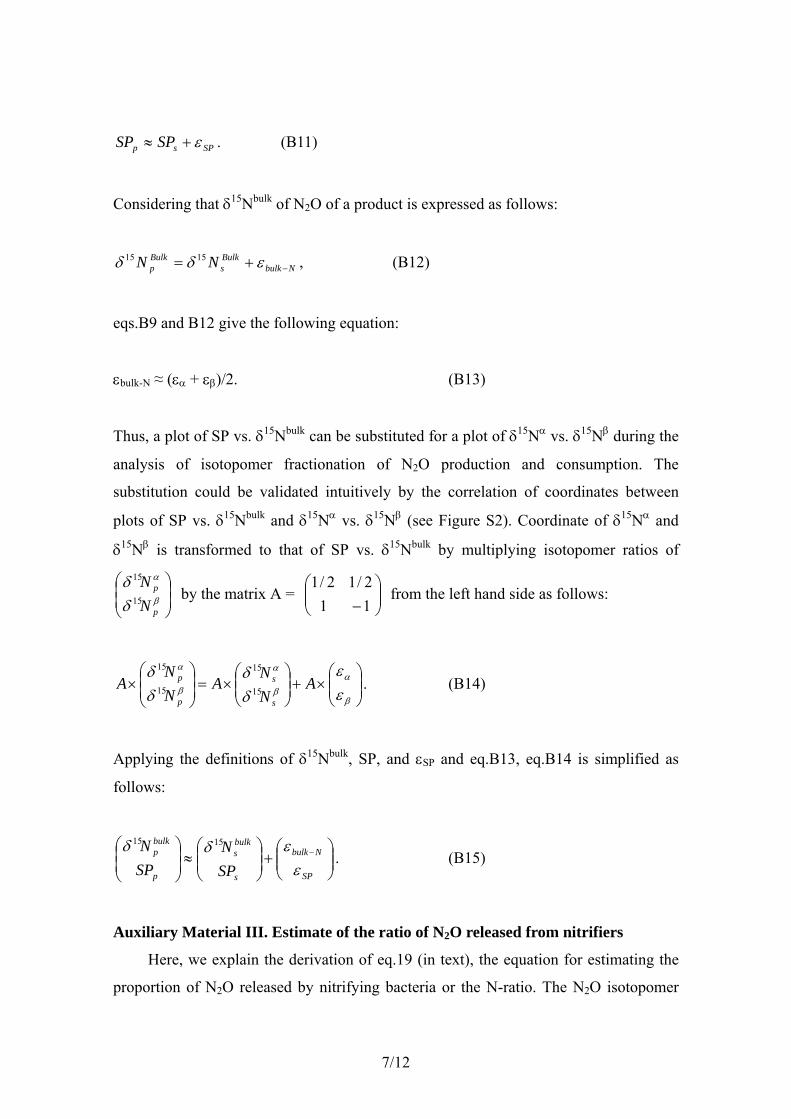
7/12
SPsp SPSP ε+≈ . (B11)
Considering that δ15Nbulk of N2O of a product is expressed as follows:
NbulkBulks
Bulkp NN −+= εδδ 1515 , (B12)
eqs.B9 and B12 give the following equation:
εbulk-N ≈ (εα + εβ)/2. (B13)
Thus, a plot of SP vs. δ15Nbulk can be substituted for a plot of δ15Nα vs. δ15Nβ during the
analysis of isotopomer fractionation of N2O production and consumption. The
substitution could be validated intuitively by the correlation of coordinates between
plots of SP vs. δ15Nbulk and δ15Nα vs. δ15Nβ (see Figure S2). Coordinate of δ15Nα and
δ15Nβ is transformed to that of SP vs. δ15Nbulk by multiplying isotopomer ratios of
β
α
δδ
p
p
NN
15
15
by the matrix A =
−11
2/12/1 from the left hand side as follows:
×+
×=
×
β
αβ
α
β
α
εε
δδ
δδ
ANN
ANN
As
s
p
p15
15
15
15
. (B14)
Applying the definitions of δ15Nbulk, SP, and εSP and eq.B13, eq.B14 is simplified as
follows:
+
≈
−
SP
Nbulk
s
bulks
p
bulkp
SPN
SPN
εεδδ 1515
. (B15)
Auxiliary Material III. Estimate of the ratio of N2O released from nitrifiers
Here, we explain the derivation of eq.19 (in text), the equation for estimating the
proportion of N2O released by nitrifying bacteria or the N-ratio. The N2O isotopomer
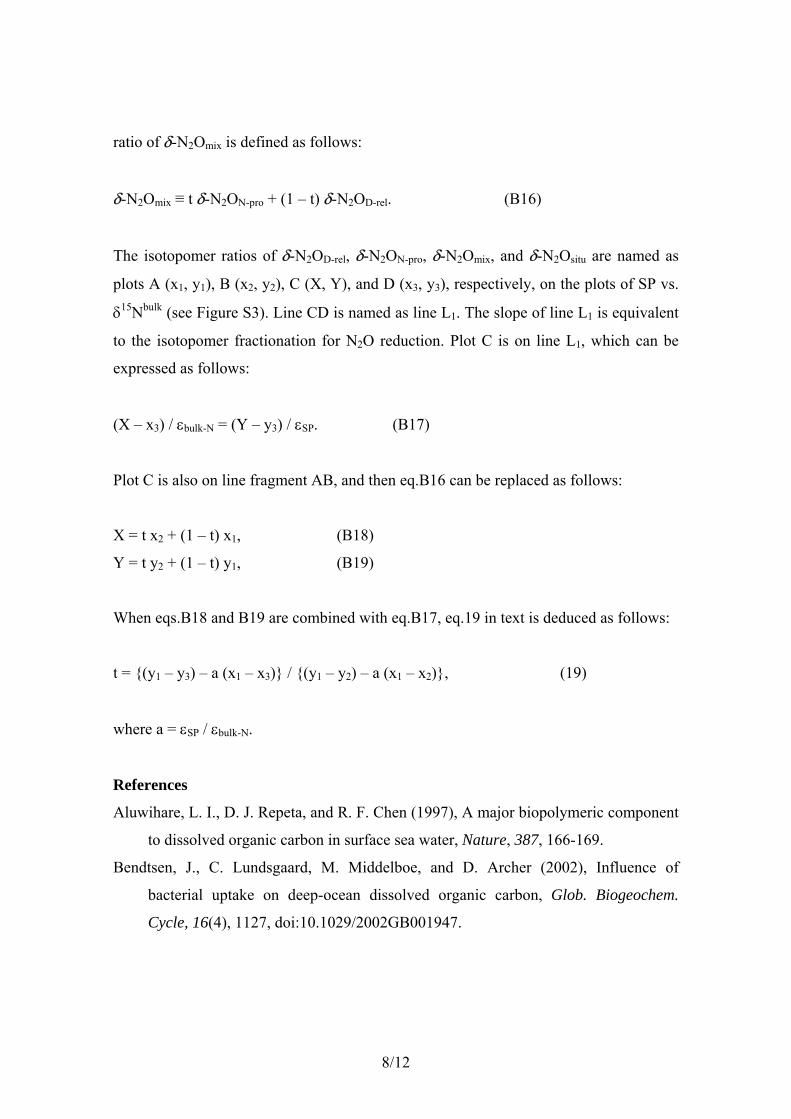
8/12
ratio of δ-N2Omix is defined as follows:
δ-N2Omix ≡ t δ-N2ON-pro + (1 – t) δ-N2OD-rel. (B16)
The isotopomer ratios of δ-N2OD-rel, δ-N2ON-pro, δ-N2Omix, and δ-N2Ositu are named as
plots A (x1, y1), B (x2, y2), C (X, Y), and D (x3, y3), respectively, on the plots of SP vs.
δ15Nbulk (see Figure S3). Line CD is named as line L1. The slope of line L1 is equivalent
to the isotopomer fractionation for N2O reduction. Plot C is on line L1, which can be
expressed as follows:
(X – x3) / εbulk-N = (Y – y3) / εSP. (B17)
Plot C is also on line fragment AB, and then eq.B16 can be replaced as follows:
X = t x2 + (1 – t) x1, (B18)
Y = t y2 + (1 – t) y1, (B19)
When eqs.B18 and B19 are combined with eq.B17, eq.19 in text is deduced as follows:
t = {(y1 – y3) – a (x1 – x3)} / {(y1 – y2) – a (x1 – x2)}, (19)
where a = εSP / εbulk-N.
References
Aluwihare, L. I., D. J. Repeta, and R. F. Chen (1997), A major biopolymeric component
to dissolved organic carbon in surface sea water, Nature, 387, 166-169.
Bendtsen, J., C. Lundsgaard, M. Middelboe, and D. Archer (2002), Influence of
bacterial uptake on deep-ocean dissolved organic carbon, Glob. Biogeochem.
Cycle, 16(4), 1127, doi:10.1029/2002GB001947.

9/12
Boehm, A. B., and S. B. Grant (2001), A steady state model of particulate organic
carbon flux below the mixed layer and application to the Joint Global Ocean Flux
Study, J. Geophys. Res.-Oceans, 106, 31227-31237.
Cline, J. D., and I. R. Kaplan (1975), Isotopic fractionation of dissolved nitrate during
denitrification in the eastern tropical North Pacific Ocean., Marine Chem., 3,
271-299.
Loh, A. N., and J. E. Bauer (2000), Distribution, partitioning and fluxes of dissolved
and particulate organic C, N and P in the eastern North Pacific and Southern
Oceans, Deep-Sea Res. Part I-Oceanogr. Res. Pap., 47, 2287-2316.
Lutz, M., R. Dunbar, and K. Caldeira (2002), Regional variability in the vertical flux of
particulate organic carbon in the ocean interior, Global Biogeochem. Cycles, 16(3),
1037, doi:10.1029/2000GB001383.
Mariotti, A., J. C. Germon, P. Hubert, P. Kaiser, R. Letolle, A. Tardieux, and P.
Tardieux (1981), Experimental determination of nitrogen kinetic isotope
fractionation: some principles; illustration for the denitrification and nitrification
processes, Plant and Soil, 62, 413-430.
Ostrom, N. E., et al. (2002), Nitrogen transformations and NO3– removal at a
soil-stream interface: A stable isotope approach, Ecol. Appl., 12, 1027-1043.
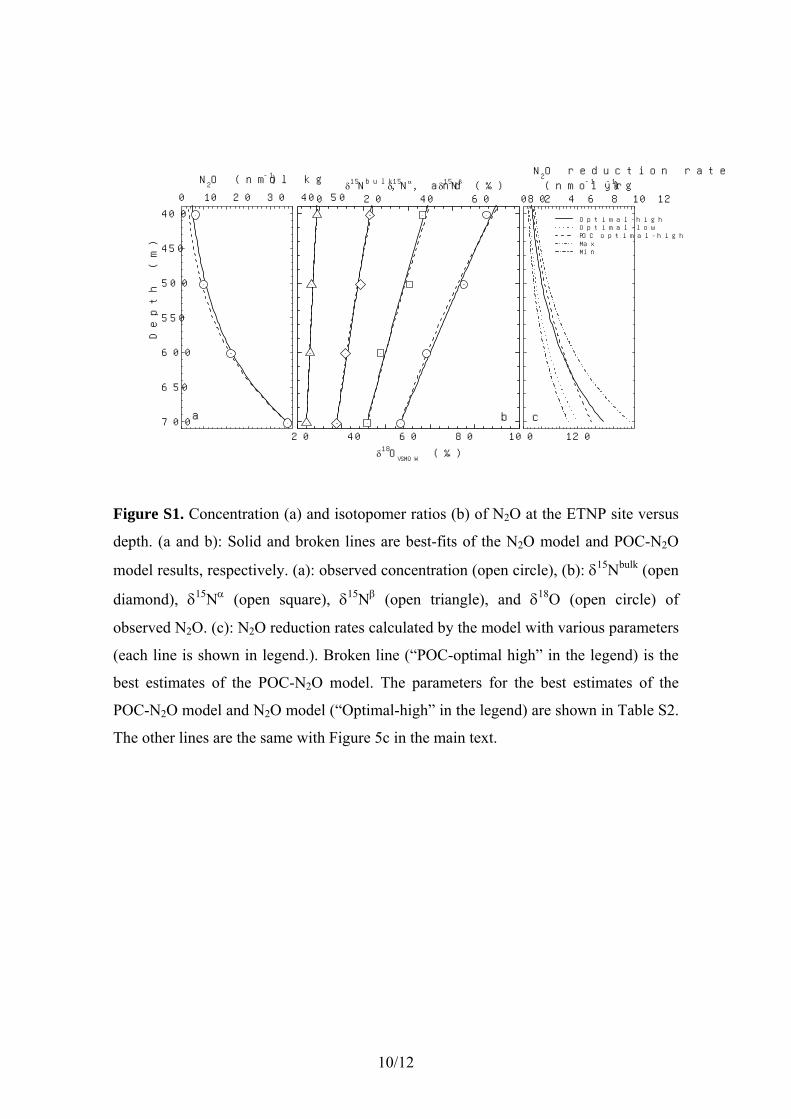
10/12
0 20 40 60 80
20 40 60 80 100 120
0 2 4 6 8 10 12
400
450
500
550
600
650
700
0 10 20 30 40 50
cb
δ15Nbulk , δ15Nα, and δ15Nβ (‰)
a
δ18OVSMOW
(‰)
Optimal-high Optimal-low POC optimal-high Max Min
N2O reduction rate
(nmol kg-1 yr-1)
N2O (nmol kg-1)
Depth
(m
)
Figure S1. Concentration (a) and isotopomer ratios (b) of N2O at the ETNP site versus
depth. (a and b): Solid and broken lines are best-fits of the N2O model and POC-N2O
model results, respectively. (a): observed concentration (open circle), (b): δ15Nbulk (open
diamond), δ15Nα (open square), δ15Nβ (open triangle), and δ18O (open circle) of
observed N2O. (c): N2O reduction rates calculated by the model with various parameters
(each line is shown in legend.). Broken line (“POC-optimal high” in the legend) is the
best estimates of the POC-N2O model. The parameters for the best estimates of the
POC-N2O model and N2O model (“Optimal-high” in the legend) are shown in Table S2.
The other lines are the same with Figure 5c in the main text.
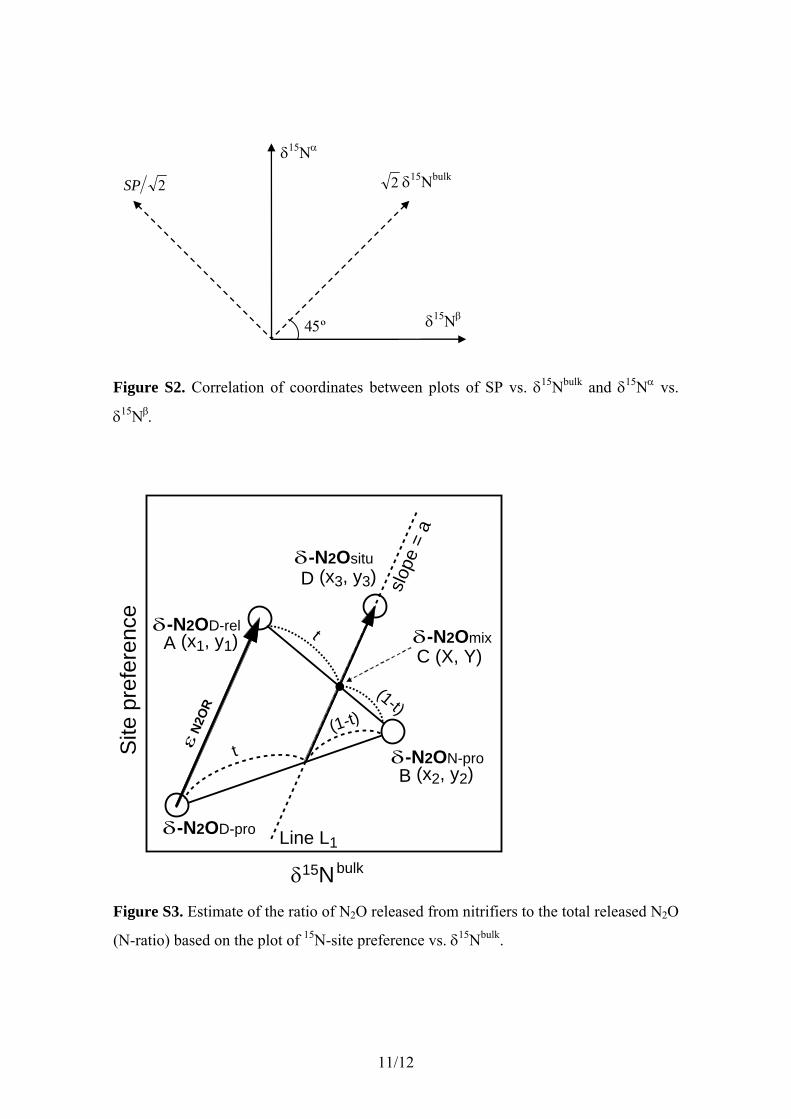
11/12
Figure S2. Correlation of coordinates between plots of SP vs. δ15Nbulk and δ15Nα vs.
δ15Nβ.
δ15Nbulk
Site
pre
fere
nce
δ-N2OD-pro
δ-N2OD-rel
δ-N2ON-pro
δ-N2Ositu
εN2
OR
t(1-t)
(1-t)
tA (x1, y1)
B (x2, y2)
D (x3, y3) slope
= a
C (X, Y)δ-N2Omix
Line L1
Figure S3. Estimate of the ratio of N2O released from nitrifiers to the total released N2O
(N-ratio) based on the plot of 15N-site preference vs. δ15Nbulk.
2 δ15Nbulk2SP
δ15Nβ
δ15Nα
45º
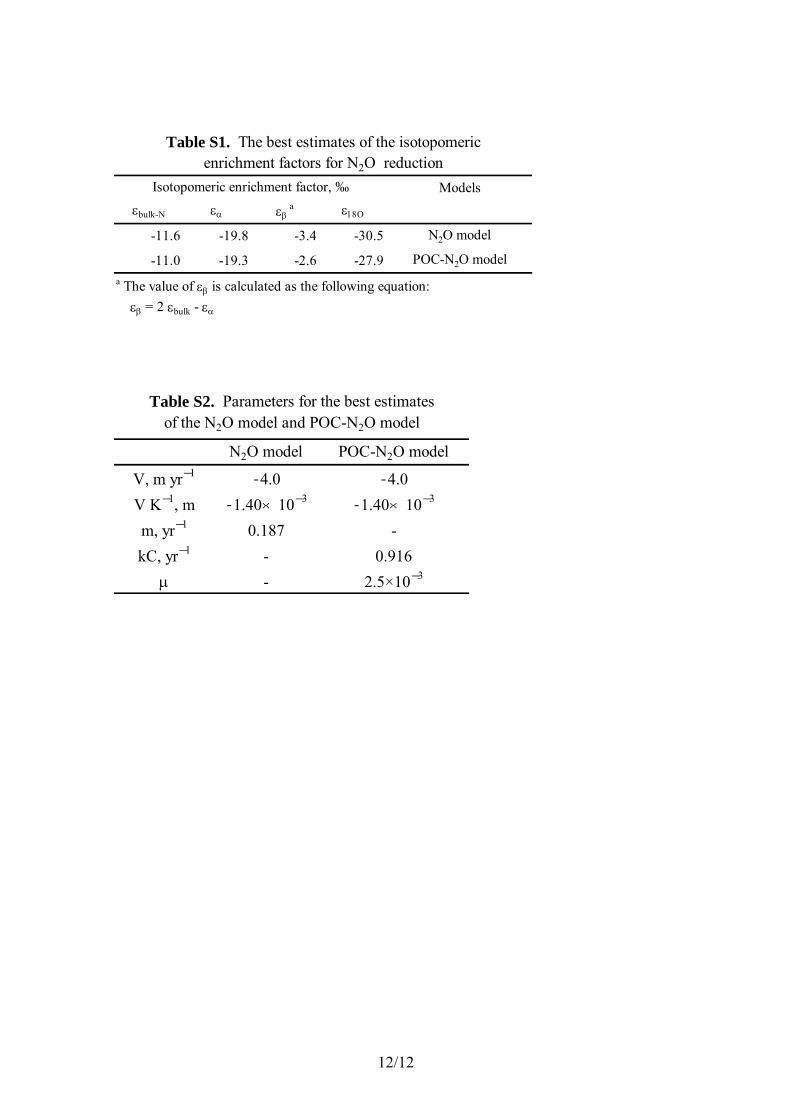
12/12
Modelsεbulk-N εα εβ
a ε18Ο
-11.6 -19.8 -3.4 -30.5 N2O model
-11.0 -19.3 -2.6 -27.9 POC-N2O model
Table S1. The best estimates of the isotopomericenrichment factors for N2O reduction
Isotopomeric enrichment factor, ‰
a The value of εβ is calculated as the following equation: εβ = 2 εbulk - εα
N2O model POC-N2O model
V, m yr-1-4.0 -4.0
V K-1, m -1.40×10⁻³-1.40×10⁻³
m, yr-1 0.187 -kC, yr-1 - 0.916
µ - 2.5×10⁻³
Table S2. Parameters for the best estimatesof the N2O model and POC-N2O model
Recommended