Renal Cancer: Symptoms,
diagnosis, pathology & prognosis
Mark Johnson
Consultant Urological Surgeon
Newcastle upon Tyne Hospitals NHS Foundation Trust

Plan for today:
• How renal tumours present
• What investigations are needed and why
• What types of tumours are found
• How stage & grade can help predict outcome
UK Incidence 2007
0 20000 40000 60000 80000 100000 120000
Breast
Lung
Colorectal
Prostate
Bladder
Kidney
Testis
Penis
All other
Men Women
2.7% of new cases
= 8,228 cases
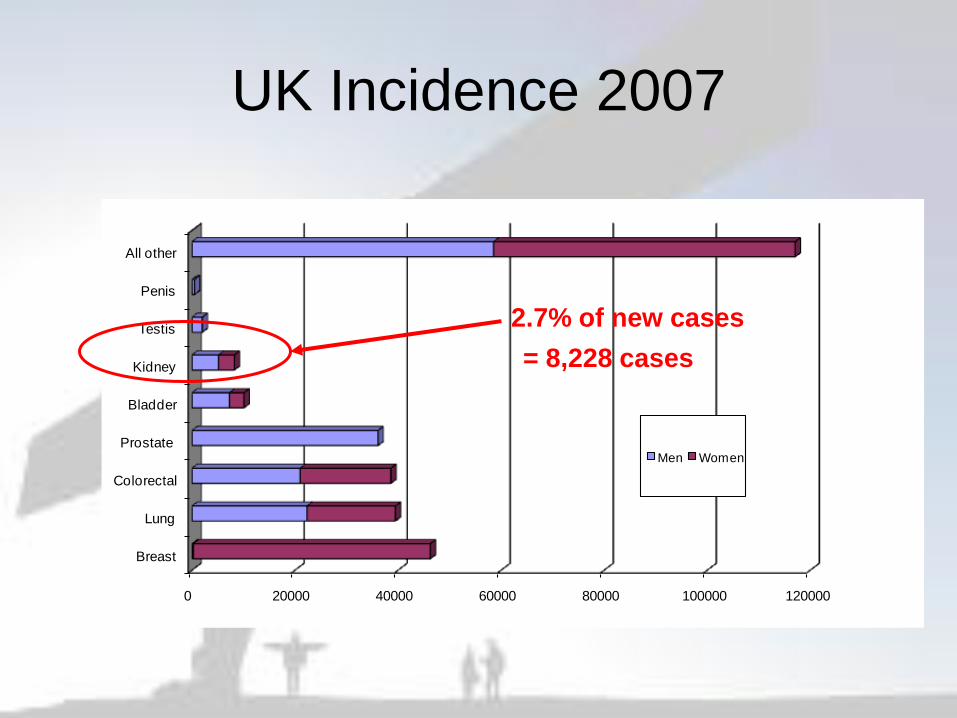
UK Mortality 2008
0 10000 20000 30000 40000
Kidney
Bladder
Prostate
Breast
Colorectal
Lung
Men
Women
3,848 cases
Renal cancer
• The incidence continues to rise
• Peak in ages 60 -70
• Male:Female: 1.6 to 1
Patients present in various ways:
• No symptoms
• Symptoms from the primary tumour
– ‘paraneoplastic syndromes’
• Symptoms from metastatic tumours

‘incidental’ tumours
• Before CT & US around 7% of tumours
were detected incidentally
• In modern series up to 80% are incidental
finding on US / CT (& increasingly MRI)
• Metastatic as well as primary tumours may
be detected incidentally
Paraneoplastic syndromes:
• In up to 20% of cases
– High ESR
– Polycythaemia
– Hypercalcaemia
– Hypertension
– Pyrexia
– Cachexia
– Stauffer’s syndrome
Stauffer’s syndrome:
• 3-20% incidence
• Elevated alkaline phosphatase
• Prolonged PT time
• Hypoalbuminaemia
• Elevated bilirubin & transaminases
• Normalises in 70% post nephrectomy –
perisistence is a poor prognostic sign (indicates
viable tumour)
Symptoms from the primary:
• Virchows Triad – the ‘too late triad’:
– Haematuria
– Flank pain
– Abdominal mass
• Now a far less common presentation of
RCC
– 9% in 1970 3% in 1995
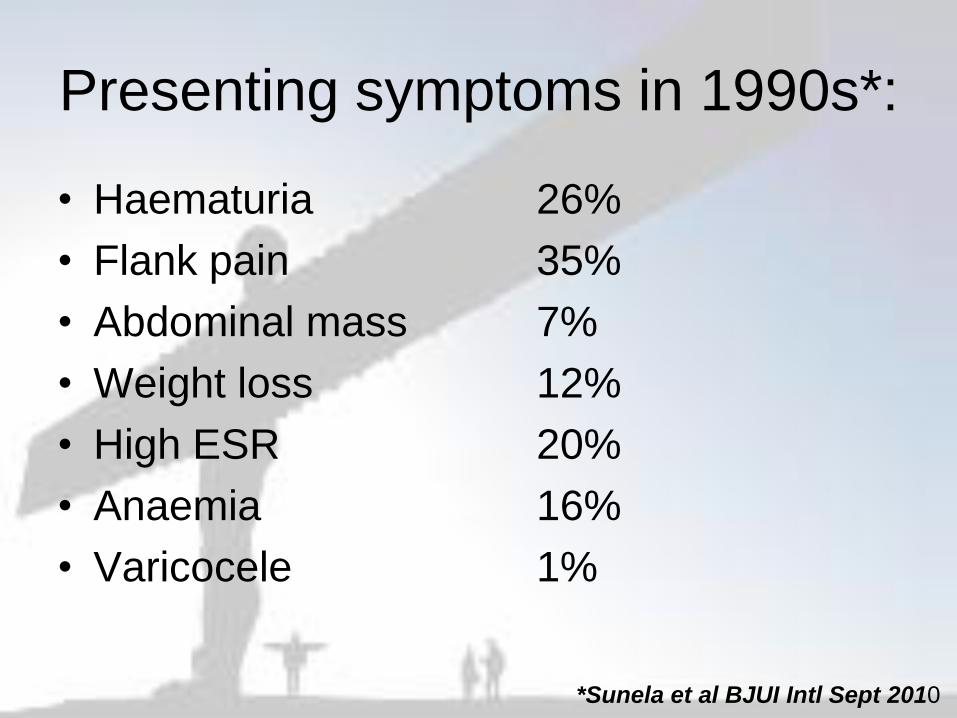
Presenting symptoms in 1990s*:
• Haematuria 26%
• Flank pain 35%
• Abdominal mass 7%
• Weight loss 12%
• High ESR 20%
• Anaemia 16%
• Varicocele 1%
*Sunela et al BJUI Intl Sept 2010
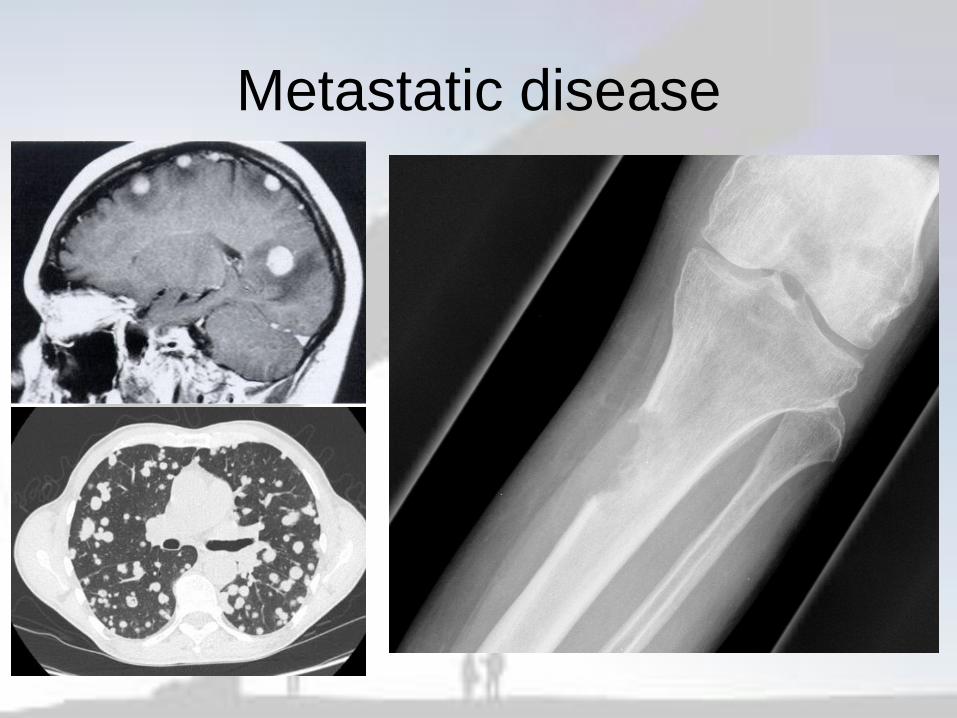
Metastatic disease
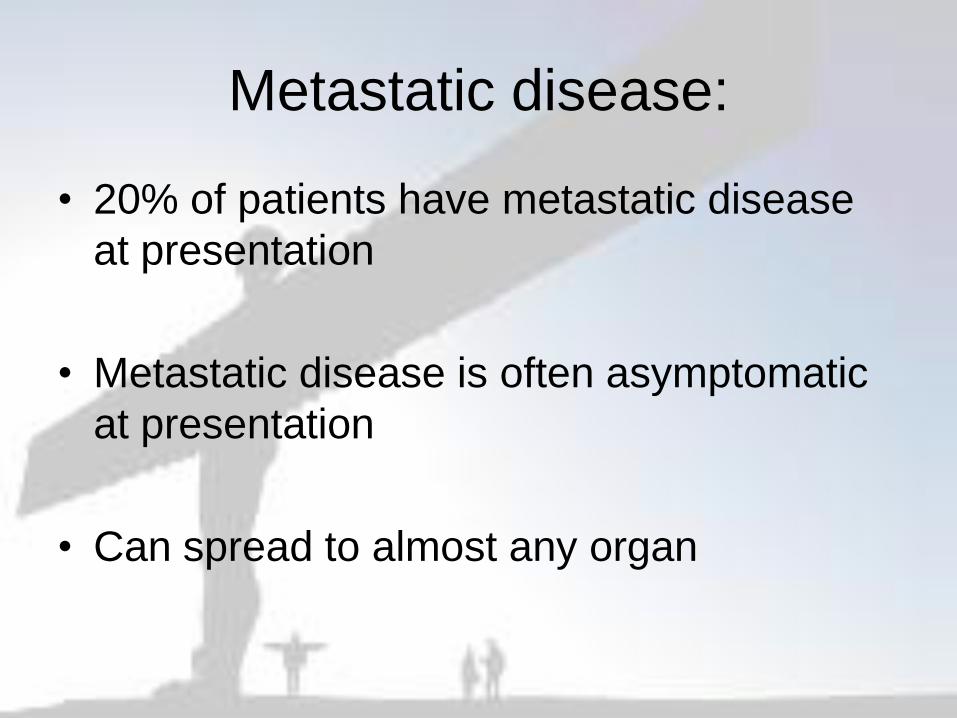
Metastatic disease:
• 20% of patients have metastatic disease
at presentation
• Metastatic disease is often asymptomatic
at presentation
• Can spread to almost any organ
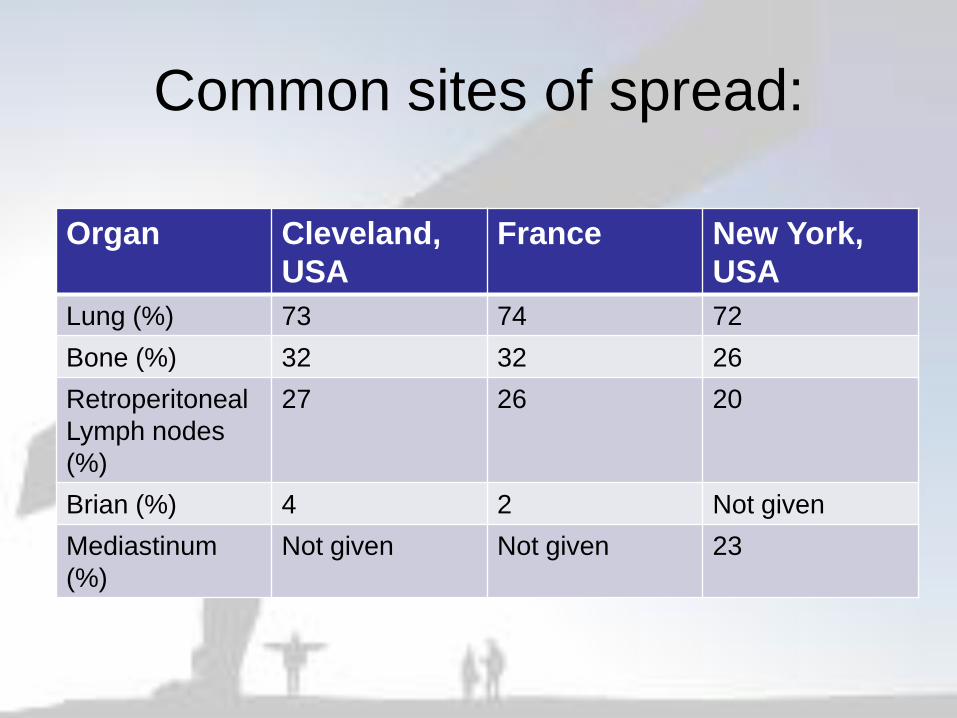
Common sites of spread:
Organ Cleveland,
USA
France New York,
USA
Lung (%) 73 74 72
Bone (%) 32 32 26
Retroperitoneal
Lymph nodes
(%)
27 26 20
Brian (%) 4 2 Not given
Mediastinum
(%)
Not given Not given 23
Diagnosis:
• Tumour markers for kidney cancer are
currently unavailable
• No blood test will make the diagnosis
Useful blood tests:
• FBC
– Anaemia
– Erythrocytosis
• Bone biochemistry
– Hypercalcaemia
• Liver Function Tests
• ESR
• Creatinine
Diagnosis by imaging:
• Incidental tumours are commonly found on
ultrasound (US) perfomed for other
reasons
• Suspicous lesions must be further
evaluated with a correctly performed CT
scan (or MRI)
Renal Mass Protocol CT
• A renal protocol multidetector CT scan is
recommended for further diagnostic
imaging, unless the patient cannot tolerate
iodinated contrast agents
• Sections through the abdomen and chest
• It should not be routine to image the pelvis
Three sets of images (phases):
1.Non-contrast phase
2. Injection of IV contrast
3.Corticomedullary (arterial) phase at 40 seconds
4.Nephrographic phases at 100 seconds
• 3-D reconstruction of the corticomedullary phase
shows the vasculature, which can be useful for
surgical planning
• It is usually combined with a non contrast CT of
chest
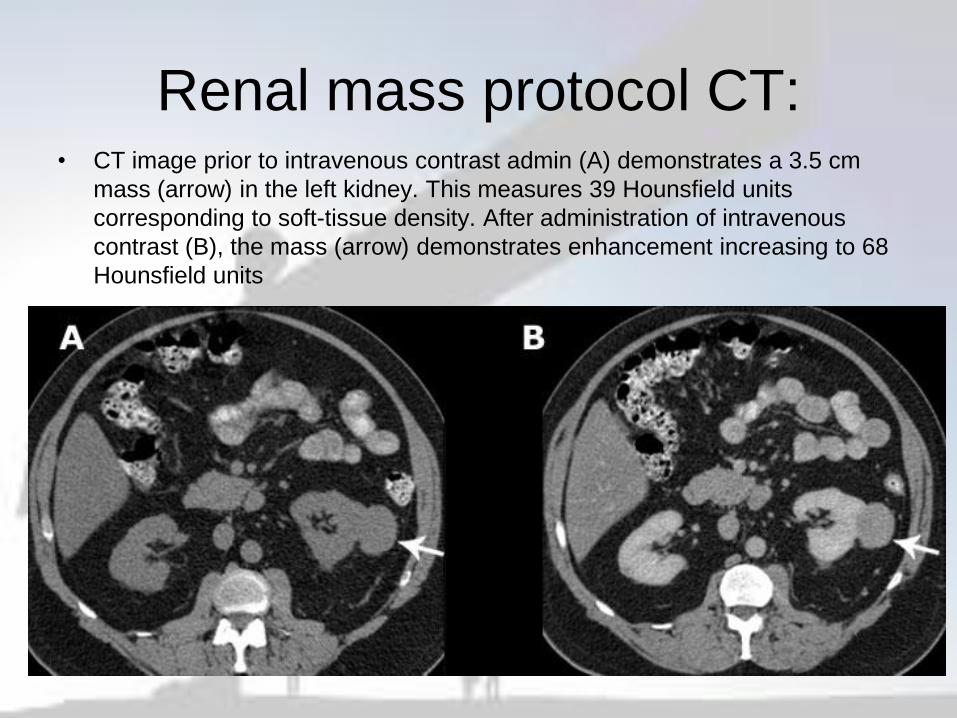
Renal mass protocol CT:• CT image prior to intravenous contrast admin (A) demonstrates a 3.5 cm
mass (arrow) in the left kidney. This measures 39 Hounsfield units
corresponding to soft-tissue density. After administration of intravenous
contrast (B), the mass (arrow) demonstrates enhancement increasing to 68
Hounsfield units

Enhancment?
• The Hounsfield scale, named after Sir Godfrey
Hounsfield is a quantitative scale for describing
radiodensity on CT scans
• The scale is defined in Hounsfield units (symbol
HU), running from air at −1000 HU, through
water at 0 HU, and up to bone at +400 HU and
more
• Significant enhancment in renal tumours is
defined as an increase of 15 Hounsfield units
or more
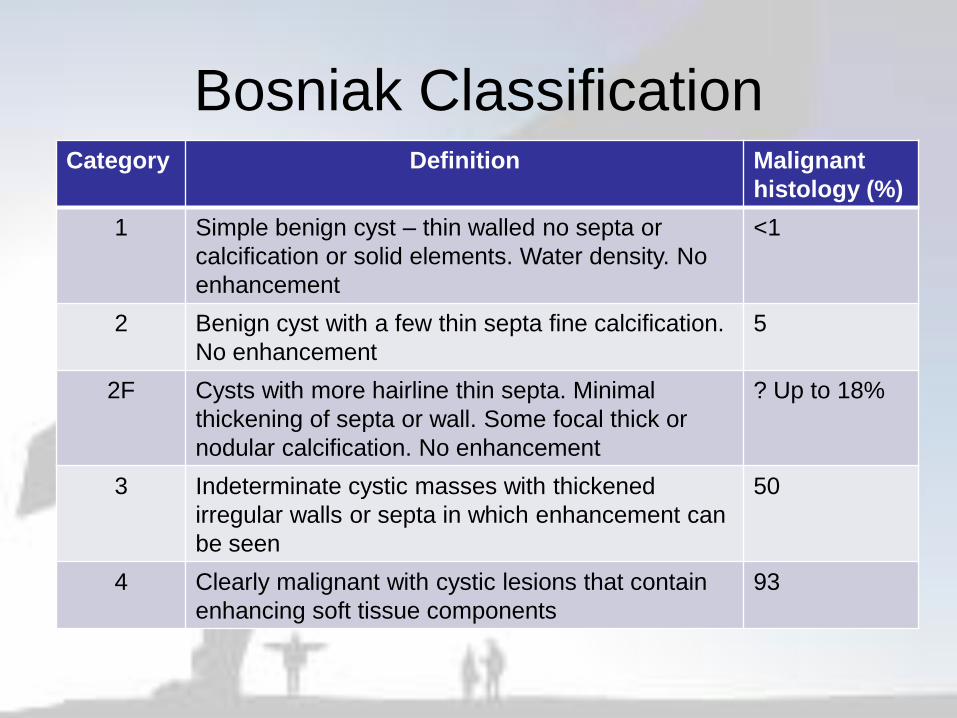
Bosniak ClassificationCategory Definition Malignant
histology (%)
1 Simple benign cyst – thin walled no septa or
calcification or solid elements. Water density. No
enhancement
<1
2 Benign cyst with a few thin septa fine calcification.
No enhancement
5
2F Cysts with more hairline thin septa. Minimal
thickening of septa or wall. Some focal thick or
nodular calcification. No enhancement
? Up to 18%
3 Indeterminate cystic masses with thickened
irregular walls or septa in which enhancement can
be seen
50
4 Clearly malignant with cystic lesions that contain
enhancing soft tissue components
93
Additional imaging:
• Isotope bone scan: If alkaline phosphatase
is elevated or c/o bone pain
• USS/MRI: if there is a concern about caval
extension
• Cavography is rarely used to assess IVC
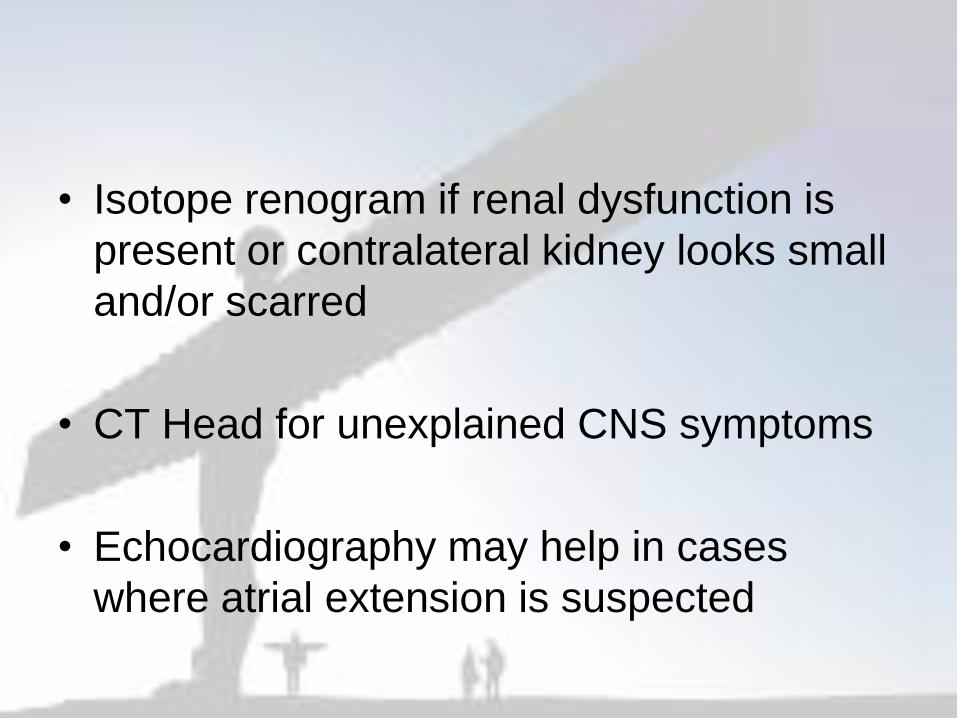
• Isotope renogram if renal dysfunction is
present or contralateral kidney looks small
and/or scarred
• CT Head for unexplained CNS symptoms
• Echocardiography may help in cases
where atrial extension is suspected

Pathology:
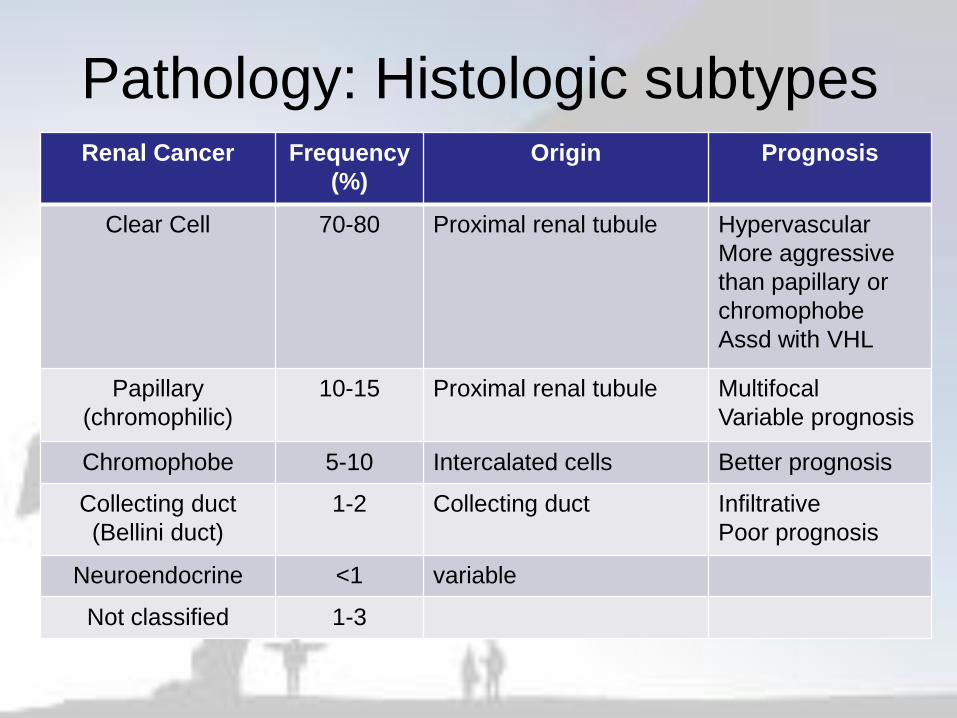
Pathology: Histologic subtypesRenal Cancer Frequency
(%)
Origin Prognosis
Clear Cell 70-80 Proximal renal tubule Hypervascular
More aggressive
than papillary or
chromophobe
Assd with VHL
Papillary
(chromophilic)
10-15 Proximal renal tubule Multifocal
Variable prognosis
Chromophobe 5-10 Intercalated cells Better prognosis
Collecting duct
(Bellini duct)
1-2 Collecting duct Infiltrative
Poor prognosis
Neuroendocrine <1 variable
Not classified 1-3

TNM Classification 2002 (6th Ed)• T1 7cm or less limited to kidney
– T1a 4cm or less
– T1b more than 4cm but not more than 7cm
• T2 more than 7cm limited to kidney
• T3
– T3a Invades adrenal or peri-nephric tissue
but not beyond Gerota
– T3b into renal veins or vena cava below
diaphragm
– T3c Into vena cava above the diaphragm
• T4 Tumour directly invades Gerotas fascia
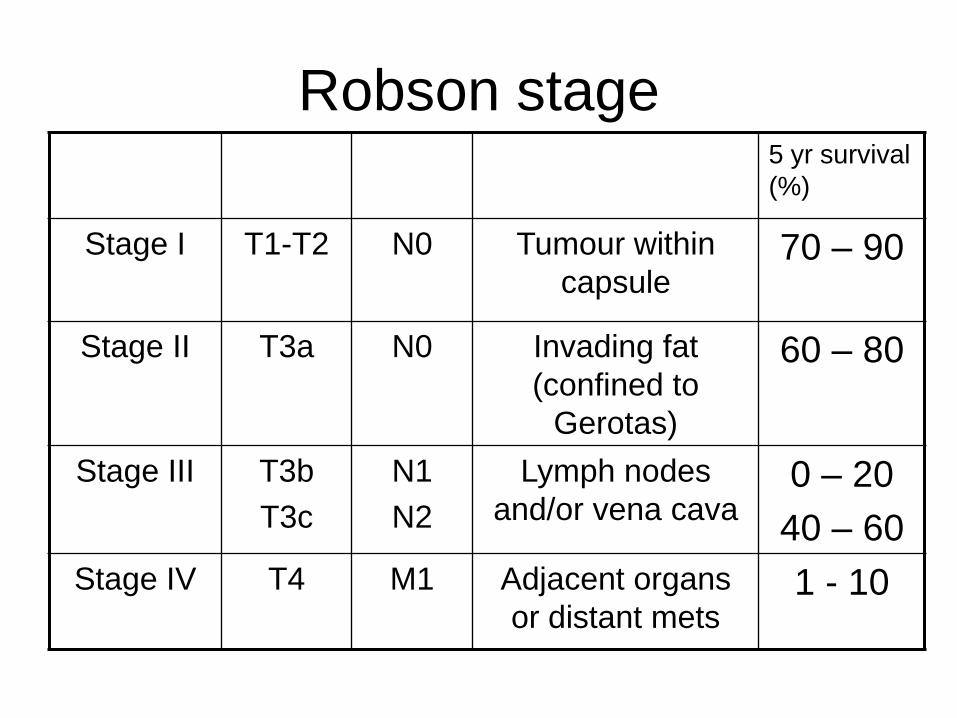
Robson stage5 yr survival
(%)
Stage I T1-T2 N0 Tumour within
capsule70 – 90
Stage II T3a N0 Invading fat
(confined to
Gerotas)
60 – 80
Stage III T3b
T3c
N1
N2
Lymph nodes
and/or vena cava0 – 20
40 – 60
Stage IV T4 M1 Adjacent organs
or distant mets1 - 10
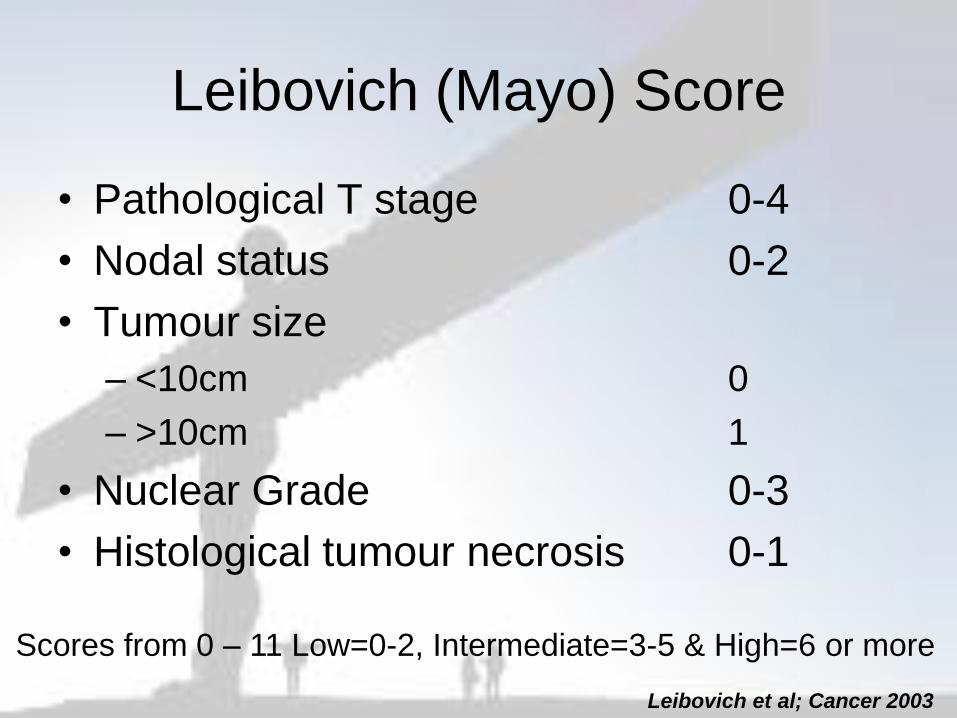
Leibovich (Mayo) Score
• Pathological T stage 0-4
• Nodal status 0-2
• Tumour size
– <10cm 0
– >10cm 1
• Nuclear Grade 0-3
• Histological tumour necrosis 0-1
Scores from 0 – 11 Low=0-2, Intermediate=3-5 & High=6 or more
Leibovich et al; Cancer 2003

Leibovich score & outcome:
Leibovich et al; Cancer 2003
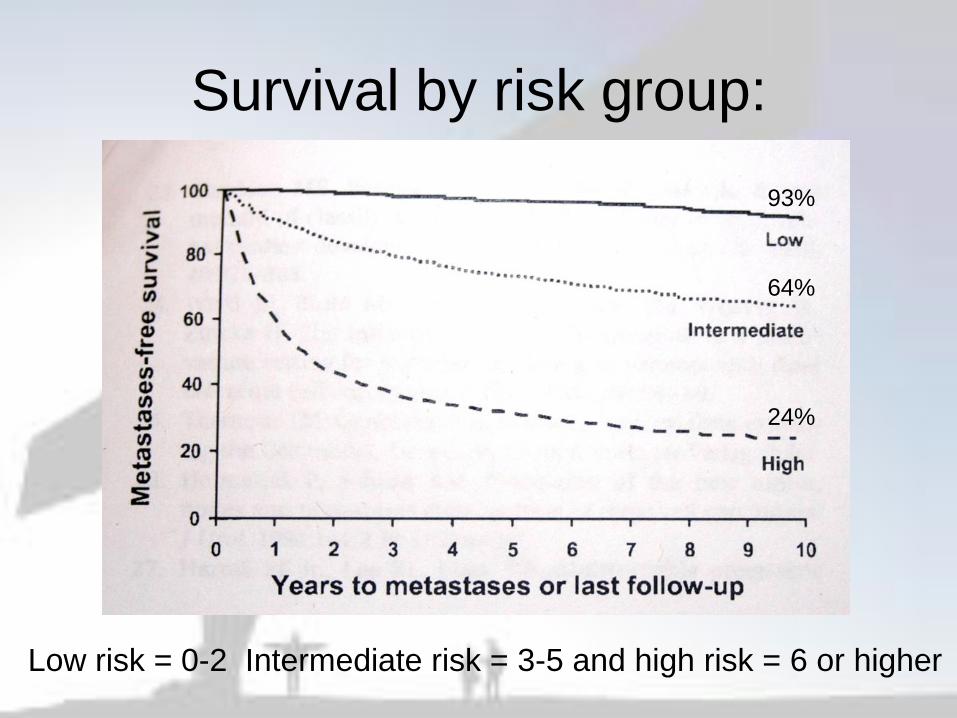
Survival by risk group:
Low risk = 0-2 Intermediate risk = 3-5 and high risk = 6 or higher
93%
64%
24%

Thank You
Recommended