Collection of Refugee Data
August 2015
Refugee Definition
• “A person who is unable or unwilling to return to his or her country of nationality* because of persecution or a well-founded fear of persecution on account of race, religion, nationality, membership in a particular social group, or political opinion.”1
* Or, if an applicant is considered “stateless,” his or her country of last habitual residence.
Eligibility Requirements for Principal Applicant
1. Be of special humanitarian concern to the United States
2. Meet the refugee definition set forth in section 101(a)(42) of the INA
3. By admissible under the INA
4. Not be firmly resettled in any foreign country2
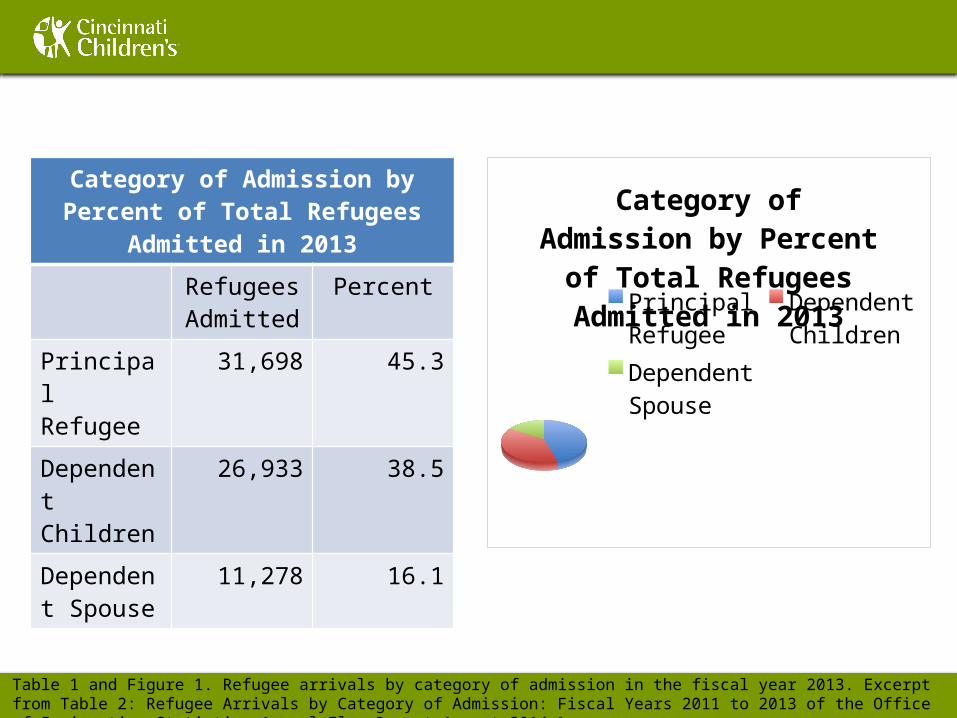
Category of Admission by Percent of Total Refugees Admitted in 2013
Refugees Admitted
Percent
Principal Refugee
31,698 45.3
Dependent Children
26,933 38.5
Dependent Spouse
11,278 16.1
Category of Admission by Percent of Total
Refugees Admitted in 2013 Principal
RefugeeDependent ChildrenDependent Spouse
Table 1 and Figure 1. Refugee arrivals by category of admission in the fiscal year 2013. Excerpt from Table 2: Refugee Arrivals by Category of Admission: Fiscal Years 2011 to 2013 of the Office of Immigration Statistics Annual Flow Report August 2014. 2
Eligibility Requirements for Derivative Refugee
• Need not meet all aforementioned eligibility requirements of principal applicant
• Instead, must demonstrate relationship as spouse or child of admitted refugee2

REFUGEE ARRIVAL TRENDS1975-June 2015
Former
Fiscal Soviet Latin America Near East
Year Africa Europe Union Kosovo Caribbean South Asia PSI Total
1975 0 135,000 1,947 6,211 0 3,000 0 0 146,158
1976 0 15,000 1,756 7,450 0 3,000 0 0 27,206
1977 0 7,000 1,755 8,191 0 3,000 0 0 19,946
1978 0 20,574 2,245 10,688 0 3,000 0 0 36,507
1979 0 76,521 3,393 24,449 0 7,000 0 0 111,363
1980 955 163,799 5,025 28,444 0 6,662 2,231 0 207,116
1981 2,119 131,139 6,704 13,444 0 2,017 3,829 0 159,252
1982 3,412 73,755 11,109 2,760 0 580 6,480 0 98,096
1983 2,645 39,245 11,867 1,342 0 691 5,428 0 61,218
1984 2,749 51,978 10,096 721 0 150 4,699 0 70,393
1985 1,951 49,962 9,233 623 0 151 5,784 0 67,704
1986 1,322 45,482 8,503 799 0 131 5,909 0 62,146
1987 1,990 40,099 8,396 3,699 0 323 10,021 0 64,528
1988 1,593 35,371 7,510 20,411 0 2,497 8,368 733 76,483
1989 1,902 45,722 * 8,752 39,602 0 2,604 6,938 1,550 107,070
1990 3,453 51,598 * 6,094 50,628 0 2,305 4,979 3,009 122,066
1991 4,420 53,522 * 6,837 39,226 0 2,253 5,342 1,789 113,389
1992 5,470 51,899 * 2,915 61,397 0 3,065 6,903 882 132,531
1993 6,967 49,817 * 2,582 48,773 0 4,071 6,987 251 119,448
1994 5,860 43,564 * 7,707 43,854 0 6,156 5,840 0 112,981
1995 4,827 36,987 * 10,070 35,951 0 7,629 4,510 0 99,974
1996 7,604 19,321 * 12,145 29,816 0 3,550 3,967 0 76,403
1997 6,065 8,594 * 21,401 27,331 0 2,996 4,101 0 70,488
1998 6,887 10,854 * 30,842 23,557 0 1,627 3,313 0 77,080
1999 13,043 10,206 * 24,497 17,410 14,161 2,110 4,098 0 85,525
2000 17,561 4,561 * 22,561 15,103 0 3,232 10,129 0 73,147
2001 19,020 4,163 * 15,794 15,978 0 2,975 11,956 0 69,886
2002 2,551 3,512 * 5,459 9,969 0 1,934 3,706 0 27,131
2003 10,714 1,724 * 2,506 8,750 0 455 4,260 0 28,409
2004 29,104 8,084 * 9,254 0 0 3,577 2,854 0 52,873
2005 20,745 12,076 * 11,316 0 0 6,699 2,977 0 53,813
2006 18,126 5,659 * 10,456 0 0 3,264 3,718 0 41,223
2007 17,483 15,643 * 4,560 0 0 2,976 7,620 0 48,282
2008 8,935 19,489 * 2,343 0 0 4,277 25,147 0 60,191
2009 9,670 19,850 * 1,997 0 0 4,857 38,280 0 74,654
2010 13,305 17,716 * 1,526 0 0 4,982 35,782 0 73,311
2011 7,685 17,367 * 1,228 0 0 2,976 27,168 0 56,424
2012 10,608 14,366 * 1,129 0 0 2,078 30,057 0 58,238
2013 15,980 16,537 * 580 0 0 4,439 32,390 0 69,926
2014 17,476 14,784 * 959 0 0 4,318 32,450 0 69,987
2015 14,117 11,606 * 1,810 0 0 1,773 16,617 0 45,923
Total 318,314 1,454,146 316,859 596,577 14,161 125,380 394,838 8,214 3,228,516
Regions (Based on the Nationality of the Principal Applicant)
Asia
* Includes Amerasian Immigrants
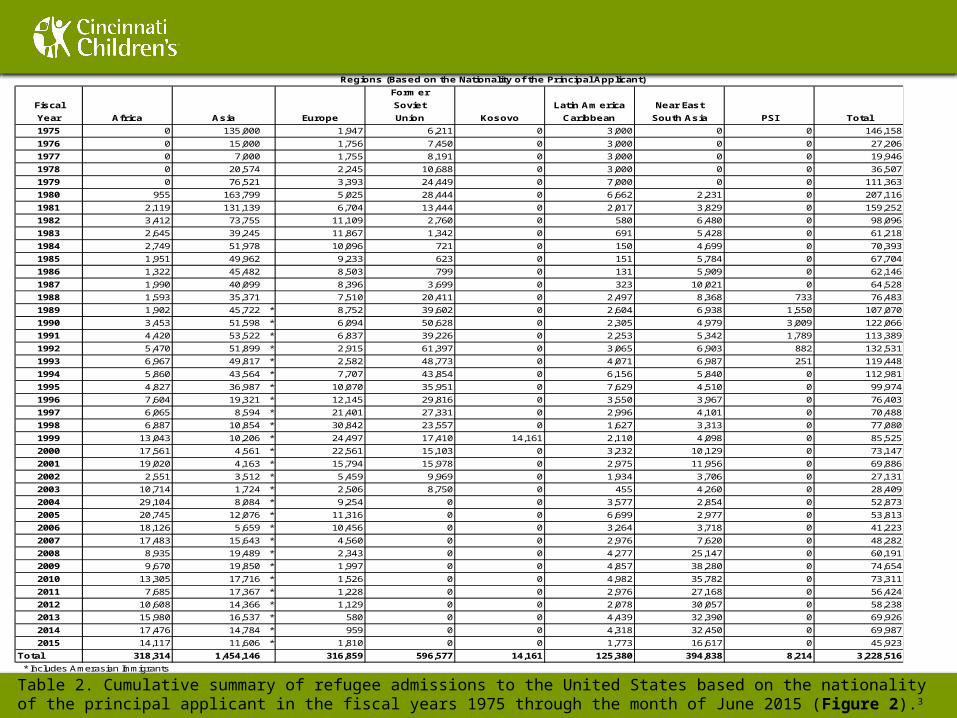
Table 2. Cumulative summary of refugee admissions to the United States based on the nationality of the principal applicant in the fiscal years 1975 through the month of June 2015 (Figure 2).3
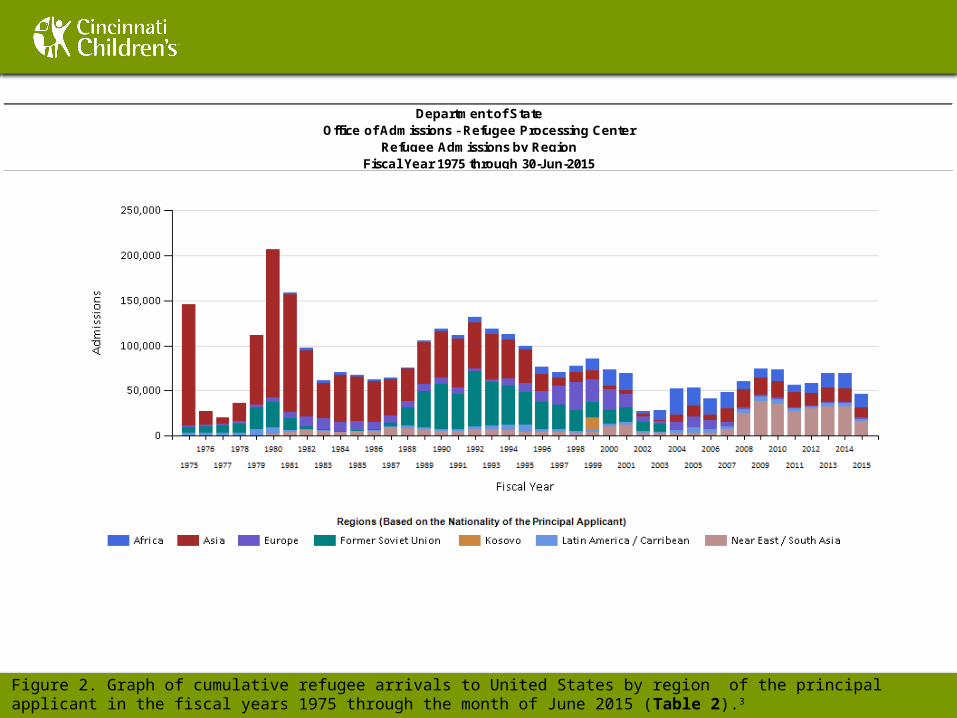
Department of StateOffice of Admissions - Refugee Processing Center
Refugee Admissions by RegionFiscal Year 1975 through 30-Jun-2015
Figure 2. Graph of cumulative refugee arrivals to United States by region of the principal applicant in the fiscal years 1975 through the month of June 2015 (Table 2).3

REFUGEE ARRIVALS BY MONTH
2015
Refugee FY Total
Admissions Admitted
Fiscal Year Ceiling to the U.S. OCT NOV DEC JAN FEB MAR APR MAY JUN JUL AUG SEP
FY 2005 70,000 53,813 3,000 4,835 3,537 2,701 3,124 3,621 2,919 3,494 4,997 5,730 4,799 11,056
FY 2006 70,000 41,223 1,009 4,528 3,926 3,409 3,415 3,780 2,325 2,835 3,577 3,052 3,801 5,566
FY 2007 70,000 48,282 1,677 3,338 2,777 2,387 2,065 2,846 2,060 2,867 4,519 6,201 6,251 11,294
FY 2008 80,000 60,191 1,919 2,704 2,640 3,321 3,640 4,622 4,226 5,335 6,836 7,844 7,152 9,952
FY 2009 80,000 74,654 3,294 4,123 4,389 5,405 5,598 6,892 7,001 7,255 8,163 6,499 6,985 9,050
FY 2010 80,000 73,311 5,212 5,717 6,166 5,407 6,740 6,588 5,769 6,378 6,783 5,805 5,507 7,239
FY 2011 80,000 56,424 4,764 5,571 4,811 5,385 5,149 2,034 2,190 3,254 4,674 5,855 6,408 6,329
FY 2012 76,000 58,238 3,552 3,304 3,324 3,897 4,504 3,255 4,345 5,339 5,243 6,229 6,989 8,257
FY 2013 70,000 69,926 5,722 6,940 5,572 4,218 5,626 6,164 5,535 5,611 5,870 5,771 5,549 7,348
FY 2014 70,000 69,987 1,810 6,580 5,984 6,006 6,545 5,885 4,786 5,271 7,762 7,856 5,635 5,867
FY 2015 70,000 45,923 6,352 5,694 5,161 5,596 3,914 4,786 4,641 3,858 5,921
Department of State
Bureau of Population, Refugees, and Migration
Office of Admissions - Refugee Processing Center
Fiscal Year 2015 as of 30-Jun-15
Admissions by Month
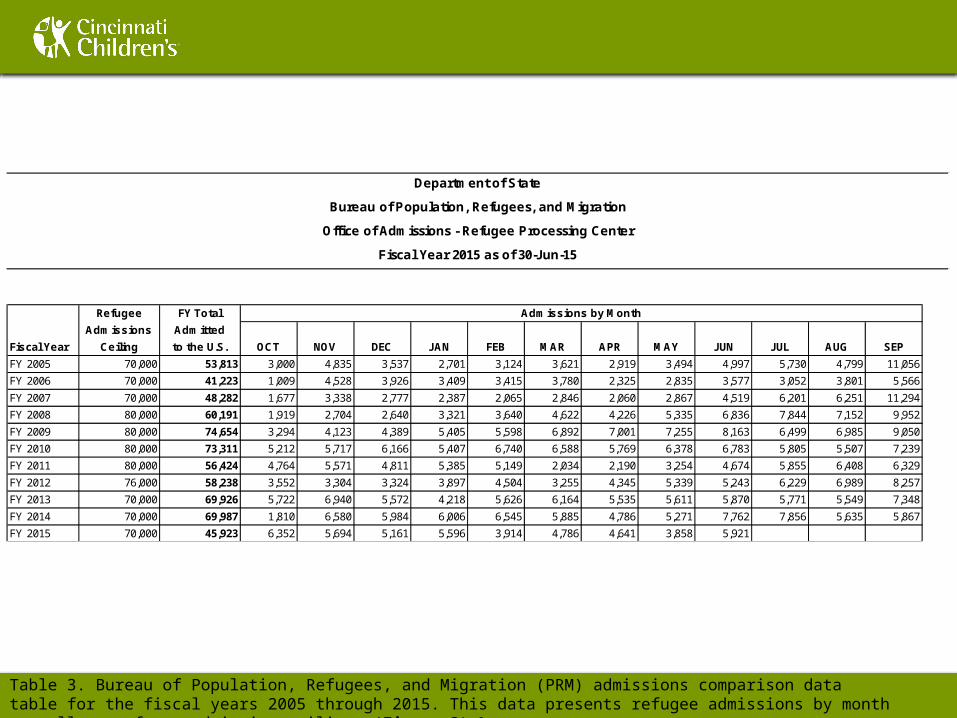
Table 3. Bureau of Population, Refugees, and Migration (PRM) admissions comparison data table for the fiscal years 2005 through 2015. This data presents refugee admissions by month as well as refugee admission ceilings (Figure 3).3
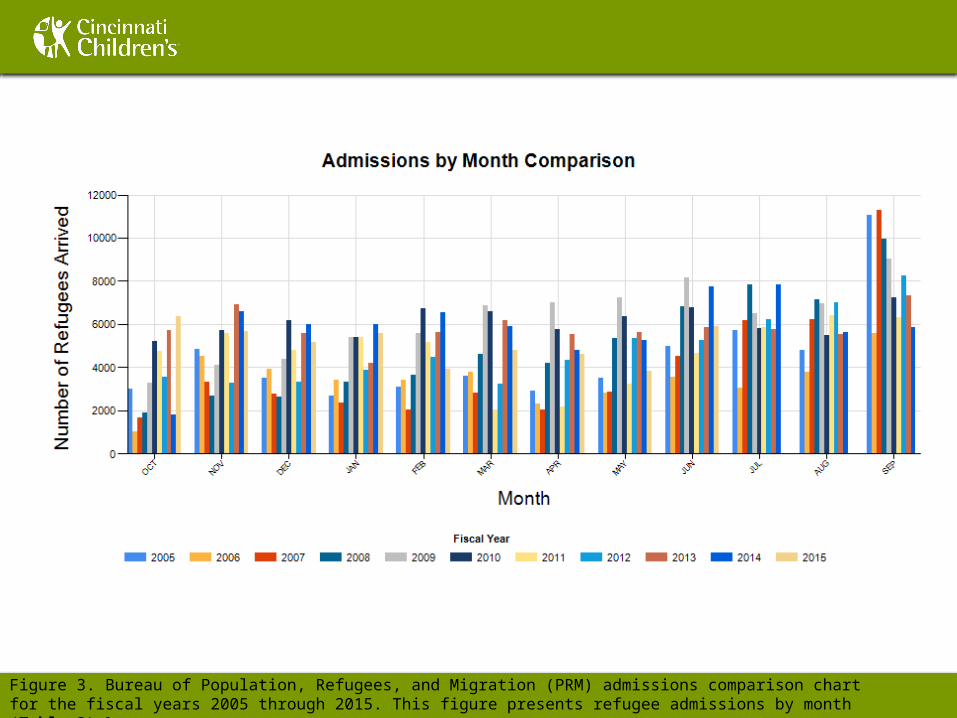
Figure 3. Bureau of Population, Refugees, and Migration (PRM) admissions comparison chart for the fiscal years 2005 through 2015. This figure presents refugee admissions by month (Table 3).3
REFUGEE ARRIVALS BY AGE AND GENDER
Fiscal Years 2011 to 2013
Characteristic 2013 2012 2011
Number Percent Number Percent Number Percent
AGE
Total………….......
0 to 17 years…….
18 to 24 years…...
25 to 34 years…...
35 to 44 years…...
45 to 54 years…...
55 to 64 years…...
65 years and over
69,909 100.0 58,179 100.0 56,384 100.0
23,647 33.8 18,876 32.4 19,232 34.1
10,399 14.9 9,700 16.7 9,588 17.0
15,328 21.9 13,491 23.2 1,1802 20.9
9,543 13.7 7,446 12.8 7,124 12.6
5,504 7.9 4,409 7.6 4,230 7.5
3,098 4.4 2,441 4.2 2,438 4.3
2,390 3.4 1,816 3.1 1,970 3.5
SEX
Total
Male
Female
69,909 100.0 58,179 100.0 56,384 100.0
37,792 54.1 31,380 53.9 29,436 52.2
32,117 45.9 26,799 46.1 26,948 47.8
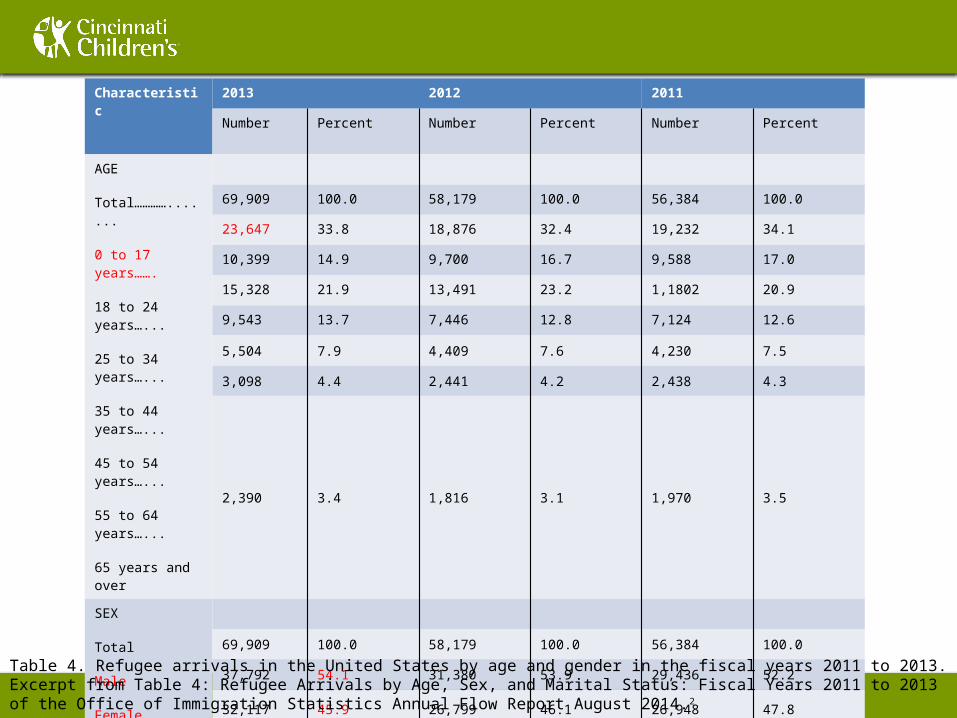
Table 4. Refugee arrivals in the United States by age and gender in the fiscal years 2011 to 2013. Excerpt from Table 4: Refugee Arrivals by Age, Sex, and Marital Status: Fiscal Years 2011 to 2013 of the Office of Immigration Statistics Annual Flow Report August 2014.2

REFUGEE ARRIVALS BY NATIONALITIES
October 2014 – July 2015
Number of Individuals Cumulative Total % of Total
PA Region Oct Nov Dec Jan Feb Mar Apr May Jun Jul Aug Sep Cases Inds Arrived Inds
Africa 1,872 1,721 1,578 1,265 1,094 1,321 1,381 1,602 2,283 1,283 0 0 5,773 15,400 31.35%
East Asia 1,248 1,301 1,167 1,438 1,326 1,357 1,254 1,030 1,485 793 0 0 5,113 12,399 25.24%
Europe 196 132 209 231 229 223 220 187 183 66 0 0 676 1,876 3.82%
Latin America/Caribbean 442 187 149 262 56 196 211 109 161 34 0 0 834 1,807 3.68%
Near East/South Asia 2,594 2,353 2,058 2,400 1,209 1,689 1,575 930 1,809 1,019 0 0 7,461 17,636 35.91%
Total 6,352 5,694 5,161 5,596 3,914 4,786 4,641 3,858 5,921 3,195 0 0 19,857 49,118 100.0%Please note Special Immigrant Visa (SIV) recipients who have elected and received U.S. Refugee Admissions Program (USRAP) Reception and Placement (R&P) benefits are not included in this report.
Department of State
Bureau of Population, Refugees, and Migration
Office of Admissions - Refugee Processing Center
Refugee Arrivals
by Region (based on Nationality of PA)
All Nationalities
Fiscal Year 2015 through July 17, 2015
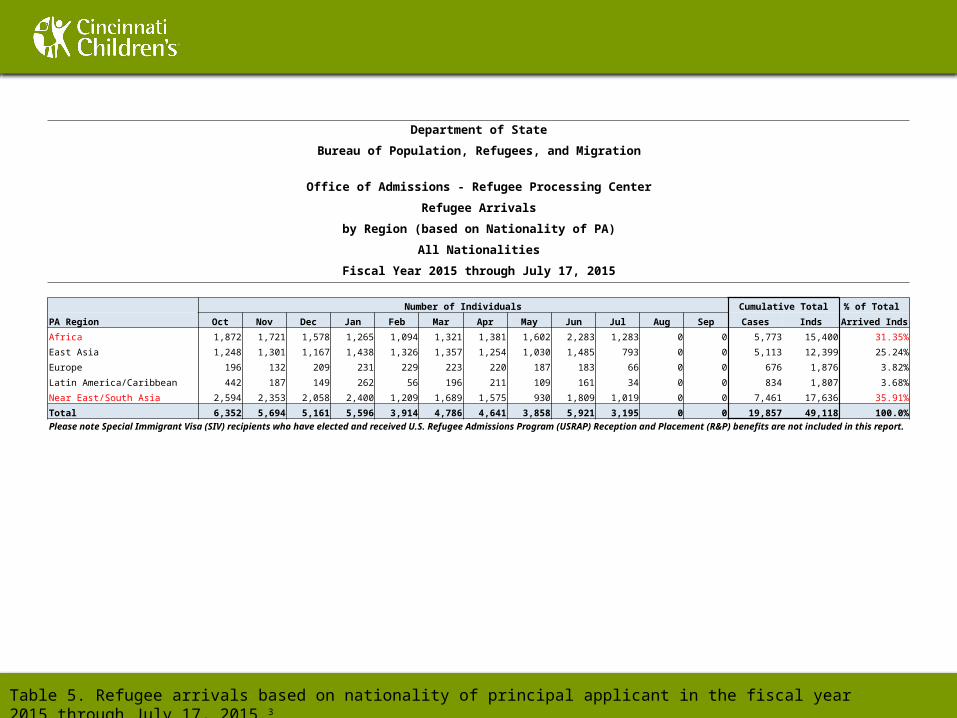
Table 5. Refugee arrivals based on nationality of principal applicant in the fiscal year 2015 through July 17, 2015. 3
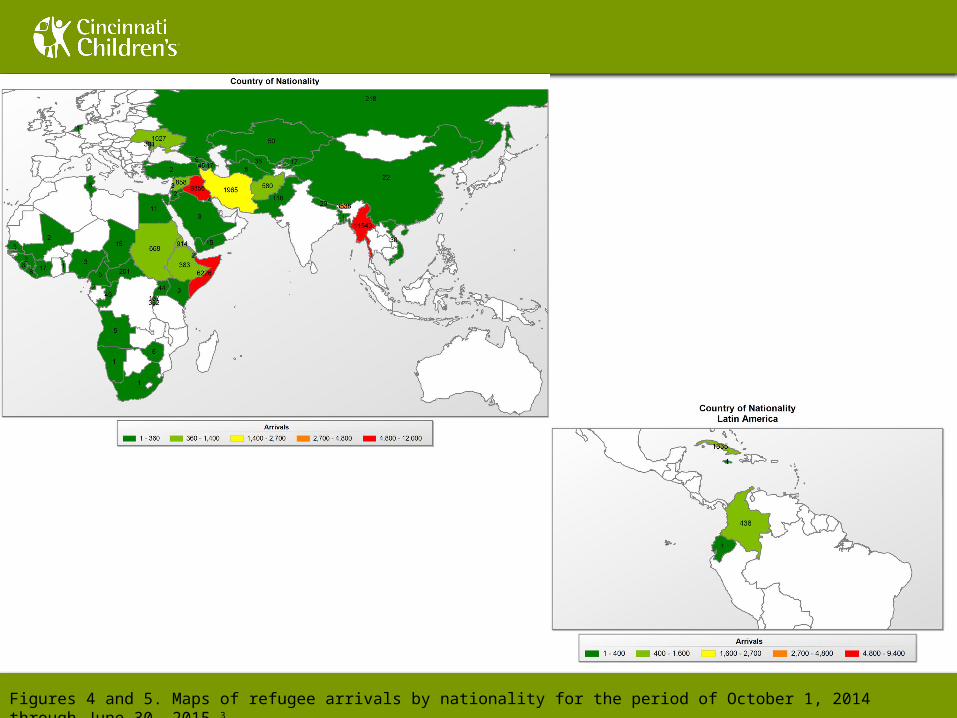
Figures 4 and 5. Maps of refugee arrivals by nationality for the period of October 1, 2014 through June 30, 2015. 3
REFUGEE ARRIVALS IN UNITED STATES BY NATIVE LANGUAGE
Fiscal Years 2008-2015
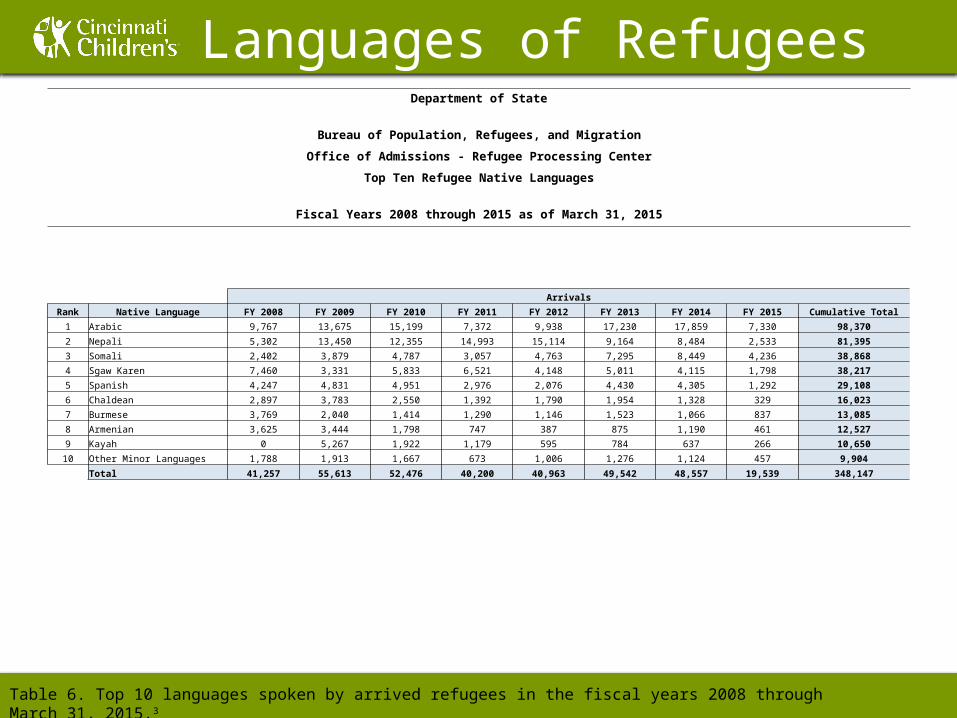
Languages of RefugeesDepartment of State
Bureau of Population, Refugees, and Migration
Office of Admissions - Refugee Processing Center
Top Ten Refugee Native Languages
Fiscal Years 2008 through 2015 as of March 31, 2015
Arrivals
Rank Native Language FY 2008 FY 2009 FY 2010 FY 2011 FY 2012 FY 2013 FY 2014 FY 2015 Cumulative Total
1 Arabic 9,767 13,675 15,199 7,372 9,938 17,230 17,859 7,330 98,370
2 Nepali 5,302 13,450 12,355 14,993 15,114 9,164 8,484 2,533 81,395
3 Somali 2,402 3,879 4,787 3,057 4,763 7,295 8,449 4,236 38,868
4 Sgaw Karen 7,460 3,331 5,833 6,521 4,148 5,011 4,115 1,798 38,217
5 Spanish 4,247 4,831 4,951 2,976 2,076 4,430 4,305 1,292 29,108
6 Chaldean 2,897 3,783 2,550 1,392 1,790 1,954 1,328 329 16,023
7 Burmese 3,769 2,040 1,414 1,290 1,146 1,523 1,066 837 13,085
8 Armenian 3,625 3,444 1,798 747 387 875 1,190 461 12,527
9 Kayah 0 5,267 1,922 1,179 595 784 637 266 10,650
10 Other Minor Languages 1,788 1,913 1,667 673 1,006 1,276 1,124 457 9,904
Total 41,257 55,613 52,476 40,200 40,963 49,542 48,557 19,539 348,147
Table 6. Top 10 languages spoken by arrived refugees in the fiscal years 2008 through March 31, 2015. 3
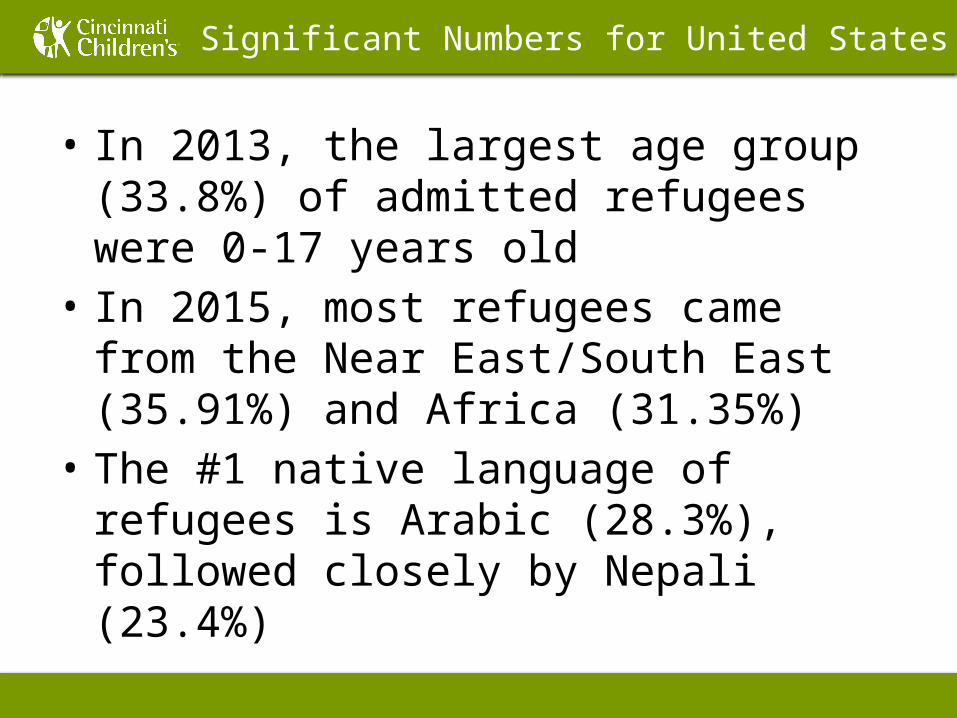
Significant Numbers for United States
• In 2013, the largest age group (33.8%) of admitted refugees were 0-17 years old
• In 2015, most refugees came from the Near East/South East (35.91%) and Africa (31.35%)
• The #1 native language of refugees is Arabic (28.3%), followed closely by Nepali (23.4%)
REFUGEE ARRIVALS BY STATE
Fiscal Years 2011-2015
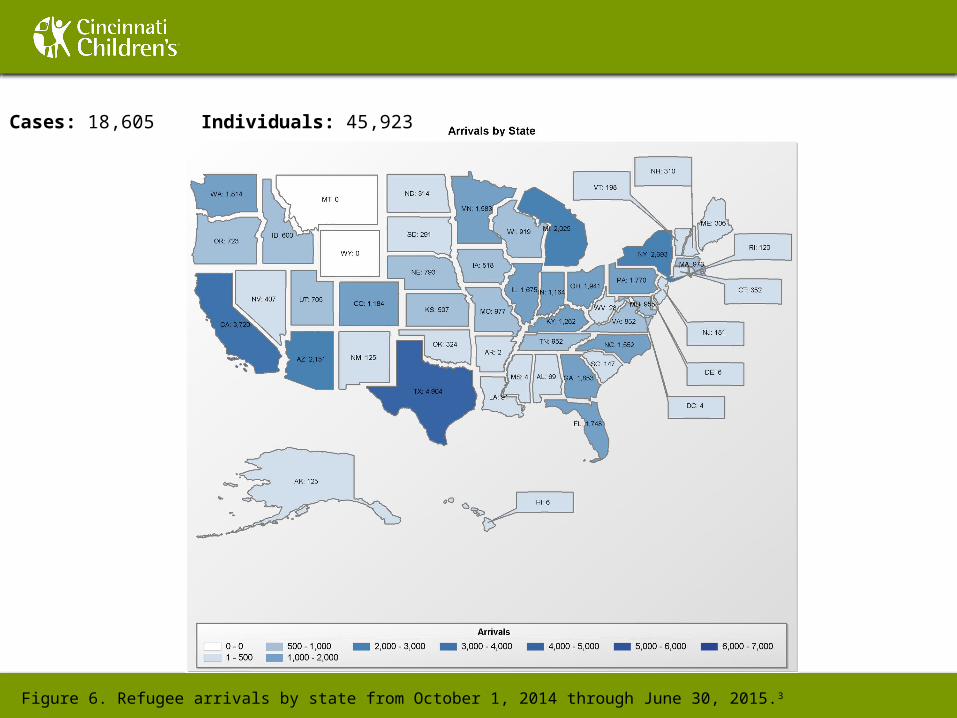
Cases: 18,605 Individuals: 45,923
Figure 6. Refugee arrivals by state from October 1, 2014 through June 30, 2015.3
Texas
Califo
rnia
Mich
igan
New Y
ork
Florida
Arizon
aO
hio
Geo
rgia
Penns
ylvan
ia
Illino
is
Oth
er0
5000
10000
15000
20000
25000
30000
35000
Refugee Arrivals by State of Residence: Fiscal Years 2011 to 2013
201320122011
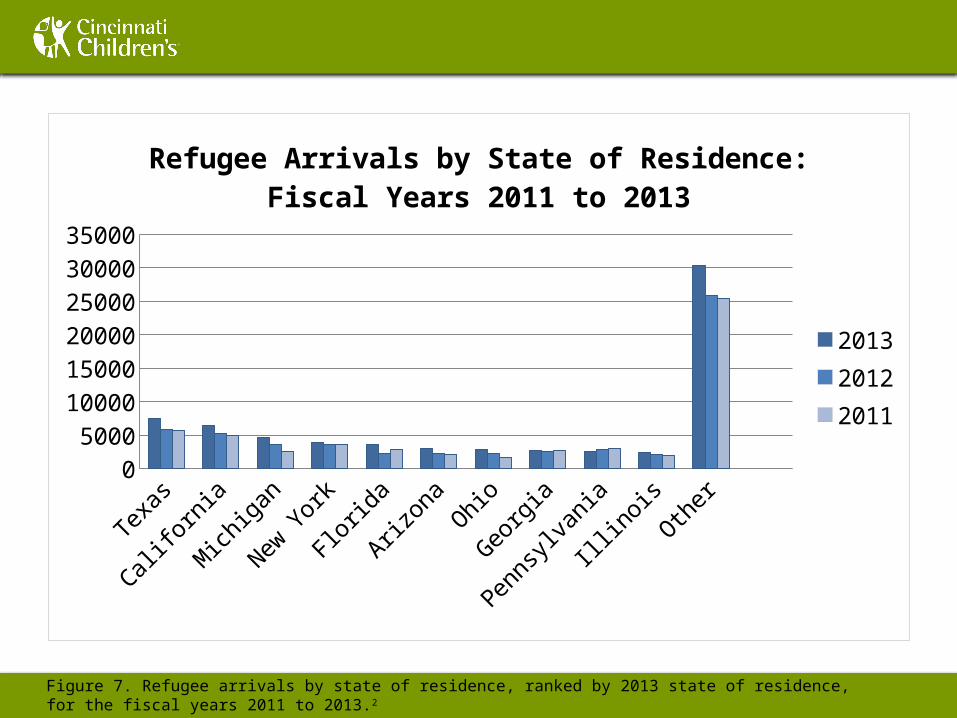
Figure 7. Refugee arrivals by state of residence, ranked by 2013 state of residence, for the fiscal years 2011 to 2013.2
Ohio
Grand Total
OHIO 1941
Total 45923
4%
96%
Grand Total
OHIOTotal
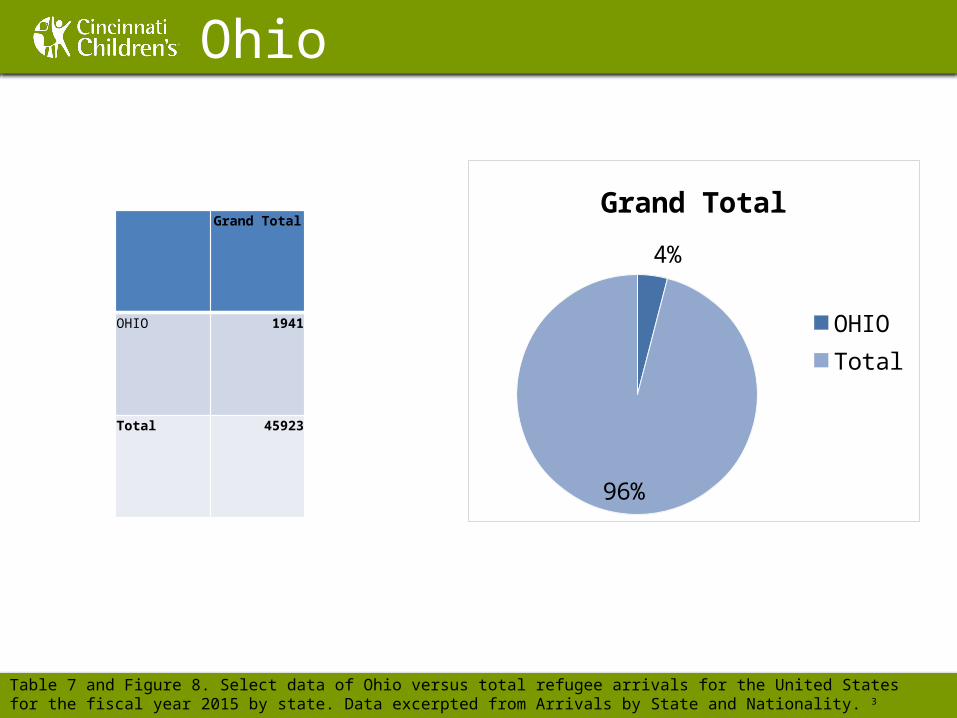
Table 7 and Figure 8. Select data of Ohio versus total refugee arrivals for the United States for the fiscal year 2015 by state. Data excerpted from Arrivals by State and Nationality. 3
REFUGEE ARRIVALS IN OHIO BY NATIONALITY, AGE, AND GENDER
October 1, 2014 – June 30/September 2015
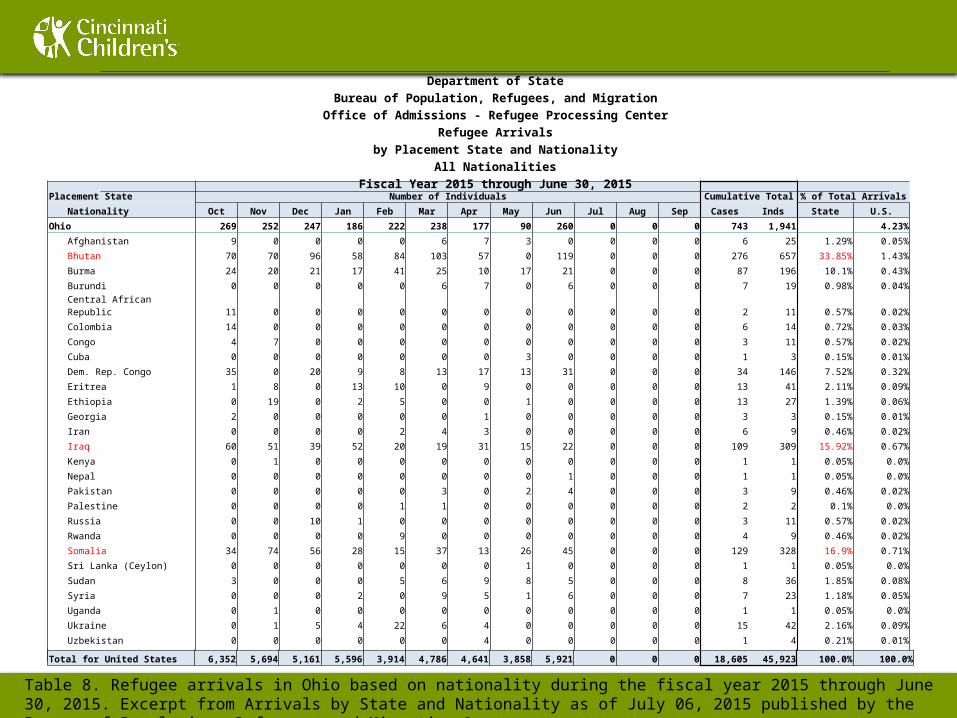
Ohio 269 252 247 186 222 238 177 90 260 0 0 0 743 1,941 4.23%
Afghanistan 9 0 0 0 0 6 7 3 0 0 0 0 6 25 1.29% 0.05%
Bhutan 70 70 96 58 84 103 57 0 119 0 0 0 276 657 33.85% 1.43%
Burma 24 20 21 17 41 25 10 17 21 0 0 0 87 196 10.1% 0.43%
Burundi 0 0 0 0 0 6 7 0 6 0 0 0 7 19 0.98% 0.04%
Central African Republic 11 0 0 0 0 0 0 0 0 0 0 0 2 11 0.57% 0.02%
Colombia 14 0 0 0 0 0 0 0 0 0 0 0 6 14 0.72% 0.03%
Congo 4 7 0 0 0 0 0 0 0 0 0 0 3 11 0.57% 0.02%
Cuba 0 0 0 0 0 0 0 3 0 0 0 0 1 3 0.15% 0.01%
Dem. Rep. Congo 35 0 20 9 8 13 17 13 31 0 0 0 34 146 7.52% 0.32%
Eritrea 1 8 0 13 10 0 9 0 0 0 0 0 13 41 2.11% 0.09%
Ethiopia 0 19 0 2 5 0 0 1 0 0 0 0 13 27 1.39% 0.06%
Georgia 2 0 0 0 0 0 1 0 0 0 0 0 3 3 0.15% 0.01%
Iran 0 0 0 0 2 4 3 0 0 0 0 0 6 9 0.46% 0.02%
Iraq 60 51 39 52 20 19 31 15 22 0 0 0 109 309 15.92% 0.67%
Kenya 0 1 0 0 0 0 0 0 0 0 0 0 1 1 0.05% 0.0%
Nepal 0 0 0 0 0 0 0 0 1 0 0 0 1 1 0.05% 0.0%
Pakistan 0 0 0 0 0 3 0 2 4 0 0 0 3 9 0.46% 0.02%
Palestine 0 0 0 0 1 1 0 0 0 0 0 0 2 2 0.1% 0.0%
Russia 0 0 10 1 0 0 0 0 0 0 0 0 3 11 0.57% 0.02%
Rwanda 0 0 0 0 9 0 0 0 0 0 0 0 4 9 0.46% 0.02%
Somalia 34 74 56 28 15 37 13 26 45 0 0 0 129 328 16.9% 0.71%
Sri Lanka (Ceylon) 0 0 0 0 0 0 0 1 0 0 0 0 1 1 0.05% 0.0%
Sudan 3 0 0 0 5 6 9 8 5 0 0 0 8 36 1.85% 0.08%
Syria 0 0 0 2 0 9 5 1 6 0 0 0 7 23 1.18% 0.05%
Uganda 0 1 0 0 0 0 0 0 0 0 0 0 1 1 0.05% 0.0%
Ukraine 0 1 5 4 22 6 4 0 0 0 0 0 15 42 2.16% 0.09%
Uzbekistan 0 0 0 0 0 0 4 0 0 0 0 0 1 4 0.21% 0.01%
Zimbabwe 2 0 0 0 0 0 0 0 0 0 0 0 1 2 0.1% 0.0%
Total for United States 6,352 5,694 5,161 5,596 3,914 4,786 4,641 3,858 5,921 0 0 0 18,605 45,923 100.0% 100.0%
Placement State Number of Individuals Cumulative Total % of Total Arrivals
Nationality Oct Nov Dec Jan Feb Mar Apr May Jun Jul Aug Sep Cases Inds State U.S.
Department of StateBureau of Population, Refugees, and Migration
Office of Admissions - Refugee Processing CenterRefugee Arrivals
by Placement State and NationalityAll Nationalities
Fiscal Year 2015 through June 30, 2015
Table 8. Refugee arrivals in Ohio based on nationality during the fiscal year 2015 through June 30, 2015. Excerpt from Arrivals by State and Nationality as of July 06, 2015 published by the Bureau of Population, Refugees, and Migration. 3
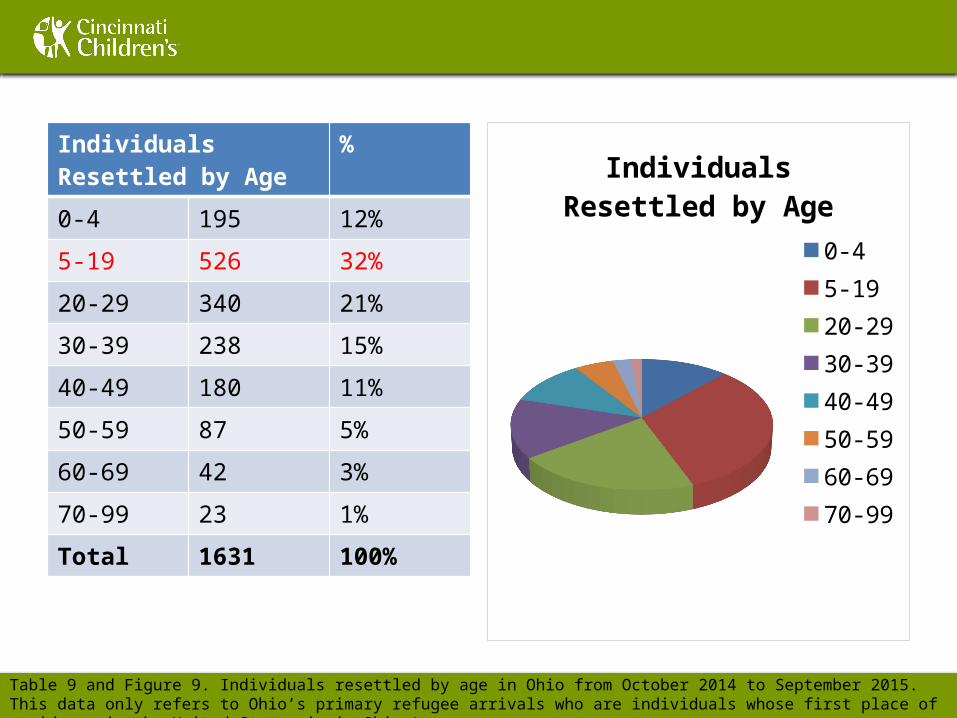
Individuals Resettled by Age
%
0-4 195 12%
5-19 526 32%
20-29 340 21%
30-39 238 15%
40-49 180 11%
50-59 87 5%
60-69 42 3%
70-99 23 1%
Total 1631 100%
Individuals Resettled by Age
0-45-1920-2930-3940-4950-5960-6970-99
Table 9 and Figure 9. Individuals resettled by age in Ohio from October 2014 to September 2015. This data only refers to Ohio’s primary refugee arrivals who are individuals whose first place of residence in the United States is in Ohio. 4
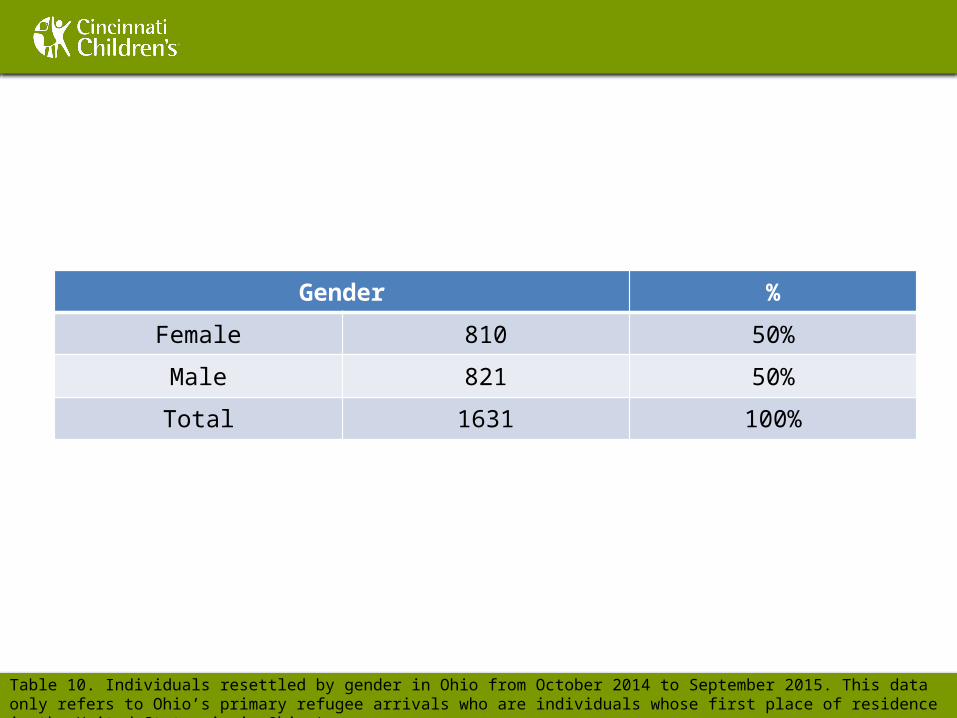
Gender %
Female 810 50%
Male 821 50%
Total 1631 100%
Table 10. Individuals resettled by gender in Ohio from October 2014 to September 2015. This data only refers to Ohio’s primary refugee arrivals who are individuals whose first place of residence in the United States is in Ohio. 4

REFUGEE ARRIVAL TRENDS IN HAMILTON COUNTY, OHIO
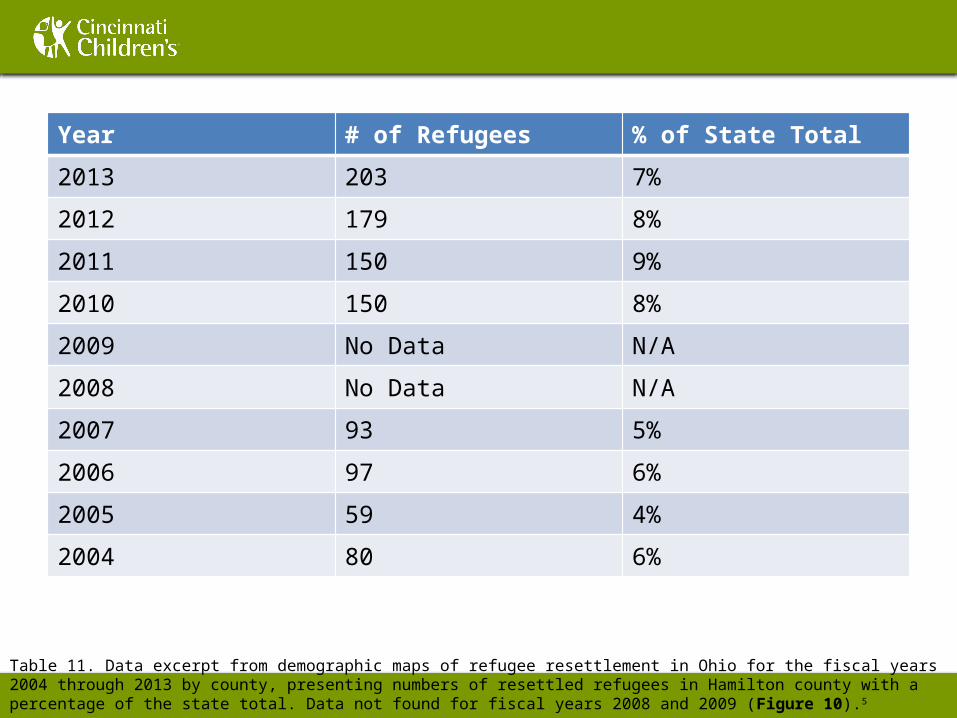
Year # of Refugees % of State Total
2013 203 7%
2012 179 8%
2011 150 9%
2010 150 8%
2009 No Data N/A
2008 No Data N/A
2007 93 5%
2006 97 6%
2005 59 4%
2004 80 6%
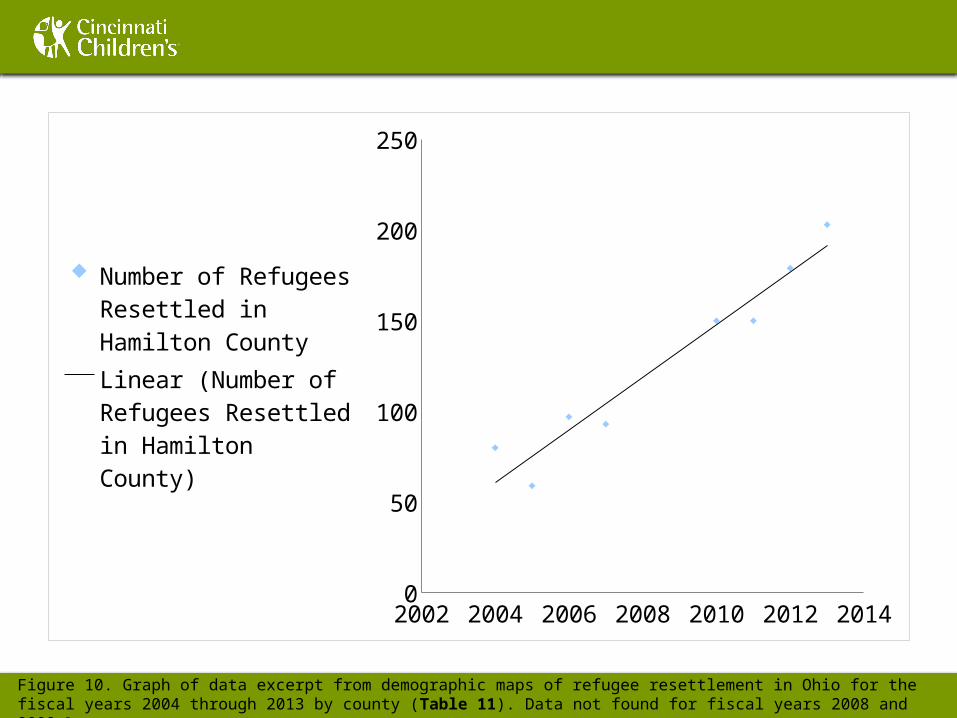
Table 11. Data excerpt from demographic maps of refugee resettlement in Ohio for the fiscal years 2004 through 2013 by county, presenting numbers of resettled refugees in Hamilton county with a percentage of the state total. Data not found for fiscal years 2008 and 2009 (Figure 10).5
2002 2004 2006 2008 2010 2012 20140
50
100
150
200
250
Number of Refugees Resettled in Hamilton CountyLinear (Number of Refugees Resettled in Hamilton County)
Figure 10. Graph of data excerpt from demographic maps of refugee resettlement in Ohio for the fiscal years 2004 through 2013 by county (Table 11). Data not found for fiscal years 2008 and 2009.5

REFUGEE ARRIVALS IN HAMILTON COUNTY, OHIO BY NATIONALITY AND AGE
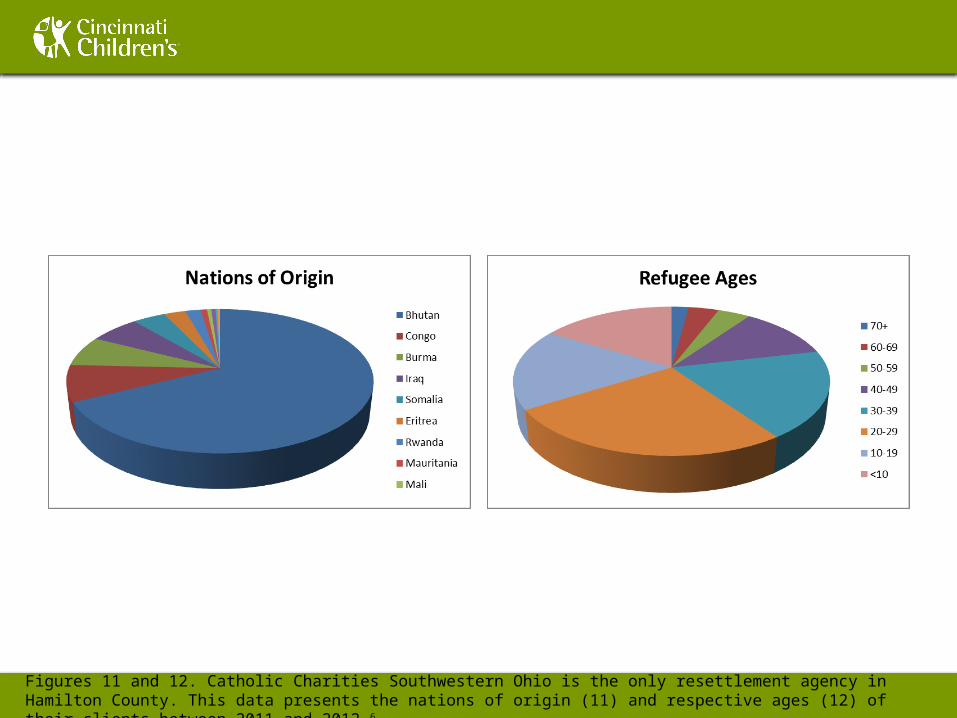
Figures 11 and 12. Catholic Charities Southwestern Ohio is the only resettlement agency in Hamilton County. This data presents the nations of origin (11) and respective ages (12) of their clients between 2011 and 2012. 6
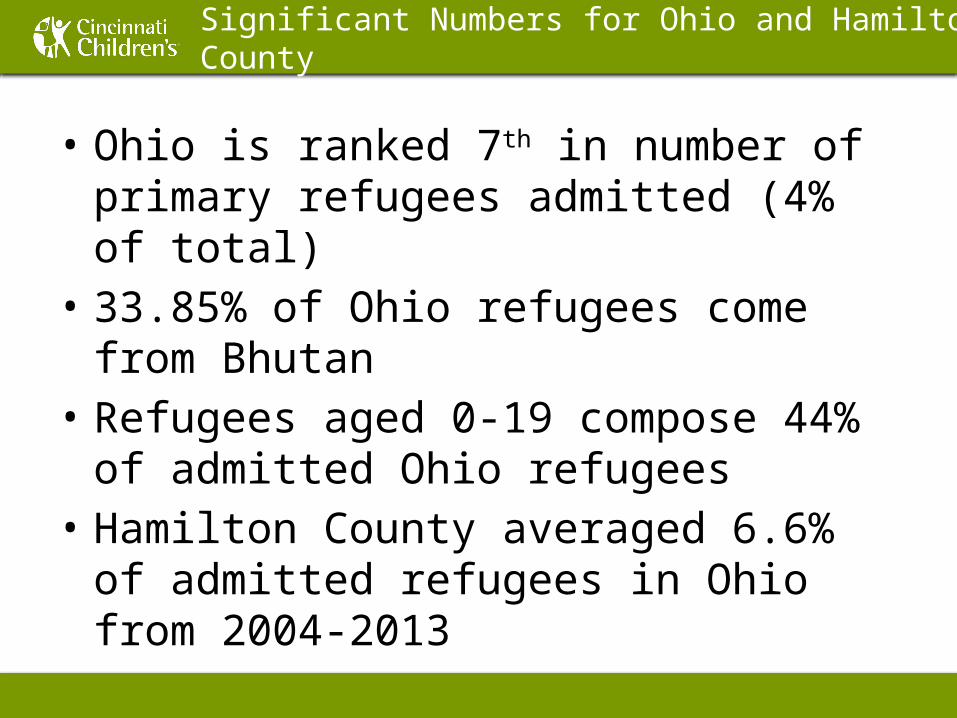
Significant Numbers for Ohio and Hamilton County
• Ohio is ranked 7th in number of primary refugees admitted (4% of total)
• 33.85% of Ohio refugees come from Bhutan
• Refugees aged 0-19 compose 44% of admitted Ohio refugees
• Hamilton County averaged 6.6% of admitted refugees in Ohio from 2004-2013
References
1. Immigration and Nationality Act (INA) §101(a)(42).
2. Martin, D., & Yankay, J. (2014). Refugees and Asylees: 2013. Annual Flow Report. Office of Immigration Statistics of the United States Department of Homeland Security.
3. Admissions & Arrivals Reports (2015). Refugee Processing Center. Retrieved July 23, 2015.
4. Ohio Resettlement Summary (2015). Data from the State Refugee Health Coordinator of Ohio, Office of Refugee Resettlement, An Office of the Administration for Children & Families from the United States Department of Health & Human Services.
5. Demographic Maps of Refugee Resettlement in Ohio (2004-2013). Department of Job and Family Services.
6. Catholic Charities Southwestern Ohio. (2014). Retrieved July 23, 2015.
Recommended