AUTHORS
Brenda Beitler Bowen � Department ofGeology and Geophysics, University of Utah,135 S. 1460 E., Salt Lake City, Utah 84112;present address: Department of Earth andAtmospheric Sciences, Purdue University, 550Stadium Mall Drive, West Lafayette, Indiana47907; [email protected]
Brenda Beitler Bowen is currently a postdoc-toral research associate at Central MichiganUniversity studying fluid-sediment interactionsin acid saline systems. She will begin as as-sistant professor of earth sciences at PurdueUniversity in the fall of 2007. She earned herB.S. and M.S. degrees at the University ofCalifornia, Santa Cruz, and her Ph.D. at theUniversity of Utah, studying the diagenesis ofthe Navajo Sandstone.
Brigette A. Martini � Amber Scientific Inc.,8 B St. #1, Ashland, Oregon 97520; presentaddress: Riverside Research Institute, 2681Commons Blvd., Beavercreek, Ohio 45431
Brigette A. Martini is an independent remotesensing and geological consultant in Ashland,Oregon, and a part-time researcher for River-side Research Institute. She received her B.S.degree (1997) from the University of Arizona,emphasizing structure and tectonics, and herPh.D. (2002) from the University of California,Santa Cruz, emphasizing volcano-tectonicsand hyperspectral imaging. She spent the lastthree years in Australia working for HyVistaCorporation as a hyperspectral analyst andgeologist.
Marjorie A. Chan � Department of Geologyand Geophysics, University of Utah, 135 S.1460 E., Salt Lake City, Utah 84112
Marjorie A. Chan is a professor of geologyand department chair at the University of Utah.She received her B.S. degree from the Universityof California, Davis, and her Ph.D. from theUniversity of Wisconsin, Madison. Her recentand current research focuses on Mesozoic sedi-mentology and stratigraphy on the ColoradoPlateau, with applications to eolian reservoirsand terrestrial iron oxide concretion analogs toMars.
Reflectance spectroscopicmapping of diageneticheterogeneities and fluid-flowpathways in the JurassicNavajo SandstoneBrenda Beitler Bowen, Brigette A. Martini,Marjorie A. Chan, and William T. Parry
ABSTRACT
Multiple episodes of fluids migrating through the Jurassic Navajo
Sandstone have resulted in abundant and spatially variable diage-
netic mineral changes. Depending on fluid chemistry, flow events
have produced or removed varying amounts of iron oxides, clays,
and carbonates with distinctive spectral reflectance signatures that
can be used to map spatial heterogeneities in diagenetic mineralogy
and paleofluid-migration pathways (including hydrocarbons and
groundwaters). Field and laboratory reflectance spectroscopy shows
that the common diagenetic minerals in the Navajo Sandstone have
diagnostic visible, near-infrared, and short-wave infrared spectral
characteristics in the 0.35–2.5-mm range. Comparisons of (1) geo-
chemical data, (2) in-situ reflectance spectroscopy, and (3) airborne
imaging spectroscopy for zones of variably altered Navajo Sandstone
in southernUtah show that themineralswithin alteration facies have
distinctive spectral signatures. Reflectance spectroscopic mapping
provides a method for evaluating the effects of diagenesis and fluids
in this well-exposed reservoir sandstone. Reservoir heterogeneity
in many eolian sandstones is largely controlled by diagenetic pro-
cesses that can be difficult to evaluate on outcrop to reservoir scales
(approximately tens to hundreds of meters to several kilometers).
Imaging spectroscopy allows for the evaluation of mineralogy varia-
tions on these scales. The patterns of authigenic iron oxide, clay, and
carbonate removal and precipitation trace the paths of different
episodes of fluid flow and sandstone alteration. Mineral variations
occur as kilometer-scale reaction fronts related to structural fluid
GEOHORIZONS
AAPG Bulletin, v. 91, no. 2 (February 2007), pp. 173–190 173
Copyright #2007. The American Association of Petroleum Geologists. All rights reserved.
Manuscript received November 22, 2005; provisional acceptance March 2, 2006; revised manuscriptreceived June 12, 2006; final acceptance August 22, 2006.
DOI:10.1306/08220605175
conduits and as 100-m (330-ft)-scale changes that follow stratigra-
phy. These spectroscopic techniques provide important tools for
reservoir evaluation, and the patterns observed serve as an analog
to understanding regional diagenetic patterns in other subsurface
eolian reservoirs.
INTRODUCTION
Understanding fluid movement through sedimentary reservoirs is
critical to predicting the distribution of natural resources. Themove-
ment of subsurface fluids controls the distribution and evolution of
valuable hydrocarbons, economicmineral deposits, and fresh water.
In eolian sandstones, reservoir quality (porosity and permeability)
and heterogeneity are largely controlled by fluid-related diagenetic
processes. Several potential methods exist for evaluating the history
of past fluid flow in sedimentary basins, including analyses of fluid
inclusions (Goldstein, 2001;Mark et al., 2005), numericalmodeling
(Bethke, 1989; Garven, 1995; Person et al., 1996), and geochem-
istry of diagenetic minerals and textures (Morad et al., 2000; Kyser
andHiatt, 2003; Boles et al., 2004; Eichhubl et al., 2004). Although
all of these methods provide valuable information about the his-
tory of subsurface fluid-sandstone interactions, they typically do
not allow for outcrop to basin-scale mapping of fluid-related alter-
ation. The use of reflectance spectroscopy in areas of exhumed
reservoir rocks can facilitate identification of alteration-related min-
erals and mapping of their spatial distribution on an outcrop scale
that is likely analogous to alteration patterns expected in similar
units in the subsurface.
TheNavajo Sandstone is one of the largest known erg (dune sea)
deposits on Earth (Blakey et al., 1988). With favorable reservoir
characteristics conducive to interstitial fluid flow, the sandstone has
had a complex history of water-rock interactions related to the mi-
gration of multiple generations of fluids with varying chemistry
approximately over the last 200 m.y. and continues to be an im-
portant reservoir for both hydrocarbons and water. For example,
the Covenant field in the Sevier overthrust belt in central Utah is a
major new discovery, with potential reserves that are estimated at
75–200 million bbl (Brown, 2005a). This new field could poten-
tially be analogous to the very successful Anschutz Ranch East field
in the Wyoming–Utah thrust belt, where the Nugget Sandstone,
the northward correlative unit of the Navajo Sandstone, has pro-
ducedmore than288MMBOand5.1 tcf of gas (Chidsey andMorgan,
2005). The continued recognition of the Navajo Sandstone and other
eolian units worldwide as productive reservoirs underscores the im-
portance of understanding fluid-flow pathways and the diagenetic his-
tory of this formation.
Chemical reactions in the Navajo Sandstone have resulted in
diageneticmineral facies that reflect the effects of fluid flow through
the sandstone. The characteristic types of chemical alteration in the
sandstone suggest hydrocarbon-induced reactions (e.g., Schumacher,
William T. Parry � Department of Geologyand Geophysics, University of Utah, 135 S.1460 E., Salt Lake City, Utah 84112
William T. Parry is a professor emeritus ofgeology and geophysics at the University ofUtah. He was formerly an associate professorof geosciences at Texas Tech University, Lubbock,Texas. He received his B.S. and M.S. degreesand his Ph.D. in geological engineering from theUniversity of Utah. His research interests aregeochemistry and mineralogy related to faultsand ore deposits.
ACKNOWLEDGEMENTS
Acknowledgment is made to the donors ofthe Petroleum Research Fund of the AmericanChemical Society and the Bureau of LandManagement–Grand Staircase-Escalante Na-tional Monument for support of this research(grants to M. A. Chan and W. T. Parry). Wethank Jens Ormo and Olga Prieto Ballesterosat the Centro de Astrobiologıa (Instituto Na-cional de Tecnica Aeroespacial) in Madrid,Spain, for the Micro-Fourier transform infraredanalyses. AAPG Bulletin editor Carol Christo-pher and reviewers F. G. Ethridge andS. C. Stover provided constructive commentsto improve the manuscript during revisions.
174 Geohorizons
1996). Based on the diagenetic facies that are observed,
the most common chemical reactions in the Navajo
Sandstone involve the following:
Reduction of iron bleaching the sandstone
Hematiteþ 3:75 Hþ þ 0:25 CH4
¼ 2:25 H2Oþ 2 Fe2þ þ 0:25 HCO�3 ð1Þ
Alteration of K-feldspar to kaolinite and illite
K� feldsparþ 0:5 H2OþHþ
¼ Kþ þ 0:5 Kaoliniteþ 2 Quartz ð2Þ
K� feldsparþ 0:67 Hþ ¼ 0:67 Kþ þ 0:33 Illiteþ 2 Quartz ð3Þ
Precipitation and dissolution of carbonate cement
CalciteþHþ ¼ Ca2þ þHCO�3 ð4Þ
Oxidation and precipitation of iron oxide from solution
0:25 O2 þ Fe2þ þ 1:5 H2O ¼ Goethiteþ 2 Hþ ð5Þ
2 Goethite ¼ HematiteþH2O ð6Þ
Reaction 1 involves methane as a proxy for a
hydrocarbon-reducing agent and reaction 5 involves
molecular oxygen as an oxidizing agent. Reactions 1–4
consume hydrogen ions, and reaction 5 produces the
hydrogen ion. The hydrogen ion produced in reaction 5
may drive reactions 2–4. Reactions 1 and 5 produce
the most easily recognized color changes in the Navajo
Sandstone, whereas formation of clay minerals in re-
actions 2 and 3 and precipitation or solution of calcite in
reaction 4 are traditionally more difficult to recognize.
Although the importance of these reactions and min-
erals in reservoir evolution has been recognized in pre-
vious studies, the lateral continuity of the resulting dia-
genetic mineral zones is not well constrained. Many of
the minerals involved in these reactions can be iden-
tified and evaluated in a spatial context with reflec-
tance and imaging spectroscopy.
Reflectance spectroscopy provides a nondestruc-
tive method for identifying and mapping physical
characteristics and composition of Earth and planetary
materials. Electromagnetic radiation reflected from
surface materials (versus being absorbed or transmit-
ted) can be measured across a range of wavelengths
in situ or with remote sensors. Characteristic absorption
features in the visible (VIS) (0.40–0.65 mm), near-
infrared (NIR) (0.65–2.00 mm), and short-wave in-
frared (SWIR) (2.00–2.50 mm) regions caused by elec-
tronic and vibrational processes can be diagnostic of
minerals, vegetation, water, and other surface features
(e.g., Goetz et al., 1985; Clark et al., 1990; Watson and
Knepper, 1994; Clark, 1999). A variety of satellite
and airborne sensors (i.e., Landsat, Advanced Space-
borne Thermal Emission and Reflection Radiometer
[ASTER], Airborne Visible-Infrared Imaging Spectrom-
eter [AVIRIS], HyMap, etc.) and user-friendly data anal-
yses packages (i.e., ENVI [Environment for Visualizing
Images]) have facilitated an increasing number of envi-
ronmental, Earth, and planetary studies that use reflec-
tance and imaging spectroscopy. Much of the published
geosciences-related reflectance spectroscopy appli-
cations involve spectra-lithologic mapping and explo-
ration for economic minerals, commonly within vol-
canic or metamorphic rocks (Hunt, 1979; Kruse et al.,
1999; Cudahy andOkada, 2000; Ellis and Scott, 2004),
mapping differences between geologic formations
(Clark et al., 1992; Rowan et al., 2004), alteration
related to hydrothermal systems (White et al., 2001;
Gupta, 2003; Hubbard et al., 2003; Martini, 2003a, b;
Van Ruitenbeek et al., 2005), andmodern hydrocarbon
seeps (Yang et al., 2000; van der Meer et al., 2002).
Studies of intraformational low-temperature diagene-
sis using reflectance and imaging spectroscopy are
less common (Merin and Segal, 1989; Beitler et al.,
2003), but can provide an important framework for
understanding reservoir heterogeneity and evaluating
fluid flow related to the prediction of natural resource
distribution.
PREVIOUS WORK
Previous work on red-bed diagenesis on regional (Chan
et al., 2000; Beitler et al., 2003) andmicroscopic (Parry
et al., 2004) scales has recognized bleaching patterns
indicative of reducing fluids in the Navajo Sandstone
in southern Utah. Relatively unaltered Navajo Sand-
stone is red because of very early thin hematite grain
coatings. In many areas, these hematite grain coatings
have been stripped away by advective reducing fluids
that have flushed through the sandstone, likely in asso-
ciation with the migration of hydrocarbon systems (in-
cluding methane-rich waters). Bleaching commonly pro-
duces secondary porosity reactions, thereby enhancing
future fluid flow and cement precipitation. Alteration
patterns are typically structurally influenced, which al-
lows for constraints on timing and controls of fluid flow
(Chan et al., 2000; Beitler et al., 2003; Parry et al., 2004).
This removed iron is eventually consolidated into diffuse
(fewpercent) and dense (<35%) zones of concretionary
Bowen et al. 175
hematite (Fe2O3) and/or goethite (FeO(OH)) min-
eralization along redox fronts, where reducing iron-
saturated waters mix with oxidizing meteoric ground-
water in the sandstone. In addition to being studied as
important evidence for past fluid mixing in the Navajo
Sandstone, these iron oxide concretions have been studied
extensively as an analog for similar spherical hematite
concretions discoveredonMars (Chan et al., 2004, 2005).
Authigenic minerals in the Navajo Sandstone typi-
cally comprise approximately 15–42% of the volume
of the whole rock (after Beitler et al., 2005). These
minerals are related to fluid-rock interactions that have
involved multiple episodes of diagenetic iron oxide, car-
bonate, and clay dissolution and precipitation. Similar
alteration features have been noted in other eolian units
in the region (Garden et al., 2001).
Several lines of evidence suggest that at least some
of the fluids that have passed through these prolific
reservoir rocks have been hydrocarbons. Hydrocarbons
are implicated because of (1) an extensive base of litera-
ture that shows bleached sandstones in several hydro-
carbon reservoirs (see Beitler et al., 2003), including
the White Rim Sandstone in the Tar Sand triangle in
Utah and field examples of bleached sandstone asso-
ciated with tar sands (Circle Cliffs uplift, Dubinky well
area in Canyonlands, e.g., Chan et al., 2000); (2) labo-
ratory experiments that show hydrocarbon bleaches
red sandstone (Surdam et al., 1993); (3) geochemical
modeling that shows methane reduces and mobilizes
iron (Parry et al., 2004); (4) bitumen veins on theMoab
fault in bleached rocks (Chan et al., 2000); (5) field and
geochemical studies byGarden et al. (2001) presenting
evidence for an exhumed hydrocarbon reservoir asso-
ciated with the Moab fault and bleached Navajo Sand-
stone; and (6) ongoing fluid-inclusion studies suggesting
the presence of methane within secondary inclusions
from veins associated with Navajo Sandstone defor-
mation (W. T. Parry, 2006, personal observations). On
a regional scale, the volume of the structural traps that
have undergone extensive red-bed bleaching suggests
that the Navajo Sandstone may have even been a super-
giant hydrocarbon reservoir, with a trap volume of
up to 2.2 � 103 km3 (5.3 � 102 mi3; 18.5 � 1012 bbl)
(Beitler et al., 2003).
OBJECTIVES
The purpose of this article is to apply the technique of
reflectance spectroscopy to better understand the dis-
tribution of diagenetic minerals and fluid-flow path-
ways in the Jurassic Navajo Sandstone in southern
Utah.Here,wepresent empirical relationships between
variations in Navajo Sandstone mineralogy and changes
in the spectral reflectance signatures.We use these data
as the basis for interpreting remotely acquired reflec-
tance spectroscopic data to investigate spatial variations
and in mineralogy. Because the sandstone is generally a
quartz arenite, mineralogy differences are patterns at-
tributed to variations in authigenic cements that reflect
the influence of paleofluids.
METHODS
Spatial variations in diagenetic mineralogy within the
Navajo Sandstone are evaluated using field and labo-
ratory reflectance and imaging spectroscopy. A total of
170 Navajo Sandstone samples from 17 different field
sites across southern Utah (Figure 1) were analyzed
with a handheld analytical spectral device (ASD) in the
field and/or in the laboratory. Surface outcrop samples
were collected, with the aim of representing all of the
commonly observed diagenetic facies and alteration
types within the Navajo Sandstone (e.g., Chan et al.,
2000; Beitler et al., 2003; Beitler et al., 2005). The
sandstone samples show a considerable range in color
and cementmineralogy, but the primary grain composi-
tions and textures were similar (mature quartz arenite),
as is common for the Navajo Sandstone (Figure 2). The
spectral data, covering the visible (VIS), near infra-
red (NIR), and short-wave infrared (SWIR)wavelength
range from 0.35 to 2.5 mm, are compared to mineral-
ogical data obtained from traditional geochemical tech-
niques (x-ray diffraction [XRD] and whole rock major
oxide analyses after Beitler et al., 2005; Bowen, 2005).
Spectra were measured in the field on 65 surfaces at
five field sites. The surfaces analyzed include unob-
structed exposures of variably altered Navajo Sandstone
and mixed surfaces with partial sandstone cover, in-
cluding non-Navajo Sandstone debris, eolium, lichen,
soil, and vegetation. Field measurements were con-
ducted on a range of sample areas (distances from 1 cm
[0.4 in.] to 3 m [10 ft] and a field of view of 1–4j) andwere obtained in natural sunlight in times with mini-
mal environmental moisture (i.e., dew, clouds, rain,
etc.). In the laboratory, 105 relatively flat but otherwise
unprepared whole rock samples of Navajo Sandstone
from multiple localities in southern Utah were illumi-
nated with artificial light (a broadband direct current
light source), and spectral reflectance was measured on
2151 channels. The area analyzed for eachmeasurement
176 Geohorizons
was about 4 cm2 (0.62 in.2). The ASD was optimized
to a standard white reference plate for each measure-
ment set. Nine representative red, bleached, and iron
oxide concretionary Navajo Sandstone samples from
three field sites were analyzed in the thermal-infrared
(TIR) region on a Fourier transform infrared Nexus
Nicolet spectrometer.
Airborne reflectance spectroscopic data were ac-
quired by a commercial sensor, HyMap (Integrated Spec-
tronics, Sydney, Australia), on September 26, 2004,
over areaswe selectedwithinGrand Staircase-Escalante
National Monument in southern Utah (Figure 1). Hy-
Map is a high-resolution airborne imaging spectrom-
eter with a high signal-to-noise ratio (>800:1) for
wavelengths from 0.45 to 2.50 mm in 126 separate but
contiguous spectral bands with bandwidths of 13–
17 nm (Cocks et al., 1998).The flight pathswere chosen
to cover well-exposed zones of Navajo Sandstone with
apparent alteration. Each pixel of HyMap data has a
per-pixel spatial resolution of approximately 16 m2
(172 ft2) (Landsat satellite data has, for comparison, a
per-pixel resolution of 900 m2 [9687 ft2]). These data
were preprocessed to correct for atmospheric and illu-
mination effects by calibration from radiance at sensor
to apparent surface reflectance data via an empirical
atmosphericmodel. Bands that coverwavelengthswith
known water-dominated atmospheric absorption from
approximately 1.28 to 1.48 and about 1.76 to 2.03 mmwere removed for subsequent analyses.
The increased dimensionality of hyperspectral data
(such as HyMap with 126 spectral bands) over multi-
spectral data (such as Landsat with 7 spectral bands)
affords scientists the unparalleled ability to absolutely
identify and map most mineral assemblages (instead
of simple discrimination between different groups as
is possible with multispectral systems), but the many
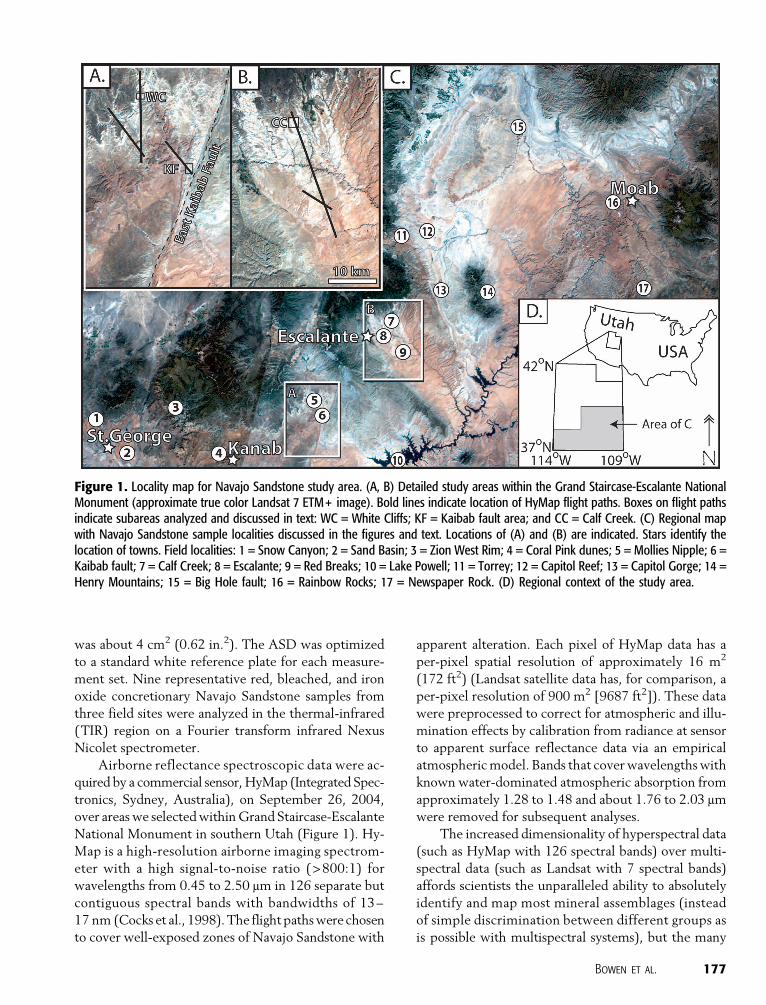
Figure 1. Locality map for Navajo Sandstone study area. (A, B) Detailed study areas within the Grand Staircase-Escalante NationalMonument (approximate true color Landsat 7 ETM+ image). Bold lines indicate location of HyMap flight paths. Boxes on flight pathsindicate subareas analyzed and discussed in text: WC = White Cliffs; KF = Kaibab fault area; and CC = Calf Creek. (C) Regional mapwith Navajo Sandstone sample localities discussed in the figures and text. Locations of (A) and (B) are indicated. Stars identify thelocation of towns. Field localities: 1 = Snow Canyon; 2 = Sand Basin; 3 = Zion West Rim; 4 = Coral Pink dunes; 5 = Mollies Nipple; 6 =Kaibab fault; 7 = Calf Creek; 8 = Escalante; 9 = Red Breaks; 10 = Lake Powell; 11 = Torrey; 12 = Capitol Reef; 13 = Capitol Gorge; 14 =Henry Mountains; 15 = Big Hole fault; 16 = Rainbow Rocks; 17 = Newspaper Rock. (D) Regional context of the study area.
Bowen et al. 177
bands and huge volumes of data also demand different
ways of processing to ensure that analysis is efficient.
Unique spectral end members of Navajo Sandstone
alteration groups were identified by analysis of lab-,
field-, and airborne-derived spectral data and compar-
ison with the U.S. Geological Survey spectral library
(e.g., Clark et al., 2003). Spectral end members were
extracted from the airborne data via two methods:
visual variability-based hand-picking and automated
techniques within ENVI. The fact that mineral chem-
istry in this particular environment is so closely related
to colors revealed in the VIS spectrum was leveraged
using that roughest of spectrometers, the human eye, to
handpick many hundreds of spectra visually related to
specific colors within the sandstone. These hundreds
were subsequently reduced to representative average
spectra for each group.
The airborne spectral data were evaluated using
several algorithms within ENVI, including matched
filter (MF) (Harsanyi and Chang, 1994), spectral angle
mapping (Kruse et al., 1993), minimum noise fraction
(MNF) transformations (Green et al., 1988; Boardman
and Kruse, 1994), a pixel purity index (PPI) (Board-
man et al., 1995), and n-dimensional algorithms (nD)
(Boardman, 1993; Boardman et al., 1995). The MF is a
partial unmixing algorithm used to map end-member
distributions via suppression of nonmatching, back-
ground materials that do not resemble the given user-
definedendmembers (in this case, those spectra extracted
from the spectral imagery by hand and via automated
algorithms). Spectral angle mapping is used to iden-
tify pixels that have spectral signatures similar to the
defined end members (e.g., all band angles fall within
0.1 radians of a defined end-member class) (Yuhas et al.,
1992).AnMNF transformation is a principal component-
based statistical algorithm that enhances the inherent
variability within a data set. The PPI and nD algorithms
comprise a suite of analyses directed at constraining
and minimizing spectral variability, reducing overall
spectral signature volume, promoting purity, and isolat-
ing those pixels containing the least mixed, most pure
spectral signatures.
RESULTS
Evaluating Variations in Navajo Sandstone Mineralogy withReflectance Spectroscopy
The common types of fluid-flow–related diagenetic
alteration within the Navajo Sandstone should, in the-
ory, be identifiable with VIS, NIR, and SWIR spectral
reflectance data (Figure 3A). Figure 3 illustrates the
U.S.Geological Survey spectral library signatures of the
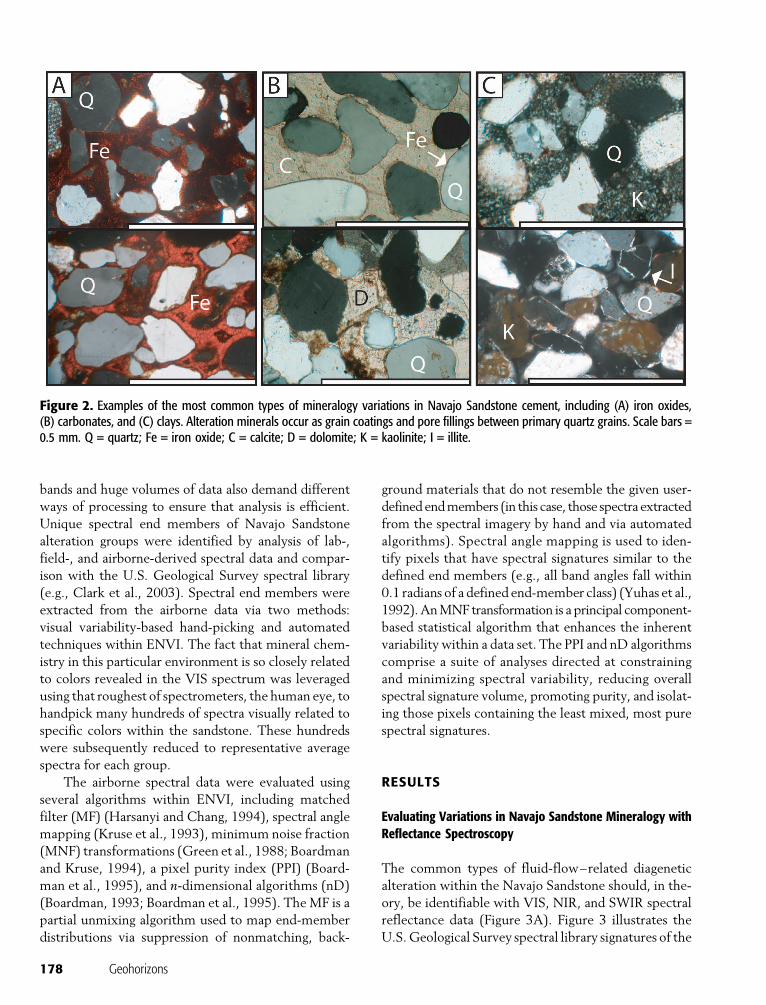
Figure 2. Examples of the most common types of mineralogy variations in Navajo Sandstone cement, including (A) iron oxides,(B) carbonates, and (C) clays. Alteration minerals occur as grain coatings and pore fillings between primary quartz grains. Scale bars =0.5 mm. Q = quartz; Fe = iron oxide; C = calcite; D = dolomite; K = kaolinite; I = illite.
178 Geohorizons
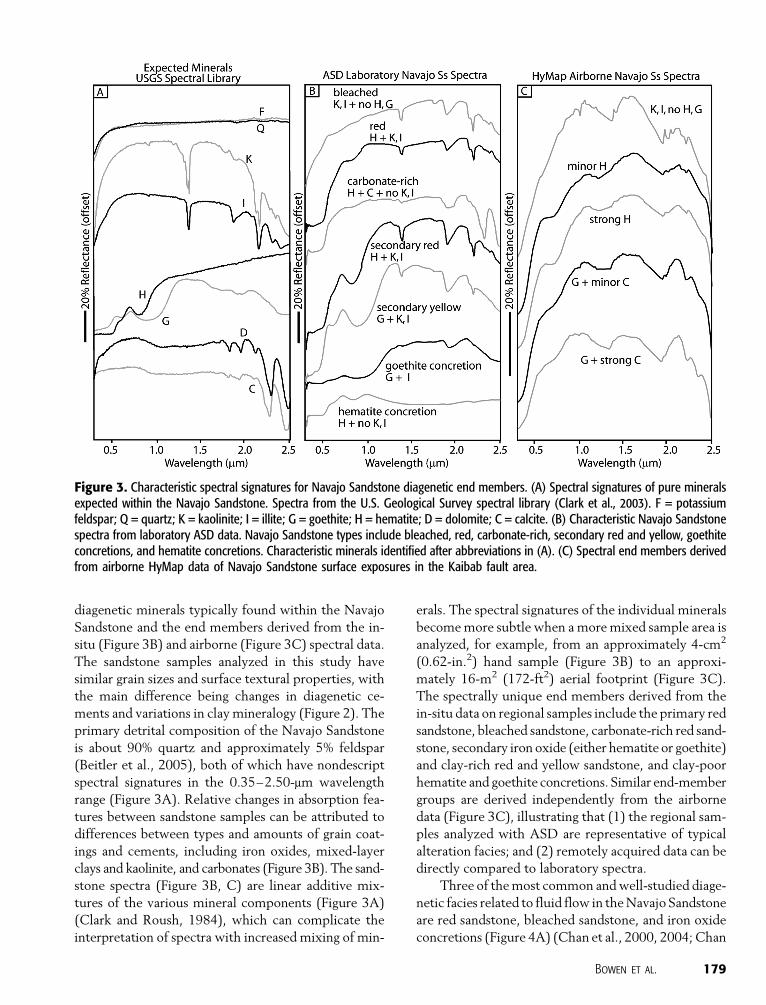
diagenetic minerals typically found within the Navajo
Sandstone and the end members derived from the in-
situ (Figure 3B) and airborne (Figure 3C) spectral data.
The sandstone samples analyzed in this study have
similar grain sizes and surface textural properties, with
the main difference being changes in diagenetic ce-
ments and variations in clay mineralogy (Figure 2). The
primary detrital composition of the Navajo Sandstone
is about 90% quartz and approximately 5% feldspar
(Beitler et al., 2005), both of which have nondescript
spectral signatures in the 0.35–2.50-mm wavelength
range (Figure 3A). Relative changes in absorption fea-
tures between sandstone samples can be attributed to
differences between types and amounts of grain coat-
ings and cements, including iron oxides, mixed-layer
clays and kaolinite, and carbonates (Figure 3B). The sand-
stone spectra (Figure 3B, C) are linear additive mix-
tures of the various mineral components (Figure 3A)
(Clark and Roush, 1984), which can complicate the
interpretation of spectra with increased mixing of min-
erals. The spectral signatures of the individual minerals
becomemore subtle when a moremixed sample area is
analyzed, for example, from an approximately 4-cm2
(0.62-in.2) hand sample (Figure 3B) to an approxi-
mately 16-m2 (172-ft2) aerial footprint (Figure 3C).
The spectrally unique end members derived from the
in-situ data on regional samples include the primary red
sandstone, bleached sandstone, carbonate-rich red sand-
stone, secondary iron oxide (either hematite or goethite)
and clay-rich red and yellow sandstone, and clay-poor
hematite and goethite concretions. Similar end-member
groups are derived independently from the airborne
data (Figure 3C), illustrating that (1) the regional sam-
ples analyzed with ASD are representative of typical
alteration facies; and (2) remotely acquired data can be
directly compared to laboratory spectra.
Three of themost common andwell-studied diage-
netic facies related to fluid flow in theNavajo Sandstone
are red sandstone, bleached sandstone, and iron oxide
concretions (Figure 4A) (Chan et al., 2000, 2004; Chan
Figure 3. Characteristic spectral signatures for Navajo Sandstone diagenetic end members. (A) Spectral signatures of pure mineralsexpected within the Navajo Sandstone. Spectra from the U.S. Geological Survey spectral library (Clark et al., 2003). F = potassiumfeldspar; Q = quartz; K = kaolinite; I = illite; G = goethite; H = hematite; D = dolomite; C = calcite. (B) Characteristic Navajo Sandstonespectra from laboratory ASD data. Navajo Sandstone types include bleached, red, carbonate-rich, secondary red and yellow, goethiteconcretions, and hematite concretions. Characteristic minerals identified after abbreviations in (A). (C) Spectral end members derivedfrom airborne HyMap data of Navajo Sandstone surface exposures in the Kaibab fault area.
Bowen et al. 179
and Parry, 2002; Bowen, 2005). The spectra of these
alteration types are characterized by absorption changes
in the VIS-NIR range from the amount and type of iron
oxide, and in the SWIR range related to the amount and
type of carbonates and clays. Analyses in the thermal
wavelength range (TIR) show that within these higher
wavelength ranges, which are commonly very useful in
identifying mineralogy and rock types, the sandstone
alteration is not as distinctly different as is apparent in
the VIS-NIR-SWIR region (Figure 4B, C). In the TIR
region, the spectra are generally overwhelmed by the in-
fluence of the quartz grains, and the signatures of the
diagenetic components are lost, but there are subtle
features that indicate the goethite component of the
concretions (Figure 4B). The mineral variations that oc-
cur within the Navajo Sandstone are more easily iden-
tifiable with spectral characteristics in the VIS-NIR-
SWIR range.
Red and bleached sandstone spectra have some-
what similar reflectance patterns, but the red spectra
are characterized by a steep drop at 0.60 mm toward the
VIS wavelength range and then flatten (labeled ‘‘b’’ in
Figure 4A). By comparison, the bleached spectra do not
flatten out at 0.53 mm (labeled ‘‘a’’ in Figure 4A). This
steep reflectance change is caused by charge transfer
absorption in iron-bearing minerals and gives iron-rich
red beds their pigment (Morris, 1985; Vincent, 1997;
Clark, 1999). Within the VIS and NIR iron absorption
range (0.75–1.30 mm), bleached rocks lack any absorp-
tion feature, whereas red rocks exclusively show a hema-
tite absorption feature at about 0.85 mm, and concretions
show absorption features indicative of either or both
hematite and goethite in that range (Figure 4A). For the
bleached samples (Figure 5), no iron feature is detected
in the XRD or spectral patterns, as is expected with a
total iron oxide content that ranges from 0.08 to 0.13%
of thewhole rockweight. Some of the trace amounts of
iron measured in whole rock analysis in the bleached
samples may be present as reduced pyrite (Parry et al.,
2004), which lacks any sort of absorption feature in this
wavelength range.
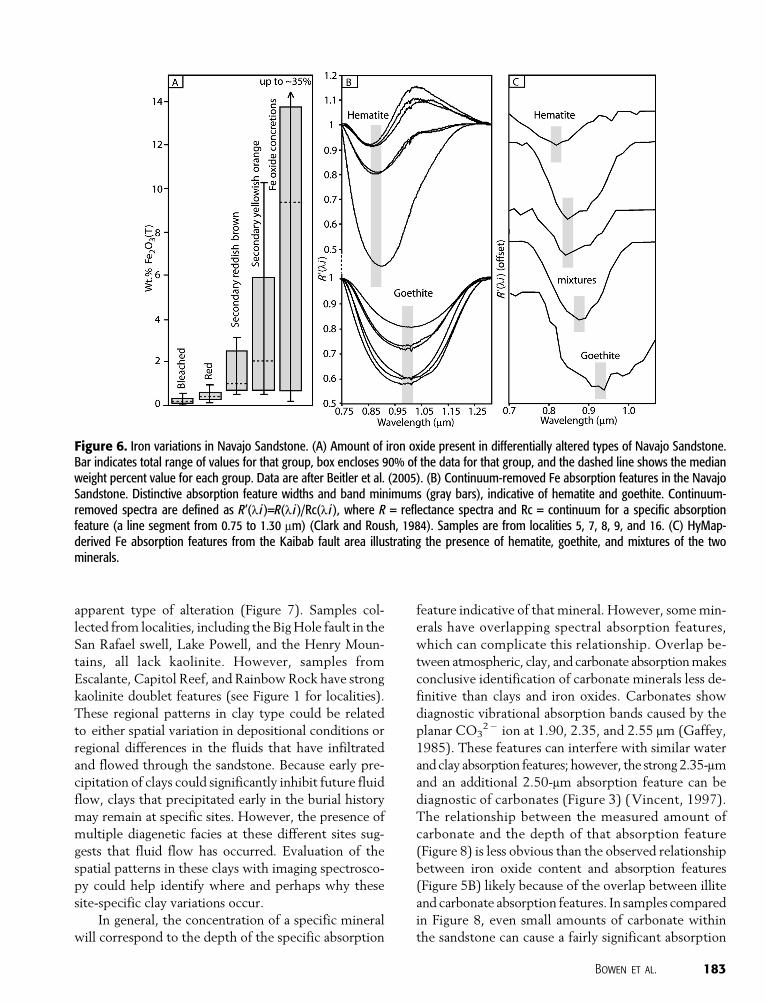
Iron oxides are commonly some of themostmobile
and spatially variable minerals within the Navajo Sand-
stone (Figure 6A) and also have strong diagnostic spec-
tral features at about 0.90 mm(Morris, 1985; Townsend,
1987). Early- and late-stage diagenetic iron oxides com-
prise greater than 90% (volume) of the authigenic
minerals in the Navajo Sandstone (after Beitler et al.,
2005). The iron oxides have been identified as both
goethite and hematite with XRD and petrography;
however, both of these methods can be ambiguous for
distinguishing between the different types of iron oxides,
and reflectance spectroscopy provides the easiest dis-
crimination between types (Deaton and Balsam, 1991;
Ji et al., 2002). Hematite has a diagnostic absorption
feature at 0.86 mm,whereas goethite ismuchmore broad
and located closer to 0.93 mm(Deaton andBalsam, 1991)
(Figure 6B, C). In general, the amount of iron in the
sample correlates with the depth of the iron oxide ab-
sorption feature (Figure 5). The lack of absorption fea-
tures at 1.40 or 1.90 mm for some of the iron concretions
in theASDdata indicates that these are not hydrous iron
oxides (i.e., limonite) (Figure 4A) (Gupta, 2003); how-
ever, this feature cannot be identified in the airborne
data because of the effects of atmospheric interference.
Both hematite and goethite are clearly identified in
specific concretion samples (Figure 6B), and both iron
oxide minerals, and apparent mixing between the two,
are seen in the airborne spectral data (Figure 6C). This
progression in iron chemistry from more goethite- to
hematite-rich sandstone also corresponds to a change
in the amount of carbonate and clay. The areas with
higher amounts of goethite also have increased amounts
of carbonate, and in the areaswithmore hematite, there
is less carbonate. In addition, as the sandstone transi-
tions from hematite toward goethite compositions, a
single 2.21- or 2.23-mm clay feature appears, and the
typical kaolinite doublet disappears. A separation be-
tween iron oxide and carbonate cements is a common
feature observed in the Navajo Sandstone and is ex-
pected because iron oxidation produces acidity that
could dissolve associated carbonates (Beitler et al., 2005).
The relationships between iron oxides, clays, and car-
bonate are useful in interpreting fluid chemistry and
suggest that the clay and carbonate in these rocks are
diagenetic and related to fluid flow and not detrital.
Red and bleached Navajo Sandstone samples have
significantly stronger absorption features indicative of
clay and carbonate than the iron-rich samples (Figures 3,
4A, 5). Within the wavelengths being studied, clay
absorption features can interfere with similar features
related to water molecule absorption bands located at
approximately 1.40 and 1.90 mm (Clark et al., 1990;
Clark, 1999) (atmospheric absorption range discussed
in the methods section). Minerals with a 1.90-mm ab-
sorption feature contain water, but a spectrum with
a 1.40-mm feature but no 1.90-mm feature indicates
OH� and not water. Fortunately, another diagnos-
tic clay absorption feature occurs between 2.10 and
2.40 mm caused by the effects of OH� in combination
with aluminum and magnesium (Al–OH and Mg–OH)
(Vincent, 1997). If both Al–OH and Mg–OH are
180 Geohorizons
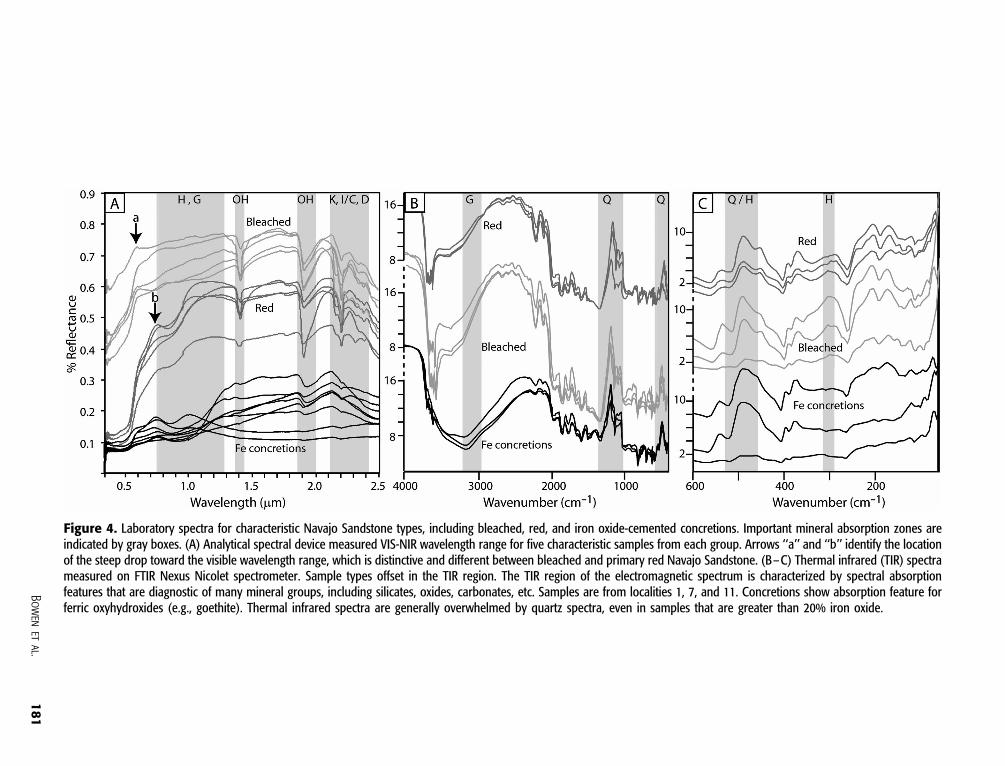
Figure 4. Laboratory spectra for characteristic Navajo Sandstone types, including bleached, red, and iron oxide-cemented concretions. Important mineral absorption zones areindicated by gray boxes. (A) Analytical spectral device measured VIS-NIR wavelength range for five characteristic samples from each group. Arrows ‘‘a’’ and ‘‘b’’ identify the locationof the steep drop toward the visible wavelength range, which is distinctive and different between bleached and primary red Navajo Sandstone. (B–C) Thermal infrared (TIR) spectrameasured on FTIR Nexus Nicolet spectrometer. Sample types offset in the TIR region. The TIR region of the electromagnetic spectrum is characterized by spectral absorptionfeatures that are diagnostic of many mineral groups, including silicates, oxides, carbonates, etc. Samples are from localities 1, 7, and 11. Concretions show absorption feature forferric oxyhydroxides (e.g., goethite). Thermal infrared spectra are generally overwhelmed by quartz spectra, even in samples that are greater than 20% iron oxide.
Bowenetal.
181
present, the absorption peak occurs as a doublet at
about 2.20 mm, indicating kaolinite (Figure 3A). Illite
and mixed-layer clays (illite-smectite) have a rounded
2.20-mm absorption feature, lack the doublet, and have
additional bands at 2.35 and 2.45 mm.
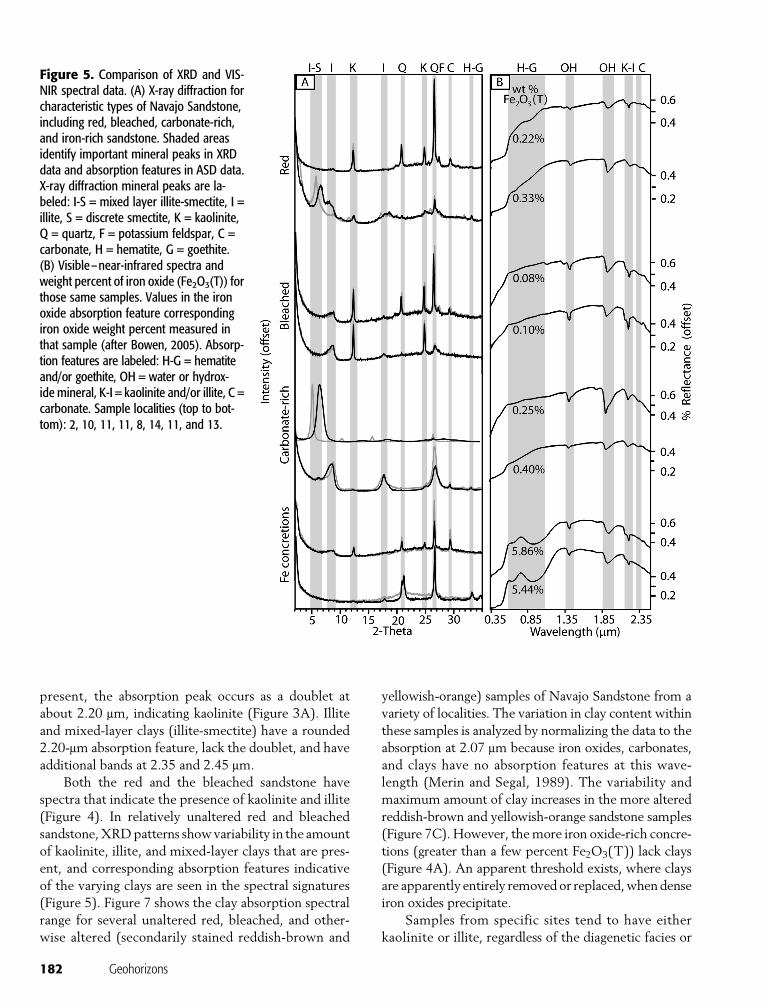
Both the red and the bleached sandstone have
spectra that indicate the presence of kaolinite and illite
(Figure 4). In relatively unaltered red and bleached
sandstone,XRDpatterns showvariability in the amount
of kaolinite, illite, and mixed-layer clays that are pres-
ent, and corresponding absorption features indicative
of the varying clays are seen in the spectral signatures
(Figure 5). Figure 7 shows the clay absorption spectral
range for several unaltered red, bleached, and other-
wise altered (secondarily stained reddish-brown and
yellowish-orange) samples of Navajo Sandstone from a
variety of localities. The variation in clay content within
these samples is analyzed by normalizing the data to the
absorption at 2.07 mm because iron oxides, carbonates,
and clays have no absorption features at this wave-
length (Merin and Segal, 1989). The variability and
maximum amount of clay increases in the more altered
reddish-brown and yellowish-orange sandstone samples
(Figure 7C). However, themore iron oxide-rich concre-
tions (greater than a few percent Fe2O3(T)) lack clays
(Figure 4A). An apparent threshold exists, where clays
are apparently entirely removedor replaced,whendense
iron oxides precipitate.
Samples from specific sites tend to have either
kaolinite or illite, regardless of the diagenetic facies or
Figure 5. Comparison of XRD and VIS-NIR spectral data. (A) X-ray diffraction forcharacteristic types of Navajo Sandstone,including red, bleached, carbonate-rich,and iron-rich sandstone. Shaded areasidentify important mineral peaks in XRDdata and absorption features in ASD data.X-ray diffraction mineral peaks are la-beled: I-S = mixed layer illite-smectite, I =illite, S = discrete smectite, K = kaolinite,Q = quartz, F = potassium feldspar, C =carbonate, H = hematite, G = goethite.(B) Visible–near-infrared spectra andweight percent of iron oxide (Fe2O3(T)) forthose same samples. Values in the ironoxide absorption feature correspondingiron oxide weight percent measured inthat sample (after Bowen, 2005). Absorp-tion features are labeled: H-G = hematiteand/or goethite, OH = water or hydrox-ide mineral, K-I = kaolinite and/or illite, C =carbonate. Sample localities (top to bot-tom): 2, 10, 11, 11, 8, 14, 11, and 13.
182 Geohorizons
apparent type of alteration (Figure 7). Samples col-
lected from localities, including the BigHole fault in the
San Rafael swell, Lake Powell, and the Henry Moun-
tains, all lack kaolinite. However, samples from
Escalante, Capitol Reef, and Rainbow Rock have strong
kaolinite doublet features (see Figure 1 for localities).
These regional patterns in clay type could be related
to either spatial variation in depositional conditions or
regional differences in the fluids that have infiltrated
and flowed through the sandstone. Because early pre-
cipitation of clays could significantly inhibit future fluid
flow, clays that precipitated early in the burial history
may remain at specific sites. However, the presence of
multiple diagenetic facies at these different sites sug-
gests that fluid flow has occurred. Evaluation of the
spatial patterns in these clays with imaging spectrosco-
py could help identify where and perhaps why these
site-specific clay variations occur.
In general, the concentration of a specific mineral
will correspond to the depth of the specific absorption
feature indicative of that mineral. However, somemin-
erals have overlapping spectral absorption features,
which can complicate this relationship. Overlap be-
tween atmospheric, clay, and carbonate absorptionmakes
conclusive identification of carbonate minerals less de-
finitive than clays and iron oxides. Carbonates show
diagnostic vibrational absorption bands caused by the
planar CO32� ion at 1.90, 2.35, and 2.55 mm (Gaffey,
1985). These features can interfere with similar water
and clay absorption features; however, the strong2.35-mmand an additional 2.50-mm absorption feature can be
diagnostic of carbonates (Figure 3) (Vincent, 1997).
The relationship between the measured amount of
carbonate and the depth of that absorption feature
(Figure 8) is less obvious than the observed relationship
between iron oxide content and absorption features
(Figure 5B) likely because of the overlap between illite
and carbonate absorption features. In samples compared
in Figure 8, even small amounts of carbonate within
the sandstone can cause a fairly significant absorption
Figure 6. Iron variations in Navajo Sandstone. (A) Amount of iron oxide present in differentially altered types of Navajo Sandstone.Bar indicates total range of values for that group, box encloses 90% of the data for that group, and the dashed line shows the medianweight percent value for each group. Data are after Beitler et al. (2005). (B) Continuum-removed Fe absorption features in the NavajoSandstone. Distinctive absorption feature widths and band minimums (gray bars), indicative of hematite and goethite. Continuum-removed spectra are defined as R’(l i )=R(l i )/Rc(l i ), where R = reflectance spectra and Rc = continuum for a specific absorptionfeature (a line segment from 0.75 to 1.30 mm) (Clark and Roush, 1984). Samples are from localities 5, 7, 8, 9, and 16. (C) HyMap-derived Fe absorption features from the Kaibab fault area illustrating the presence of hematite, goethite, and mixtures of the twominerals.
Bowen et al. 183
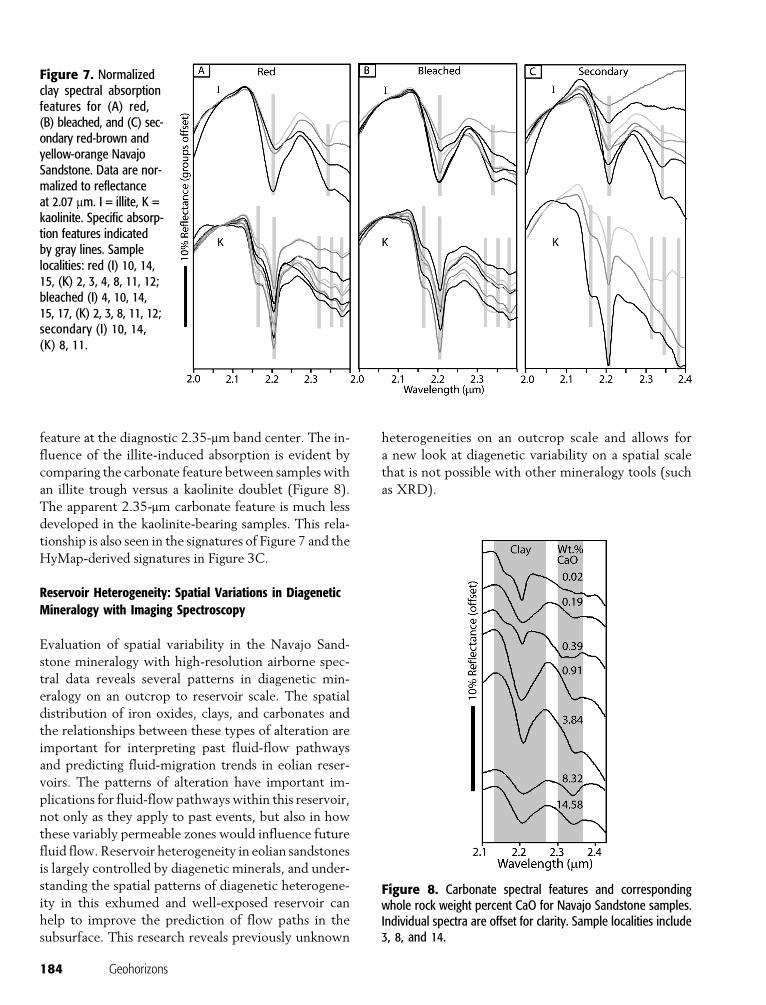
feature at the diagnostic 2.35-mm band center. The in-
fluence of the illite-induced absorption is evident by
comparing the carbonate feature between samples with
an illite trough versus a kaolinite doublet (Figure 8).
The apparent 2.35-mm carbonate feature is much less
developed in the kaolinite-bearing samples. This rela-
tionship is also seen in the signatures of Figure 7 and the
HyMap-derived signatures in Figure 3C.
Reservoir Heterogeneity: Spatial Variations in DiageneticMineralogy with Imaging Spectroscopy
Evaluation of spatial variability in the Navajo Sand-
stone mineralogy with high-resolution airborne spec-
tral data reveals several patterns in diagenetic min-
eralogy on an outcrop to reservoir scale. The spatial
distribution of iron oxides, clays, and carbonates and
the relationships between these types of alteration are
important for interpreting past fluid-flow pathways
and predicting fluid-migration trends in eolian reser-
voirs. The patterns of alteration have important im-
plications for fluid-flow pathwayswithin this reservoir,
not only as they apply to past events, but also in how
these variably permeable zones would influence future
fluid flow. Reservoir heterogeneity in eolian sandstones
is largely controlled by diagenetic minerals, and under-
standing the spatial patterns of diagenetic heterogene-
ity in this exhumed and well-exposed reservoir can
help to improve the prediction of flow paths in the
subsurface. This research reveals previously unknown
heterogeneities on an outcrop scale and allows for
a new look at diagenetic variability on a spatial scale
that is not possible with other mineralogy tools (such
as XRD).
Figure 8. Carbonate spectral features and correspondingwhole rock weight percent CaO for Navajo Sandstone samples.Individual spectra are offset for clarity. Sample localities include3, 8, and 14.
Figure 7. Normalizedclay spectral absorptionfeatures for (A) red,(B) bleached, and (C) sec-ondary red-brown andyellow-orange NavajoSandstone. Data are nor-malized to reflectanceat 2.07 mm. I = illite, K =kaolinite. Specific absorp-tion features indicatedby gray lines. Samplelocalities: red (I) 10, 14,15, (K) 2, 3, 4, 8, 11, 12;bleached (I) 4, 10, 14,15, 17, (K) 2, 3, 8, 11, 12;secondary (I) 10, 14,(K) 8, 11.
184 Geohorizons
Example of a Kilometer-Scale Reaction Front: Kaibab Fault
Some of the alteration in the Navajo Sandstone is
closely related to structural conduits and fabrics (Chan
et al., 2000; Parry et al., 2004; Eichhubl et al., 2004).
Detailed spatial analysis of structural diagenesis cannot
only help constrain flow paths and timing, but is im-
portant when considering interactions between me-
chanical structural deformation and chemical reactions
that might affect sandstone properties.
The East Kaibab fault is the eastern boundary of a
large asymmetric uplift about 190 km (118 mi) long,
extending from southern Utah into northern Arizona.
The anticlinal structure broadens southward to a maxi-
mumwidth of 40 km (25mi) and has a structural relief
between the crest and upper hinge of the monocline of
about 1500 m (4900 ft) (Doelling et al., 2000). The
fault root is in a major reactivated Proterozoic base-
ment shear zone that is exposed in the Grand Canyon,
Arizona. Previous studies on regional alterationpatterns
have indicated that the fault has been an important
conduit for fluid flow, potentially bringing hydrocarbon-
bearing fluids or brines up to the porous Navajo Sand-
stone from source formations below (Beitler et al.,
2003). The Navajo Sandstone caps most of the crest of
the Kaibab uplift and is bleached white all along the
crest. Navajo Sandstone outcrops continue to the west
as the White Cliffs of the Grand Staircase.
An approximately 4-km2 (1.5-mi2) area at the south-
ern edge ofwhere theNavajo Sandstone is exposed along
the Kaibab uplift west of the fault has some striking
regional-scale zones of reddish-brown and yellowish-
orange iron oxide staining within what visually appears
to be otherwise bleachedNavajo Sandstone (Figure 9A, B).
The shape of this alteration zone is consistent with the
geometry of a classic oxidation-reduction reaction roll
front (Adler, 1974). By evaluating changes in mineral-
ogy from the airborne data, the geochemistry of this
front, direction of fluid flow, and potential constraints
on the timing can be evaluated.
Within this area of extensive Navajo Sandstone
exposure west of the Kaibab fault, the airborne data
reveal five dominant endmembers. The spectral groups
identified are related to the amount and type of iron
oxide (hematite versus goethite) and the presence or
absence of carbonate. The groups include bleached sand-
stone, a minor hematite-bearing sandstone, a major
hematite-bearing sandstone, goethite and carbonate-
bearing sandstone, and goethite-bearing sandstone
(Figures 3C, 9E). Both the hematite groups have some
clay, but not asmuch as the goethite-rich or thebleached
endmembers. AnMF classification based on the image-
defined endmembers reveals the spatial patterns in this
diagenetic mineralogy (Figure 9E). The reaction front
(in Figure 9C, D as the boundary between iron-rich red
and orange and iron-poor blue) runs approximately
5 km (3.1 mi) west of and parallel to the Kaibab fault
(see Figure 1). The sandstone is predominantly bleached
to the southeast (Figure 9E) and contains some goe-
thite and carbonate to the northwest. Along the front,
there are increased amounts of hematite and no car-
bonate.TheMNFalgorithms applied to the subset shown
in Figure 9B reveal profound variability both within
just the VIS-NIR range (Figure 9C) and within the full
spectral range (Figure 9D). Iron species (measured in
the VIS-NIR) change abruptly along the front (e.g.,
sharp boundary between red and green in Figure 9C),
whereas there is a more gradual mixing-based transi-
tion when carbonates and clays (measured mainly in
the SWIR) are considered (e.g., gradational yellow to
orange to green transition in Figure 9D).
The regionally extensive bleached rocks contain no
iron, no carbonate, and significant kaolinite. This agrees
with the theory that regionally reducing fluids have
flushed through the sandstone, removing the hematite
grain coatings, dissolving preexisting carbonate cements,
and facilitating the alteration of K-feldspars to kaolin-
ite. The iron-rich front fingers into the bleached sand-
stone over an alteration zone that continues for several
kilometers parallel to the Kaibab fault (Figure 9A). The
superposition of the iron zone onto the otherwise
bleached rocks suggests that the fluids that created this
front postdate the bleaching fluids. The pattern of front
minerals suggests that oxidizing fluids from the north-
west mixed with the regionally bleaching Fe2+-bearing
solutions moving in from the southeast. The proximity
to the Kaibab fault and the low permeability of the
other proximal units suggests that these reducing fluids
migrated westward from the direction of the Kaibab
fault.
Example of 100-m (330-ft)-Scale Cement Banding: White Cliffs
and Calf Creek
Spectral analyses reveal banding and variegations in
diagenetic mineralogy within several areas of appar-
ently bleached Navajo Sandstone that are not apparent
visually (Figure 10). Some of the changes in mineral-
ogy revealed from the spectral imaging do not cor-
relate with specific changes in diagenetic facies, but
instead reflect subtle differences in the amount of cer-
tain cementing minerals present. Differences in the
amount of clay (mainly kaolinite) and the presence or
absence ofminor amounts of carbonate and/or iron oxide
Bowen et al. 185
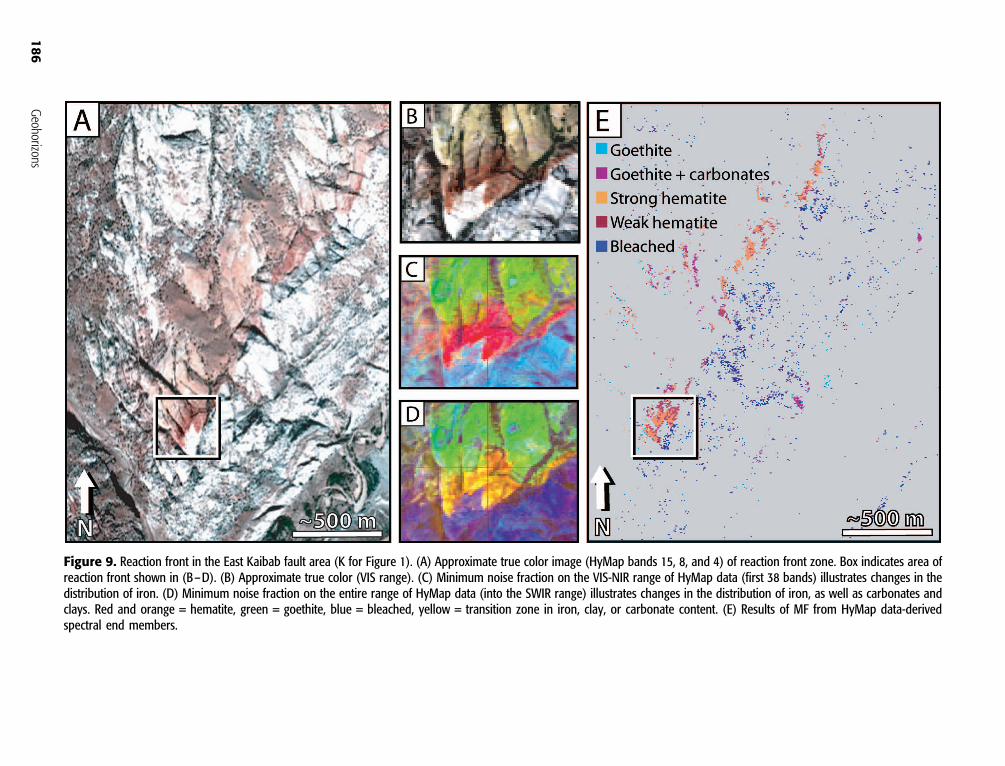
Figure 9. Reaction front in the East Kaibab fault area (K for Figure 1). (A) Approximate true color image (HyMap bands 15, 8, and 4) of reaction front zone. Box indicates area ofreaction front shown in (B–D). (B) Approximate true color (VIS range). (C) Minimum noise fraction on the VIS-NIR range of HyMap data (first 38 bands) illustrates changes in thedistribution of iron. (D) Minimum noise fraction on the entire range of HyMap data (into the SWIR range) illustrates changes in the distribution of iron, as well as carbonates andclays. Red and orange = hematite, green = goethite, blue = bleached, yellow = transition zone in iron, clay, or carbonate content. (E) Results of MF from HyMap data-derivedspectral end members.
186
Geohorizons
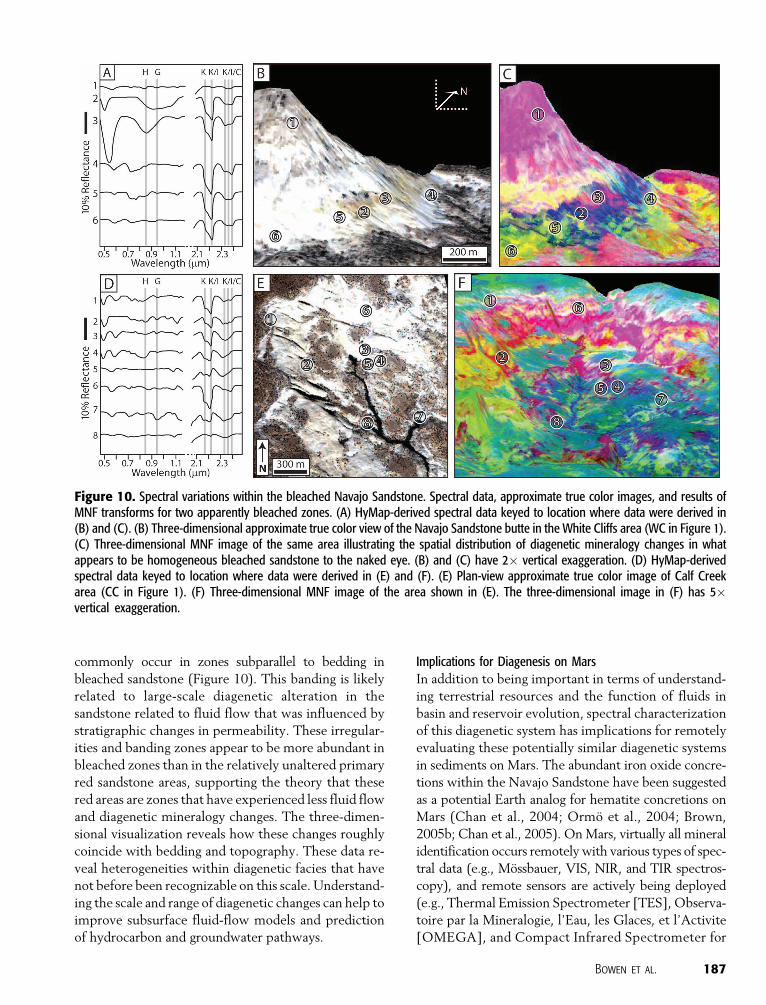
commonly occur in zones subparallel to bedding in
bleached sandstone (Figure 10). This banding is likely
related to large-scale diagenetic alteration in the
sandstone related to fluid flow that was influenced by
stratigraphic changes in permeability. These irregular-
ities and banding zones appear to be more abundant in
bleached zones than in the relatively unaltered primary
red sandstone areas, supporting the theory that these
red areas are zones that have experienced less fluid flow
and diagenetic mineralogy changes. The three-dimen-
sional visualization reveals how these changes roughly
coincide with bedding and topography. These data re-
veal heterogeneities within diagenetic facies that have
not before been recognizable on this scale. Understand-
ing the scale and range of diagenetic changes can help to
improve subsurface fluid-flow models and prediction
of hydrocarbon and groundwater pathways.
Implications for Diagenesis on Mars
In addition to being important in terms of understand-
ing terrestrial resources and the function of fluids in
basin and reservoir evolution, spectral characterization
of this diagenetic system has implications for remotely
evaluating these potentially similar diagenetic systems
in sediments on Mars. The abundant iron oxide concre-
tions within the Navajo Sandstone have been suggested
as a potential Earth analog for hematite concretions on
Mars (Chan et al., 2004; Ormo et al., 2004; Brown,
2005b; Chan et al., 2005). OnMars, virtually all mineral
identification occurs remotely with various types of spec-
tral data (e.g., Mossbauer, VIS, NIR, and TIR spectros-
copy), and remote sensors are actively being deployed
(e.g., Thermal Emission Spectrometer [TES], Observa-
toire par la Mineralogie, l’Eau, les Glaces, et l’Activite
[OMEGA], and Compact Infrared Spectrometer for
Figure 10. Spectral variations within the bleached Navajo Sandstone. Spectral data, approximate true color images, and results ofMNF transforms for two apparently bleached zones. (A) HyMap-derived spectral data keyed to location where data were derived in(B) and (C). (B) Three-dimensional approximate true color view of the Navajo Sandstone butte in the White Cliffs area (WC in Figure 1).(C) Three-dimensional MNF image of the same area illustrating the spatial distribution of diagenetic mineralogy changes in whatappears to be homogeneous bleached sandstone to the naked eye. (B) and (C) have 2� vertical exaggeration. (D) HyMap-derivedspectral data keyed to location where data were derived in (E) and (F). (E) Plan-view approximate true color image of Calf Creekarea (CC in Figure 1). (F) Three-dimensional MNF image of the area shown in (E). The three-dimensional image in (F) has 5�vertical exaggeration.
Bowen et al. 187
Mars [CRISM]) (Christensen et al., 2001; Bandfield
et al., 2003;Arvidson et al., 2005). Spectral studieswith
ground-truthopportunities such as thiswill help strength-
en the interpretations made in inaccessible areas. The
extraordinary discovery of diagenetic hematite concre-
tions on Mars (Squyers et al., 2004) elucidates the ubiq-
uity of iron oxide mobility and precipitation within
sedimentary groundwater systems and illustrates the im-
portance of analyzing terrestrial concretionary iron oxide
depositswith remotely sensed spectral data (Kerr, 2004).
CONCLUSIONS
Spectral analyses of the Navajo Sandstone reveal new
information about compositional diversity and miner-
alogical variations in a spatial context not afforded by
other geochemical techniques. Changes in mineralogy
in the Navajo Sandstone resulting from geochemical
interactions between pore fluids, cements, and host
grains create specific types of diagenetic mineral varia-
tions that are detectable with spectral reflectance data
in the VIS, NIR, and SWIR wavelength regions. The
utility of spectral data is a growing field for regional-
scale diagenetic evaluation and a tool for exploration of
past hydrocarbon pathways. In exposed sedimentary
systems, the influence of fluid flow on mineralogy and
reservoir conditions can be uniquely evaluated on a
regional scale with imaging spectroscopy. The patterns
observed can be used as predictive tools and applied to
similar units in the subsurface. To supplement this,
spectral data could be acquired from cores and during
logging, which would aid in the regional interpretation
of diagenesis and mineralogy in subsurface reservoirs.
This study illustrates the potential of this method
for use in evaluating past fluid flow and the complex-
ity of spatial change in diagenetic cement mineralogy
associated with fluid flow. This method allows for the
identification of minerals in a manner similar to XRD,
but moreover, allows for these minerals to be mapped
on a spatial scale, facilitating regional evaluations of
diagenesis and fluid flow in reservoir rocks. Analyses of
laboratory and airborne spectral data reveal details in
the abundance, type, and distribution of clays, carbon-
ates, and iron oxides in diagenetic facies of the Navajo
Sandstone.Within diagenetic facies, site-specific varia-
tions in clay type, an abundance of both strata-bound
and structurally controlled alteration zones in bleached
rocks, and a lack of these alteration feature in regionally
red rocks are identified. The distribution of the observed
alteration not only suggests past episodes of fluid flow,
but has implications for reservoir compartmentalization
that could be important in predicting more modern
hydrocarbon and groundwater migration. The spatial
patterns inmineralogy also reveal relationships between
geochemically related minerals (such as iron oxide and
carbonate) and can help to constrain the relative timing
of past fluid-flow events (e.g., the Kaibab fault reaction
front). This study provides the foundation for contin-
ued work using reflectance spectroscopy to map alter-
ation within sedimentary systems to better understand
and predict fluid-flow pathways.
REFERENCES CITED
Adler, H. H., 1974, Concepts of uranium-ore formation in reducingenvironments in sandstones and other sediments, in Formationof uranium ore deposits: Vienna, International Atomic EnergyAgency, p. 141–168.
Arvidson, R. E., F. Poulet, J. P. Bibring, M. Wolff, A. Gendrin, R. V.Morris, J. J. Freeman, Y. Langevin, N.Mangold, andG. Bellucci,2005, Spectral reflectance and morphologic correlations ineastern Terra Meridiani, Mars: Science, v. 307, p. 1591–1594.
Bandfield, J. L., T. D. Glotch, and P. R. Christensen, 2003, Spectro-scopic identification of carbonate minerals in the Martian dust:Science, v. 301, p. 1084–1087.
Beitler, B., M. A. Chan, andW. T. Parry, 2003, Bleaching of JurassicNavajo Sandstone on Colorado Plateau Laramide highs: Evi-dence of exhumed hydrocarbon supergiants?: Geology, v. 31,p. 1041–1044.
Beitler, B., W. T. Parry, and M. A. Chan, 2005, Fingerprints of fluidflow: Chemical diagenetic history of the Jurassic Navajo Sand-stone, southern Utah: Journal of Sedimentary Research, v. 75,p. 545–559.
Bethke, C. M., 1989, Modeling subsurface flow in sedimentary ba-sins: International Journal of Earth Sciences, v. 78, p. 129–154.
Blakey, R. C., F. Peterson, and G. Kocurek, 1988, Synthesis of latePaleozoic and Mesozoic eolian deposits of the Western Inte-rior of the United States: Sedimentary Geology, v. 56, p. 3–125.
Boardman, J. W., 1993, Automated spectral unmixing of AVIRISdata using convex geometry concepts, in Summaries, Fourth JetPropulsion Laboratory AirborneGeoscienceWorkshop: JPL Pub-lication, v. 93-26, no. 1, p. 11–14.
Boardman, J.W., and F.A.Kruse, 1994,Automated spectral analysis:A geologic example using AVIRIS data, north Grapevine Moun-tains, Nevada, in Proceedings, 10th Thematic Conference onGeologic Remote Sensing: Ann Arbor, Michigan, Environ-mental Research Institute of Michigan, p. I-407– I-418.
Boardman, J. W., F. A. Kruse, and R. O. Green, 1995, Mappingtarget signatures via partial unmixing of AVIRIS data, in Sum-maries, Fifth Jet Propulsion Laboratory Airborne Earth Sci-ence Workshop: JPL Publication, v. 95-1, no. 1, p. 23–26.
Boles, J. R., P. Eichhubl, G. Garven, and J. Chen, 2004, Evolution ofa hydrocarbon migration pathway along basin-bounding faults;evidence from fault cement: AAPG Bulletin, v. 88, p. 947–970.
Bowen, B. B., 2005, Sandstone bleaching and iron concretions: Anindex to fluid pathways and diagenetic history of the JurassicNavajo Sandstone, southern Utah: Ph.D. dissertation, Univer-sity of Utah, Salt Lake City, Utah, 221 p.
188 Geohorizons
Brown, D., 2005a, Covenant field keeping promises, Utah playmakes lots of headlines: AAPG Explorer, v. 25, p. 4–8.
Brown, D., 2005b, Utah marbles and Mars blueberries: A tasty pos-sibility: Did fluid migration form both?: AAPG Explorer, v. 26,p. 16–17.
Chan, M. A., and W. T. Parry, 2002, Rainbow of rocks: Mysteries ofsandstone colors and concretions in Colorado Plateau canyoncountry: Utah Geological Survey Public Information Series 77,19 p.
Chan, M. A., W. T. Parry, and J. R. Bowman, 2000, Diagenetichematite and manganese oxides and fault-related fluid flow inJurassic sandstones southeastern Utah: AAPG Bulletin, v. 84,p. 1281–1310.
Chan, M. A., B. Beitler, W. T. Parry, J. Ormo, and G. Komatsu,2004, A possible terrestrial analogue for hematite concretionson Mars: Nature, v. 429, p. 731–734.
Chan, M. A., B. B. Bowen, W. T. Parry, J. Ormo, and G. Komatsu,2005, Red rock and red planet diagenesis: Comparisons of EarthandMars concretions:Geological Society ofAmerica,GSAToday,v. 15, p. 4–10.
Chidsey, T. C., and C. D. Morgan, 2005, Major oil plays in Utahand vicinity: Quarterly technical progress report 2005, UtahGeological Survey, 64 p.
Christensen, P. R., R. V. Morris, M. D. Lane, J. L. Bandfield, andM. C. Malin, 2001, Global mapping of Martian hematitemineral deposits: Remnants of water-driven processes on earlyMars: Journal of Geophysical Research, v. 106, p. 23,873–23,885.
Clark, R. N., 1999, Spectroscopy of rocks and minerals, and prin-ciples of spectroscopy, in A. N. Rencz, ed., Manual of remotesensing, v. 3: Remote sensing for the earth sciences: New York,John Wiley and Sons, chapter 1, p. 3–58.
Clark, R. N., and T. L. Roush, 1984, Reflectance spectroscopy: Quan-titative analysis techniques for remote sensing applications: Jour-nal of Geophysical Research, v. 89, p. 6329–6340.
Clark, R. N., V. V. Trude, M. K. King, G. A. Swayze, and N. Vergo,1990, High spectral resolution reflectance spectroscopy ofminerals: Journal of Geophysical Research, v. 95, p. 12,653–12,680.
Clark, R. N., G. A. Swayze, and A. Gallagher, 1992, Mapping themineralogy and lithology of Canyonlands, Utah with imagingspectrometer data and the multiple spectral feature mappingalgorithm, in Summaries of the Third Annual Jet PropulsionLaboratory Airborne GeosciencesWorkshop, v. 1: AVIRISWork-shop: JPL Publication, v. 14, p. 11–13.
Clark, R. N., G. A. Swayze, R. Wise, K. E. Livo, T. M. Hoefen, R. F.Kokaly, and S. J. Sutley, 2003, U.S. Geological Survey digitalspectral library splib05a: U.S. Geological Survey Open-FileReport 03-395.
Cocks, T., R. Jensen, W. I. Stewart, and T. Shields, 1998, TheHyMap airborne hyperspectral sensor: The system, calibration,and performance: European Association of Remote Sensing Labo-ratoriesWorkshop on Imaging Spectrometry, Zurich, October:EARSL, 1st Proceedings, p. 37–43.
Cudahy, T., K. Okada, and C. Brauhart, 2000, Targeting VMS-styleZn mineralisation at Panorama, Australia, using airborne hy-perspectral VNIR-SWER HyMap data: ERIM Proceedings ofthe 14th International Conference on Applied Geologic Re-mote Sensing, Las Vegas, Nevada, November 6–8, p. 395–402.
Deaton, B. C., and W. L. Balsam, 1991, Visible spectroscopy— Arapid method for determining hematite and goethite concen-tration in geologicalmaterials: Journal of Sedimentary Petrology,v. 61, no. 4, p. 628–632.
Doelling,H.H.,R. E. Blackett,A.H.Hamblin, J.D. Powell, andG.L.Pollock, 2000, Geology of Grand Staircase-Escalante National
Monument, Utah, in D. A. Sprinkel, T. C. Chidsey, and P. B.Anderson, eds., Geology of Utah’s parks and monuments: UtahGeological Association Publication 28, p. 189–231.
Eichhubl, P.,W. L. Taylor, D. D. Pollard, and A. Aydin, 2004, Paleo-fluid flow and deformation in the Aztec Sandstone at the Valleyof Fire, Nevada: Evidence for the coupling of hydrogeologic,diagenetic, and tectonic processes: Geological Society of AmericaBulletin, v. 116, p. 1120–1136.
Ellis, R. J., and P. W. Scott, 2004, Evaluation of hyperspectralremote sensing as a means of environmental monitoring in theSt. Austell China clay (kaolin) region, Cornwall, UK: RemoteSensing of Environment, v. 93, p. 118–130.
Gaffey, S. J., 1985, Reflectance spectroscopy in the visible and near-infrared (0.35–2.55 mm): Applications in carbonate petrology:Geology, v. 13, p. 270–273.
Garden, I. R., S. C. Guscott, S. D. Burley, K. A. Foxford, J. J.Walsh, and J. Marshall, 2001, An exhumed palaeo-hydrocar-bon migration fairway in a faulted carrier system, EntradaSandstone of SE Utah, U.S.A.: Geofluids, v. 1, p. 195–213.
Garven, G., 1995, Continental-scale groundwater flow and geologicprocesses: Annual Review of Earth and Planetary Sciences, v. 23,p. 89–117.
Goetz, A. F. H., G. Vane, J. Solomon, and B. N. Rock, 1985, Imagingspectrometry forEarth remote sensing: Science, v. 228,p. 1147–1153.
Goldstein, R. H., 2001, Fluid inclusions in sedimentary and diage-netic systems: Lithos, v. 55, p. 159–193.
Green, A. A., M. Berman, B. Switzer, and M. D. Craig, 1988, Atransformation for ordering multispectral data in terms ofimage quality with implications for noise removal: Institute ofElectrical and Electronics Engineers Transactions on Geosci-ence and Remote Sensing, v. 26, no. 1, p. 65–74.
Gupta, R. P., 2003, Remote sensing geology, 2d ed.: Heidelberg,Germany, Springer, 655 p.
Harsanyi, J. C., and C. I. Chang, 1994, Hyperspectral image classi-fication and dimensionality reduction: An orthogonal subspaceprojection approach: Institute of Electrical and Electronics En-gineers Transactions on Geoscience and Remote Sensing, v. 32,p. 779–785.
Hubbard, B. E., J. K. Crowley, and D. R. Zimbelman, 2003, Com-parative alteration mineral mapping using visible to shortwaveinfrared (0.2–2.4 mm) Hyperion, ALI, and ASTER imagery:Institute of Electrical and Electronics Engineers Transactionson Geoscience and Remote Sensing, v. 41, p. 1401–1410.
Hunt, G. R., 1979, Near-infrared (1.3–2.4 mm) spectra of alterationminerals— Potential for use in remote sensing: Geophysics,v. 44, p. 1974–1986.
Ji, J., W. Balsam, J. Chen, and L. Liu, 2002, Rapid and quantitativemeasurement of hematite and goethite in the Chinese loess-paleosol sequence by diffuse reflectance spectroscopy: Claysand Clay Minerals, v. 50, p. 208–216.
Kerr, R. A., 2004, Rainbow of Martian minerals paints picture ofdegradation: Science, v. 305, p. 770–771.
Kruse, F. A., A. B. Lefkoff, J. B. Boardman, K. B. Heidebrecht, A. T.Shapiro, P. J. Barloon, and A. F. H. Goetz, 1993, The spectralimage processing system (SIPS)— Interactive visualization andanalysis of imaging spectrometer data: Remote Sensing ofEnvironment, Special issue on AVIRIS, v. 44, p. 145–163.
Kruse, F. A., J. W. Boardman, and J. F. Huntington, 1999, Fifteenyears of hyperspectral data: Northern Grapevine Mountains,Nevada, in Proceedings of the 8th Jet Propulsion LaboratoryAirborne Earth Science Workshop: JPL Publication, v. 99-17,p. 247–258.
Kyser, K., and E. E. Hiatt, 2003, Fluids in sedimentary basins:An introduction: Journal of Geochemical Exploration, v. 80,p. 139–149.
Bowen et al. 189
Mark, D. F., J. Parnell, S. P. Kelley, M. Lee, S. C. Sherlock, andA. Carr, 2005, Dating of multistage fluid flow in sandstones:Science, v. 309, p. 2048–2051.
Martini, B. A., 2003a, Hyperspectral mineral mapping in support ofgeothermal exploration: Examples from Long Valley Caldera,CA and Dixie Valley, NV, U.S.A.: Geothermal ResourcesCouncil Transactions, v. 27, p. 657–662.
Martini, B. A., 2003b, Assessing hydrothermal system dynamics andcharacter by coupling hyperspectral imaging with historicaldrilling data: Long Valley Caldera, CA, U.S.A.: Proceedings ofthe 25th New Zealand Geothermal Workshop, University ofAukland, New Zealand, v. 25, p. 101–106.
Merin, I. S., and D. B. Segal, 1989, Diagenetic alteration of the Win-gate Formation: Possible indications of hydrocarbonmicroseep-age, LisbonValley, Utah: Journal of Geology, v. 97, p. 719–734.
Morad, S., J. M. Ketzer, and L. F. De Ros, 2000, Spatial andtemporal distribution of diagenetic alterations in siliciclasticrocks: Implications for mass transfer in sedimentary basins:Sedimentology, v. 47, p. 95–120.
Morris, R. V., 1985, Spectral and other physicochemical propertiesof submicron powders of hematite, maghemite, magnetite,goethite, and lepidocrite: Journal of Geophysical Research,v. 90, p. 3126–3144.
Ormo, J., G. Komatsu, M. A. Chan, B. Beitler, and W. T. Parry,2004, Geological features indicative of processes related to thehematite formation in Meridiani Planum and Aram Chaos,Mars: A comparison with diagenetic hematite deposits insouthern Utah, U.S.A.: Icarus, v. 171, p. 295–316.
Parry, W. T., M. A. Chan, and B. Beitler, 2004, Chemical bleachingindicates episodes of fluid flow in deformation bands in sand-stone: AAPG Bulletin, v. 88, p. 1–17.
Person, M., J. P. Raffensperger, S. Ge, G. Garven, 1996, Basin-scalehydrogeologic modeling: Reviews of Geophysics, v. 34, p. 61–87.
Rowan, L. C., C. J. Simpson, and J. C. Mars, 2004, Hyperspectralanalysis of the ultramafic complex and adjacent lithologies atMordor, NT, Australia: Remote Sensing of Environment, v. 91,p. 419–431.
Schumacher, D., 1996, Hydrocarbon-induced alteration of soils
and sediments, in D. Schuamacher and M. A. Abrams, eds.,Hydrocarbon migration and its near-surface expression: AAPGMemoir 66, p. 71–89.
Squyers, S. W., et al., 2004, In situ evidence for an ancient aqueousenvironment at Meridiani Planum, Mars: Science, v. 306,p. 1709–1714.
Surdam, R. C., Z. S. Jiao, and D. B. MacGowan, 1993, Redox re-actions involving hydrocarbons andmineral oxidants: A mecha-nism for significant porosity enhancement in sandstones: AAPGBulletin, v. 77, p. 1509–1518.
Townsend, T. E., 1987, Discrimination of iron alteration minerals invisible and near-infrared reflectance data: Journal of Geophys-ical Research, v. 92 (B2), p. 1441–1454.
Van der Meer, F., D. van Dijk, H. van der Werff, and H. Yang,2002, Remote sensing and petroleum seepage: A review andcase study: Terra Nova, v. 14, p. 1–17.
Van Ruitenbeek, F. J. A., T. Cudahy, M. Hale, and F. D. van derMeer, 2005, Tracing fluid pathways in fossil hydrothermal sys-tems with near-infrared spectroscopy: Geology, v. 33, p. 597–600.
Vincent, R. K., 1997, Fundamentals of geological and environmen-tal remote sensing: Upper Saddle River, New Jersey, Prentice-Hall, Inc., 366 p.
Watson, K., and D. H. Knepper, 1994, Airborne remote sensing forgeology and the environment— Present and future: U.S. Geo-logical Survey Bulletin, v. 1926, 43 p.
White, K., A. Goudie, A. Parker, and A. Al-Farraj, 2001, Mappingthe geochemistry of the northern Rub’ Al Khali using multi-spectral remote sensing techniques: Earth Surface Processesand Landforms, v. 26, p. 735–748.
Yang, H., J. Zhang, F. Van Der Meer, and S. B. Kroonenberg, 2000,Imaging spectrometry data correlated to hydrocarbon micro-seepage: International Journal ofRemote Sensing, v. 21, p. 197–202.
Yuhas, R. H., A. F. H. Goetz, and J. W. Boardman, 1992, Discrimi-nation among semi-arid landscape end members using thespectral angle mapper (SAM) algorithm, in Summaries of theThird Annual Jet Propulsion Laboratory Airborne GeoscienceWorkshop: JPL Publication, v. 92-14, no. 1, p. 147–149.
190 Geohorizons
Recommended

![1 Agnes Johnson Ott Littlefield INTERVIEW WITH: Agnes ...archive.li.suu.edu/docs/ms130/OH/littlefield.pdf · MH: [Laughter] That’s neat. So your family must have encouraged you](https://img.dokumen.tips/doc/110x75/60155f7b08380f7d6a2d72e4/1-agnes-johnson-ott-littlefield-interview-with-agnes-mh-laughter-thatas.jpg)


