Recent US Climate Change and Hydrology Literature Applicable to US Army Corps of Engineers Missions ARKANSAS, WHITE AND RED RIVERS REGION 11
January 2015 FINAL

Climate Change Assessment for Water Resources Region 11 Arkansas, White and Red Rivers
USACE Institute for Water Resources 1 January 9, 2015
CLIMATE CHANGE AND HYDROLOGY LITERATURE SYNTHESIS FOR THE US
ARMY CORPS OF ENGINEERS MISSIONS IN THE UNITED STATES
ARKANSAS, WHITE AND RED RIVERS REGION 11
January 9, 2015
CDM Smith
Contract # W912HQ-10-D-0004, Task Order 147
Edited by:
Kathleen D. White PhD, PE, Institute for Water Resources - US Army Corps of Engineers
Jeffrey R. Arnold, PhD, Institute for Water Resources - US Army Corps of Engineers
Prepared by:
Chris Kurtz, PE, CDM Smith
Tim Cox, PhD, PE, CDM Smith
Frannie Bui, PE, CDM Smith
Lauren Klonsky, PE, CDM Smith
Lauren Miller, CDM Smith
Oliver Sellers-Garcia, AICP, LEED AP, CDM Smith
Quentin Smith, CDM Smith
Tim Feather, PhD, CDM Smith
Mark Dunning, PhD, CDM Smith
Larry Banks, CDM Smith
David Spector, CDM Smith
VIEWS, OPINIONS, AND/OR FINDINGS CONTAINED IN THIS REPORT SHOULD NOT
BE CONSTRUED AS AN OFFICIAL DEPARTMENT OF THE ARMY POSITION, POLICY,
OR DECISION UNLESS SO DESIGNATED BY OTHER OFFICIAL DOCUMENTATION.
Suggested Citation:
USACE (2015). Recent US Climate Change and Hydrology Literature Applicable to US Army
Corps of Engineers Missions - Arkansas, White and Red Rivers Region 11. Civil Works Technical
Report, CWTS 2015-02, USACE, Washington, DC
Climate Change Assessment for Water Resources Region 11 Arkansas, White and Red Rivers
USACE Institute for Water Resources 2 January 9, 2015
Table of Contents
Water Resources Region 11: Arkansas-White-Red Rivers .................................................... 3
1. Introduction ....................................................................................................................... 3
1.1 A Note on the 2-digit Water Resources Region Scale ...................................................... 6
2. Observed Climate Trends ................................................................................................ 6
2.1. Mean Temperature and Extreme Temperatures ........................................................... 7
2.2. Average Precipitation and Extreme Precipitation Events ............................................. 9
2.3. Hydrology ................................................................................................................... 12
2.4. Observed Trends in Secondary Climate Variables .................................................... 13
2.5. Summary of Observed Findings ................................................................................. 13
3. Projected Climate Trends .............................................................................................. 13
3.1. Projected Mean Temperature and Extreme Temperatures ......................................... 14
3.2. Projected Average Precipitation and Extreme Precipitation Events .......................... 16
3.3. Hydrology ................................................................................................................... 18
3.4. Projected Trends in Secondary Climate Variables ..................................................... 19
3.5. Summary of Projection Climate Findings .................................................................. 20
4. Business Line Vulnerabilities ......................................................................................... 22
Appendix A: References Climate/Hydrology Summary Table ........................................... 26
Appendix B: Reference List .................................................................................................... 27

Climate Change Assessment for Water Resources Region 11 Arkansas, White and Red Rivers
USACE Institute for Water Resources 3 January 9, 2015
Water Resources Region 11: Arkansas-White-Red Rivers
1. Introduction
US Army Corps of Engineers (USACE) staff are increasingly considering potential climate
change impacts when undertaking long-term planning, setting priorities, and making decisions
that affect resources, programs, policies, and operations, consistent with the 2011 and 2014
policy statements on climate change adaptation by the Assistant Secretary of the Army for Civil
Works, the USACE Climate Change Adaptation Plans, and agency policy and guidance. USACE
is undertaking its climate change preparedness and resilience planning and implementation in
consultation with internal and external experts using the best available – and actionable – climate
science and climate change information. This report represents one component of actionable
science, in the form of concise and broadly-accessible summaries of the current science with
specific attention to USACE missions and operations. This report is part of a series of twenty one
(21) regional climate syntheses prepared by the USACE under the leadership of the Response to
Climate Change Program at the scale of 2-digit U.S. Geological Survey (USGS) Hydrologic
Unit Codes (HUC) across the continental United States, Alaska, Hawaii, and Puerto Rico. The
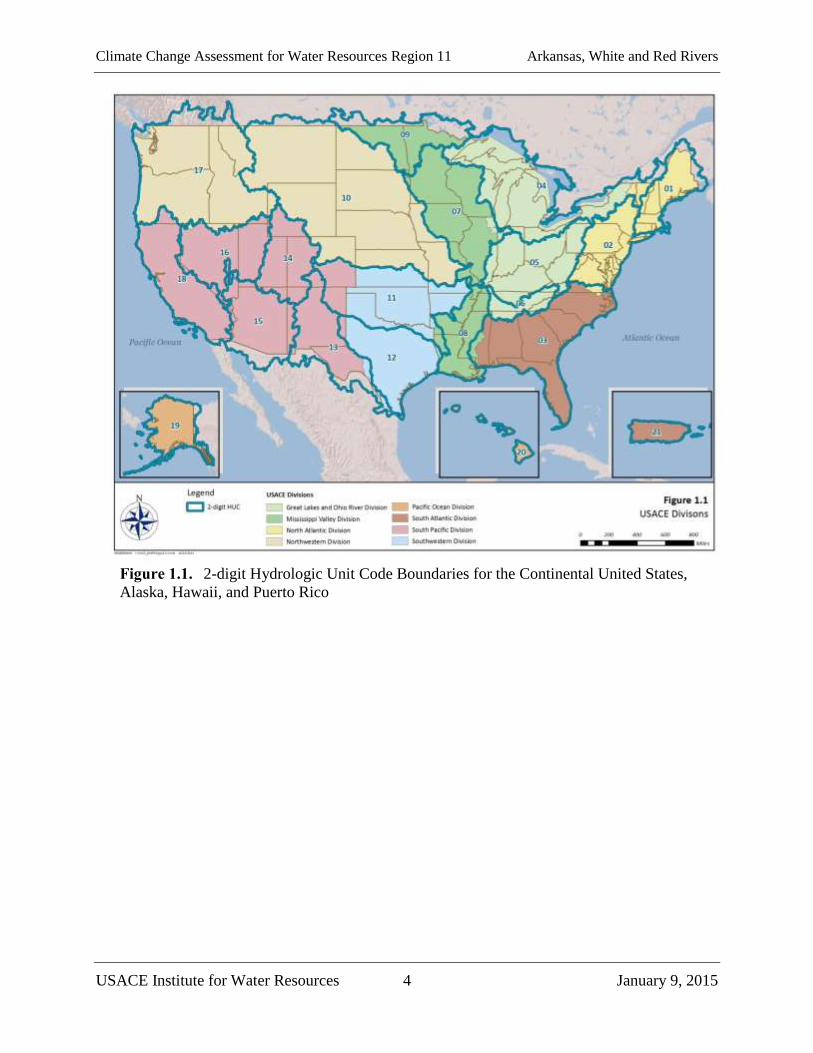
twenty one Water Resources Regions included in this series of reports is shown in Figure 1.1
along with USACE division boundaries. Each of these regional reports summarizes observed and
projected climate and hydrological patterns cited in reputable peer-reviewed literature and
authoritative national and regional reports, and characterizes climate threats to USACE business
lines. They also provide context and linkage to other agency resources for climate resilience
planning, such as sea level change calculation and coastal risk reduction resources, downscaled
climate data for subregions, and watershed vulnerability assessment tools.
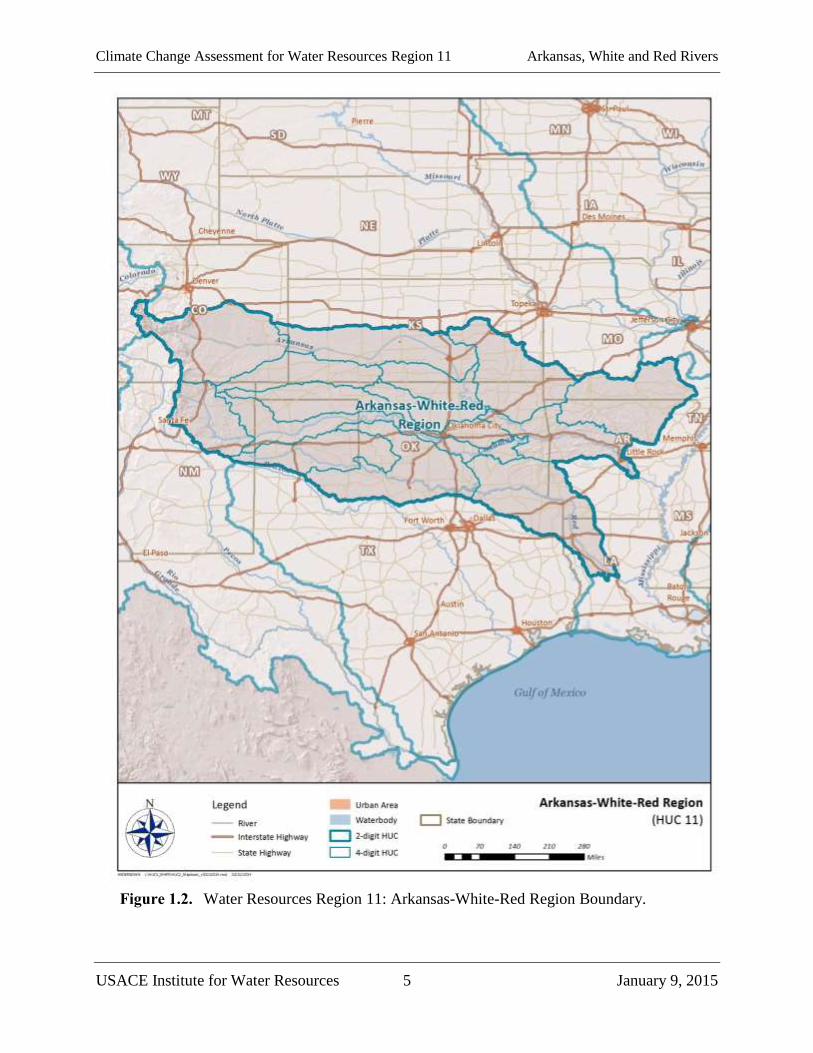
This report focuses on Water Resources Region 11, the Arkansas-White-Red Rivers, the
boundaries for which are shown in Figure 1.2. The Albuquerque, Ft. Worth, Little Rock, and
Tulsa USACE districts each include territory within Water Resources Region 11.
Climate Change Assessment for Water Resources Region 11 Arkansas, White and Red Rivers
USACE Institute for Water Resources 4 January 9, 2015
Figure 1.1. 2-digit Hydrologic Unit Code Boundaries for the Continental United States,
Alaska, Hawaii, and Puerto Rico
Climate Change Assessment for Water Resources Region 11 Arkansas, White and Red Rivers
USACE Institute for Water Resources 5 January 9, 2015
Figure 1.2. Water Resources Region 11: Arkansas-White-Red Region Boundary.
Climate Change Assessment for Water Resources Region 11 Arkansas, White and Red Rivers
USACE Institute for Water Resources 6 January 9, 2015
1.1 A Note on the Water Resources Region Scale
USACE and other resource management agencies require reliable, science-based methods for
incorporating climate change information into the assessments that support water resources
decisions and actions. Such planning assessments must quantify projections of future climate and
hydrology. One common practice is to begin by developing relationships between the currently
observed climate and the projected future possible climate over the assessment region.
However, the numerical models producing these multiple projections of future possible climate
were not designed to support these assessments for local-to-regional scale operations. This
means that intervening steps have to be taken to correct obvious biases in the models' outputs
and to make the outputs relevant at the scales where hydrologic resource assessments can take
place. The commonly used name for these post-processing steps is "downscaling" because one
step is using one or another method to spatially (and temporally) disaggregate or interpolate (or
other) the results produced at the numerical climate models' native scale to the scale of the water
resources assessment. The current generation of climate models, which includes the models used
to generate some of the inputs described in this work, have a native scale on the order of one to
two hundred kilometers on each side of the grids used to simulate climate for Earth, substantially
too coarse for the watershed assessments needed to inform resource assessment questions and
decisions.
On the other hand, these questions and decisions should not be addressed with model inputs at
scales so fine that they impart false precision to the assessment. False precision would appear by
suggesting that the driving climate model information can usefully be downscaled, by any
method, to individual river reaches and particular project locations, for example.
The approach at USACE is to consider the questions in need of climate change information at the
geospatial scale where the driving climate models retain the climate change signal. At present,
USACE judges that the regional, sub-continental climate signals projected by the driving climate
models are coherent and useful at the scale of the 2-digit HUC (Water Resources Region), and
that confidence in the driving climate model outputs declines below the level of a reasonable
trade-off between precision and accuracy for areas smaller than the watershed scale of the 4-digit
HUC (Water Resources Subregion). Hence, these summaries group information at the Water
Resources Region scale both to introduce relevant climate change literature and to support the
vulnerability assessments USACE is conducting at the Water Resources Subregion scale. For
Water Resources Region 11, both the 2-digit and 4-digit HUC boundaries are shown in Figure
1.2.
2. Observed Climate Trends
Observed climate trends within Water Resources Region 11 are presented in this section to
generally characterize current, or past, climate in the study region. While the primary cause for
global warming is attributed by the scientific community to human-induced increases in
atmosphere levels of heat-trapping gases (Walsh et al., 2014), this section in not focused on
attribution or cause (either natural or unnatural). Rather, it is specifically focused on the
identification and detection of climate trends in the recent historical record. The
interrelationships of Earth’s climate systems are complex and influenced by multiple natural and

Climate Change Assessment for Water Resources Region 11 Arkansas, White and Red Rivers
USACE Institute for Water Resources 7 January 9, 2015
unnatural (i.e. anthropogenic greenhouse gas emissions) forcings. When additional detail is
needed the reader is referred to the specific references cited, including the third National Climate
Assessment (NCA) which includes not only regional assessments but also foundational resources
related to climate science literacy.
The climate trends presented in this section are based on peer-reviewed literature on the subject
of observed climate. To the extent possible, studies specific to Water Resources Region 11 or its
sub-watersheds were relied upon. A focus is placed on identified primary variables including:
mean temperature
extreme temperatures
average precipitation
extreme precipitation events
mean streamflow.
In addition to primary variables, peer-reviewed literature addressing climate change within the
geographic region or inclusive of Water Resources Region 11 (fully or partially) revealed
additional, secondary, climatic variables that have been studied such as the spring index (SI),
drought indices, and soil moisture.
The results presented below indicate a mild upward trending for mean temperature, average
precipitation, extreme precipitation events, and mean streamflow in the Arkansas-White-Red
Region. Investigations into the observed trends of extreme temperatures were found to be less
prevalent in the peer-reviewed literature. The limited literature indicates that maximum
temperatures have remained relatively constant and the occurrence of minimum temperatures
days was found to have increased slightly.
2.1. Temperature
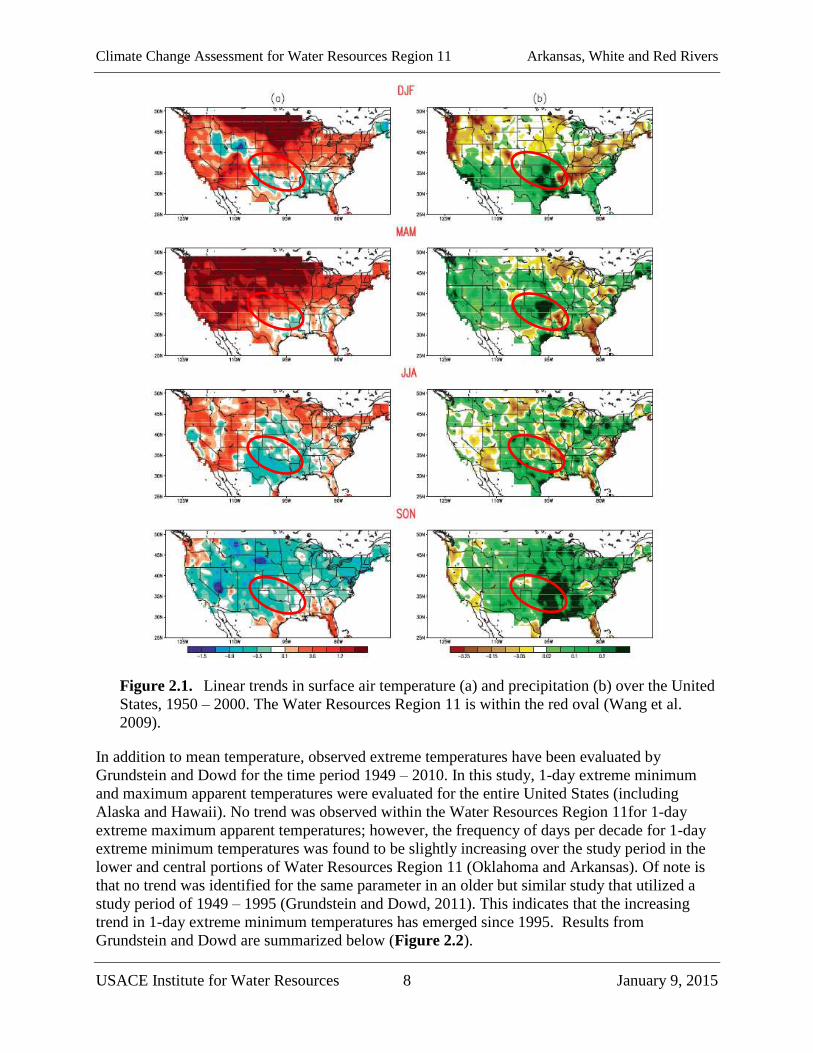
Observed mean temperature trends specific to Water Resources Region 11 have not been
reported widely in recent peer-reviewed literature; however, evaluation of trends across the
United States that is inclusive of Water Resources Region 11 has been published. For example,
Wang et al. evaluated historical climate trends for the entire continental United States from 1950
– 2000 (Wang et al., 2009). For the majority of the Water Resources Region 11, a slight to
moderate warming trend during the spring months was observed. For the summer and fall a mild
cooling trend is observed through the entire region. For winter, a slight cooling trend was
observed in the upper and lower portion of the region, while the Water Resources Region 11’s
central area showed a slight warming in the winter. These results are summarized below (Figure
2.1) in addition to precipitation which is discussed in further detail in Section 2.2.
Climate Change Assessment for Water Resources Region 11 Arkansas, White and Red Rivers
USACE Institute for Water Resources 8 January 9, 2015
Figure 2.1. Linear trends in surface air temperature (a) and precipitation (b) over the United
States, 1950 – 2000. The Water Resources Region 11 is within the red oval (Wang et al.
2009).
In addition to mean temperature, observed extreme temperatures have been evaluated by
Grundstein and Dowd for the time period 1949 – 2010. In this study, 1-day extreme minimum
and maximum apparent temperatures were evaluated for the entire United States (including
Alaska and Hawaii). No trend was observed within the Water Resources Region 11for 1-day
extreme maximum apparent temperatures; however, the frequency of days per decade for 1-day
extreme minimum temperatures was found to be slightly increasing over the study period in the
lower and central portions of Water Resources Region 11 (Oklahoma and Arkansas). Of note is
that no trend was identified for the same parameter in an older but similar study that utilized a
study period of 1949 – 1995 (Grundstein and Dowd, 2011). This indicates that the increasing
trend in 1-day extreme minimum temperatures has emerged since 1995. Results from
Grundstein and Dowd are summarized below (Figure 2.2).
Climate Change Assessment for Water Resources Region 11 Arkansas, White and Red Rivers
USACE Institute for Water Resources 9 January 9, 2015
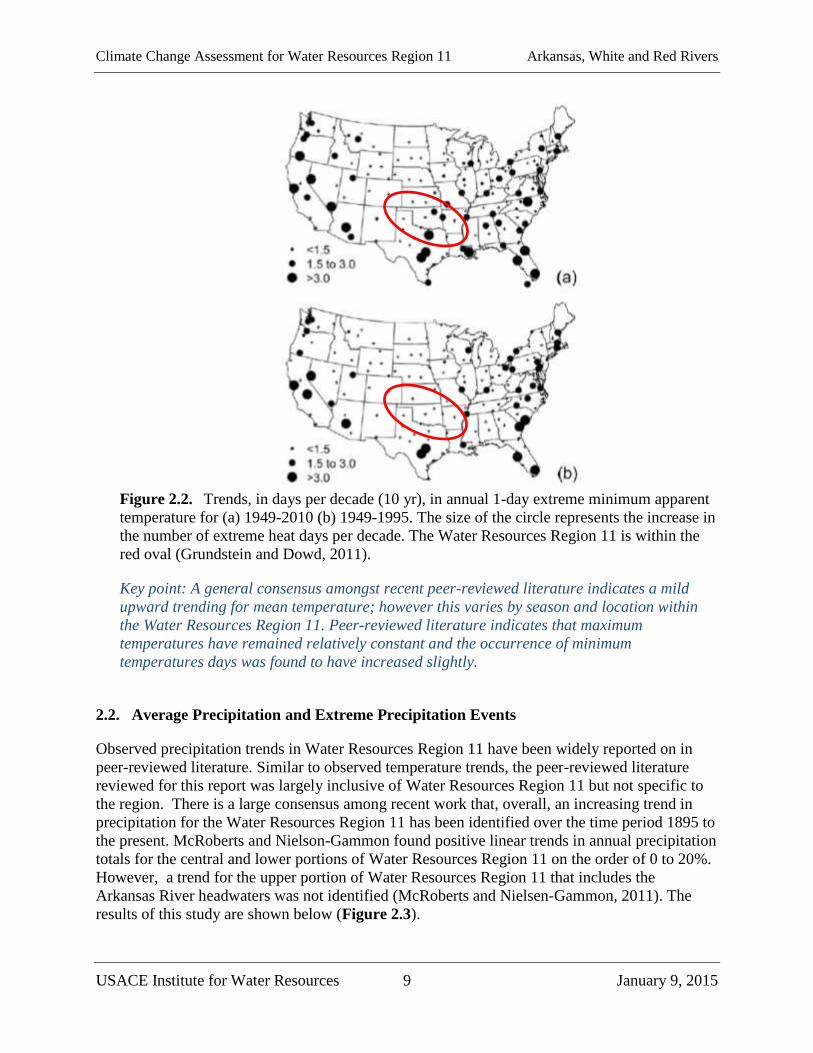
Figure 2.2. Trends, in days per decade (10 yr), in annual 1-day extreme minimum apparent
temperature for (a) 1949-2010 (b) 1949-1995. The size of the circle represents the increase in
the number of extreme heat days per decade. The Water Resources Region 11 is within the
red oval (Grundstein and Dowd, 2011).
Key point: A general consensus amongst recent peer-reviewed literature indicates a mild
upward trending for mean temperature; however this varies by season and location within
the Water Resources Region 11. Peer-reviewed literature indicates that maximum
temperatures have remained relatively constant and the occurrence of minimum
temperatures days was found to have increased slightly.
2.2. Average Precipitation and Extreme Precipitation Events
Observed precipitation trends in Water Resources Region 11 have been widely reported on in
peer-reviewed literature. Similar to observed temperature trends, the peer-reviewed literature
reviewed for this report was largely inclusive of Water Resources Region 11 but not specific to
the region. There is a large consensus among recent work that, overall, an increasing trend in
precipitation for the Water Resources Region 11 has been identified over the time period 1895 to
the present. McRoberts and Nielson-Gammon found positive linear trends in annual precipitation
totals for the central and lower portions of Water Resources Region 11 on the order of 0 to 20%.
However, a trend for the upper portion of Water Resources Region 11 that includes the
Arkansas River headwaters was not identified (McRoberts and Nielsen-Gammon, 2011). The
results of this study are shown below (Figure 2.3).
Climate Change Assessment for Water Resources Region 11 Arkansas, White and Red Rivers
USACE Institute for Water Resources 10 January 9, 2015
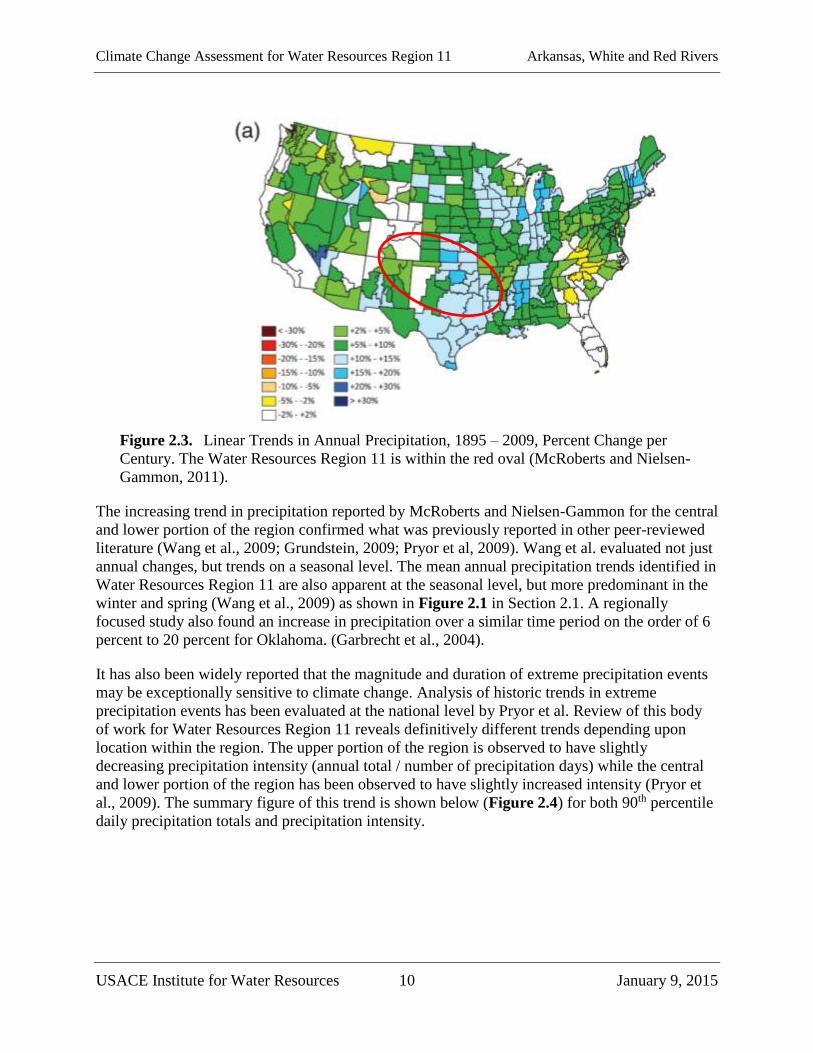
Figure 2.3. Linear Trends in Annual Precipitation, 1895 – 2009, Percent Change per
Century. The Water Resources Region 11 is within the red oval (McRoberts and Nielsen-
Gammon, 2011).
The increasing trend in precipitation reported by McRoberts and Nielsen-Gammon for the central
and lower portion of the region confirmed what was previously reported in other peer-reviewed
literature (Wang et al., 2009; Grundstein, 2009; Pryor et al, 2009). Wang et al. evaluated not just
annual changes, but trends on a seasonal level. The mean annual precipitation trends identified in
Water Resources Region 11 are also apparent at the seasonal level, but more predominant in the
winter and spring (Wang et al., 2009) as shown in Figure 2.1 in Section 2.1. A regionally
focused study also found an increase in precipitation over a similar time period on the order of 6
percent to 20 percent for Oklahoma. (Garbrecht et al., 2004).
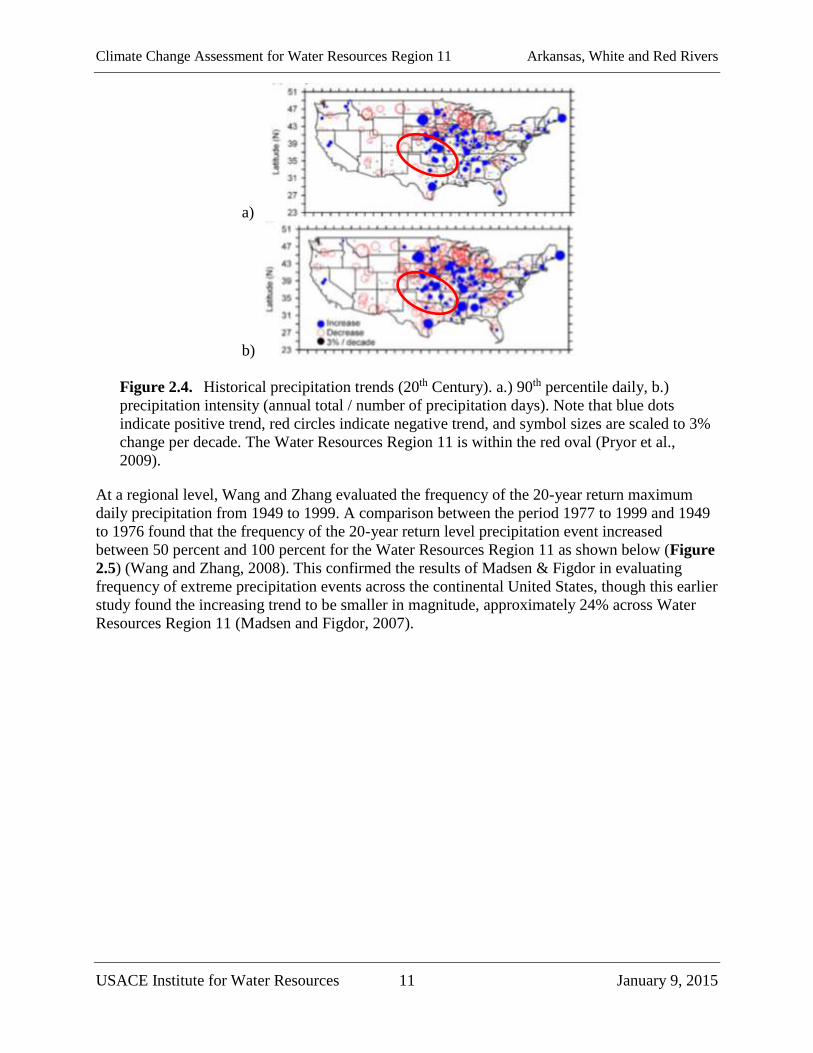
It has also been widely reported that the magnitude and duration of extreme precipitation events
may be exceptionally sensitive to climate change. Analysis of historic trends in extreme
precipitation events has been evaluated at the national level by Pryor et al. Review of this body
of work for Water Resources Region 11 reveals definitively different trends depending upon
location within the region. The upper portion of the region is observed to have slightly
decreasing precipitation intensity (annual total / number of precipitation days) while the central
and lower portion of the region has been observed to have slightly increased intensity (Pryor et
al., 2009). The summary figure of this trend is shown below (Figure 2.4) for both 90th percentile
daily precipitation totals and precipitation intensity.
Climate Change Assessment for Water Resources Region 11 Arkansas, White and Red Rivers
USACE Institute for Water Resources 11 January 9, 2015
a)
b)
Figure 2.4. Historical precipitation trends (20th Century). a.) 90th percentile daily, b.)
precipitation intensity (annual total / number of precipitation days). Note that blue dots
indicate positive trend, red circles indicate negative trend, and symbol sizes are scaled to 3%
change per decade. The Water Resources Region 11 is within the red oval (Pryor et al.,
2009).
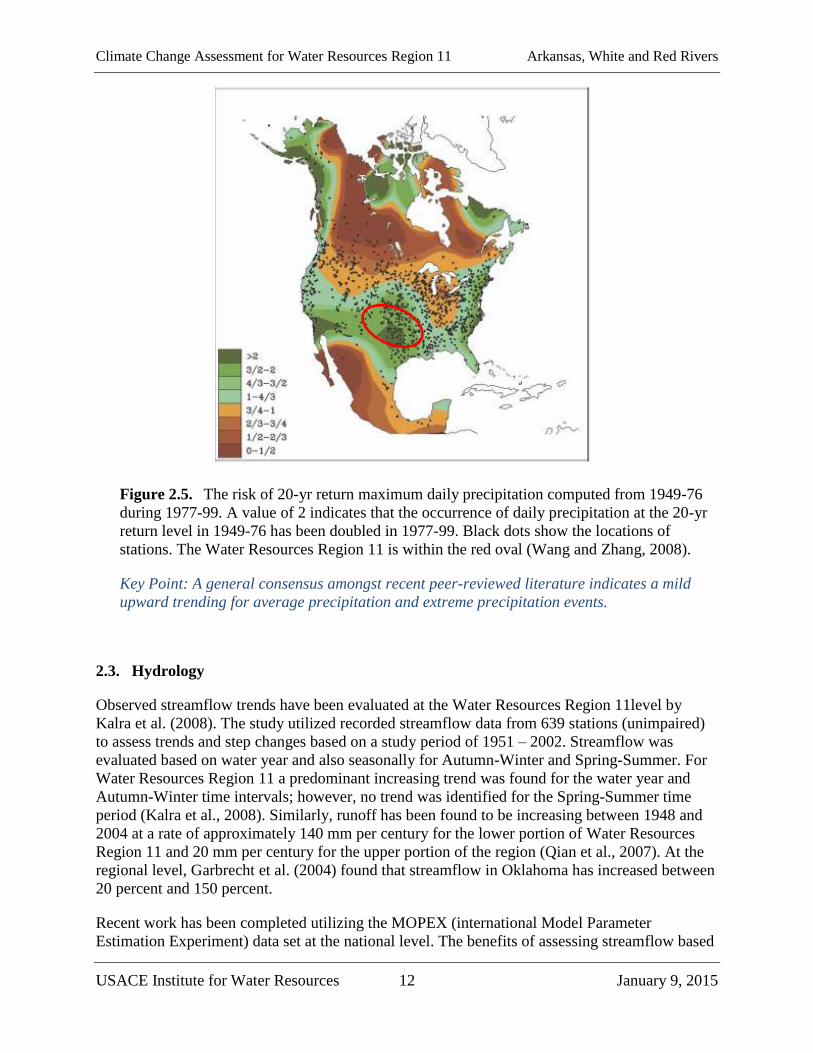
At a regional level, Wang and Zhang evaluated the frequency of the 20-year return maximum
daily precipitation from 1949 to 1999. A comparison between the period 1977 to 1999 and 1949
to 1976 found that the frequency of the 20-year return level precipitation event increased
between 50 percent and 100 percent for the Water Resources Region 11 as shown below (Figure
2.5) (Wang and Zhang, 2008). This confirmed the results of Madsen & Figdor in evaluating
frequency of extreme precipitation events across the continental United States, though this earlier
study found the increasing trend to be smaller in magnitude, approximately 24% across Water
Resources Region 11 (Madsen and Figdor, 2007).
Climate Change Assessment for Water Resources Region 11 Arkansas, White and Red Rivers
USACE Institute for Water Resources 12 January 9, 2015
Figure 2.5. The risk of 20-yr return maximum daily precipitation computed from 1949-76
during 1977-99. A value of 2 indicates that the occurrence of daily precipitation at the 20-yr
return level in 1949-76 has been doubled in 1977-99. Black dots show the locations of
stations. The Water Resources Region 11 is within the red oval (Wang and Zhang, 2008).
Key Point: A general consensus amongst recent peer-reviewed literature indicates a mild
upward trending for average precipitation and extreme precipitation events.
2.3. Hydrology
Observed streamflow trends have been evaluated at the Water Resources Region 11level by
Kalra et al. (2008). The study utilized recorded streamflow data from 639 stations (unimpaired)
to assess trends and step changes based on a study period of 1951 – 2002. Streamflow was
evaluated based on water year and also seasonally for Autumn-Winter and Spring-Summer. For
Water Resources Region 11 a predominant increasing trend was found for the water year and
Autumn-Winter time intervals; however, no trend was identified for the Spring-Summer time
period (Kalra et al., 2008). Similarly, runoff has been found to be increasing between 1948 and
2004 at a rate of approximately 140 mm per century for the lower portion of Water Resources
Region 11 and 20 mm per century for the upper portion of the region (Qian et al., 2007). At the
regional level, Garbrecht et al. (2004) found that streamflow in Oklahoma has increased between
20 percent and 150 percent.
Recent work has been completed utilizing the MOPEX (international Model Parameter
Estimation Experiment) data set at the national level. The benefits of assessing streamflow based
Climate Change Assessment for Water Resources Region 11 Arkansas, White and Red Rivers
USACE Institute for Water Resources 13 January 9, 2015
on MOPEX is that it is more representative of recent hydrology (last half of the 20th century)
than the commonly used Hydro-Climate Data Network (HCDN) data set (Xu et al., 2013). A
study utilizing the MOPEX data set by Xu et al. (2013) found that the central and lower portion
of Water Resources Region 11 had an increasing trend in streamflow as well as baseflow. The
geographic extent of this study did not include the upper portion of Water Resources Region 11.
Key Point: A general consensus amongst recent peer-reviewed literature indicates an
upward trending for average streamflow.
2.4. Observed Trends in Secondary Climate Variables
Secondary variables include those variables that are sensitive to the primary climate variables
discussed in the preceding sections. These secondary variables include drought indices, soil
moisture content, and the spring index, and the observed trends of these variables are consistent
with the observed climate trends in the primary variables. For example, a slight increase in
precipitation has been observed in the Water Resources Region 11 over the past half century. As
a result drought indices have shown a slight decline (Chen et al., 2012; Cook et al., 2014) while
soil moisture has been found to increase slightly (Grundstein, 2009). Additionally, the spring
onset index is a function of temperature regimes but is related to plant growth. Schwartz et al.
(2013) found that the majority of Water Resources Region 11 experienced a lag in initiation of
the spring index; however, the upper portion of Water Resources Region 11 was shown to be
earlier by about 4 days. These findings are consistent with the seasonal evaluation of observed
mean temperature by Wang et al. (2009).
2.5. Summary of Observed Findings
Section 2 summarizes observed trends in primary and secondary climate variables in the Water
Resources Region 11. Recent peer-reviewed literature indicates a mild upward trending for mean
temperature, average precipitation, extreme precipitation events, and mean streamflow in the
Arkansas-White-Red region. Investigations into the observed trends of extreme temperatures
were found to be less prevalent in the peer-reviewed literature. The limited literature indicates
that maximum temperatures have remained relatively constant and the occurrence of minimum
temperatures days was found to have increased slightly. Observed trends in secondary variables
such as drought indices, soil moisture contents, and the spring index were found to be agreement
with the observed trends in primary variables.
3. Projected Climate Trends
While historical data is essential in understanding current and future climate, nonstationarity in
the data (i.e. a changing climate) dictates the use of supplemental information in long term
planning studies. In other words, the past may no longer be a good predictor of the future (Milly
et al., 2008). Consequently, the scientific and engineering communities have begun using
computer models of the Earth’s atmosphere and associated thermodynamics to project future
climate trends for use in water resources planning efforts. While significant uncertainties are
inherent in these model projections, the models, termed global climate models (GCMs), are
widely accepted as representing the best available science on the subject, and have proven highly

Climate Change Assessment for Water Resources Region 11 Arkansas, White and Red Rivers
USACE Institute for Water Resources 14 January 9, 2015
useful in planning as a supplement to historical data. A wealth of literature now exists on the use
of GCMs across the globe.
This section summarizes projected climate trends, as projected by GCMs, within the Water
Resources Region 11 identified in a review of recent peer-reviewed literature. The information
presented should be considered an overview and, similar to Section 2 on observed climate trends,
does not focus on attribution or causation of the projected climate trends or the causal
relationships between climate variables. These relationships are complex and influenced by
multiple natural and unnatural (i.e. anthropogenic greenhouse gas emissions) forcings that
influence the Earth’s climate system. Typical of projected climate studies, often specific (and
sometimes multiple) greenhouse gas emission scenarios (or representative concentration
pathways) are modeled by a single GCM (or ensemble of GCMs). The spectrum of scenarios
offer a wide range of “climate futures” so each study’s assumed emission scenario(s) are noted.
When additional detail is needed, the reader is referred to the specific references cited, including
the third National Climate Assessment (NCA) which includes not only regional assessments but
also foundational resources related to climate science literacy, GCMs, and emission scenarios.
The USACE vulnerability assessments (https://corpsclimate.us/rccvar.cfm) rely on downscaled
climate projection data and hydrologic simulations produced by USACE in conjunction with
Lawrence Livermore National Laboratory, Bureau of Reclamation, U.S. Geological Survey,
Climate Central, Scripps Oceanographic Institute and Santa Clara University, and others. The
data are housed in the publicly accessible Downscaled Climate and Hydrology Projections
website archive, hosted by Lawrence Livermore National Laboratory, which is meant to provide
access to climate and hydrologic projections at spatial and temporal scales relevant to watershed
or basin-scale water resources management decisions. These data, and the vulnerability
assessments for which they provide a foundation, serve as supplements to the information about
projected climate conditions provided in this report.
Results of this review indicate a strong consensus in the scientific literature that air temperatures
will trend upwards over the next century in the Arkansas-White-Red region. In addition, a large
consensus also exists regarding a sharp increase in maximum temperatures in the region. There is
a general consensus in the reviewed literature that average precipitation will remain relatively
constant but the occurrence of extreme precipitation events will increase. Also, there is general
consensus that projected streamflow will decrease for portions of the Water Resources Region
11; however, projected trends are highly dependent on GCM selection.
3.1. Projected Mean Temperature and Extreme Temperatures
Mean temperature in Water Resources Region 11 is generally projected to increase over the next
century, with the most significant increase coming in the latter half (Liu et al., 2012). Liu et al.
(2012) evaluated the full suite of Couple Model Intercomparison Project, 3rd release (CMIP3,
http://gdo-dcp.ucllnl.org/downscaled_cmip_projections/) GCM projections for three different
emission scenarios (A2, A1B, and B1). The study area included the south central portion of the
United States, which includes the Water Resources Region 11 states of Texas, Oklahoma,
Arkansas and Louisiana. The study found that an increase in average temperature in Water
Resources Region 11 could range between 3.5 ºC and 5.0 ºC. A summary of the associated
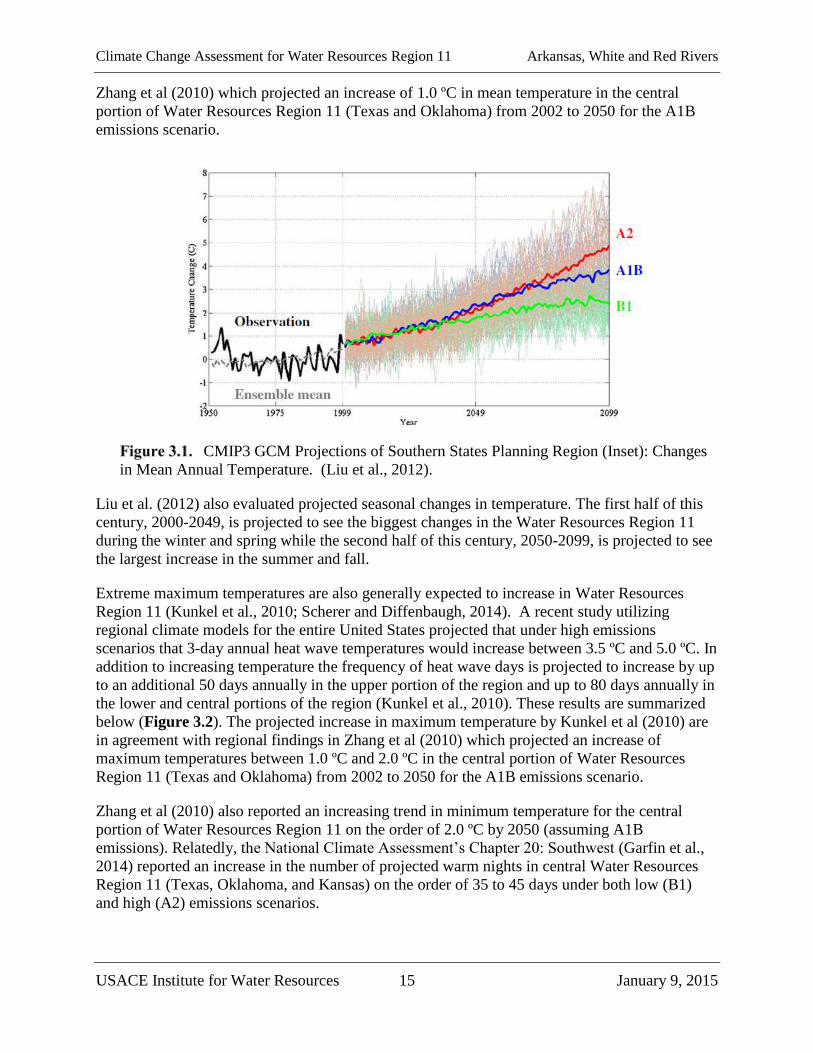
temperature modeling results for the entire study region can be found below (Figure 3.1). The
projected increase in mean temperature by Liu et al (2012) confirmed earlier regional finding by
Climate Change Assessment for Water Resources Region 11 Arkansas, White and Red Rivers
USACE Institute for Water Resources 15 January 9, 2015
Zhang et al (2010) which projected an increase of 1.0 ºC in mean temperature in the central
portion of Water Resources Region 11 (Texas and Oklahoma) from 2002 to 2050 for the A1B
emissions scenario.
CMIP3 GCM Projections of Southern States Planning Region (Inset): Changes
in Mean Annual Temperature. (Liu et al., 2012).
Liu et al. (2012) also evaluated projected seasonal changes in temperature. The first half of this
century, 2000-2049, is projected to see the biggest changes in the Water Resources Region 11
during the winter and spring while the second half of this century, 2050-2099, is projected to see
the largest increase in the summer and fall.
Extreme maximum temperatures are also generally expected to increase in Water Resources
Region 11 (Kunkel et al., 2010; Scherer and Diffenbaugh, 2014). A recent study utilizing
regional climate models for the entire United States projected that under high emissions
scenarios that 3-day annual heat wave temperatures would increase between 3.5 ºC and 5.0 ºC. In
addition to increasing temperature the frequency of heat wave days is projected to increase by up
to an additional 50 days annually in the upper portion of the region and up to 80 days annually in
the lower and central portions of the region (Kunkel et al., 2010). These results are summarized
below (Figure 3.2). The projected increase in maximum temperature by Kunkel et al (2010) are
in agreement with regional findings in Zhang et al (2010) which projected an increase of
maximum temperatures between 1.0 ºC and 2.0 ºC in the central portion of Water Resources
Region 11 (Texas and Oklahoma) from 2002 to 2050 for the A1B emissions scenario.
Zhang et al (2010) also reported an increasing trend in minimum temperature for the central
portion of Water Resources Region 11 on the order of 2.0 ºC by 2050 (assuming A1B
emissions). Relatedly, the National Climate Assessment’s Chapter 20: Southwest (Garfin et al.,
2014) reported an increase in the number of projected warm nights in central Water Resources
Region 11 (Texas, Oklahoma, and Kansas) on the order of 35 to 45 days under both low (B1)
and high (A2) emissions scenarios.

Climate Change Assessment for Water Resources Region 11 Arkansas, White and Red Rivers
USACE Institute for Water Resources 16 January 9, 2015
Projection of change in the (a),(c) average annual 3-day heat wave temperature
(ºC ) and (b), (d) average annual number of heat wave days. The Water Resources Region 11
is within the red oval (Kunkel et al., 2010).
Key point: A large consensus amongst recent peer-reviewed literature indicates a moderate
upward trending for projected mean temperature and a significant upward trend for
maximum temperature within the Water Resources Region 11.
3.2. Projected Average Precipitation and Extreme Precipitation Events
The southeastern United States, which is inclusive of the lower portion of Water Resources
Region 11, is expected to have relatively consistent levels of total annual through the middle and
end of the 21st century (Liu et al., 2012; Zhang et al., 2010). While the annual totals lack any
significant trend at the regional level, a slight increase in annual precipitation totals between 10
and 40 mm per year is projected in major metro areas of Oklahoma City and Little Rock based
on the mean of 16 GCMs (Liu et al., 2012). These results are highlighted below (Figure 3.3 and
Figure 3.4).

Climate Change Assessment for Water Resources Region 11 Arkansas, White and Red Rivers
USACE Institute for Water Resources 17 January 9, 2015
CMIP3 GCM Projections of Southern States Planning Region: total annual
precipitation. Water Resources Region 11 is indicated by the red oval (Liu et al., 2012).
CMIP3 Ensemble Mean Projections of precipitation changes in 21st Century,
compared to 1950 – 2000 historical period. Water Resources Region 11 is indicated by the
red oval (Liu et al., 2012).
Additionally, while Figure 3.3 does show a lack of any significant regional trend in annual
precipitation totals it does show increased variability is projected with higher peak rainfall and
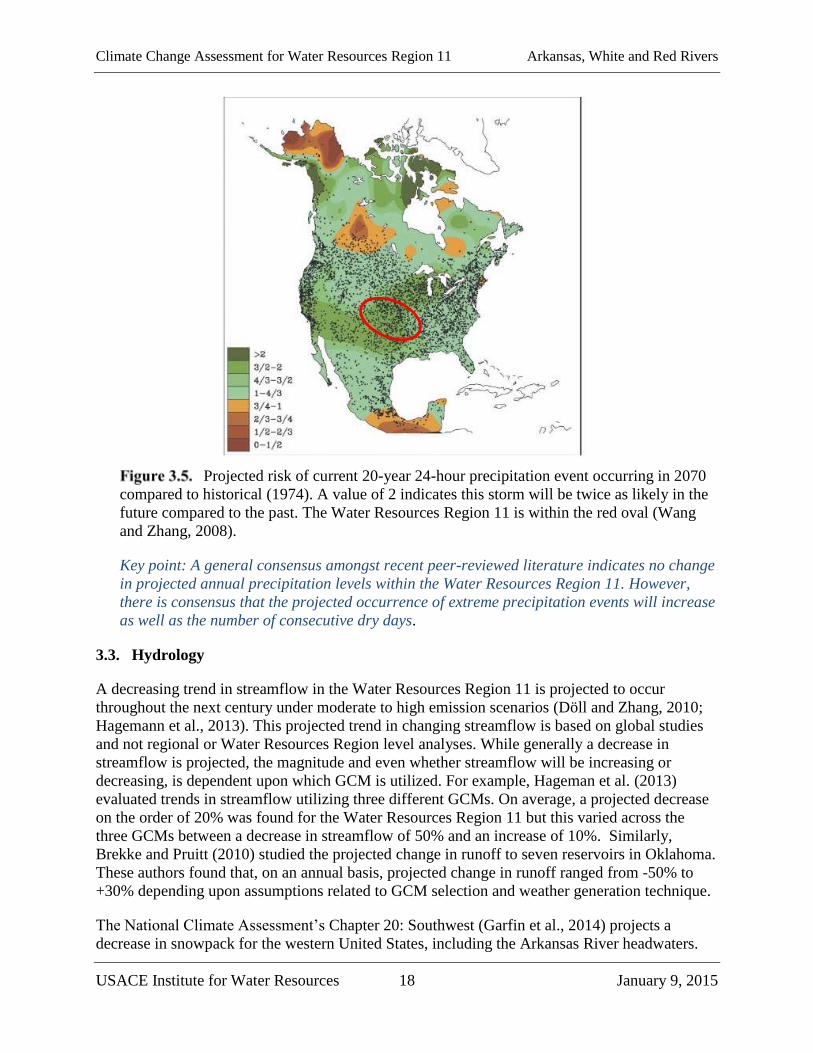
lower minimum rainfall (Liu et al., 2012). Increases in projected 20-year return level
precipitation events are also projected to increase in frequency on the order of 50 percent to 100
percent (Wang and Zhang, 2008), as shown below (Figure 3.5). Additionally, the National
Climate Assessment’s Chapter 20: Southwest (Garfin et al., 2014) reported an increase in the
number of consecutive dry days in central Water Resources Region 11 (Texas, Oklahoma, and
Kansas) on the order of 2 to 4 days under both low (B1) and high (A2) emissions scenarios.
Climate Change Assessment for Water Resources Region 11 Arkansas, White and Red Rivers
USACE Institute for Water Resources 18 January 9, 2015
Projected risk of current 20-year 24-hour precipitation event occurring in 2070
compared to historical (1974). A value of 2 indicates this storm will be twice as likely in the
future compared to the past. The Water Resources Region 11 is within the red oval (Wang
and Zhang, 2008).
Key point: A general consensus amongst recent peer-reviewed literature indicates no change
in projected annual precipitation levels within the Water Resources Region 11. However,
there is consensus that the projected occurrence of extreme precipitation events will increase
as well as the number of consecutive dry days.
3.3. Hydrology
A decreasing trend in streamflow in the Water Resources Region 11 is projected to occur
throughout the next century under moderate to high emission scenarios (Döll and Zhang, 2010;
Hagemann et al., 2013). This projected trend in changing streamflow is based on global studies
and not regional or Water Resources Region level analyses. While generally a decrease in
streamflow is projected, the magnitude and even whether streamflow will be increasing or
decreasing, is dependent upon which GCM is utilized. For example, Hageman et al. (2013)
evaluated trends in streamflow utilizing three different GCMs. On average, a projected decrease
on the order of 20% was found for the Water Resources Region 11 but this varied across the
three GCMs between a decrease in streamflow of 50% and an increase of 10%. Similarly,
Brekke and Pruitt (2010) studied the projected change in runoff to seven reservoirs in Oklahoma.
These authors found that, on an annual basis, projected change in runoff ranged from -50% to
+30% depending upon assumptions related to GCM selection and weather generation technique.
The National Climate Assessment’s Chapter 20: Southwest (Garfin et al., 2014) projects a
decrease in snowpack for the western United States, including the Arkansas River headwaters.

Climate Change Assessment for Water Resources Region 11 Arkansas, White and Red Rivers
USACE Institute for Water Resources 19 January 9, 2015
Decreased snowpack, as measured by snow water equivalent (SWE), is strongly related to the
amount of runoff and associated natural inflows to snowpack supplied rivers such as the
Arkansas River headwaters (Garfin et al., 2014). Projected SWE for the Southwestern United
States are summarized below (Figure 3.6). Each bar chart’s size is proportional to amount of
snowfall experienced by each state.
Projected snow water equivalent in the south western United Stated. A portion
of the Water Resources Region 11 is located in southeastern Colorado (Garfin et al., 2014).
Key point: There is limited consensus that projected streamflow will decrease for portions of
the Water Resources Region 11; however, projected trends are highly dependent on GCM
selection.
3.4. Projected Trends in Secondary Climate Variables
Secondary variables include those variables that are sensitive to the primary climate variables
discussed in the preceding sections. The projected trends of secondary climate variables found in
the peer-reviewed literature include drought indices and soil moisture content. These variables
are consistent with the projected climate trends in the primary variables. Specifically, multiple
studies have found that drought indices or frequency of drought are projected to increase over the
next century in the Water Resources Region 11 (Joetzjer et al., 2013; Liu et al., 2013).
Furthermore, the Thornthwait climate classification of the lower Water Resources Region 11 is
projected to change from warm-dry to hot-dry while the upper Water Resources Region 11 is
projected to shift from cool-semiarid to warm-semiarid (Elguindi and Grundstein, 2013). A
summary of the shift in climate classification is shown below (Figure 3.7). These projected

Climate Change Assessment for Water Resources Region 11 Arkansas, White and Red Rivers
USACE Institute for Water Resources 20 January 9, 2015
trends in drought indices and climate classification are consistent with an increasing trend in
projected temperature and no projected trend in mean precipitation.
Revised Thornthwaite climate types for the historical and future periods. The
Water Resources Region 11 is within the red oval (Elguindi and Grundstein, 2013).
3.5. Summary of Projection Climate Findings
Section 3 summarizes projected trends in primary and secondary climate variables in the Water
Resources Region 11. The recent peer-reviewed literature indicates a strong consensus in the
scientific literature that air temperatures will trend upwards over the next century in the
Arkansas-White-Red Region. In addition, a large consensus also exists regarding a projected
sharp increase in maximum temperatures in the region. There is a general consensus in the
reviewed literature that projected average precipitation will remain relatively constant but the
occurrence of extreme precipitation events will increase in the future. Also, there is a general
consensus that projected streamflow will decrease for portion of the Water Resources Region 11;
however, projected trends are highly dependent on GCM selection.
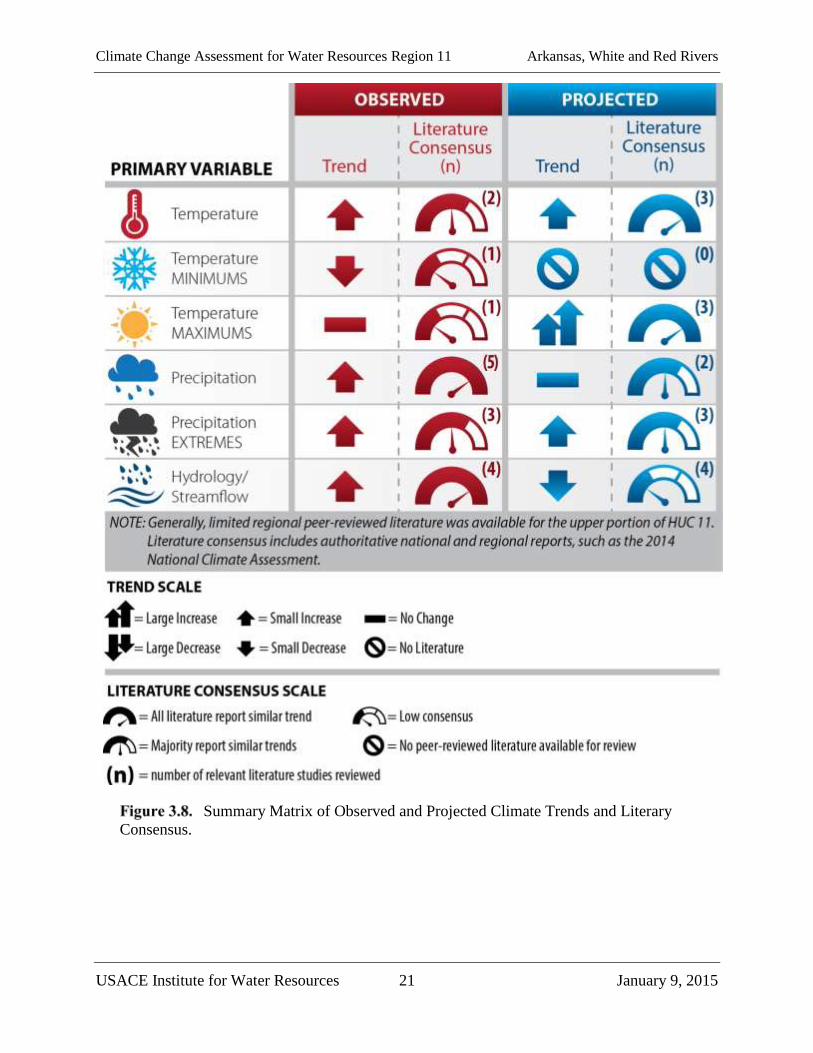
The trends and literary consensus of observed and projected primary variables noted above have
been summarized for reference and comparison in the following figure (Figure 3.8).
Climate Change Assessment for Water Resources Region 11 Arkansas, White and Red Rivers
USACE Institute for Water Resources 21 January 9, 2015
Summary Matrix of Observed and Projected Climate Trends and Literary
Consensus.

Climate Change Assessment for Water Resources Region 11 Arkansas, White and Red Rivers
USACE Institute for Water Resources 22 January 9, 2015
4. Business Line Vulnerabilities
The Arkansas-White-Red Rivers Region encompasses a vast area in the central/south central
region of the United States. The Arkansas, White, and Red Rivers are major tributaries to the
Mississippi River. The headwaters of each span large areas of the Great Plains and are in
Colorado, Arkansas, and Texas, respectively. As such, climate impacts to this area may be
affected by climatic conditions beyond this given region. USACE recognizes the potential
impacts of future climate considering the exposure and dependency of many of its projects on the
natural environment. To assess the potential vulnerabilities that climate change may pose on
USACE’s missions, a set of primary USACE business lines were identified. They include:
Navigation
Flood Risk Management
Water Supply
Ecosystem Restoration
Hydropower
Recreation
Emergency Management
Regulatory
Military Programs
Navigation is one of the primary missions of USACE in the Arkansas-White-Red Rivers Region.
Millions of tons of cargo are transported on the McClellan-Kerr Arkansas Rivers annually,
resulting in billions of dollars in cost and emissions savings associated with bulk shipment of
goods on barges rather than by truck or rail. By the middle of the century, the frequency and
intensity of large storm events and associated flooding are also expected to increase. In addition,
the Arkansas-White-Red Rivers Region may experience increases in ambient air temperature and
a broader range of extremes in water availability, which has implications for water levels and
thus the ability for vessels to navigate and dock at ports.
The region has experienced several historic flooding events, which impacted urban centers and
local communities, and inundated farmland. As a result, USACE implements flood risk
management projects in the region include structural projects which maintain the flows in many
of the river basins. Higher peak rainfalls and increased precipitation event frequency are
predicted for the region. An increase in peak rainfall would cause increased runoff and may
cause flash floods if the storms are intense. Flood risk management projects may be very
important for reducing the residual flooding impacts due to extreme storm events, which are
predicted to be more frequent and intense.
USACE also maintains and operates several fresh water supplies for aquifer replenishment for
agricultural uses. The contrast between increasing mean air temperatures along with increased
frequency and magnitude of heat waves, versus the increase, storm intensity and frequency will
make managing competing water needs a challenge, especially when water demand is high and
water supply is low.
USACE implements several ecosystem restoration projects in the Arkansas-White-Red Rivers
Region, such as examining existing ecosystems, developing watershed management plans,
performing restoration feasibility studies, executing comprehensive river restoration, and
Climate Change Assessment for Water Resources Region 11 Arkansas, White and Red Rivers
USACE Institute for Water Resources 23 January 9, 2015
preserving and maintaining natural habitats. Increased air temperatures and increased frequencies
of drought, particularly in the winter and spring months by mid-century and then fall and
summer months in the latter half of the century, will result in increased water temperatures. This
may lead to water quality concerns, particularly for the dissolved oxygen levels, which are an
important water quality parameter for aquatic life. Increased air temperatures are associated with
the growth of nuisance algal blooms and influence wildlife and supporting food supplies.
Increased storm intensities coupled with prolonged periods of summer drought conditions in the
Arkansas-White-Red Rivers region, may pose complications to planning for ecosystem needs
and lead to variation in flows. This may be particularly true during dry years, when water
demands for conflicting uses may outweigh water supply. During wet years, flooding may raise
particular ecological concerns and may threaten ecosystems.
Hydropower is generated in the Arkansas-White-Red Rivers Region – primarily in the
Southwestern Division in Oklahoma, North Texas, Missouri, and Arkansas. By the middle of the
century, large storm events are expected to increase in the region, which may be beneficial for
hydropower plants in the region, as flooding and increased river flows may lead to increased
power generation. However, in extreme cases excess flooding may present some operational
issues at these projects. Conversely, there may also be times during any given year where flows
and reservoir levels are reduced due to high temperatures and drought conditions, which reduce
the amount of power that may be generated by the hydropower plants.
Recreational facilities in the Arkansas-White-Red Rivers region offer several benefits to visitors
as well as positive economic impacts. Increases in air temperature along extended heat waves in
the summer months and the increased frequency of extreme storm events have the potential to
decrease the number of visitors to USACE’s recreational facilities. Periods of extreme high heat
poses human health concerns and higher water temperatures can result in algal blooms and other
water quality issues which may cause health risks for those involved in aquatic activities.
Increased extreme storm events may make recreational activity difficult, dangerous, or
impossible.
USACE has extraordinary capabilities to respond to natural disasters and other emergency
situations throughout the country, and it is a top priority. There are designated emergency
managers and assigned staff in each region and subregion that are able to quickly mobilize.
Extreme storm events are capable of creating emergency situations in which USACE would be
needed to provide assistance in the Arkansas-White-Red Rivers Region. These types of storms
are capable of intense precipitation, winds, and storm surge in coastal areas. Since these may
occur more frequently, USACE can expect an increased need for their assistance in disaster
response and recovery.
USACE’s regulatory mission has a serious commitment to protecting aquatic resources while
allowing reasonable development. The climate projections may have indirect implications for
permitting in the region, and may result from modifications in federal laws and guidance. This
may spur stricter regulation or increase the permitting breadth and depth. While most of the
permitting processes may not change, the volume and frequency of the permitting requirements
may increase – thus increasing the permitting costs for projects.
Climate Change Assessment for Water Resources Region 11 Arkansas, White and Red Rivers
USACE Institute for Water Resources 24 January 9, 2015
In addition, USACE provides engineering, construction, real estate, environmental management,
disaster response, and other support or consulting services for the Army, Air Force, other
assigned U.S. Government agencies, and foreign governments. Environmental management
services including rehabilitation of active and inactive military bases, formerly used defense
sites, or areas that house excess munitions. Expected changes in climate may necessitate
adjustments in rehabilitation approaches, engineering design parameters, and potential types of
military construction/infrastructure projects that USACE may be asked to support.
USACE projects are varied, complex, and at times, encompass multiple business lines. The
relationships among these business lines, with respect to impacts from climate change, are
complicated with cascading effects. Such interrelationships must be recognized as an essential
component of future planning efforts when considering the best methods or strategies to adapt.
Figure 4.1 summarizes the projected climate trends and impacts on each of the USACE business
lines.

Climate Change Assessment for Water Resources Region 11 Arkansas, White and Red Rivers
USACE Institute for Water Resources 25 January 9, 2015
Figure 4.1. Summary of Projected Climate Trends and Impacts on USACE Business Lines
Climate Change Assessment for Hydrologic Unit Code 11 Arkansas, White and Red Rivers
USACE Institute for Water Resources 26 January 9, 2015
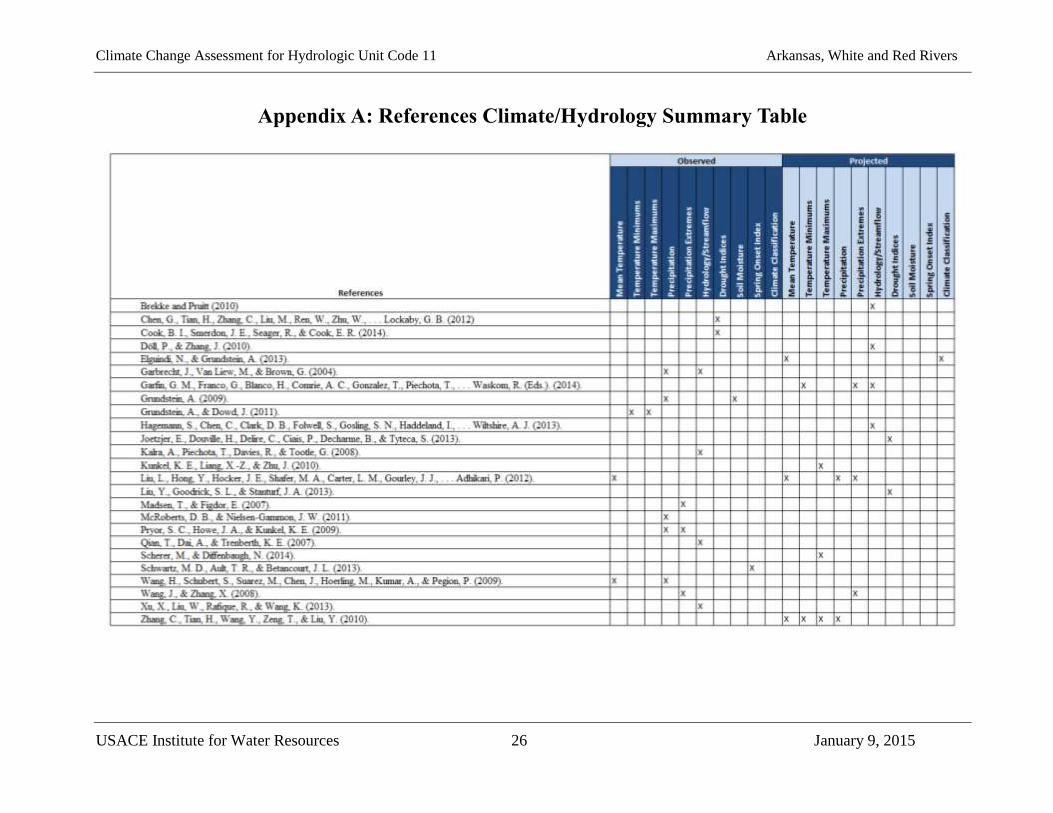
Appendix A: References Climate/Hydrology Summary Table
Climate Change Assessment for Hydrologic Unit Code 11 Arkansas, White and Red Rivers
USACE Institute for Water Resources 27 January 9, 2015
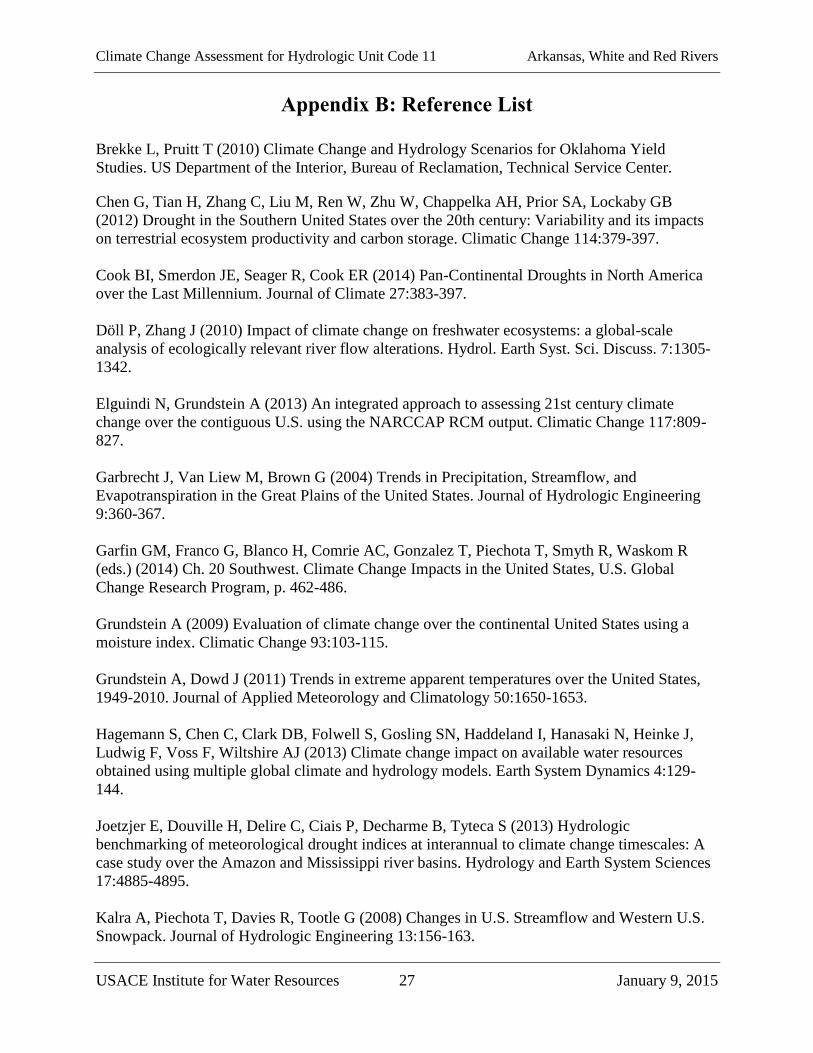
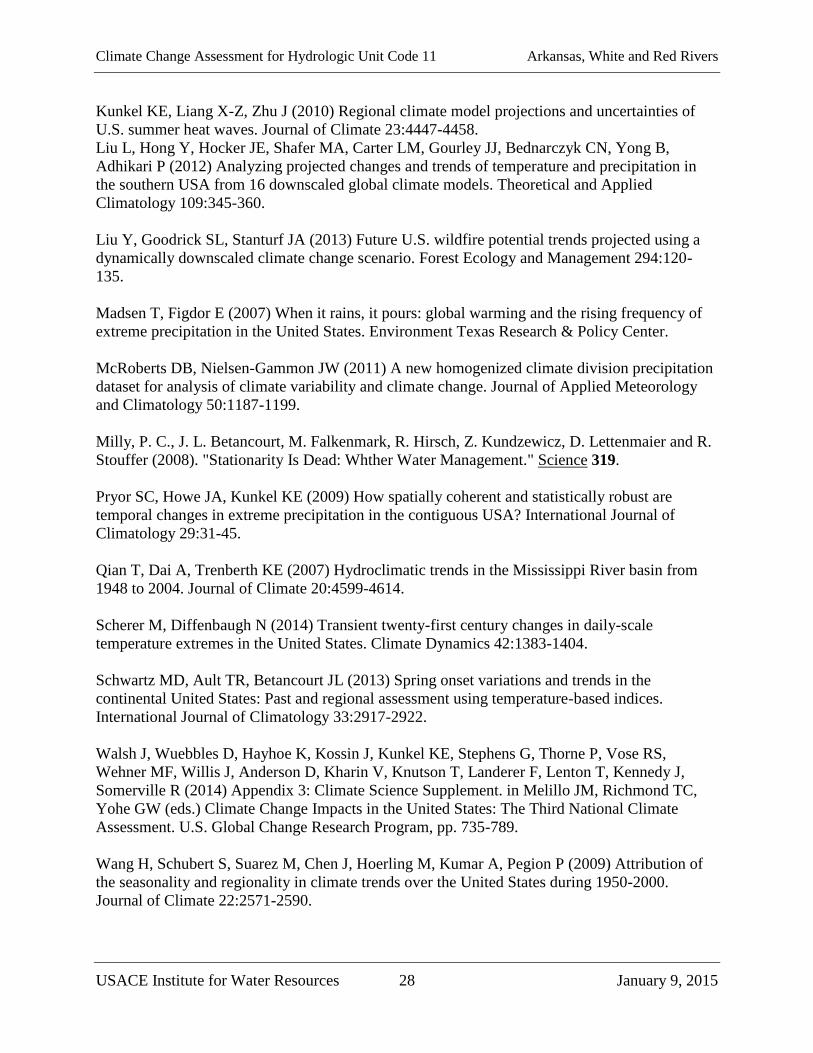
Appendix B: Reference List
Brekke L, Pruitt T (2010) Climate Change and Hydrology Scenarios for Oklahoma Yield
Studies. US Department of the Interior, Bureau of Reclamation, Technical Service Center.
Chen G, Tian H, Zhang C, Liu M, Ren W, Zhu W, Chappelka AH, Prior SA, Lockaby GB
(2012) Drought in the Southern United States over the 20th century: Variability and its impacts
on terrestrial ecosystem productivity and carbon storage. Climatic Change 114:379-397.
Cook BI, Smerdon JE, Seager R, Cook ER (2014) Pan-Continental Droughts in North America
over the Last Millennium. Journal of Climate 27:383-397.
Döll P, Zhang J (2010) Impact of climate change on freshwater ecosystems: a global-scale
analysis of ecologically relevant river flow alterations. Hydrol. Earth Syst. Sci. Discuss. 7:1305-
1342.
Elguindi N, Grundstein A (2013) An integrated approach to assessing 21st century climate
change over the contiguous U.S. using the NARCCAP RCM output. Climatic Change 117:809-
827.
Garbrecht J, Van Liew M, Brown G (2004) Trends in Precipitation, Streamflow, and
Evapotranspiration in the Great Plains of the United States. Journal of Hydrologic Engineering
9:360-367.
Garfin GM, Franco G, Blanco H, Comrie AC, Gonzalez T, Piechota T, Smyth R, Waskom R
(eds.) (2014) Ch. 20 Southwest. Climate Change Impacts in the United States, U.S. Global
Change Research Program, p. 462-486.
Grundstein A (2009) Evaluation of climate change over the continental United States using a
moisture index. Climatic Change 93:103-115.
Grundstein A, Dowd J (2011) Trends in extreme apparent temperatures over the United States,
1949-2010. Journal of Applied Meteorology and Climatology 50:1650-1653.
Hagemann S, Chen C, Clark DB, Folwell S, Gosling SN, Haddeland I, Hanasaki N, Heinke J,
Ludwig F, Voss F, Wiltshire AJ (2013) Climate change impact on available water resources
obtained using multiple global climate and hydrology models. Earth System Dynamics 4:129-
144.
Joetzjer E, Douville H, Delire C, Ciais P, Decharme B, Tyteca S (2013) Hydrologic
benchmarking of meteorological drought indices at interannual to climate change timescales: A
case study over the Amazon and Mississippi river basins. Hydrology and Earth System Sciences
17:4885-4895.
Kalra A, Piechota T, Davies R, Tootle G (2008) Changes in U.S. Streamflow and Western U.S.
Snowpack. Journal of Hydrologic Engineering 13:156-163.
Climate Change Assessment for Hydrologic Unit Code 11 Arkansas, White and Red Rivers
USACE Institute for Water Resources 28 January 9, 2015
Kunkel KE, Liang X-Z, Zhu J (2010) Regional climate model projections and uncertainties of
U.S. summer heat waves. Journal of Climate 23:4447-4458.
Liu L, Hong Y, Hocker JE, Shafer MA, Carter LM, Gourley JJ, Bednarczyk CN, Yong B,
Adhikari P (2012) Analyzing projected changes and trends of temperature and precipitation in
the southern USA from 16 downscaled global climate models. Theoretical and Applied
Climatology 109:345-360.
Liu Y, Goodrick SL, Stanturf JA (2013) Future U.S. wildfire potential trends projected using a
dynamically downscaled climate change scenario. Forest Ecology and Management 294:120-
135.
Madsen T, Figdor E (2007) When it rains, it pours: global warming and the rising frequency of
extreme precipitation in the United States. Environment Texas Research & Policy Center.
McRoberts DB, Nielsen-Gammon JW (2011) A new homogenized climate division precipitation
dataset for analysis of climate variability and climate change. Journal of Applied Meteorology
and Climatology 50:1187-1199.
Milly, P. C., J. L. Betancourt, M. Falkenmark, R. Hirsch, Z. Kundzewicz, D. Lettenmaier and R.
Stouffer (2008). "Stationarity Is Dead: Whther Water Management." Science 319.
Pryor SC, Howe JA, Kunkel KE (2009) How spatially coherent and statistically robust are
temporal changes in extreme precipitation in the contiguous USA? International Journal of
Climatology 29:31-45.
Qian T, Dai A, Trenberth KE (2007) Hydroclimatic trends in the Mississippi River basin from
1948 to 2004. Journal of Climate 20:4599-4614.
Scherer M, Diffenbaugh N (2014) Transient twenty-first century changes in daily-scale
temperature extremes in the United States. Climate Dynamics 42:1383-1404.
Schwartz MD, Ault TR, Betancourt JL (2013) Spring onset variations and trends in the
continental United States: Past and regional assessment using temperature-based indices.
International Journal of Climatology 33:2917-2922.
Walsh J, Wuebbles D, Hayhoe K, Kossin J, Kunkel KE, Stephens G, Thorne P, Vose RS,
Wehner MF, Willis J, Anderson D, Kharin V, Knutson T, Landerer F, Lenton T, Kennedy J,
Somerville R (2014) Appendix 3: Climate Science Supplement. in Melillo JM, Richmond TC,
Yohe GW (eds.) Climate Change Impacts in the United States: The Third National Climate
Assessment. U.S. Global Change Research Program, pp. 735-789.
Wang H, Schubert S, Suarez M, Chen J, Hoerling M, Kumar A, Pegion P (2009) Attribution of
the seasonality and regionality in climate trends over the United States during 1950-2000.
Journal of Climate 22:2571-2590.
Climate Change Assessment for Hydrologic Unit Code 11 Arkansas, White and Red Rivers
USACE Institute for Water Resources 29 January 9, 2015
Wang J, Zhang X (2008) Downscaling and projection of winter extreme daily precipitation over
North America. Journal of Climate 21:923-937.
Xu X, Liu W, Rafique R, Wang K (2013) Revisiting Continental U.S. Hydrologic Change in the
Latter Half of the 20th Century. Water Resources Management 27:4337-4348.
Zhang C, Tian H, Wang Y, Zeng T, Liu Y (2010) Predicting response of fuel load to future
changes in climate and atmospheric composition in the Southern United States. Forest Ecology
and Management 260:556-564.

Prepared by:
www.cdmsmith.com
Recommended