ReasonsforChronicAbsenteeismAmongSecondaryStudents
SurveySummaryReport
AmberHummBrundage,JoseM.Castillo&GeorgeM.Batsche
8/9/2017
Florida’sProblemSolving&ResponsetoInterventionProjectAcollaborativeprojectbetweentheFloridaDepartmentofEducationandtheUniversityofSouthFlorida
Reasons for Chronic Absenteeism (RCA) Report
- 2 -
Table of Contents Contact Information ....................................................................................................................... 3
Executive Summary ...................................................................................................................... 4
Introduction .................................................................................................................................... 5
Participants and Findings .............................................................................................................. 7
Response by Category ................................................................................................................ 12
Summary of Findings .................................................................................................................. 18
Reasons for Chronic Absenteeism (RCA) Report
- 3 -
Contact Information
Researchers
Amber Humm Brundage, PhD, NCSP
José Castillo, PhD, NCSP
Project Co-Director
George Batsche, EdD, NCSP
José Castillo, PhD, NCSP
For specific staff contact information, go to http://floridarti.usf.edu/contact/contactinfo.html

Reasons for Chronic Absenteeism (RCA) Report
- 4 -
Executive Summary This report presents information on the results of the Reasons for Chronic Absenteeism (RCA) Survey for secondary students. The data were collected directly from 5,790 chronically absent 6th-12th grade students in 8 states (CA, FL, IA, KY, ME, MI, MN, RI), 21 school districts, and 91 schools. The data were collected from October through December 2016. Participants were selected based upon having missed 10% or more of instructional days during the 2015/2016 school year. The students rated survey items on a 0-3 scale which represented the reasons that they “never”, “rarely”, “sometimes”, or “usually” missed school. The percentage of students who rated items within each category as “sometimes” or “usually” (rating of 2 or 3) the reason for missing school are calculated. The report provides information about their perceptions of how often they miss school, common barriers to attendance experienced by secondary students, and ideas for improving attendance. The information provided by the survey may be used to inform a data-based problem-solving process that includes the development of evidence-based interventions.
Findings
Perceptions of Absences. In an effort to better understand students’ perception of their own absences, students were asked to provide their number of absences during the previous school year. Forty-three percent (43%) of the students recalled and/or reported absences consistent with chronic absenteeism. This finding may suggest an intervention opportunity to increase student awareness of absences and implications associated with chronic absenteeism.
When students were asked about their absences in relation to peers, 55.2% of students perceived their absence rate to be the same as or less than peers. This response may indicate a skewed perception of what are considered typical absence rates, and indicate an intervention opportunity for correcting misconceptions and building awareness of good attendance patterns.
Reasons for Absences. Common barriers experienced by students were identified by determining the percentage of students who endorsed an item as “sometimes” or “usually” the reason they missed school. The top reported reasons for chronic absenteeism among students were related to health [92.6%] (short-term illness, chronic illness, and medical/dental/mental health appointments), transportation [53.0%] (missing the bus, car problems, not wanting to walk in bad weather, and being out-of-town), personal stress [41.8%] (depression/sadness, stressed/upset, family emergencies), preferred activity outside of school [41.0%] (hung-out with family/friends, stayed-up too late/overslept, substance use), and value of school [38.8%] (perceptions that school is boring, no reason to come to school, belief that school will not help reach future goals, perception that parents don’t care if absent from school).
Ideas for Improving Attendance. The students provided ideas for supports to improve attendance by responding to open-ended prompts. Top ideas included: decreased level of difficulty/strictness (less homework, more fair/consistent rules, more lenient dress codes), illness prevention (not getting sick), engaging environments (more interesting/fun/relevant/hands-on classes or instruction), improved climate/relationships (nicer peers or adults, less “drama”, less bullying), and school schedule (later start time, shorter classes, more time to pass between classes).
Reasons for Chronic Absenteeism (RCA) Report
- 5 -
Introduction Chronic absenteeism, commonly defined as missing 10% or more of instructional days per school year, has significant impact on student outcomes. It is associated with decreased reading levels, overall academic performance, on-time graduation rates, and post-secondary enrollment as well as increased dropout rates.1,2 Fortunately, chronic absenteeism rates are alterable at the student and system-level when interventions are appropriately targeted and matched to student needs.
In order to efficiently and effectively match interventions to student needs, there is a need for reliable and valid data that provide sufficient information to understand the various challenges students experience. The Reasons for Chronic Absenteeism (RCA) Survey was developed to meet this need. RCA items were developed based on research and theory related to multifaceted reasons that students miss school. The items were reviewed for clarity, relevance, and necessity by an expert panel that was comprised of national, state, district and school-level stakeholders who have experience with dropout prevention, attendance, truancy, or school refusal. Items that did not meet 70% agreement in each of the dimensions (clarity, relevance, necessity) were altered based on reviewer feedback or eliminated.
After revisions, the items were then used in cognitive interviews with chronically absent middle and high school students to ensure that they perceived the items as intended. The students read the items aloud and verbalized their thoughts about what they thought the items were asking and how they would respond based on their experiences. The students provided feedback related to item language, content, clarity, and overall organization of the instrument. The items were again adjusted based on information gained during the cognitive interviews. The final version of the RCA used in the validation study was comprised of 13 demographic and perception of absences questions; 41 items measuring multifaceted reasons for absences; and three open-ended questions asking about other reasons for missing school, the reasons they do come to school, and what would help them come to school more often. The data were summarized at the school, district, and state levels.
This RCA report provides information about common barriers to attendance experienced by secondary students that may be used to inform a data-based problem-solving process that includes the development of evidence-based interventions. This report provides an overview of common barriers experienced by students in the United States as measured by the percentage of students who endorsed an item as “sometimes” or “usually” the reason they missed school. The barriers are organized around the following 12 categories:
• Health Related • Personal Stress • Physical Safety/Conflict • School Climate • School Stress • Adult Responsibilities
• Housing/Material Instability • Legal System Involvement • Suspension • Transportation • Preferred Activity Outside of School • Value of School
1 Balfanz, R., & Byrnes, V. (2012). Chronic Absenteeism: Summarizing what we know from nationally available data.
Baltimore: Johns Hopkins University Center for Social Organization of Schools. 2 Chang, H. & Romero, M. (2008). Present, engaged and accounted for the critical importance of addressing chronic
absence in the early grades. National Center for Children in Poverty (NCCP): The Mailman School of Public Health at Columbia University.
Reasons for Chronic Absenteeism (RCA) Report
- 6 -
In addition, the report provides student perceptions of their own number of absences and absence rates relative to peers. Also provided are student reports of perceived existing resources or motivators for school attendance and what they think would help them attend school more regularly or miss fewer days. More detailed information for each of the categories and student responses within each category are included below followed by a summary of key findings and questions for state-level stakeholders who are responsible for or are interested in addressing barriers to improving chronic absenteeism rates.
Reasons for Chronic Absenteeism (RCA) Report
- 7 -
Participants and Findings Participants
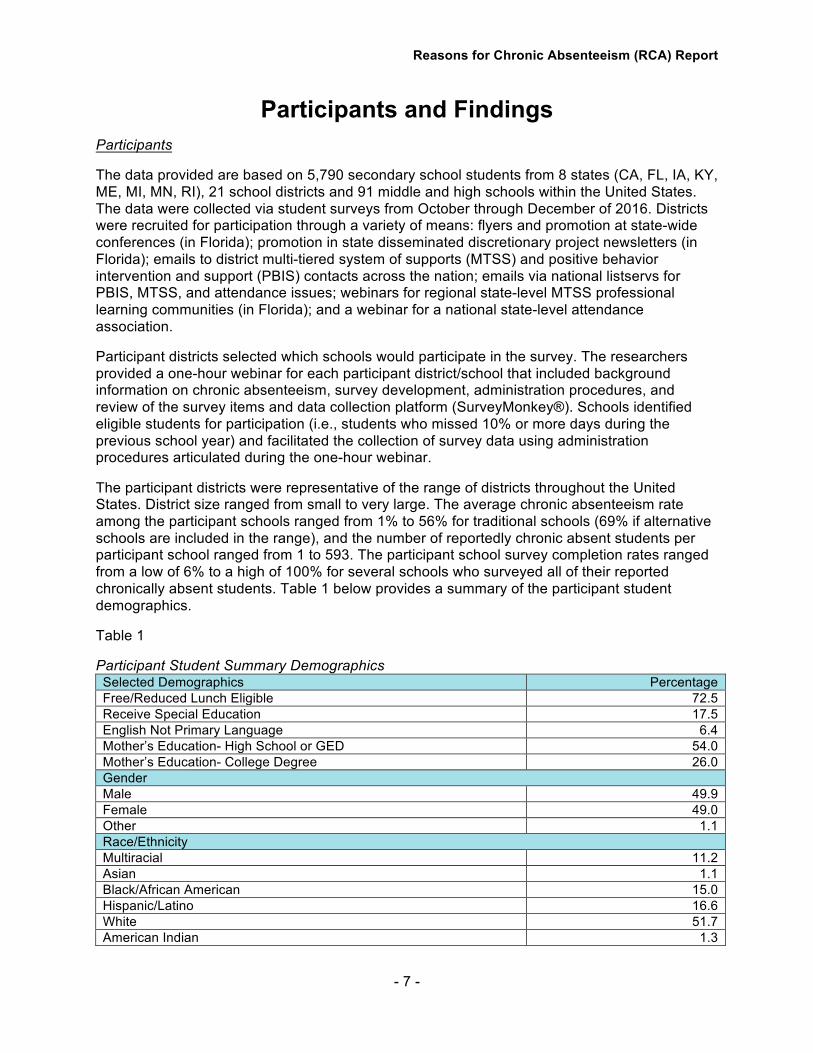
The data provided are based on 5,790 secondary school students from 8 states (CA, FL, IA, KY, ME, MI, MN, RI), 21 school districts and 91 middle and high schools within the United States. The data were collected via student surveys from October through December of 2016. Districts were recruited for participation through a variety of means: flyers and promotion at state-wide conferences (in Florida); promotion in state disseminated discretionary project newsletters (in Florida); emails to district multi-tiered system of supports (MTSS) and positive behavior intervention and support (PBIS) contacts across the nation; emails via national listservs for PBIS, MTSS, and attendance issues; webinars for regional state-level MTSS professional learning communities (in Florida); and a webinar for a national state-level attendance association.
Participant districts selected which schools would participate in the survey. The researchers provided a one-hour webinar for each participant district/school that included background information on chronic absenteeism, survey development, administration procedures, and review of the survey items and data collection platform (SurveyMonkey®). Schools identified eligible students for participation (i.e., students who missed 10% or more days during the previous school year) and facilitated the collection of survey data using administration procedures articulated during the one-hour webinar.
The participant districts were representative of the range of districts throughout the United States. District size ranged from small to very large. The average chronic absenteeism rate among the participant schools ranged from 1% to 56% for traditional schools (69% if alternative schools are included in the range), and the number of reportedly chronic absent students per participant school ranged from 1 to 593. The participant school survey completion rates ranged from a low of 6% to a high of 100% for several schools who surveyed all of their reported chronically absent students. Table 1 below provides a summary of the participant student demographics.
Table 1
Participant Student Summary Demographics Selected Demographics Percentage Free/Reduced Lunch Eligible 72.5 Receive Special Education 17.5 English Not Primary Language 6.4 Mother’s Education- High School or GED 54.0 Mother’s Education- College Degree 26.0 Gender Male 49.9 Female 49.0 Other 1.1 Race/Ethnicity Multiracial 11.2 Asian 1.1 Black/African American 15.0 Hispanic/Latino 16.6 White 51.7 American Indian 1.3
Reasons for Chronic Absenteeism (RCA) Report
- 8 -
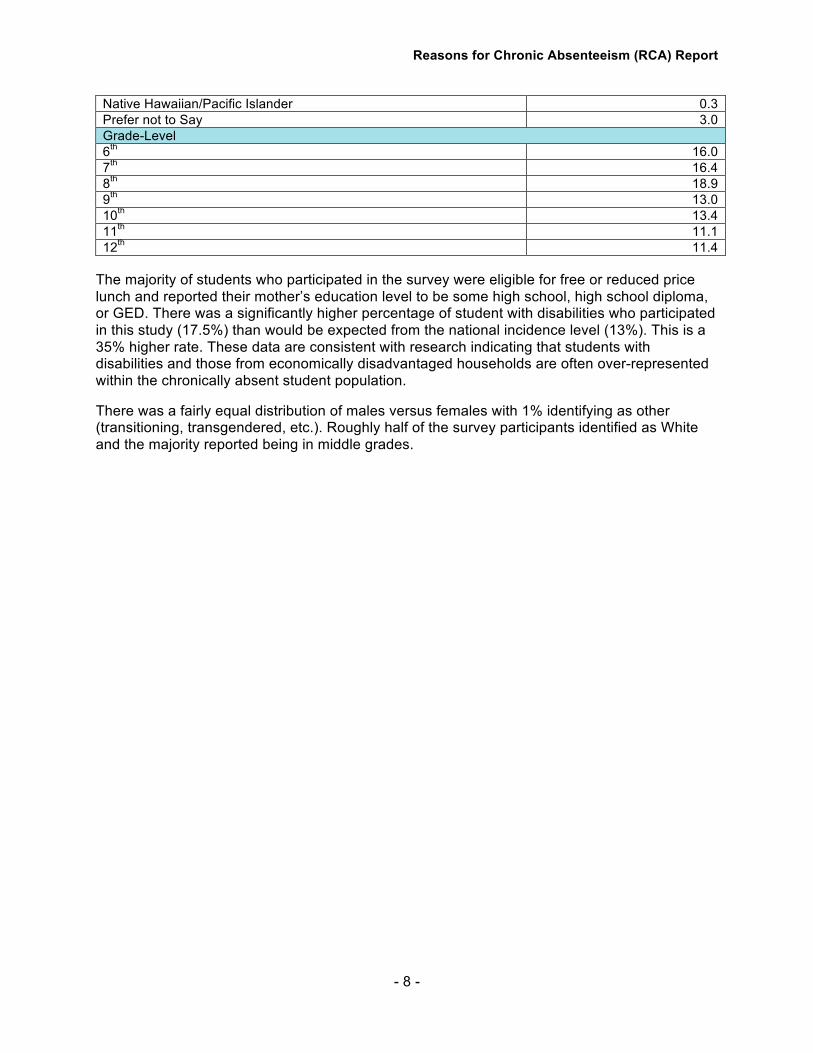
Native Hawaiian/Pacific Islander 0.3 Prefer not to Say 3.0 Grade-Level 6th 16.0 7th 16.4 8th 18.9 9th 13.0 10th 13.4 11th 11.1 12th 11.4
The majority of students who participated in the survey were eligible for free or reduced price lunch and reported their mother’s education level to be some high school, high school diploma, or GED. There was a significantly higher percentage of student with disabilities who participated in this study (17.5%) than would be expected from the national incidence level (13%). This is a 35% higher rate. These data are consistent with research indicating that students with disabilities and those from economically disadvantaged households are often over-represented within the chronically absent student population.
There was a fairly equal distribution of males versus females with 1% identifying as other (transitioning, transgendered, etc.). Roughly half of the survey participants identified as White and the majority reported being in middle grades.
Reasons for Chronic Absenteeism (RCA) Report
- 9 -
Findings
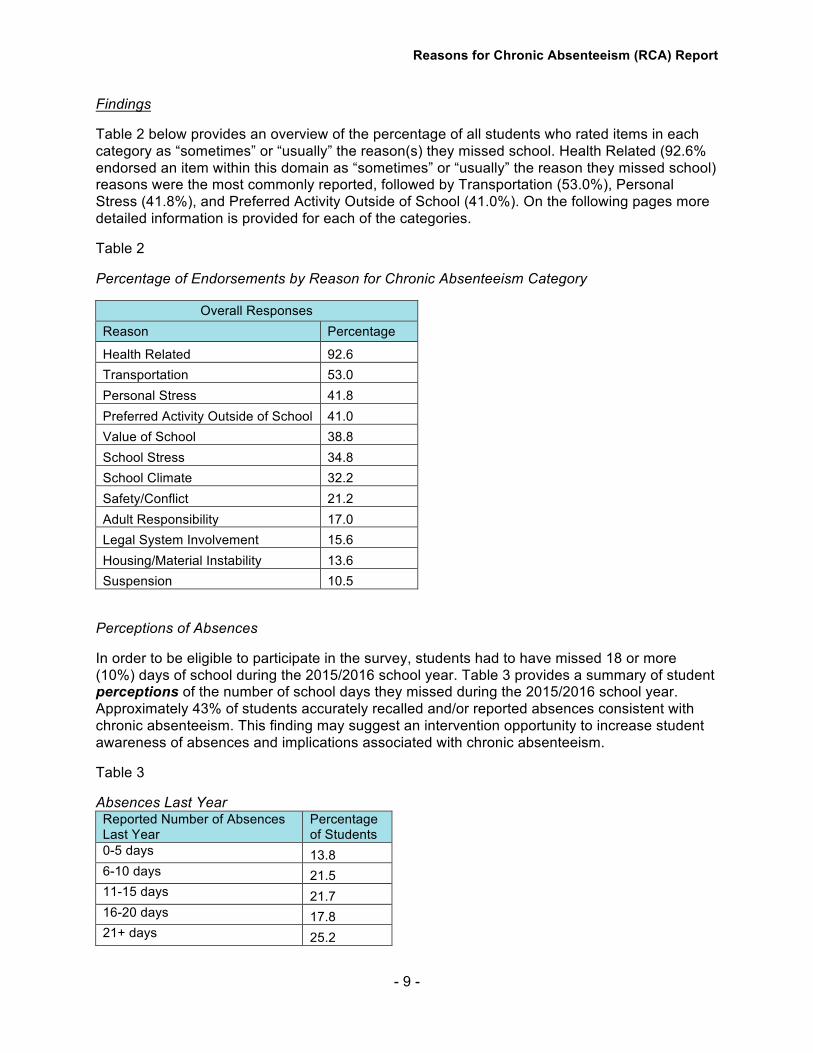
Table 2 below provides an overview of the percentage of all students who rated items in each category as “sometimes” or “usually” the reason(s) they missed school. Health Related (92.6% endorsed an item within this domain as “sometimes” or “usually” the reason they missed school) reasons were the most commonly reported, followed by Transportation (53.0%), Personal Stress (41.8%), and Preferred Activity Outside of School (41.0%). On the following pages more detailed information is provided for each of the categories.
Table 2
Percentage of Endorsements by Reason for Chronic Absenteeism Category
Overall Responses Reason Percentage
Health Related 92.6 Transportation 53.0 Personal Stress 41.8 Preferred Activity Outside of School 41.0 Value of School 38.8 School Stress 34.8 School Climate 32.2 Safety/Conflict 21.2 Adult Responsibility 17.0 Legal System Involvement 15.6 Housing/Material Instability 13.6 Suspension 10.5
Perceptions of Absences
In order to be eligible to participate in the survey, students had to have missed 18 or more (10%) days of school during the 2015/2016 school year. Table 3 provides a summary of student perceptions of the number of school days they missed during the 2015/2016 school year. Approximately 43% of students accurately recalled and/or reported absences consistent with chronic absenteeism. This finding may suggest an intervention opportunity to increase student awareness of absences and implications associated with chronic absenteeism.
Table 3
Absences Last Year Reported Number of Absences Last Year
Percentage of Students
0-5 days 13.8 6-10 days 21.5 11-15 days 21.7 16-20 days 17.8 21+ days 25.2
Reasons for Chronic Absenteeism (RCA) Report
- 10 -
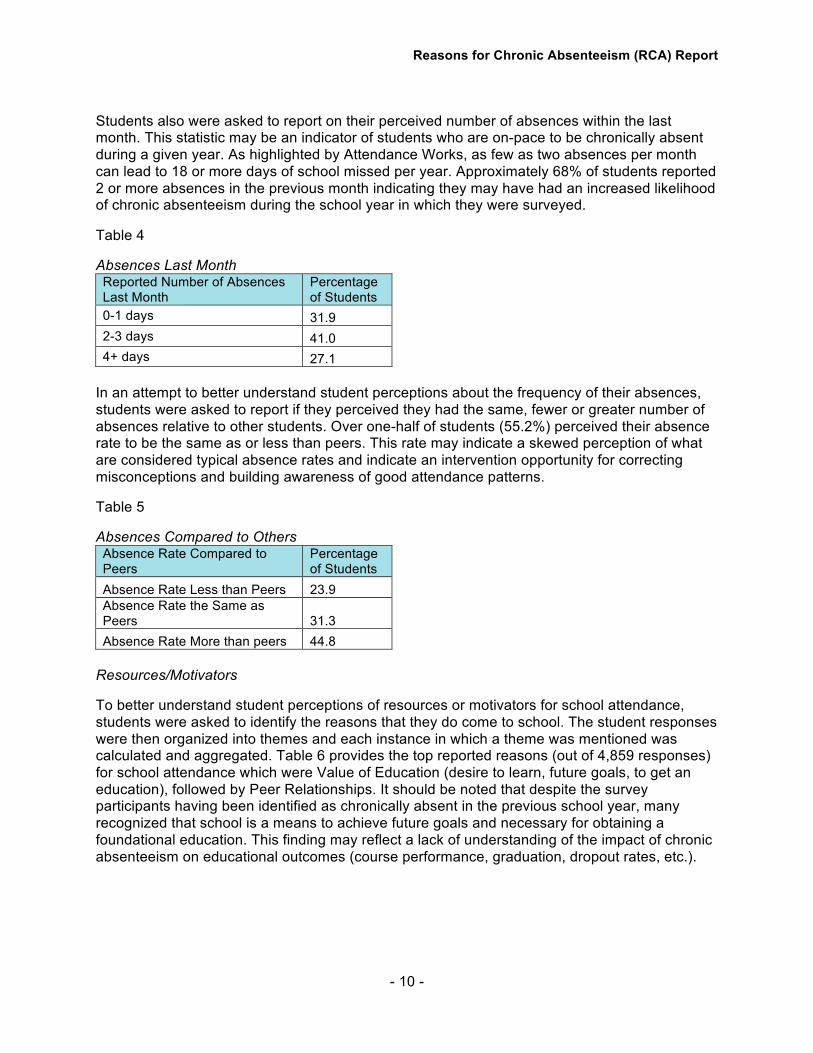
Students also were asked to report on their perceived number of absences within the last month. This statistic may be an indicator of students who are on-pace to be chronically absent during a given year. As highlighted by Attendance Works, as few as two absences per month can lead to 18 or more days of school missed per year. Approximately 68% of students reported 2 or more absences in the previous month indicating they may have had an increased likelihood of chronic absenteeism during the school year in which they were surveyed.
Table 4
Absences Last Month Reported Number of Absences Last Month
Percentage of Students
0-1 days 31.9 2-3 days 41.0 4+ days 27.1
In an attempt to better understand student perceptions about the frequency of their absences, students were asked to report if they perceived they had the same, fewer or greater number of absences relative to other students. Over one-half of students (55.2%) perceived their absence rate to be the same as or less than peers. This rate may indicate a skewed perception of what are considered typical absence rates and indicate an intervention opportunity for correcting misconceptions and building awareness of good attendance patterns.
Table 5
Absences Compared to Others Absence Rate Compared to Peers
Percentage of Students
Absence Rate Less than Peers 23.9 Absence Rate the Same as Peers 31.3 Absence Rate More than peers 44.8
Resources/Motivators
To better understand student perceptions of resources or motivators for school attendance, students were asked to identify the reasons that they do come to school. The student responses were then organized into themes and each instance in which a theme was mentioned was calculated and aggregated. Table 6 provides the top reported reasons (out of 4,859 responses) for school attendance which were Value of Education (desire to learn, future goals, to get an education), followed by Peer Relationships. It should be noted that despite the survey participants having been identified as chronically absent in the previous school year, many recognized that school is a means to achieve future goals and necessary for obtaining a foundational education. This finding may reflect a lack of understanding of the impact of chronic absenteeism on educational outcomes (course performance, graduation, dropout rates, etc.).
Reasons for Chronic Absenteeism (RCA) Report
- 11 -
Table 6
Reasons for School Attendance Top Responses
Motivator Instances Mentioned
Value of Education (Desire to learn, future goals, to get an education)
3080
Peer Relationships 1973 School Activities (Clubs, sports, extra-curricular activities)
723
Required- Unspecified (I have to) 186 Classes (Content area or elective) 176 Parent Support (Parent expectation/support for attendance)
174
Supports
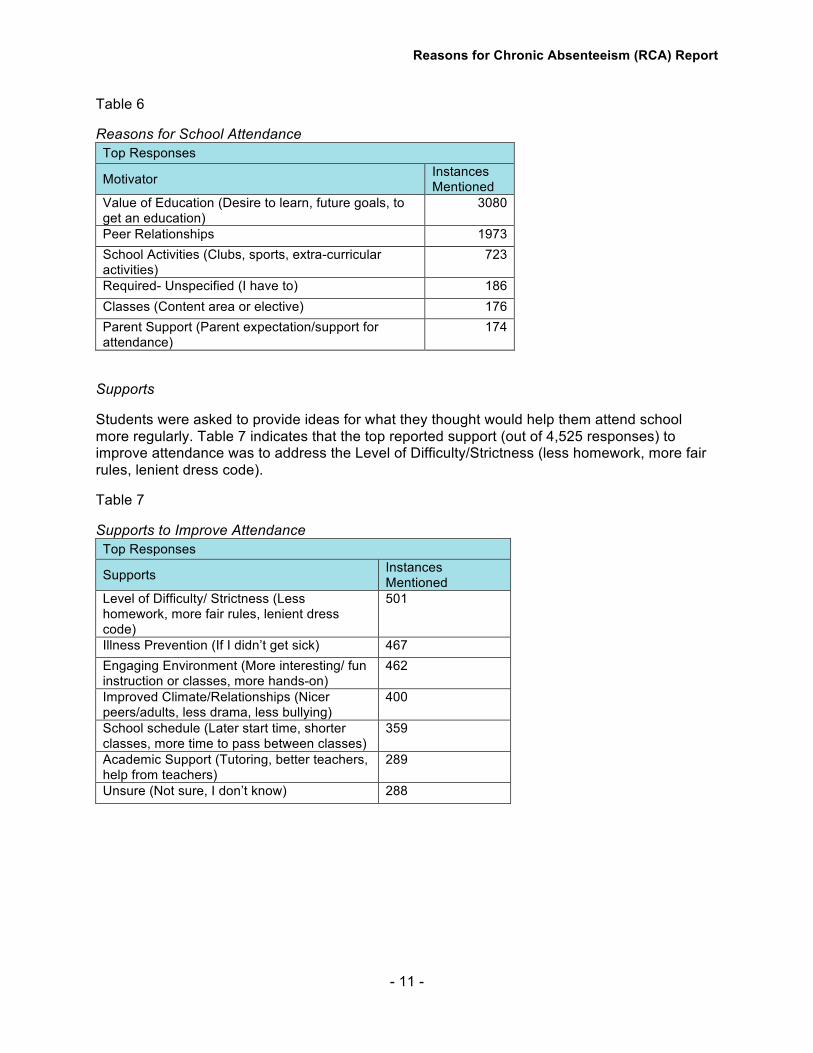
Students were asked to provide ideas for what they thought would help them attend school more regularly. Table 7 indicates that the top reported support (out of 4,525 responses) to improve attendance was to address the Level of Difficulty/Strictness (less homework, more fair rules, lenient dress code).
Table 7
Supports to Improve Attendance Top Responses
Supports Instances Mentioned
Level of Difficulty/ Strictness (Less homework, more fair rules, lenient dress code)
501
Illness Prevention (If I didn’t get sick) 467 Engaging Environment (More interesting/ fun instruction or classes, more hands-on)
462
Improved Climate/Relationships (Nicer peers/adults, less drama, less bullying)
400
School schedule (Later start time, shorter classes, more time to pass between classes)
359
Academic Support (Tutoring, better teachers, help from teachers)
289
Unsure (Not sure, I don’t know) 288
Reasons for Chronic Absenteeism (RCA) Report
- 12 -
Response by Category Health Related
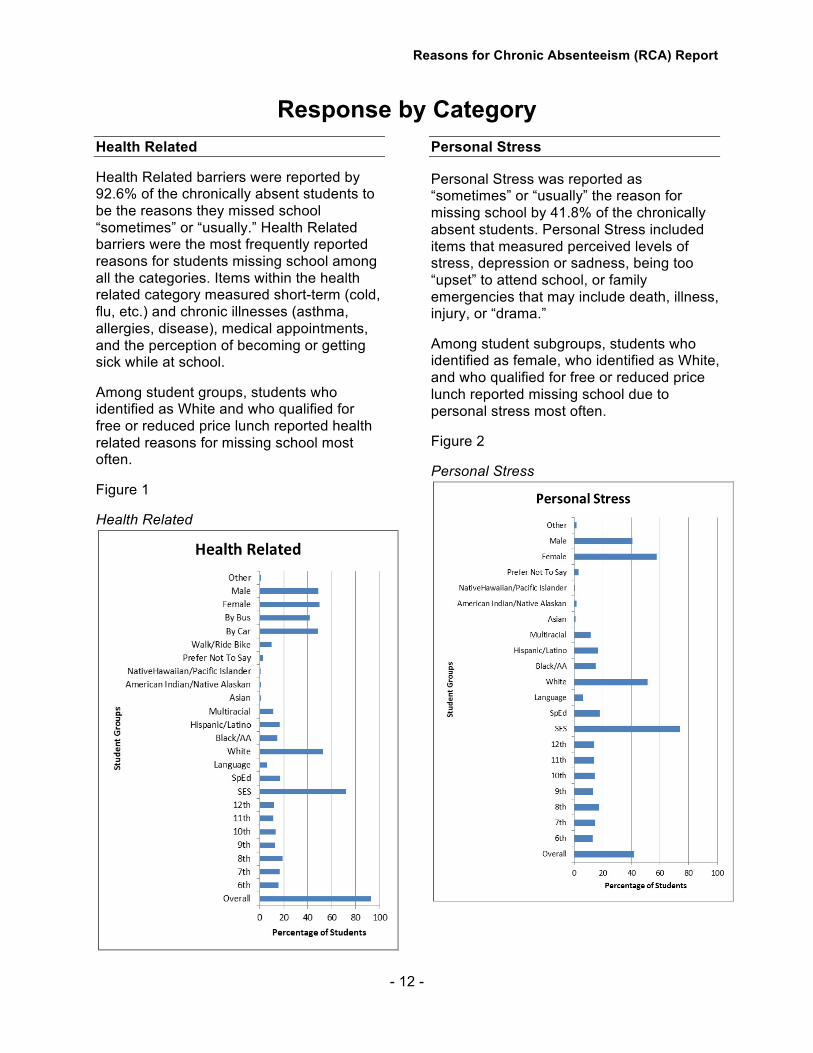
Health Related barriers were reported by 92.6% of the chronically absent students to be the reasons they missed school “sometimes” or “usually.” Health Related barriers were the most frequently reported reasons for students missing school among all the categories. Items within the health related category measured short-term (cold, flu, etc.) and chronic illnesses (asthma, allergies, disease), medical appointments, and the perception of becoming or getting sick while at school.
Among student groups, students who identified as White and who qualified for free or reduced price lunch reported health related reasons for missing school most often.
Figure 1
Health Related
Personal Stress
Personal Stress was reported as “sometimes” or “usually” the reason for missing school by 41.8% of the chronically absent students. Personal Stress included items that measured perceived levels of stress, depression or sadness, being too “upset” to attend school, or family emergencies that may include death, illness, injury, or “drama.”
Among student subgroups, students who identified as female, who identified as White, and who qualified for free or reduced price lunch reported missing school due to personal stress most often.
Figure 2
Personal Stress
Reasons for Chronic Absenteeism (RCA) Report
- 13 -
Physical Safety/Conflict
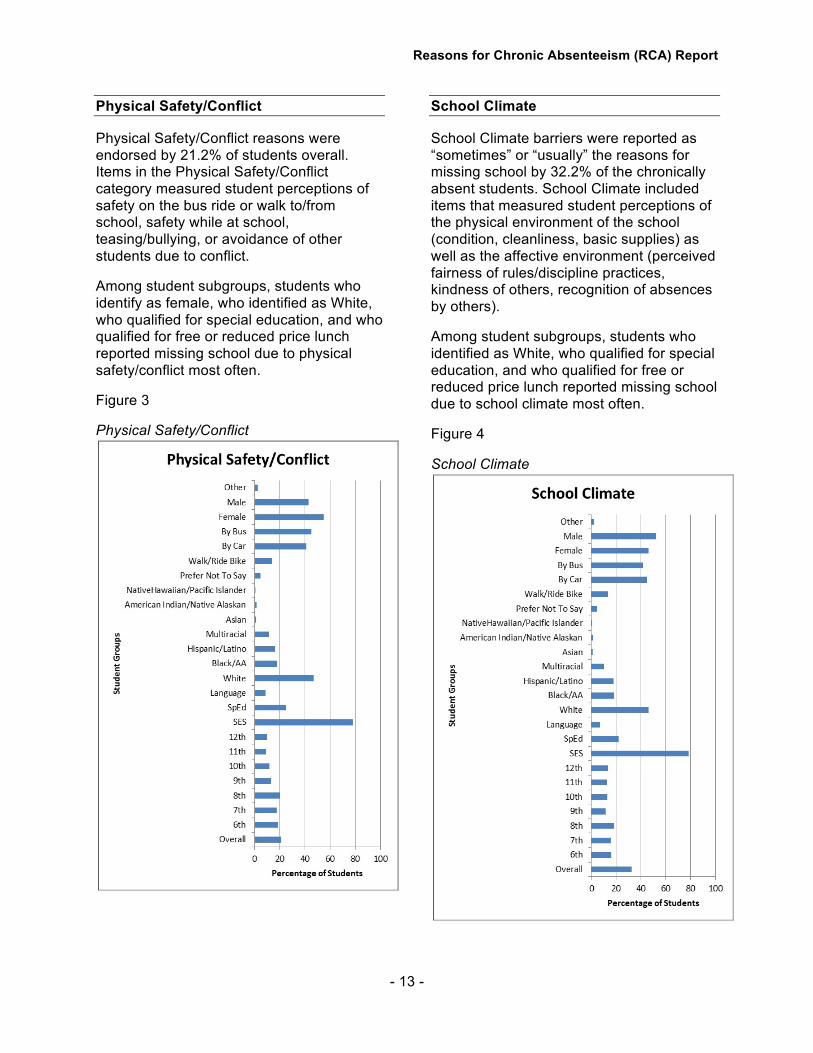
Physical Safety/Conflict reasons were endorsed by 21.2% of students overall. Items in the Physical Safety/Conflict category measured student perceptions of safety on the bus ride or walk to/from school, safety while at school, teasing/bullying, or avoidance of other students due to conflict.
Among student subgroups, students who identify as female, who identified as White, who qualified for special education, and who qualified for free or reduced price lunch reported missing school due to physical safety/conflict most often.
Figure 3
Physical Safety/Conflict
School Climate
School Climate barriers were reported as “sometimes” or “usually” the reasons for missing school by 32.2% of the chronically absent students. School Climate included items that measured student perceptions of the physical environment of the school (condition, cleanliness, basic supplies) as well as the affective environment (perceived fairness of rules/discipline practices, kindness of others, recognition of absences by others).
Among student subgroups, students who identified as White, who qualified for special education, and who qualified for free or reduced price lunch reported missing school due to school climate most often.
Figure 4
School Climate
Reasons for Chronic Absenteeism (RCA) Report
- 14 -
School Stress
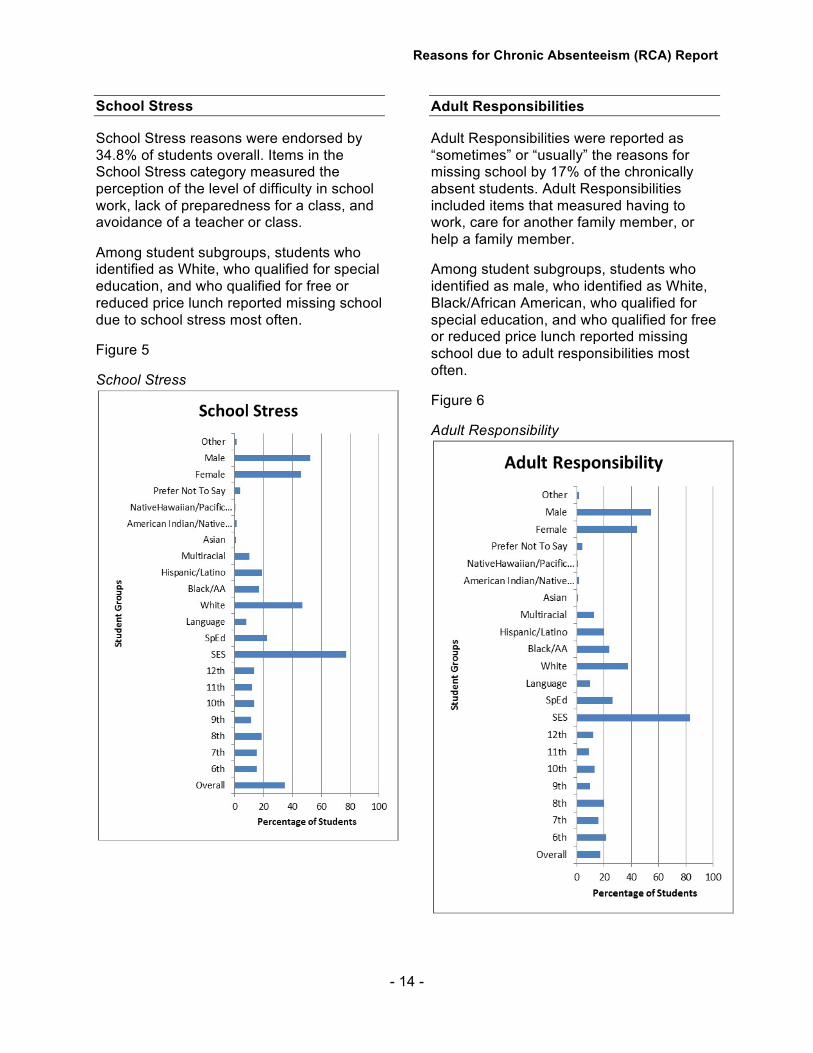
School Stress reasons were endorsed by 34.8% of students overall. Items in the School Stress category measured the perception of the level of difficulty in school work, lack of preparedness for a class, and avoidance of a teacher or class.
Among student subgroups, students who identified as White, who qualified for special education, and who qualified for free or reduced price lunch reported missing school due to school stress most often.
Figure 5
School Stress
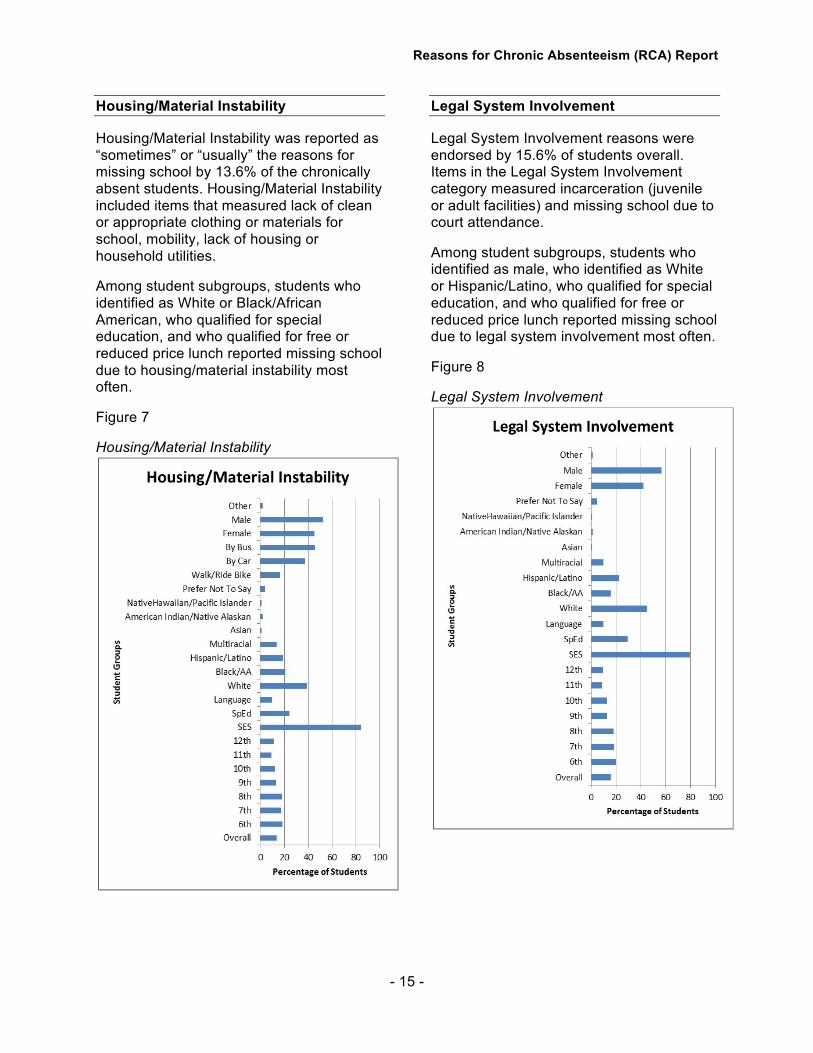
Adult Responsibilities
Adult Responsibilities were reported as “sometimes” or “usually” the reasons for missing school by 17% of the chronically absent students. Adult Responsibilities included items that measured having to work, care for another family member, or help a family member.
Among student subgroups, students who identified as male, who identified as White, Black/African American, who qualified for special education, and who qualified for free or reduced price lunch reported missing school due to adult responsibilities most often.
Figure 6
Adult Responsibility
Reasons for Chronic Absenteeism (RCA) Report
- 15 -
Housing/Material Instability
Housing/Material Instability was reported as “sometimes” or “usually” the reasons for missing school by 13.6% of the chronically absent students. Housing/Material Instability included items that measured lack of clean or appropriate clothing or materials for school, mobility, lack of housing or household utilities.
Among student subgroups, students who identified as White or Black/African American, who qualified for special education, and who qualified for free or reduced price lunch reported missing school due to housing/material instability most often.
Figure 7
Housing/Material Instability
Legal System Involvement
Legal System Involvement reasons were endorsed by 15.6% of students overall. Items in the Legal System Involvement category measured incarceration (juvenile or adult facilities) and missing school due to court attendance.
Among student subgroups, students who identified as male, who identified as White or Hispanic/Latino, who qualified for special education, and who qualified for free or reduced price lunch reported missing school due to legal system involvement most often.
Figure 8
Legal System Involvement
Reasons for Chronic Absenteeism (RCA) Report
- 16 -
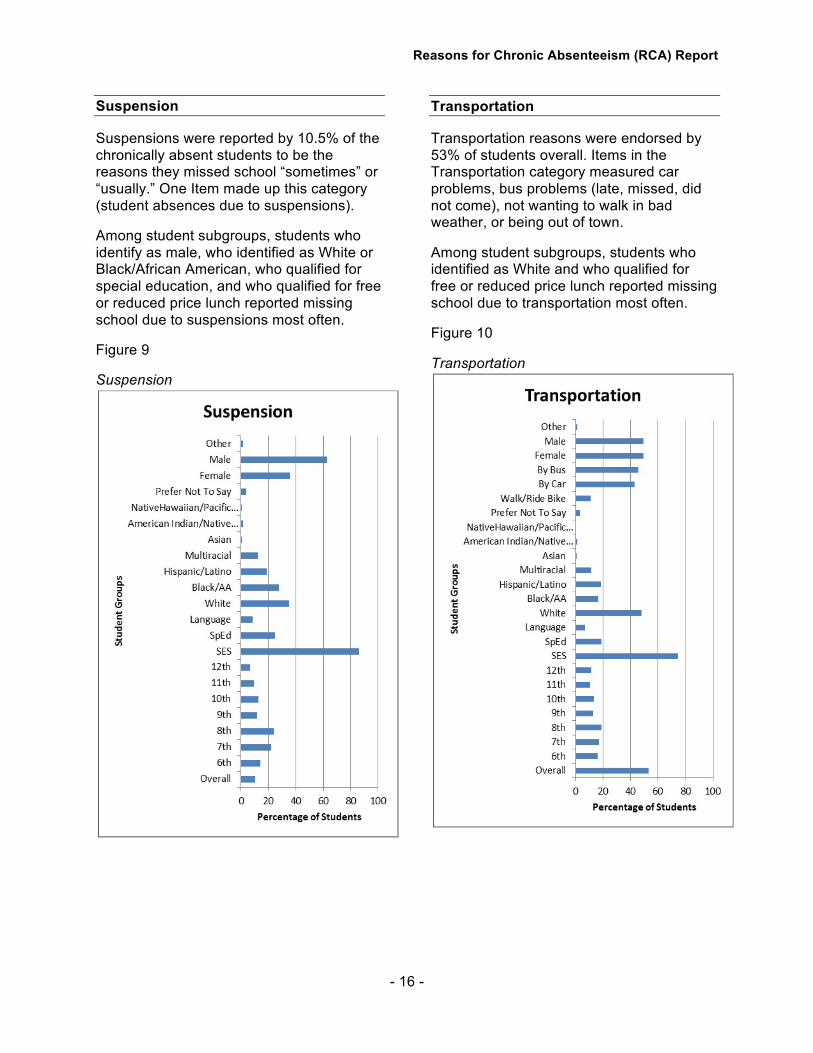
Suspension
Suspensions were reported by 10.5% of the chronically absent students to be the reasons they missed school “sometimes” or “usually.” One Item made up this category (student absences due to suspensions).
Among student subgroups, students who identify as male, who identified as White or Black/African American, who qualified for special education, and who qualified for free or reduced price lunch reported missing school due to suspensions most often.
Figure 9
Suspension
Transportation
Transportation reasons were endorsed by 53% of students overall. Items in the Transportation category measured car problems, bus problems (late, missed, did not come), not wanting to walk in bad weather, or being out of town.
Among student subgroups, students who identified as White and who qualified for free or reduced price lunch reported missing school due to transportation most often.
Figure 10
Transportation
Reasons for Chronic Absenteeism (RCA) Report
- 17 -
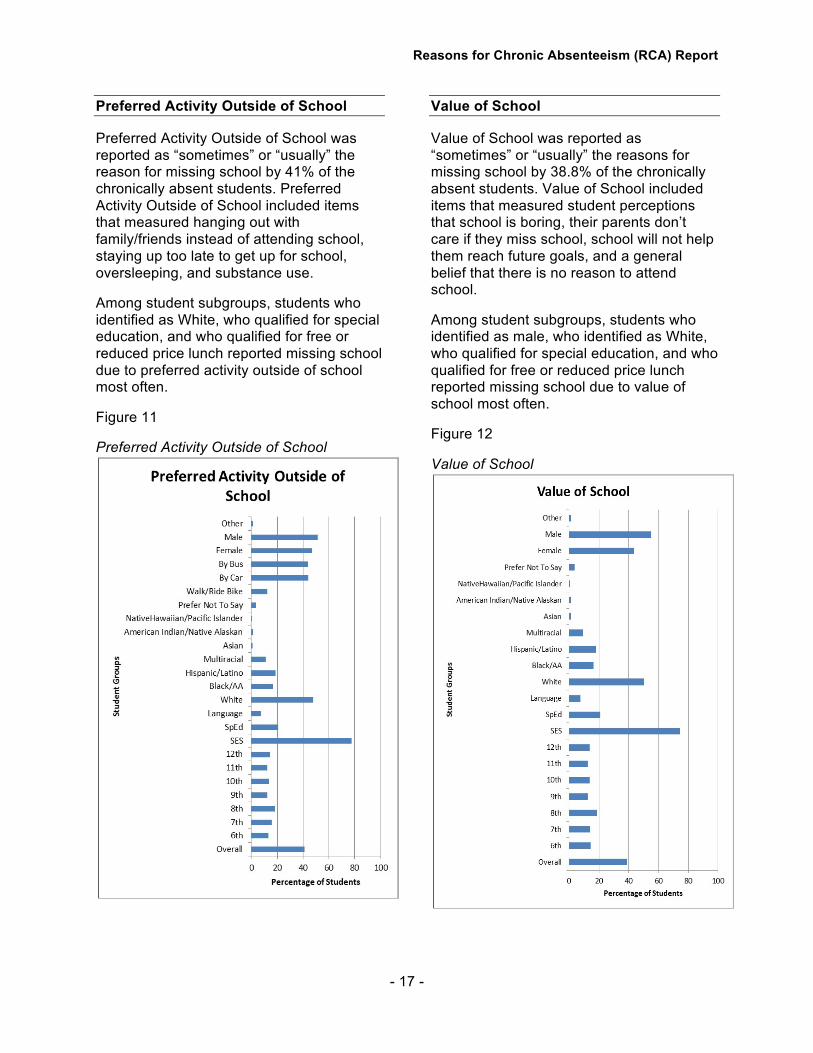
Preferred Activity Outside of School
Preferred Activity Outside of School was reported as “sometimes” or “usually” the reason for missing school by 41% of the chronically absent students. Preferred Activity Outside of School included items that measured hanging out with family/friends instead of attending school, staying up too late to get up for school, oversleeping, and substance use.
Among student subgroups, students who identified as White, who qualified for special education, and who qualified for free or reduced price lunch reported missing school due to preferred activity outside of school most often.
Figure 11
Preferred Activity Outside of School
Value of School
Value of School was reported as “sometimes” or “usually” the reasons for missing school by 38.8% of the chronically absent students. Value of School included items that measured student perceptions that school is boring, their parents don’t care if they miss school, school will not help them reach future goals, and a general belief that there is no reason to attend school.
Among student subgroups, students who identified as male, who identified as White, who qualified for special education, and who qualified for free or reduced price lunch reported missing school due to value of school most often.
Figure 12
Value of School

Reasons for Chronic Absenteeism (RCA) Report
- 18 -
Summary This report includes data on reasons for chronic absenteeism provided by over 5,700 chronically absent students in the United States. Below is a summary of the major findings from the survey. Each summary is followed by questions for stakeholders who engage in state- and/or national-level work to consider. Specifically, questions regarding the role of states and national and state organizations focused on attendance issues in supporting districts and schools to address students’ perceptions of chronic absenteeism and to address barriers to students attending school consistently are provided.
One of the most basic strategies to begin to address concerning behaviors is to build general awareness of the behavior and the extent to which it deviates from standard levels of acceptability. Based on the responses to the items measuring perceptions of absences, it appears that students may be largely unaware of their own rate of absenteeism over time and misperceive what typical or acceptable rates of absenteeism are among secondary students.
Many states are wrestling with how to respond to the multifaceted reasons for chronic absenteeism through both policy and practice. Rafa3 outlines four areas for state action: attendance improvement plans, public awareness initiatives, data usage and early warning systems, and school improvement efforts. Rafa also highlights implementation examples to highlight recommended policy changes. The reader is encouraged to review Rafa’s recommendations when considering the questions below that we are raising given the findings from the RCA survey.
Big Idea Question 1: What are the implications of this study for state-level policy, regulation development, and implementation guidance?
When answering this question, we encourage the reader to consider a number of additional questions that should inform their response.
• How can state-level plans address attendance/chronic absenteeism? • How can district-level plans address attendance/chronic absenteeism? • To what extent would consistent definitions of a day of schooling, what constitutes an
absence (e.g., full day versus partial day), and what constitutes chronic absenteeism (e.g., number of days) facilitate access to quality data to inform planning and problem-solving efforts?
• Should consistent state-wide data collection and reporting tools/systems (e.g. Early Warning Systems) be used to facilitate access to and use of data related to absenteeism?
• Should state led or supported public awareness campaigns be used to increase general knowledge about the issue?
• How can cross-sector (Community Physical and Mental Health, Juvenile Justice, Housing and Urban Development, Transportation, Education, Child Advocacy, Homelessness, etc.) task forces be created and supported to comprehensively address the multifaceted needs of students who are chronically absent?
Many national and state-level organizations will be critical for supporting states in analyzing chronic absenteeism and in supporting intervention. Given the existing research on chronic
3 Rafa, A. (2017). Chronic absenteeism: A key indicator of student success. Education Commission of the States.
Reasons for Chronic Absenteeism (RCA) Report
- 19 -
absenteeism and what we learned from the RCA, we encourage readers involved with professional organizations that address absenteeism issues to consider the following questions.
Big Idea Question 2: What is the role of national and state organizations in supporting districts and schools to address chronic absenteeism?
Additional questions for consideration:
• What can professional organizations do to lobby federal and state policy makers for effective policy related to measuring and addressing chronic absenteeism?
• What information can be provided to policy makers to aide with consistent definitions of a day of schooling, what constitutes an absence, what constitutes chronic absenteeism?
• How can professional organizations facilitate or support research to better understand the prevalence and patterns of chronic absenteeism among PreK-12 students as well as evidence-based interventions?
• How can professional organizations facilitate or support research to better understand the prevalence and patterns of chronic absenteeism among student subgroups (e.g. students with disabilities, students from economically disadvantaged households, etc.) as well as effective evidence-based interventions?
• What is the role of professional organizations in building awareness of absenteeism rates and implications among students, families, and community stakeholders?
• How can association stakeholders build awareness or correct misperceptions of what constitutes typical or acceptable rates of absenteeism among students and families?
• How can professional association leaders develop cross-sector partnerships to address chronic absenteeism?
• How can family and community engagement to address chronic absenteeism be cultivated?
The top reported reasons for chronic absenteeism among students were related to health (short-term illness, chronic illness, and medical/dental/mental health appointments), transportation (missing the bus, car problems, not wanting to walk in bad weather, and being out-of-town), personal stress (depression/sadness, stressed/upset, family emergencies), preferred activity outside of school (hung-out with family/friends, stayed-up too late/overslept, substance use), and value of school (perceptions that school is boring, no reason to come to school, belief that school will not help reach future goals, perception that parents don’t care if absent from school).
The students provided ideas for supports to improve attendance that included decreased level of difficulty/strictness (less homework, more fair/consistent rules, more lenient dress codes), engaging environments (more interesting/fun/relevant/hands-on classes or instruction), illness prevention (not getting sick), improved climate/relationships (nicer peers or adults, less “drama”, less bullying, school schedule (later start time, shorter classes, more time to pass between classes), and academic support (tutoring, better instruction, additional help from teachers). In order to address the multifaceted needs of students who are chronically absent through the provision of comprehensive supports, districts and schools will need to partner with a variety of stakeholders. State regulatory agencies, state and national organizations, and technical assistance providers that address chronic absenteeism should consider how to best collaborate with districts and schools to intervene effectively.
Reasons for Chronic Absenteeism (RCA) Report
- 20 -
Big Idea Question 3: What is the role of state regulatory agencies, national and state organizations, and technical assistance providers in supporting districts’ and schools’ efforts to improve chronic absenteeism rates?
A few considerations for areas of focus include:
• Focusing on evidence-based practices for physical and mental health promotion and wellness
• Developing community partnerships to support physical and mental health promotion and wellness
• Utilizing evidence-based practices for developing school schedules (start times, structures for academic support during the school day, etc.)
• Developing systems for alternative methods to get students to school when their primary transportation mode is not an option (missed bus, car problems, unsafe routes to school, etc.)
• Engaging with family and community partners to facilitate access to services • Designing universal instruction through various means (Lesson Study, Universal
Design for Learning, data-driven professional learning communities, etc.) that is meaningful, engaging, and relevant for all students
• Developing multi-tiered systems of support to address the academic, behavioral and social-emotional needs of all students
Recommended