Realistic Load Testing of Web Applications
Dirk DraheimInstitute of Computer Science
Freie Universitat BerlinTakustr.9, 14195 Berlin, Germany
John Grundy, John Hosking,Christof Lutteroth, Gerald WeberDepartment of Computer Science
The University of Auckland38 Princes Street, Auckland 1020, New Zealand{john-g,john,lutteroth,gerald}@cs.auckland.ac.nz
Abstract
We present a new approach for performing load testingof web applications by simulating realistic user behaviourwith stochastic form-oriented analysis models. Realism inthe simulation of user behaviour is necessary in order toachieve valid testing results. In contrast to many other usermodels, web site navigation and time delay are modelledstochastically. The models can be constructed from sam-ple data and can take into account effects of session historyon user behaviour and the existence of different categoriesof users. The approach is implemented in an existing ar-chitecture modelling and performance evaluation tool andis integrated with existing methods for forward and reverseengineering.
1 Introduction
Web applications are ubiquitous and need to deal with alarge number of users. Due to their exposure to end users,especially customers, web applications have to be fast andreliable, as well as up-to-date. However, delays during theusage of the Internet are common and have been the focusof interest in different studies [2, 6]. The demands on a website can change very rapidly due to different factors, such asvisibility in search engines or on other web sites. Load test-ing is thus an important practice for making sure a web sitemeets those demands and for optimizing its different com-ponents [1]. Continual evolution of web applications is achallenge for the engineering of this class of software appli-cation. After each maintenance cycle, a convincing perfor-mance test must include a test of the full application underrealistic loading conditions. In [16] it is recommended thatload testing of a web site should be performed on a regularbasis in order to make sure that IT infrastructure is provi-sioned adequately, particularly with regard to changing userbehaviour and web site evolution. Also other experiences
stress the importance of load testing for the prediction andavoidance of service-affecting performance problems [23]at earlier stages of a web site’s life cycle.
However, realism in the simulation of user behaviourfor the purpose of load testing has been found to be cru-cial [29, 1]. “A load test is valid only if virtual users’ be-haviour has characteristics similar to those of actual users”because “failure to mimic real user behaviour can generatetotally inconsistent results” [16]. Most current tools for loadtesting support the creation of simple test cases consistingof a fixed sequence of operations. However, in order to givethe generated load some variety it is usually necessary tomodify and parametrize these test cases manually. This isusually both time-consuming and difficult. A more elabo-rate approach is needed in order to generate a realistic load,and such an approach requires more advanced tool support.
Our approach applies the methodology of form-orientedanalysis [9], in which user interaction with a sub-mit/response style system is modelled as a bipartite statetransition diagram. The model used in form-oriented analy-sis is technology-independent and suitable for the descrip-tion of user behaviour. It describes what the user sees on thesystem output, and what he or she provides as input to thesystem. In order to simulate realistic users we extend themodel with stochastic functions that describe navigation,time delays and user input. The resulting stochastic modelof user behaviour can be configured in different ways, e.g.,by analyzing real user data, and can be used to create virtualusers of different complexity. The level of detail of the sto-chastic model can be adjusted continuously. All this enablesour load test tool to generate large sets of representative testcases. Furthermore, our load test tool has its natural placein a chain of tools that support software engineers workingon web applications. Those other tools also use the form-oriented model and thus help a software engineer to reuseor recover a web site’s model for load testing.
Sect. 2 gives an overview of the methodology of form-oriented analysis that we use throughout the paper. Sect. 3
1
explains how this methodology can be applied in order toperform realistic simulation of web site users. Sect. 4 pro-vides some information about how load tests are actuallyperformed and delineates the whole picture of load testing;Sect. 5 explains the parameters used to describe workloads.Sect. 6 discusses related work, and Sect. 7 concludes thepaper.
2 The Form-Oriented Model
Form-oriented analysis [9] is a methodology for thespecification of ultra-thin client based systems. Form-oriented models describe a web application as a typed, bi-partite state machine which consists of pages, actions andtransitions between them. Pages can be understood as setsof screens, which are single instances of a particular pageas they are seen by the user in the web browser. The screensof a page are conceptually similar, but their content mayvary, e.g., in the different instances of the welcome page ofa system, which may look different depending on the user.Each page contains an arbitrary number of forms, which inturn can have an arbitrary number of fields. The fields offorms usually allow users to enter information, and eachform offers a way to submit the information that has beenentered into its fields to the system. A submission invokesan action on the server side, which processes the submit-ted information and returns to the client a new screen inresponse. Hyperlinks are forms with no fields or only fieldsthat are hidden to the user.
Form-oriented models can be visualized using form-charts. In a formchart the pages are represented as ovalsand the actions as boxes, while the transitions between themare represented as arrows, forming a directed graph. Form-charts are bipartite directed graphs, meaning that on eachpath pages and actions occur alternatingly. This partition-ing of states and transitions creates a convenient distinctionbetween system side and user side: the page/server transi-tions always express user behaviour, while the server/pagetransitions always express system behaviour.
In Fig. 1 we see the formchart of a simple home bankingsystem, which will be the running example of this paper.The system starts showing page Login to a user, who canenter an account number and access code. This data is sub-mitted to action Verify, which checks if it is correct and ei-ther redirects the user back to the Login page or to the Menupage of the home banking system. Here the user can accessthe different functions, i.e., showing the account’s status,making transfers, trading bonds, and logging out. Each ofthe functions may involve different subsystems and makeuse of different technical resources.
A form-oriented model of a web application offers sev-eral benefits. It is suitable for testing as well as for theanalysis and development of dynamic web applications. A
Login
EditTransfer
Menu
Status
Depot
Verify
Show Status
MakeTransfer
Invest
Buy Bond
SellBond
ConfirmTransfer
Logout
Cancel
Figure 1. Formchart of example home bank-ing web application.
typical shortcoming of many other models is that they donot capture fan-out of server actions, i.e., the ability of aserver action to deliver many conceptually different clientpages, which is covered by the form-oriented model.
3 Modelling User Behaviour with StochasticFormcharts
Formcharts specify web applications, which usuallywork in a strictly deterministic manner. In a load testingscenario, however, the web application already exists, andthe problem is to simulate the behaviour of a large numberof users. But just as a formchart is a specification of the webapplication, it is also a specification of possible user behav-iour; and while it is the web application that chooses in anaction which page will come next and which data will beshown on the page, it is the user who chooses which of theavailable actions will be invoked afterwards and which datathe action will get. In other words, when simulating userswe have to model their navigational choices and the inputthey enter. Since we are aiming at real-time simulation, wealso need to model the timing of user behaviour. In the caseof web applications, this can be reduced to a model of userresponse time or “think time”, i.e., the time delay betweenreception of a screen and submission of a form. Since thefine-grained interaction involved in user input happens atthe client side, transparent to the server, we do not model it.
We cannot predict user behaviour as we can predict thebehaviour of a web application. Therefore, we use a sto-chastic model, which makes only assumptions about theprobability of a particular user behaviour and not aboutwhich behaviour will actually occur. When estimating suchprobabilities, it can be important to take into account thesession history of a user, which may influence the deci-sion about the next step. For example, a user that has just
2

logged into the system is unlikely to log out immediately af-terwards, but much more likely to log out after he or she didother things. Consequently, we are dealing with conditionalprobabilities.
The essential decision that a user makes on every pageis about which form he or she will use. This affects muchof the behaviour that will follow, so in our simulation weshould make this decision first. There is always a limitednumber of forms on a page, and the question is how proba-ble it is for each form to be chosen. This is expressed byprobability distribution Pform, which also takes into ac-count the session history. Histories is the set of all pos-sible session histories, and Forms is the set of all forms. Aform that is not available at a certain point in session historyhas probability 0; if there is only a single form available, ithas probability 1.
Pform:Histories × Forms → [0, 1]
Once a form is chosen, we estimate a delay. This is donewith pdelay. Time is a continuous variable, therefore pdelay
is not a discrete probability distribution but a probabilitydensity function.
pdelay:Histories × Forms × (0,∞) → R+
Again, we acknowledge that the session history may havean influence on delay time, but we expect this effect tobe much weaker than the effect of history on form choice.Therefore, we might simplify our model by neglecting ses-sion history. In our example, the delay probability densitygraphs for the forms on page Menu that lead to actions Lo-gout, Status, Make Transfer and Invest, respectively, couldlook like the ones in Fig. 2.
One of the more complex tasks is the generation of inputdata for the fields of the chosen form. Pinput is a discreteprobability distribution that describes the probability thatcertain data is entered into the form. Data is the universeof possible data, and if some particular data in it cannot beentered into a form, the value of Pinput is 0.
Pinput:Histories × Forms × Data → [0, 1]
Also Pinput depends on the session history. If, for example,the user needs a secret one-off transaction number (TAN)to add additional security to each transaction, such a TANis only used once, hence the probability for that TAN to beused again shrinks. However, usually we can neglect theeffect of session history on user input and use some sim-ple logic instead in order to cope with such dependencies.Approaches for the generation of form input exist and havebeen discussed, for example, in [8, 3, 7].
Depending on the data we have about real user behav-iour, there are different possibilities for us to configure theuser model. In some cases, e.g., when the system we want
05
101520
253035
4045
0 5 10 15
Logout
Show Status
Invest
Make Transfer
Figure 2. Probability densities for the delaycaused with different forms.
to test is new, there might not be any sample of real userdata yet. But when the system has already been used forsome time there might be plenty of empirical historical userbehaviour data. In both cases we try to make the user modelas realistic as possible.
3.1 Repetition Models
After surveying real user session data, we can use it di-rectly by replaying it on the system. Of course, the systemwould usually have to be reset to its original state first be-cause it is not generally possible to play a session, e.g., forselling a bond, twice. We can adjust the load of the sys-tem by changing the time interval in which the sessions arereplayed, or, when a session can be replayed an arbitrarynumber of times, the frequency of repetition. Form-orientedanalysis offers suitable concepts for storing and represent-ing session histories.
For surveying user behaviour we need a suitable in-strument. In [8] we suggested the Revangie tool that can“snoop” on the communication between clients and server.Such a tool could be used for recording real user behaviour.Alternatively, server logs can be used. The problems andprocedures of collecting real user data, and the benefit inthe context of test case generation for functionality testinghas been discussed, for example, in [14].
3.2 History-Free Stochastic Models
As discussed in the previous section, we can simply re-peat real user sessions. But we can also exploit real userdata in order to find suitable parameters for a stochasticmodel. A stochastic model is a more general approach andtherefore more versatile. It is much easier to create newload testing scenarios by adjusting model parameters. Fur-thermore, replaying recorded data might not cause a system
3

Login
EditTransfer
Menu
Status
Depot
Verify
ShowStatus
MakeTransfer
Invest
BuyBond
SellBond
ConfirmTransfer
Logout
1Cancel
0.4
0.2
0.20.2
1
0.3
0.3
0.4
0.9
0.1
Figure 3. Simple stochastic formchart for thehome banking system.
load that is representative. To create a representative repe-tition model requires a random sample of real user sessionswith a sufficient size. If this is not given, the model mightsimply fail to cover the variety of possible input behaviourwell enough, which might result in flaws of the system re-maining undetected. In contrast to that, load testing witha stochastic model uses a randomized algorithm, which isgenerally less prone to yield tendentious results.
If we have data about how many times each form hasbeen submitted, i.e., the total usage frequency of each form,we can use this to approximate Pform. The probability ofa form to be chosen is set to the relative usage frequency,i.e., the number of usages of that form divided by the sumof the numbers of usages for all the forms on that page.This neglects the effect of session history on Pform andproduces a stochastic formchart like the one in Fig. 3. Inthis formchart all page-action transitions are annotated witha transition probability, which reflects function Pform. Ateach page, the probabilities of all outgoing transitions sumup to 1 or possibly a bit less, with the remaining probabilityreserved for abrupt termination of the session. The tran-sitions from actions to pages are performed by the systemand therefore need no annotation. The problem of choosingtransition probabilities for similar stochastic models is alsodiscussed in [13, 27].
Such stochastic formcharts are similar to Markov chains,but there is a subtle and important difference: while aMarkov chain creates a state machine with probabilities atevery transition, a stochastic formchart is a bipartite statemachine with probabilities only at the transitions goingfrom page to action. Which transition will be chosen fromaction to a page is determined by the logic of the system,which is well-defined. Consequently, it makes no sense forload testing to model also this aspect stochastically and addprobabilities to the action-page transitions, too. We cannotget rid of action-page transitions because an action can have
more than one outgoing transition, such as the action Verify.
3.3 History-Sensitive Stochastic Models
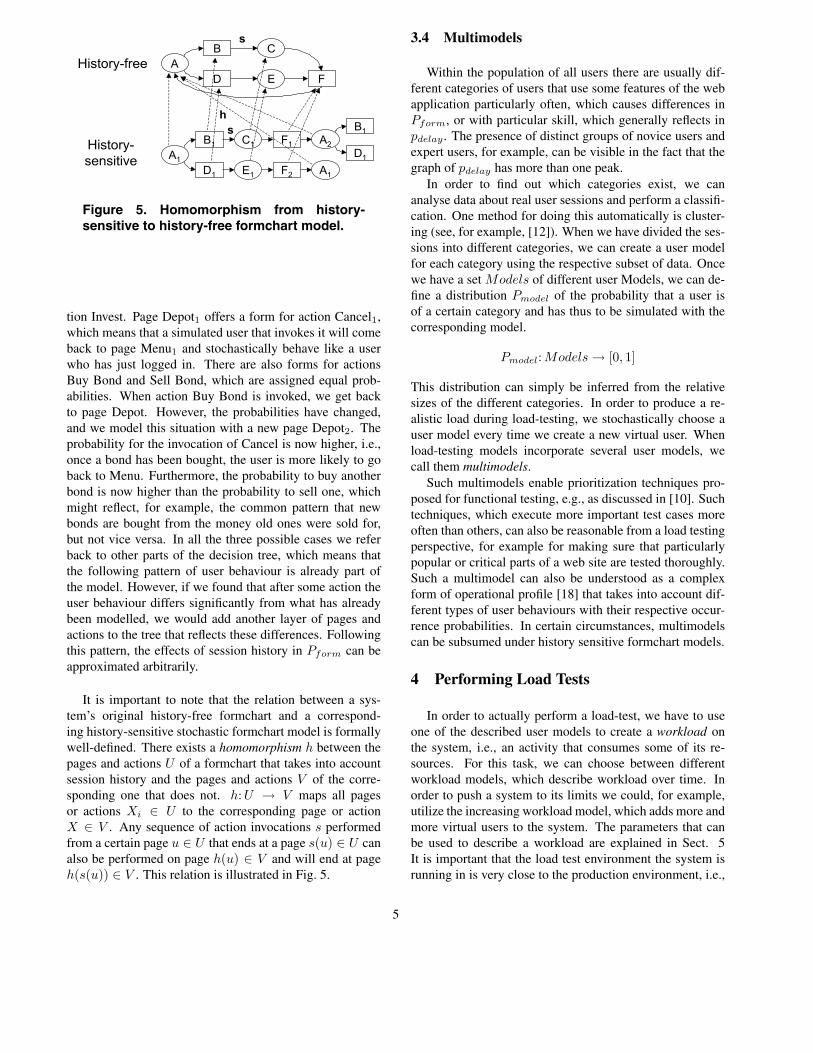
When we have samples of real user sessions and not justunrelated usage frequencies, we are able to create an em-pirical model that takes into account the effects of sessionhistory on Pform. A good method to define Pform with thehelp of this data is a decision tree (see, for example, [12]),which captures the relation between past events and futureones. Each path in the tree is a sequence of pages and ac-tions, alternating, and represents a possible user session ofa certain length. If there are cycles in the original formchartof a system, a corresponding decision tree can have arbi-trary depth, and actions and pages of the original formchartcan occur multiple times. In the decision tree we distin-guish these multiple occurrences of actions and pages bygiving them running indexes. All these actions and pageswith index but the same name correspond to a single actionor page in the original formchart.
Look, for example, at Fig. 4, which shows a possibledecision tree for our home banking system. The root ofthe tree represents the state in which the system starts, i.e.,page Login. Since it is the first occurrence of this page inour tree, we add the index 1 to its name. There is only oneform on page Login, i.e., the form to enter account num-ber and PIN. Logically, the probability that action Verify,which is invoked by that form, is chosen is 1 (or a littlebit less if we would consider abrupt termination). The nexttwo outgoing transitions of Verify are action-page transi-tions and therefore need no probability, as we have dis-cussed in Sect. 3.2. The first of these transitions is cho-sen by the system when the authentication failed and leadsback to page Login1. This page, Login1, is the same as theroot of our tree. Formcharts allow us to visually representactions and pages arbitrarily often, which can be good toavoid ugly transition arrows crossing over the diagram. Ifwe want a page or action to have a certain transition, wecan add a corresponding arrow to any of its correspond-ing bubbles/rectangles. The fact that there is a transitionfrom Verify1 back to Login1 signifies that if the systemchooses to go back to page Login, the user will, with re-gard to Pform, behave stochastically just the same as whenhe or she first entered the system at that page. This equiva-lence of user behaviour also includes future behaviour, i.e.,the probabilities of form choices on pages to come. Weneed this recurrence to states in order to handle cycles inthe original formchart, which could not be represented witha finite decision tree otherwise. On the arrows representingthe outgoing transitions of page Menu1 we see the prob-abilities with which the user chooses different forms justafter he or she logged in. Let us have a closer look at whathappens when the user chooses the form that leads to ac-
4
A
B C
D E F
A1
B1 C1
D1 E1 F2
F1 A2
B1
D1
A1
h
s
s
History-free
History-
sensitive
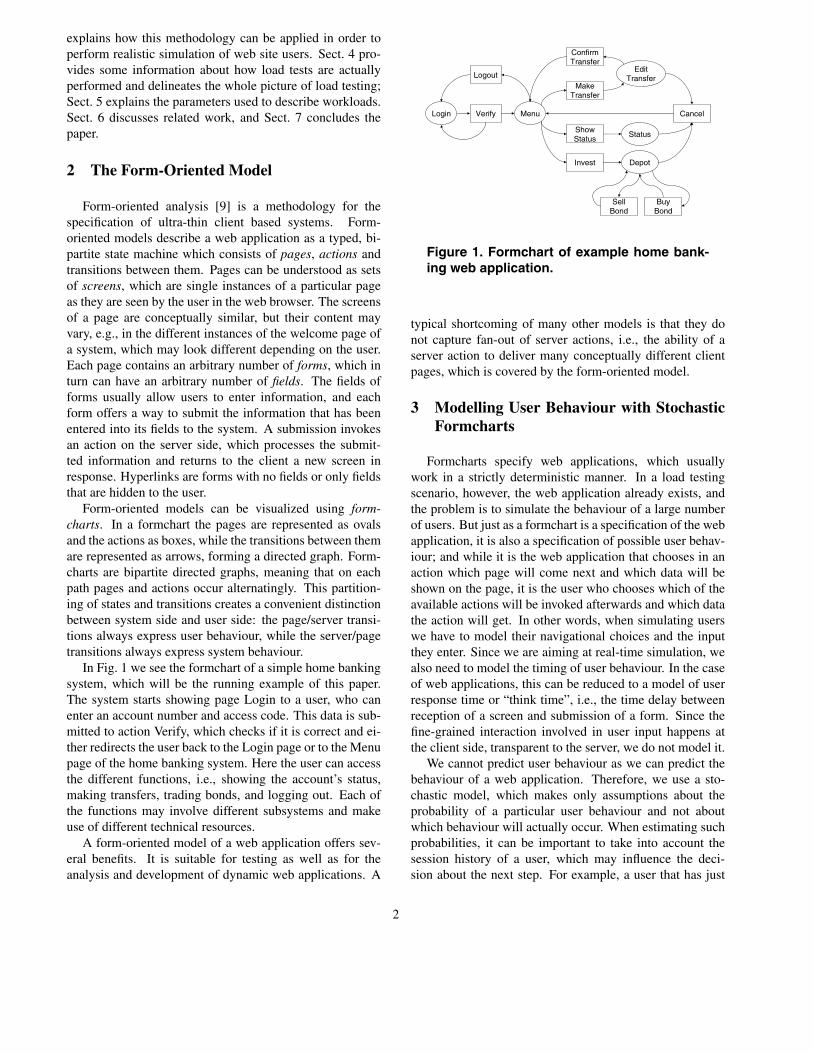
Figure 5. Homomorphism from history-sensitive to history-free formchart model.
tion Invest. Page Depot1 offers a form for action Cancel1,which means that a simulated user that invokes it will comeback to page Menu1 and stochastically behave like a userwho has just logged in. There are also forms for actionsBuy Bond and Sell Bond, which are assigned equal prob-abilities. When action Buy Bond is invoked, we get backto page Depot. However, the probabilities have changed,and we model this situation with a new page Depot2. Theprobability for the invocation of Cancel is now higher, i.e.,once a bond has been bought, the user is more likely to goback to Menu. Furthermore, the probability to buy anotherbond is now higher than the probability to sell one, whichmight reflect, for example, the common pattern that newbonds are bought from the money old ones were sold for,but not vice versa. In all the three possible cases we referback to other parts of the decision tree, which means thatthe following pattern of user behaviour is already part ofthe model. However, if we found that after some action theuser behaviour differs significantly from what has alreadybeen modelled, we would add another layer of pages andactions to the tree that reflects these differences. Followingthis pattern, the effects of session history in Pform can beapproximated arbitrarily.
It is important to note that the relation between a sys-tem’s original history-free formchart and a correspond-ing history-sensitive stochastic formchart model is formallywell-defined. There exists a homomorphism h between thepages and actions U of a formchart that takes into accountsession history and the pages and actions V of the corre-sponding one that does not. h:U → V maps all pagesor actions Xi ∈ U to the corresponding page or actionX ∈ V . Any sequence of action invocations s performedfrom a certain page u ∈ U that ends at a page s(u) ∈ U canalso be performed on page h(u) ∈ V and will end at pageh(s(u)) ∈ V . This relation is illustrated in Fig. 5.
3.4 Multimodels
Within the population of all users there are usually dif-ferent categories of users that use some features of the webapplication particularly often, which causes differences inPform, or with particular skill, which generally reflects inpdelay. The presence of distinct groups of novice users andexpert users, for example, can be visible in the fact that thegraph of pdelay has more than one peak.
In order to find out which categories exist, we cananalyse data about real user sessions and perform a classifi-cation. One method for doing this automatically is cluster-ing (see, for example, [12]). When we have divided the ses-sions into different categories, we can create a user modelfor each category using the respective subset of data. Oncewe have a set Models of different user Models, we can de-fine a distribution Pmodel of the probability that a user isof a certain category and has thus to be simulated with thecorresponding model.
Pmodel:Models → [0, 1]
This distribution can simply be inferred from the relativesizes of the different categories. In order to produce a re-alistic load during load-testing, we stochastically choose auser model every time we create a new virtual user. Whenload-testing models incorporate several user models, wecall them multimodels.
Such multimodels enable prioritization techniques pro-posed for functional testing, e.g., as discussed in [10]. Suchtechniques, which execute more important test cases moreoften than others, can also be reasonable from a load testingperspective, for example for making sure that particularlypopular or critical parts of a web site are tested thoroughly.Such a multimodel can also be understood as a complexform of operational profile [18] that takes into account dif-ferent types of user behaviours with their respective occur-rence probabilities. In certain circumstances, multimodelscan be subsumed under history sensitive formchart models.
4 Performing Load Tests
In order to actually perform a load-test, we have to useone of the described user models to create a workload onthe system, i.e., an activity that consumes some of its re-sources. For this task, we can choose between differentworkload models, which describe workload over time. Inorder to push a system to its limits we could, for example,utilize the increasing workload model, which adds more andmore virtual users to the system. The parameters that canbe used to describe a workload are explained in Sect. 5It is important that the load test environment the system isrunning in is very close to the production environment, i.e.,
5
Verify1Login1
Menu1
Make
Transfer1
Show
Status1
Invest1
Status1
Logout1
Edit
Transfer1
Depot1Buy
Bond1
Sell
Bond1
Confirm
Transfer1
Cancel1
Login1
Cancel1 Menu1
1
0.1
0.5
0.2
0.2
1
0.9
0.1
Cancel1
Menu1
Depot2
Depot1
Buy
Bond1
Sell
Bond1
Cancel1
0.2
0.2
0.6
0.15
0.05
0.85
Login1
Figure 4. History-sensitive formchart model for the home banking system based on a decision tree.
Load Engine
Load Engine
Load Engine
ServerDatabase
NetworkNetwork
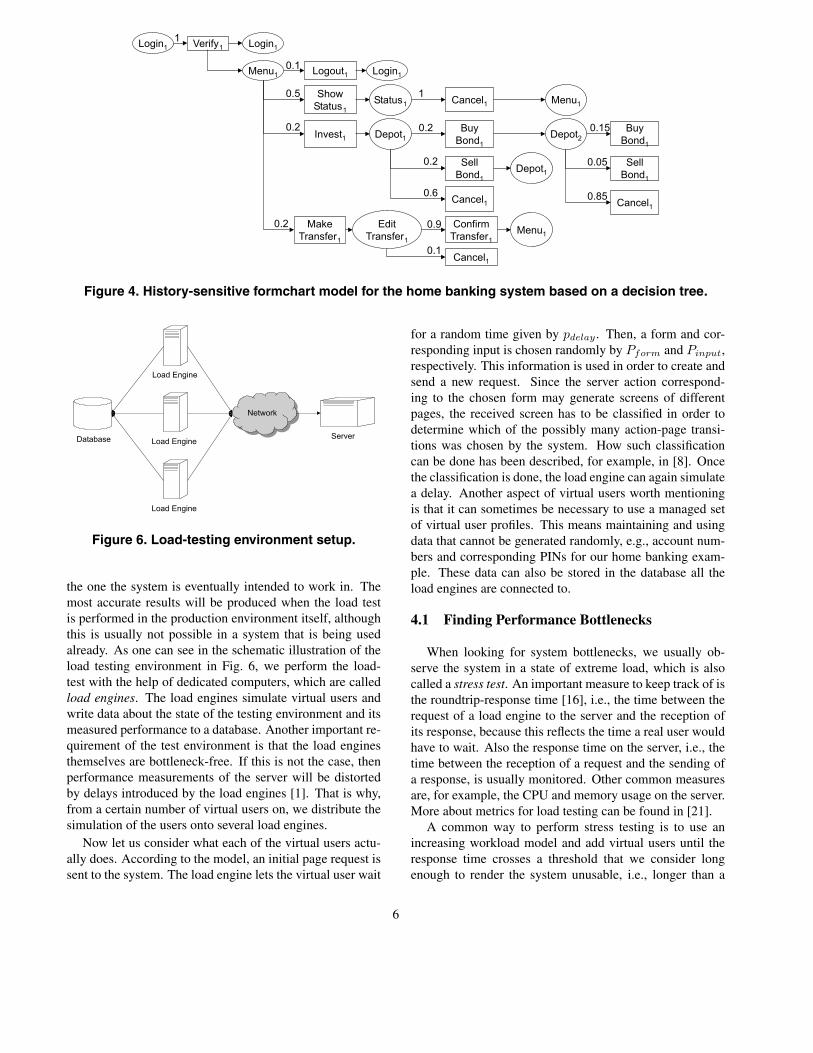
Figure 6. Load-testing environment setup.
the one the system is eventually intended to work in. Themost accurate results will be produced when the load testis performed in the production environment itself, althoughthis is usually not possible in a system that is being usedalready. As one can see in the schematic illustration of theload testing environment in Fig. 6, we perform the load-test with the help of dedicated computers, which are calledload engines. The load engines simulate virtual users andwrite data about the state of the testing environment and itsmeasured performance to a database. Another important re-quirement of the test environment is that the load enginesthemselves are bottleneck-free. If this is not the case, thenperformance measurements of the server will be distortedby delays introduced by the load engines [1]. That is why,from a certain number of virtual users on, we distribute thesimulation of the users onto several load engines.
Now let us consider what each of the virtual users actu-ally does. According to the model, an initial page request issent to the system. The load engine lets the virtual user wait
for a random time given by pdelay. Then, a form and cor-responding input is chosen randomly by Pform and Pinput,respectively. This information is used in order to create andsend a new request. Since the server action correspond-ing to the chosen form may generate screens of differentpages, the received screen has to be classified in order todetermine which of the possibly many action-page transi-tions was chosen by the system. How such classificationcan be done has been described, for example, in [8]. Oncethe classification is done, the load engine can again simulatea delay. Another aspect of virtual users worth mentioningis that it can sometimes be necessary to use a managed setof virtual user profiles. This means maintaining and usingdata that cannot be generated randomly, e.g., account num-bers and corresponding PINs for our home banking exam-ple. These data can also be stored in the database all theload engines are connected to.
4.1 Finding Performance Bottlenecks
When looking for system bottlenecks, we usually ob-serve the system in a state of extreme load, which is alsocalled a stress test. An important measure to keep track of isthe roundtrip-response time [16], i.e., the time between therequest of a load engine to the server and the reception ofits response, because this reflects the time a real user wouldhave to wait. Also the response time on the server, i.e., thetime between the reception of a request and the sending ofa response, is usually monitored. Other common measuresare, for example, the CPU and memory usage on the server.More about metrics for load testing can be found in [21].
A common way to perform stress testing is to use anincreasing workload model and add virtual users until theresponse time crosses a threshold that we consider longenough to render the system unusable, i.e., longer than a
6
user would probably be willing to wait. With the data col-lected by the load engines we are able to analyse the re-sponse time of individual actions. The number of userswhere the response time crosses a certain limit usually dif-fers between the actions, depending on how much they areinvoked and the technical resources they are driven by. Ac-tions for which this limit is crossed early present a bottle-neck of the system and usually allow us to draw conclusionsabout the underlying subsystem.
4.2 Load Testing of Legacy Systems
Often we face the task of load testing a legacy system,i.e., a system which is already deployed and running, andfor which the information necessary to create a realistic usermodel is not available. In such a case we could either usea very simple user model, such as a generic one that in-vokes actions randomly with a uniform distribution, or tryto extract the necessary information by means of reverseengineering. In [8] we proposed a methodology and a toolcalled Revangie which is able to reconstruct form-orientedanalysis models for existing web applications. Models canbe constructed online, i.e., during system exploration, butalso offline, e.g., from recorded user data. There also existother tools for model recovery of web sites that can be use-ful for the creation of load models, e.g., the ones describedin [3].
4.3 Load Testing in the MaramaMTE Tool
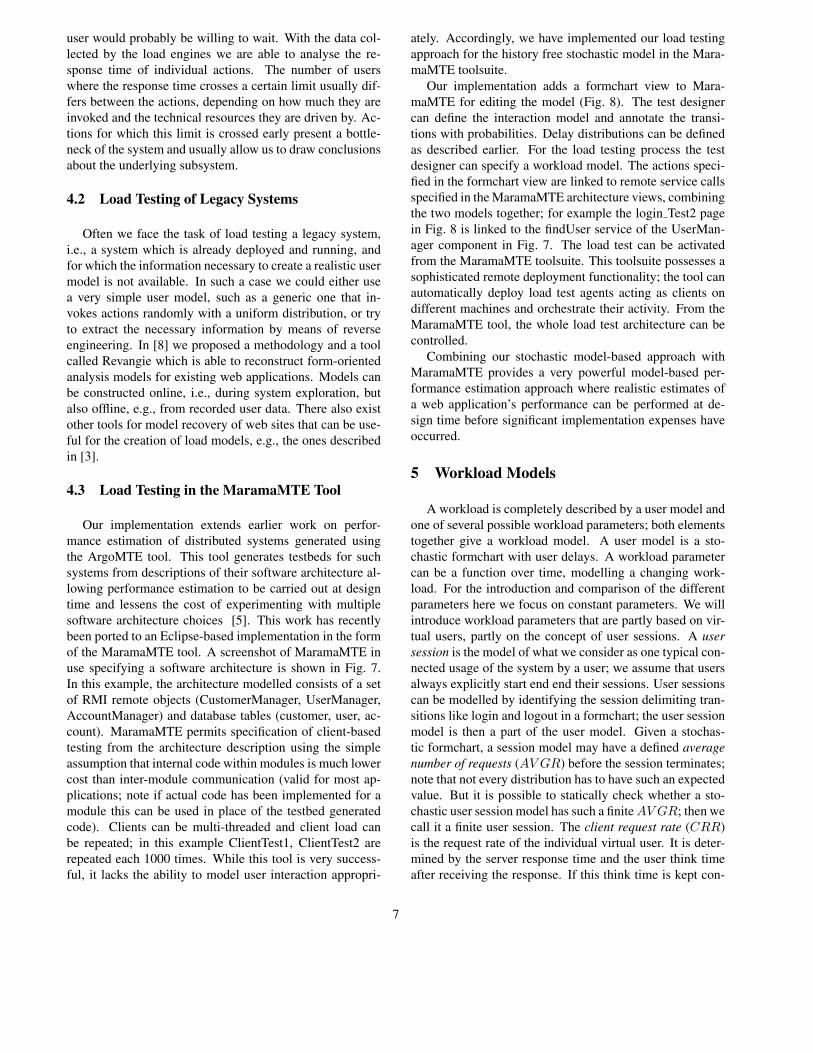
Our implementation extends earlier work on perfor-mance estimation of distributed systems generated usingthe ArgoMTE tool. This tool generates testbeds for suchsystems from descriptions of their software architecture al-lowing performance estimation to be carried out at designtime and lessens the cost of experimenting with multiplesoftware architecture choices [5]. This work has recentlybeen ported to an Eclipse-based implementation in the formof the MaramaMTE tool. A screenshot of MaramaMTE inuse specifying a software architecture is shown in Fig. 7.In this example, the architecture modelled consists of a setof RMI remote objects (CustomerManager, UserManager,AccountManager) and database tables (customer, user, ac-count). MaramaMTE permits specification of client-basedtesting from the architecture description using the simpleassumption that internal code within modules is much lowercost than inter-module communication (valid for most ap-plications; note if actual code has been implemented for amodule this can be used in place of the testbed generatedcode). Clients can be multi-threaded and client load canbe repeated; in this example ClientTest1, ClientTest2 arerepeated each 1000 times. While this tool is very success-ful, it lacks the ability to model user interaction appropri-
ately. Accordingly, we have implemented our load testingapproach for the history free stochastic model in the Mara-maMTE toolsuite.
Our implementation adds a formchart view to Mara-maMTE for editing the model (Fig. 8). The test designercan define the interaction model and annotate the transi-tions with probabilities. Delay distributions can be definedas described earlier. For the load testing process the testdesigner can specify a workload model. The actions speci-fied in the formchart view are linked to remote service callsspecified in the MaramaMTE architecture views, combiningthe two models together; for example the login Test2 pagein Fig. 8 is linked to the findUser service of the UserMan-ager component in Fig. 7. The load test can be activatedfrom the MaramaMTE toolsuite. This toolsuite possesses asophisticated remote deployment functionality; the tool canautomatically deploy load test agents acting as clients ondifferent machines and orchestrate their activity. From theMaramaMTE tool, the whole load test architecture can becontrolled.
Combining our stochastic model-based approach withMaramaMTE provides a very powerful model-based per-formance estimation approach where realistic estimates ofa web application’s performance can be performed at de-sign time before significant implementation expenses haveoccurred.
5 Workload Models
A workload is completely described by a user model andone of several possible workload parameters; both elementstogether give a workload model. A user model is a sto-chastic formchart with user delays. A workload parametercan be a function over time, modelling a changing work-load. For the introduction and comparison of the differentparameters here we focus on constant parameters. We willintroduce workload parameters that are partly based on vir-tual users, partly on the concept of user sessions. A usersession is the model of what we consider as one typical con-nected usage of the system by a user; we assume that usersalways explicitly start end end their sessions. User sessionscan be modelled by identifying the session delimiting tran-sitions like login and logout in a formchart; the user sessionmodel is then a part of the user model. Given a stochas-tic formchart, a session model may have a defined averagenumber of requests (AV GR) before the session terminates;note that not every distribution has to have such an expectedvalue. But it is possible to statically check whether a sto-chastic user session model has such a finite AV GR; then wecall it a finite user session. The client request rate (CRR)is the request rate of the individual virtual user. It is deter-mined by the server response time and the user think timeafter receiving the response. If this think time is kept con-
7
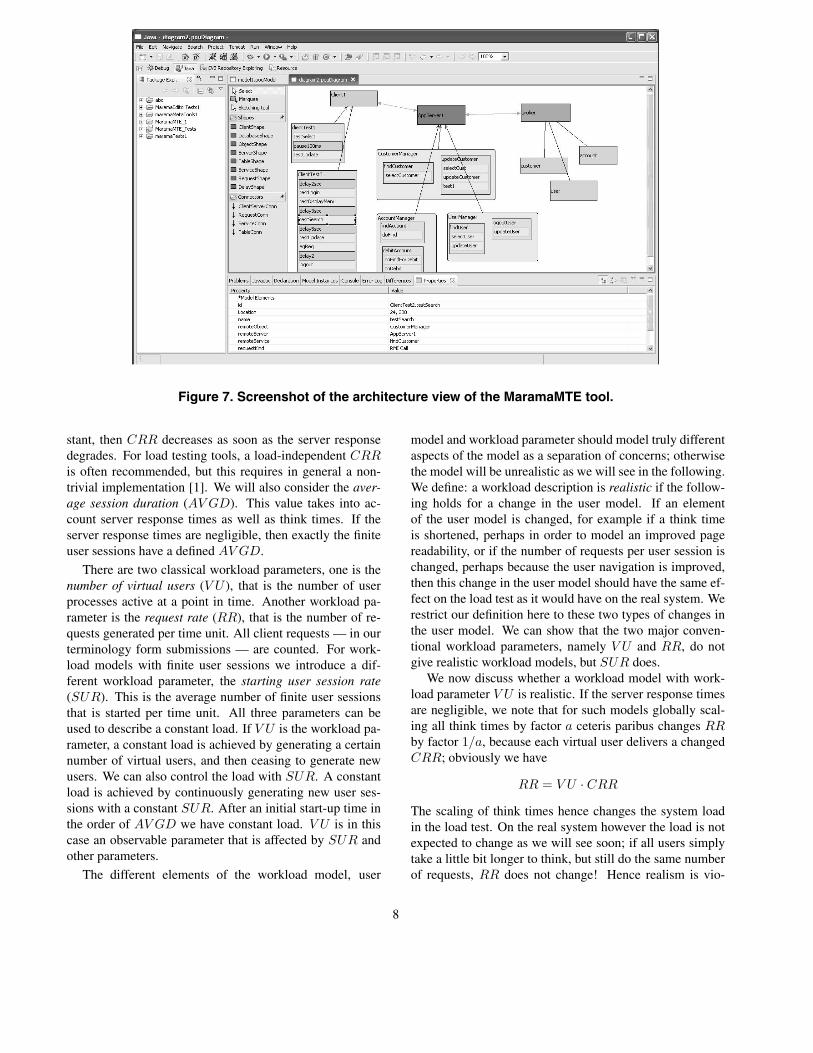
Figure 7. Screenshot of the architecture view of the MaramaMTE tool.
stant, then CRR decreases as soon as the server responsedegrades. For load testing tools, a load-independent CRRis often recommended, but this requires in general a non-trivial implementation [1]. We will also consider the aver-age session duration (AV GD). This value takes into ac-count server response times as well as think times. If theserver response times are negligible, then exactly the finiteuser sessions have a defined AV GD.
There are two classical workload parameters, one is thenumber of virtual users (V U ), that is the number of userprocesses active at a point in time. Another workload pa-rameter is the request rate (RR), that is the number of re-quests generated per time unit. All client requests — in ourterminology form submissions — are counted. For work-load models with finite user sessions we introduce a dif-ferent workload parameter, the starting user session rate(SUR). This is the average number of finite user sessionsthat is started per time unit. All three parameters can beused to describe a constant load. If V U is the workload pa-rameter, a constant load is achieved by generating a certainnumber of virtual users, and then ceasing to generate newusers. We can also control the load with SUR. A constantload is achieved by continuously generating new user ses-sions with a constant SUR. After an initial start-up time inthe order of AV GD we have constant load. V U is in thiscase an observable parameter that is affected by SUR andother parameters.
The different elements of the workload model, user
model and workload parameter should model truly differentaspects of the model as a separation of concerns; otherwisethe model will be unrealistic as we will see in the following.We define: a workload description is realistic if the follow-ing holds for a change in the user model. If an elementof the user model is changed, for example if a think timeis shortened, perhaps in order to model an improved pagereadability, or if the number of requests per user session ischanged, perhaps because the user navigation is improved,then this change in the user model should have the same ef-fect on the load test as it would have on the real system. Werestrict our definition here to these two types of changes inthe user model. We can show that the two major conven-tional workload parameters, namely V U and RR, do notgive realistic workload models, but SUR does.
We now discuss whether a workload model with work-load parameter V U is realistic. If the server response timesare negligible, we note that for such models globally scal-ing all think times by factor a ceteris paribus changes RRby factor 1/a, because each virtual user delivers a changedCRR; obviously we have
RR = V U · CRR
The scaling of think times hence changes the system loadin the load test. On the real system however the load is notexpected to change as we will see soon; if all users simplytake a little bit longer to think, but still do the same numberof requests, RR does not change! Hence realism is vio-
8
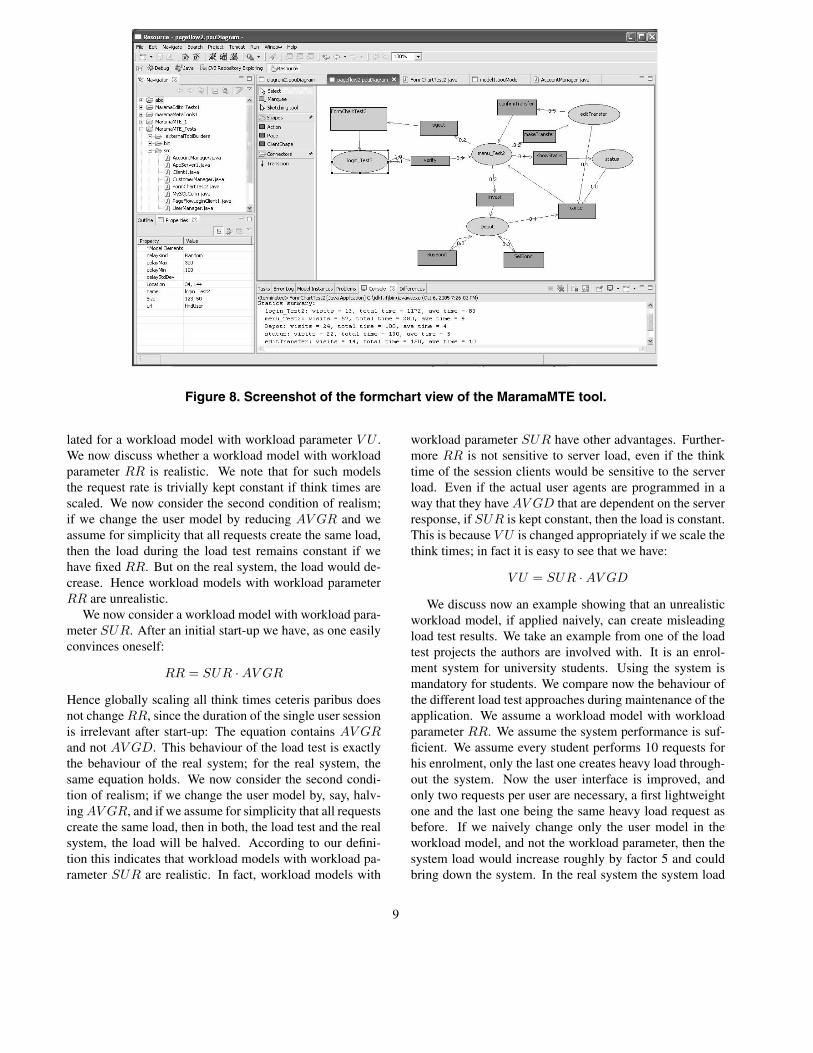
Figure 8. Screenshot of the formchart view of the MaramaMTE tool.
lated for a workload model with workload parameter V U .We now discuss whether a workload model with workloadparameter RR is realistic. We note that for such modelsthe request rate is trivially kept constant if think times arescaled. We now consider the second condition of realism;if we change the user model by reducing AV GR and weassume for simplicity that all requests create the same load,then the load during the load test remains constant if wehave fixed RR. But on the real system, the load would de-crease. Hence workload models with workload parameterRR are unrealistic.
We now consider a workload model with workload para-meter SUR. After an initial start-up we have, as one easilyconvinces oneself:
RR = SUR · AV GR
Hence globally scaling all think times ceteris paribus doesnot change RR, since the duration of the single user sessionis irrelevant after start-up: The equation contains AV GRand not AV GD. This behaviour of the load test is exactlythe behaviour of the real system; for the real system, thesame equation holds. We now consider the second condi-tion of realism; if we change the user model by, say, halv-ing AV GR, and if we assume for simplicity that all requestscreate the same load, then in both, the load test and the realsystem, the load will be halved. According to our defini-tion this indicates that workload models with workload pa-rameter SUR are realistic. In fact, workload models with
workload parameter SUR have other advantages. Further-more RR is not sensitive to server load, even if the thinktime of the session clients would be sensitive to the serverload. Even if the actual user agents are programmed in away that they have AV GD that are dependent on the serverresponse, if SUR is kept constant, then the load is constant.This is because V U is changed appropriately if we scale thethink times; in fact it is easy to see that we have:
V U = SUR · AV GD
We discuss now an example showing that an unrealisticworkload model, if applied naively, can create misleadingload test results. We take an example from one of the loadtest projects the authors are involved with. It is an enrol-ment system for university students. Using the system ismandatory for students. We compare now the behaviour ofthe different load test approaches during maintenance of theapplication. We assume a workload model with workloadparameter RR. We assume the system performance is suf-ficient. We assume every student performs 10 requests forhis enrolment, only the last one creates heavy load through-out the system. Now the user interface is improved, andonly two requests per user are necessary, a first lightweightone and the last one being the same heavy load request asbefore. If we naively change only the user model in theworkload model, and not the workload parameter, then thesystem load would increase roughly by factor 5 and couldbring down the system. In the real system the system load
9

would not increase. The problem remains if the workloadmodel is set up with workload parameter V U . In contrast, ifthe workload model is set up with the realistic workload pa-rameter SUR, the system load remains roughly the same inthe load test, hence resembling the behaviour of the runningapplication. As we see, workload models with workloadparameters RR or V U can deliver spurious results, if theparameters are not changed with every change to the usermodel. These changes can be done, but they require theknowledge of the above equations or lucky intuition to thesame effect. The correct load test behaviour comes for freein the workload model with the realistic workload parame-ter SUR.
6 Related Work
In many cases, load-testing is still done by hand-writtenscripts that describe the user model as a subprogram [22,25]. For each virtual user, the subprogram is called, possi-bly with a set of parameters that describe certain aspects ofthe virtual user’s behaviour. Often the users are also mod-elled by a multimodel, which defines a subprogram for eachuser category. Data is either taken from a set of predefinedvalues or generated randomly. With regard to input datathis approach has a certain degree of randomization. How-ever, user behaviour itself mainly remains a matter of rep-etition. This approach is purely script driven and suffers,like any hand-written program, from being prone to pro-gramming errors. The load engine itself has to be devel-oped and brought to a mature state, which usually is a verytime consuming task. In contrast to that, our approach doesnot rely on hand-written programs but on configurable mod-els, which are much easier to handle and less error prone. Itdoes not require a rewrite of the load engine itself, but rathera reconfiguration of a load engine that interprets stochasticformcharts.
The leading product for industry-strength load test-ing [19] is Mercury Interactive’s LoadRunner [17]. It takesa similar script-driven approach. However, it significantlyincreases usability by offering a visual editor for end-userscripts. No conventional programming is needed, and thescripts describe the load tests in a much more domain-specific manner. End-user scripts are run on a load enginethat takes care of load balancing and monitoring automati-cally. LoadRunner does not, however, offer a model-basedsolution like that of stochastic formcharts. In contrast tothe LoadRunner tool suite, which focuses on load testingand optimisation, formchart models offer well-understoodconcepts for the specification of systems in general, whichare also useful for other web application engineering toolsand facilitate their interoperability. Most current load test-ing tools operate in a manner similar to LoadRunner. Adetailed discussion of bottleneck problems created among
other things by operating systems is given in [1]. Addition-ally the authors present a nontrivial implementation for loadtest clients. More information about load test practice canbe found in [24, 11, 16].
There already exist model-based approaches for testingof web applications, e.g., in [15, 26], but they usually fo-cus on the generation of test cases for functionality test-ing. Different studies have shown that stochastic models,in particular Markov chains, provide benefits for function-ality testing [26, 13, 27]. They can be used for the automaticgeneration of large randomized test suites with a high cover-age of operational paths. In [20, 26], for example, analysismodels are used for regression testing in web site evolutionscenarios. The model for user navigation is a stochastic onesimilar to Markov chains, but all user input data has to begiven in advance for the system to work. While this may beappropriate for regression testing, it is not flexible enoughfor performing load tests. A Markov chain model like thatin [27, 26] can only be used for a system where identical in-puts cause identical state transitions, which is not the case inmost web applications that rely on session data or a modifi-able database. Consider, for example, an online ticket reser-vation system: after a specific place has been booked, it isnot available any more; thus, repeating the same inputs willcause different results.
The motivation of using a statistical model based on dataabout real user behaviour for realistic load testing of websites was already anticipated in [13], but their model failsto distinguish the user behaviour, which can only be ade-quately modelled as a stochastic process, from the systembehaviour, which is deterministically given by the imple-mentation. Transforming a state model of a web site directlyinto a Markov chain is not sufficient and does not accountfor the system’s behaviour, which is not stochastic. In [28]it was shown that creation of a simple stochastic user modelwith real user data represents a valid approach for load test-ing. However, most approaches offer no model for specify-ing user behaviour over time, and it is usually neglected thatform choice probabilities may change during a session.
The difference to stochastic process calculi such as, forexample, the one described in [4], is that our stochasticmodel captures the specifics of web applications and canalso be very suitably used for web application develop-ment [9]. However, it is conceivable that such theory canhelp in the development of new analysis techniques for ourstochastic models. Since action-page transitions are cho-sen by the system, it is not necessary to assign probabilitiesto them in order to perform load testing. But if we assignprobabilities to these transitions the same way we do withpage-action transitions, e.g., by measuring relative frequen-cies, estimation or simply using uniform probabilities, thenwe can analyse the model statically and make statistical es-timates similar to those described in [27] for Markov chains.
10

The difference to Markov chains is that our model also cap-tures behaviour over time, i.e., delays. So if we extend ourmodel further by measuring or estimating time delay dis-tributions for the server actions, then we could also makestatistical estimates of timing behaviour. This could, for ex-ample, allow the calculation of the expected duration of asession or of the expected usage of particular subsystems.Such new analysis techniques present possible future workin the area of web site performance evaluation.
7 Conclusion
In this paper we presented a new approach for load test-ing of web sites which is based on stochastic models of userbehaviour. It allows the easy creation of realistic modelsof the individual user behavior. Furthermore we discussedhow the user model can be used in a realistic workloadmodel. We described our implementation of realistic loadtesting in a visual modelling and performance testbed gen-eration tool, which allows realistic estimates of web appli-cation performance from software architecture descriptions.
References
[1] G. Banga and P. Druschel. Measuring the Capacity of a WebServer under Realistic Loads. World Wide Web, 2(1-2):69–83, 1999.
[2] P. Barford and M. Crovella. Measuring Web Performancein the Wide Area. SIGMETRICS Perform. Eval. Rev.,27(2):37–48, 1.99.
[3] M. Benedikt, J. Freire, and P. Godefroid. VeriWeb: Auto-matically Testing Dynamic Web Sites. In Proceedings of11th International WWW Conference, May 2002.
[4] M. Bernardo and R. Gorrieri. A Tutorial on EMPA: a Theoryof Concurrent Processes with Nondeterminism, Priorities,Probabilities and Time. Theor. Comput. Sci., 202(1-2):1–54,1998.
[5] Y. Cai, J. C. Grundy, and J. G. Hosking. Experiences Inte-grating and Scaling a Performance Test Bed Generator withan Open Source CASE Tool. In Proceedings of the 2004IEEE International Conference on Automated Software En-gineering, pages 36–45. IEEE Press, September 2004.
[6] K. Curran and C. Duffy. Understanding and Reducing WebDelays. Int. J. Netw. Manag., 15(2):89–102, 2005.
[7] Y. Deng, P. Frankl, and J. Wang. Testing Web Database Ap-plications. SIGSOFT Softw. Eng. Notes, 29(5):1–10, 2004.
[8] D. Draheim, C. Lutteroth, and G. Weber. A Source CodeIndependent Reverse Engineering Tool for Dynamic WebSites. In 9th European Conference on Software Maintenanceand Reengineering. IEEE Press, 2005.
[9] D. Draheim and G. Weber. Form-Oriented Analysis - A NewMethodology to Model Form-Based Applications. Springer,October 2004.
[10] S. Elbaum, A. G. Malishevsky, and G. Rothermel. Test CasePrioritization: A Family of Empirical Studies. IEEE Trans.Softw. Eng., 28(2):159–182, 2002.
[11] A. K. Iyengar, M. S. Squillante, and L. Zhang. Analysis andCharacterization of Large-scale Web Server Access Patternsand Performance. World Wide Web, 2(1-2):85–100, 1999.
[12] K. Jajuga, A. Sokoowski, and H. H. Bock. Classification,Clustering and Data Analysis. Springer, August 2002.
[13] C. Kallepalli and J. Tian. Measuring and Modeling Us-age and Reliability for Statistical Web Testing. IEEE Trans.Softw. Eng., 27(11):1023–1036, 2001.
[14] S. Karre. Leveraging User-Session Data to Support WebApplication Testing. IEEE Trans. Softw. Eng., 31(3):187–202, 2005. Member-Sebastian Elbaum and Member-GreggRothermel and Member-Marc Fisher II.
[15] D. C. Kung, C.-H. Liu, and P. Hsia. An Object-OrientedWeb Test Model for Testing Web Applications. In COMP-SAC ’00: 24th International Computer Software and Appli-cations Conference, pages 537–542, Washington, DC, USA,2000. IEEE Computer Society.
[16] D. A. Menasce. Load Testing of Web Sites. IEEE InternetComputing, 6(4):70–74, July 2002.
[17] Mercury Interactive Corporation. Load Testing to PredictWeb Performance. Technical Report WP-1079-0604, Mer-cury Interactive Corporation, 2004.
[18] J. D. Musa. Software Reliability Engineering. McGraw-Hill,1998.
[19] Newport Group Inc. Annual Load Test Market Summaryand Analysis, 2001.
[20] F. Ricca and P. Tonella. Analysis and Testing of Web Appli-cations. In ICSE ’01: Proceedings of the 23rd InternationalConference on Software Engineering, pages 25–34, Wash-ington, DC, USA, 2001. IEEE Computer Society.
[21] L. Rosenberg and L. Hyatt. Developing a Successful MetricsProgram. In Proceedings of the 19th International Confer-ence on Software Engineering. ACM Press, 1997.
[22] A. Rudolf and R. Pirker. E-Business Testing: User Percep-tions and Performance Issues. In Proceedings of the FirstAsia-Pacific Conference on Quality Software. IEEE Press,2000.
[23] J. Shaw. Web Application Performance Testing – a CaseStudy of an On-line Learning Application. BT TechnologyJournal, 18(2):79–86, 2000.
[24] J. C. C. Shaw, C. G. Baisden, and W. M. Pryke. PerformanceTesting – A Case Study of a Combined Web/Telephony Sys-tem. BT Technology Journal, 20(3):76–86, 2002.
[25] B. Subraya and S. Subrahmanya. Object Driven Perfor-mance Testing of Web Applications. In Proceedings of theFirst Asia-Pacific Conference on Quality Software. IEEEPress, 2000.
[26] P. Tonella and F. Ricca. Statistical Testing of Web Applica-tions. Software Maintenance and Evolution, 16(1-2):103–127, April 2004.
[27] J. A. Whittaker and M. G. Thomason. A Markov ChainModel for Statistical Software Testing. IEEE Trans. Softw.Eng., 20(10):812–824, 1994.
[28] L. Xu and B. Xu. Applying Users’ Actions Obtaining Meth-ods into Web Performance Testing. Journal of Software (inChinese), (14):115–120, 2003.
[29] L. Xu, B. Xu, and J. Jiang. Testing Web Applications Fo-cusing on their Specialties. SIGSOFT Softw. Eng. Notes,30(1):10, 2005.
11
Recommended