Quality Assurance Project Plan
Suspended Sediment and Turbidity Total Maximum Daily Load Effectiveness-Monitoring Project in the Upper Yakima River Basin April—October 2006
Report completed April 2006, published April 2009
April 2009 Publication no. 09-10-034
Publication and Contact Information This report is available on the Department of Ecology’s website at http://www.ecy.wa.gov/biblio/0910034.html For more information contact: Water Quality Program P.O. Box 47600 Olympia, WA 98504-7600 Phone: 360-407-6404
Washington State Department of Ecology - www.ecy.wa.gov
o Headquarters, Olympia 360-407-6000 o Northwest Regional Office, Bellevue 425-649-7000 o Southwest Regional Office, Olympia 360-407-6300 o Central Regional Office, Yakima 509-575-2490 o Eastern Regional Office, Spokane 509-329-3400 To ask about the availability of this document in a format for the visually impaired, call the Water Quality Program at 360-407-6404. Persons with hearing loss can call 711 for Washington Relay Service. Persons with a speech disability can call 877-833-6341.
Quality Assurance Project Plan
Suspended Sediment and Turbidity Total Maximum Daily Load Effectiveness-
Monitoring Project in the Upper Yakima River Basin April—October 2006
by
Jane Creech
Water Quality Program Washington State Department of Ecology
Olympia, Washington
Quality Assurance Project Plan for
Suspended Sediment and Turbidity Total Maximum Daily Load
Effectiveness-Monitoring Project in the
Upper Yakima River Basin
April – October 2006 Approved by: Signature:_____________________________________Date: April 10, 2006 Anna Lael, Manager, Kittitas County Conservation District Signature:_____________________________________Date: April 11, 2006 Kathleen Satnik, Water Quality Specialist, Kittitas County Water Purveyors Signature:_____________________________________Date: April 17, 2006 Joe Joy, Environmental Assessment Program, WA Dept of Ecology Signature:_____________________________________Date: April 5, 2006 Chris Coffin, Environmental Assessment Program, WA Dept of Ecology Signature:_____________________________________Date: April 17, 2006 William Kammin, Quality Assurance Officer, WA Dept of Ecology Signature:_____________________________________Date: April 5, 2006 Traci Jefferis, Manager, Cascade Analytical Laboratory (Yakima) Signature:_____________________________________Date: Jane Creech, TMDL Lead, WA Dept of Ecology
April 5, 2006
Quality Assurance Project Plan 2006 Upper Yakima Effectiveness Monitoring Page iii
Table of Contents Introduction ......................................................................................................................................1
Page
Background and Problem Statement ................................................................................................1 Project Description ...........................................................................................................................3 Schedule and Organization ..............................................................................................................4 Data Quality Objectives ...................................................................................................................8 Sampling Process Design .................................................................................................................9 Sampling Procedures .....................................................................................................................13 Laboratory Analysis .......................................................................................................................15 Quality Control ..............................................................................................................................15 Data Acquisition Requirements .....................................................................................................16 Data Management ..........................................................................................................................16 Collect BMP Information ..............................................................................................................17 Audits and Reports .........................................................................................................................17 Assessment and Response Actions ................................................................................................18 Data Review, Validation, and Verification ....................................................................................18 Data Quality Assessment ...............................................................................................................18 Reconciliation with Data Quality Objectives ................................................................................18 References ......................................................................................................................................19 Appendices Appendix A: Integrated Sampling Methods.........…………………………………….………A-1 Appendix B: Data to Support Collecting Grab Samples at Wilson @ Hwy 821 Site ..………B-1 List of Figures Figure 1: TMDL project area ......................................................................................................... 2Figure 2: Organizational flowchart ................................................................................................ 4Figure 3: Upper Yakima River effectiveness monitoring sites .................................................... 12 List of Tables Table 1: 2006 turbidity targets ....................................................................................................... 2Table 2: Planned sampling schedule for 2006. .............................................................................. 6Table 3: Project schedule ............................................................................................................... 7Table 4: Applicable State water quality standards for turbidity [WAC 173-201A] ...................... 8Table 5: Measurement Quality Objectives (MQOs) ...................................................................... 8Table 6: 2006 monitoring sites and samplers .............................................................................. 11Table 7: Laboratory procedures. .................................................................................................. 15Table 8: QC Schedule for each sampling event ........................................................................... 16 List of Tables in Appendices Table B-1: Grab vs. Integrated Samples at Wilson Creek @ Hwy 821………………….…….B-3
Quality Assurance Project Plan Page iv 2006 Upper Yakima Effectiveness Monitoring
Environmental Assessment Program
Distribution List
Washington State Department of Ecology:
Water Quality Program Kittitas County Water Purveyors Kittitas County Conservation District
Quality Assurance Project Plan 2006 Upper Yakima Effectiveness Monitoring
Page 1
Introduction This project is a portion of the effectiveness monitoring phase of the Upper Yakima River Basin Suspended Sediment, Turbidity and Organochlorine Pesticide Total Maximum Daily Load (TMDL). The objective of this TMDL is to reduce sediment, turbidity and organochlorine pesticides in the upper Yakima River and its tributaries during the period from April through October. In this effectiveness monitoring project, only turbidity and suspended sediment levels will be evaluated; the organochlorine pesticide levels will be assessed in 2007.
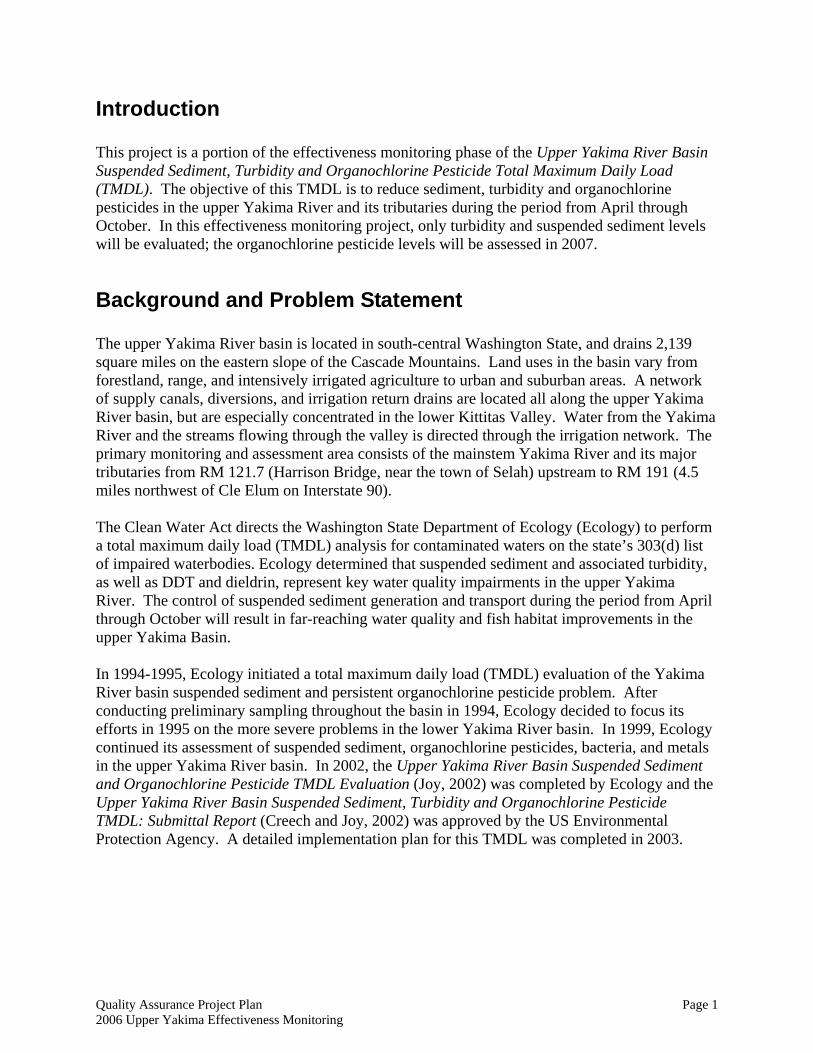
Background and Problem Statement The upper Yakima River basin is located in south-central Washington State, and drains 2,139 square miles on the eastern slope of the Cascade Mountains. Land uses in the basin vary from forestland, range, and intensively irrigated agriculture to urban and suburban areas. A network of supply canals, diversions, and irrigation return drains are located all along the upper Yakima River basin, but are especially concentrated in the lower Kittitas Valley. Water from the Yakima River and the streams flowing through the valley is directed through the irrigation network. The primary monitoring and assessment area consists of the mainstem Yakima River and its major tributaries from RM 121.7 (Harrison Bridge, near the town of Selah) upstream to RM 191 (4.5 miles northwest of Cle Elum on Interstate 90). The Clean Water Act directs the Washington State Department of Ecology (Ecology) to perform a total maximum daily load (TMDL) analysis for contaminated waters on the state’s 303(d) list of impaired waterbodies. Ecology determined that suspended sediment and associated turbidity, as well as DDT and dieldrin, represent key water quality impairments in the upper Yakima River. The control of suspended sediment generation and transport during the period from April through October will result in far-reaching water quality and fish habitat improvements in the upper Yakima Basin. In 1994-1995, Ecology initiated a total maximum daily load (TMDL) evaluation of the Yakima River basin suspended sediment and persistent organochlorine pesticide problem. After conducting preliminary sampling throughout the basin in 1994, Ecology decided to focus its efforts in 1995 on the more severe problems in the lower Yakima River basin. In 1999, Ecology continued its assessment of suspended sediment, organochlorine pesticides, bacteria, and metals in the upper Yakima River basin. In 2002, the Upper Yakima River Basin Suspended Sediment and Organochlorine Pesticide TMDL Evaluation (Joy, 2002) was completed by Ecology and the Upper Yakima River Basin Suspended Sediment, Turbidity and Organochlorine Pesticide TMDL: Submittal Report (Creech and Joy, 2002) was approved by the US Environmental Protection Agency. A detailed implementation plan for this TMDL was completed in 2003.
Quality Assurance Project Plan 2006 Upper Yakima Effectiveness Monitoring Page 2
Figure 1: TMDL project area
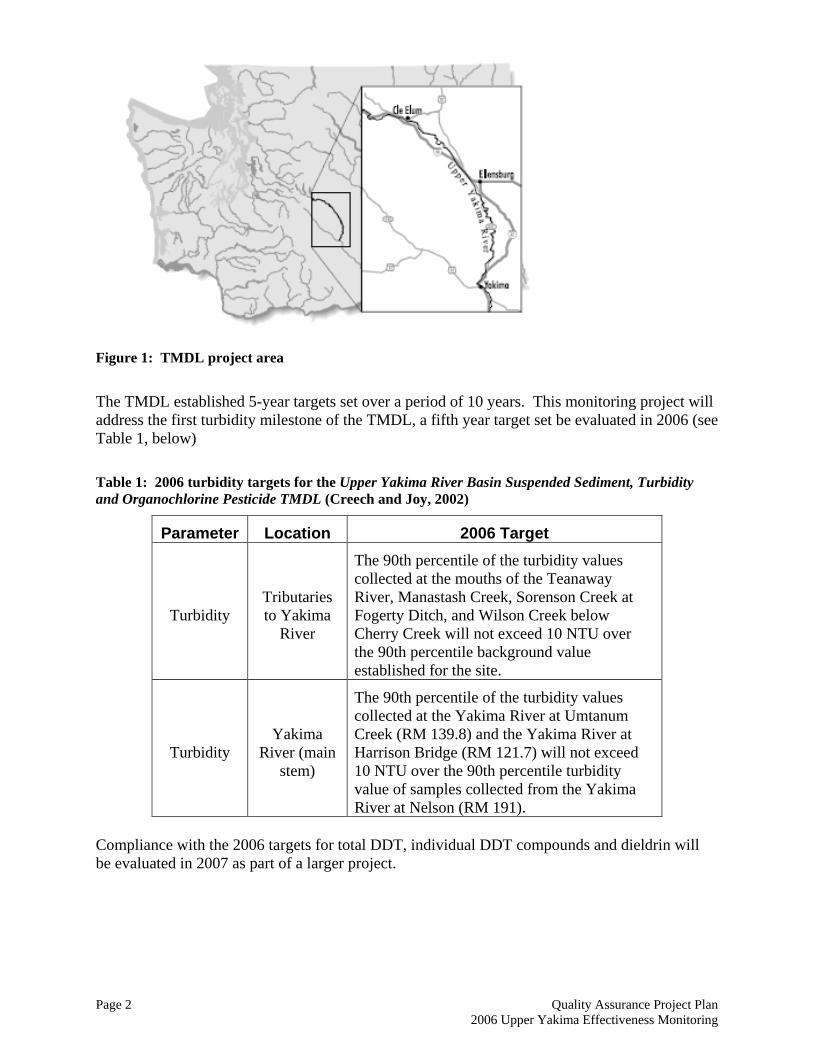
The TMDL established 5-year targets set over a period of 10 years. This monitoring project will address the first turbidity milestone of the TMDL, a fifth year target set be evaluated in 2006 (see Table 1, below) Table 1: 2006 turbidity targets for the Upper Yakima River Basin Suspended Sediment, Turbidity and Organochlorine Pesticide TMDL (Creech and Joy, 2002)
Parameter Location 2006 Target
Turbidity Tributaries to Yakima
River
The 90th percentile of the turbidity values collected at the mouths of the Teanaway River, Manastash Creek, Sorenson Creek at Fogerty Ditch, and Wilson Creek below Cherry Creek will not exceed 10 NTU over the 90th percentile background value established for the site.
Turbidity Yakima
River (main stem)
The 90th percentile of the turbidity values collected at the Yakima River at Umtanum Creek (RM 139.8) and the Yakima River at Harrison Bridge (RM 121.7) will not exceed 10 NTU over the 90th percentile turbidity value of samples collected from the Yakima River at Nelson (RM 191).
Compliance with the 2006 targets for total DDT, individual DDT compounds and dieldrin will be evaluated in 2007 as part of a larger project.
Quality Assurance Project Plan 2006 Upper Yakima Effectiveness Monitoring
Page 3
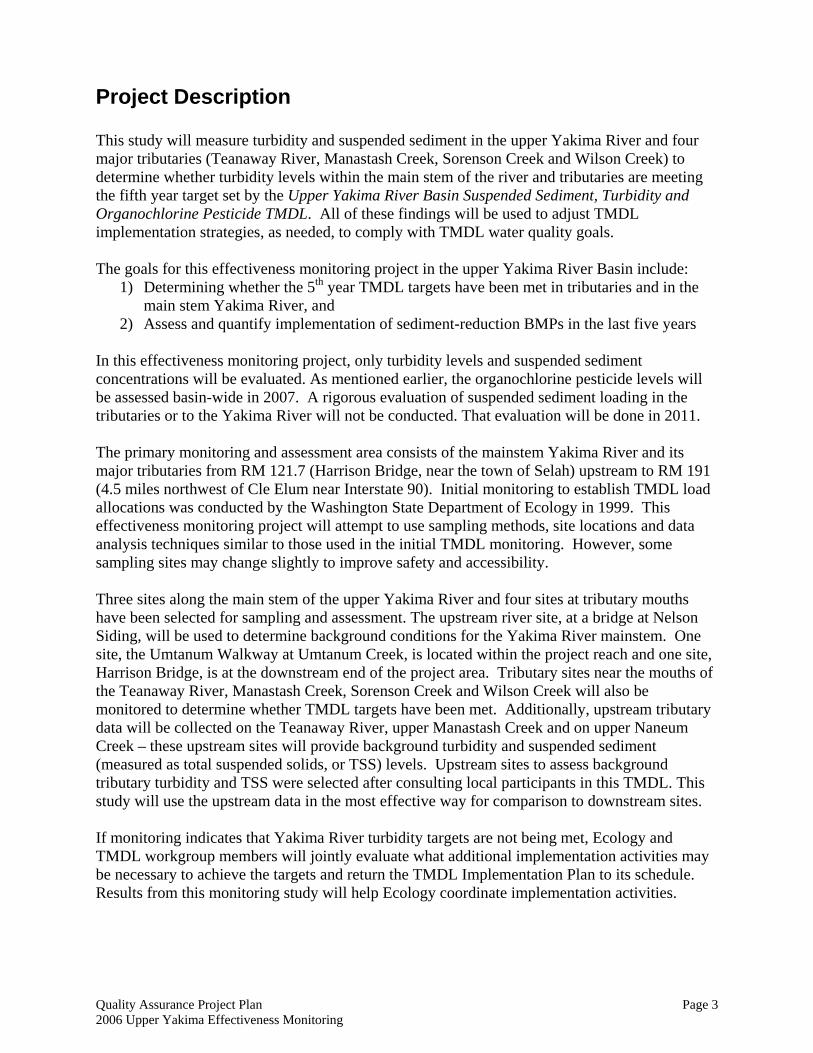
Project Description This study will measure turbidity and suspended sediment in the upper Yakima River and four major tributaries (Teanaway River, Manastash Creek, Sorenson Creek and Wilson Creek) to determine whether turbidity levels within the main stem of the river and tributaries are meeting the fifth year target set by the Upper Yakima River Basin Suspended Sediment, Turbidity and Organochlorine Pesticide TMDL. All of these findings will be used to adjust TMDL implementation strategies, as needed, to comply with TMDL water quality goals. The goals for this effectiveness monitoring project in the upper Yakima River Basin include:
1) Determining whether the 5th year TMDL targets have been met in tributaries and in the main stem Yakima River, and
2) Assess and quantify implementation of sediment-reduction BMPs in the last five years In this effectiveness monitoring project, only turbidity levels and suspended sediment concentrations will be evaluated. As mentioned earlier, the organochlorine pesticide levels will be assessed basin-wide in 2007. A rigorous evaluation of suspended sediment loading in the tributaries or to the Yakima River will not be conducted. That evaluation will be done in 2011. The primary monitoring and assessment area consists of the mainstem Yakima River and its major tributaries from RM 121.7 (Harrison Bridge, near the town of Selah) upstream to RM 191 (4.5 miles northwest of Cle Elum near Interstate 90). Initial monitoring to establish TMDL load allocations was conducted by the Washington State Department of Ecology in 1999. This effectiveness monitoring project will attempt to use sampling methods, site locations and data analysis techniques similar to those used in the initial TMDL monitoring. However, some sampling sites may change slightly to improve safety and accessibility. Three sites along the main stem of the upper Yakima River and four sites at tributary mouths have been selected for sampling and assessment. The upstream river site, at a bridge at Nelson Siding, will be used to determine background conditions for the Yakima River mainstem. One site, the Umtanum Walkway at Umtanum Creek, is located within the project reach and one site, Harrison Bridge, is at the downstream end of the project area. Tributary sites near the mouths of the Teanaway River, Manastash Creek, Sorenson Creek and Wilson Creek will also be monitored to determine whether TMDL targets have been met. Additionally, upstream tributary data will be collected on the Teanaway River, upper Manastash Creek and on upper Naneum Creek – these upstream sites will provide background turbidity and suspended sediment (measured as total suspended solids, or TSS) levels. Upstream sites to assess background tributary turbidity and TSS were selected after consulting local participants in this TMDL. This study will use the upstream data in the most effective way for comparison to downstream sites. If monitoring indicates that Yakima River turbidity targets are not being met, Ecology and TMDL workgroup members will jointly evaluate what additional implementation activities may be necessary to achieve the targets and return the TMDL Implementation Plan to its schedule. Results from this monitoring study will help Ecology coordinate implementation activities.
Quality Assurance Project Plan 2006 Upper Yakima Effectiveness Monitoring Page 4
Schedule and Organization
Washington State Department of Ecology
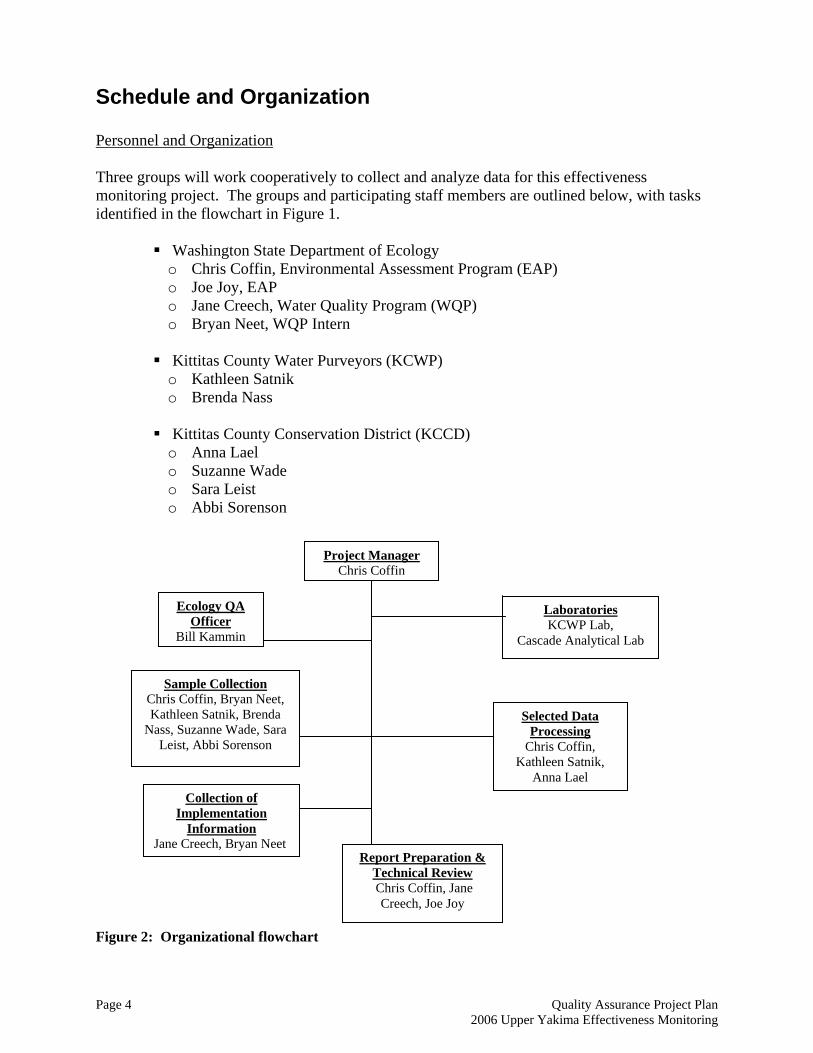
Personnel and Organization Three groups will work cooperatively to collect and analyze data for this effectiveness monitoring project. The groups and participating staff members are outlined below, with tasks identified in the flowchart in Figure 1.
o Chris Coffin, Environmental Assessment Program (EAP) o Joe Joy, EAP o Jane Creech, Water Quality Program (WQP) o Bryan Neet, WQP Intern
Kittitas County Water Purveyors (KCWP) o Kathleen Satnik o Brenda Nass
Kittitas County Conservation District (KCCD) o Anna Lael o Suzanne Wade o Sara Leist o Abbi Sorenson
Figure 2: Organizational flowchart
Laboratories KCWP Lab,
Cascade Analytical Lab
Ecology QA Officer
Bill Kammin
Project Manager Chris Coffin
Report Preparation & Technical Review Chris Coffin, Jane
Creech, Joe Joy
Selected Data Processing
Chris Coffin, Kathleen Satnik,
Anna Lael Collection of
Implementation Information
Jane Creech, Bryan Neet
Sample Collection Chris Coffin, Bryan Neet, Kathleen Satnik, Brenda
Nass, Suzanne Wade, Sara Leist, Abbi Sorenson
Quality Assurance Project Plan 2006 Upper Yakima Effectiveness Monitoring
Page 5
Tasks
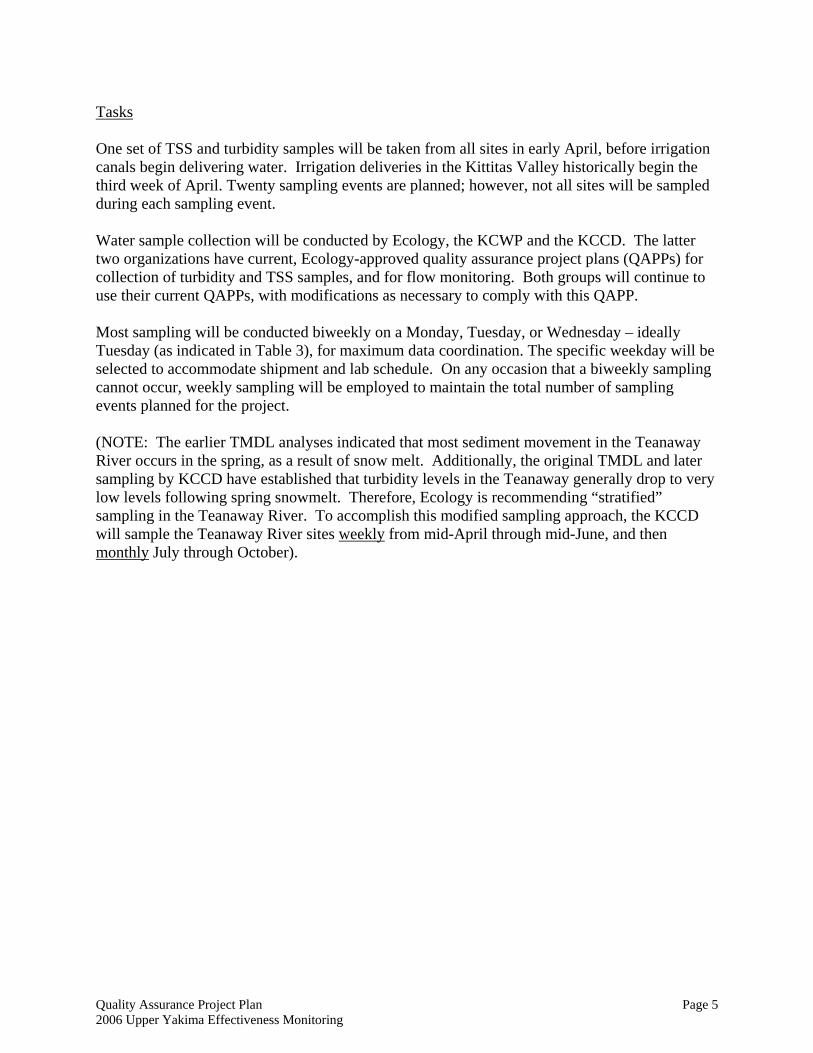
Water sample collection will be conducted by Ecology, the KCWP and the KCCD. The latter two organizations have current, Ecology-approved quality assurance project plans (QAPPs) for collection of turbidity and TSS samples, and for flow monitoring. Both groups will continue to use their current QAPPs, with modifications as necessary to comply with this QAPP. Most sampling will be conducted biweekly on a Monday, Tuesday, or Wednesday – ideally Tuesday (as indicated in Table 3), for maximum data coordination. The specific weekday will be selected to accommodate shipment and lab schedule. On any occasion that a biweekly sampling cannot occur, weekly sampling will be employed to maintain the total number of sampling events planned for the project. (NOTE: The earlier TMDL analyses indicated that most sediment movement in the Teanaway River occurs in the spring, as a result of snow melt. Additionally, the original TMDL and later sampling by KCCD have established that turbidity levels in the Teanaway generally drop to very low levels following spring snowmelt. Therefore, Ecology is recommending “stratified” sampling in the Teanaway River. To accomplish this modified sampling approach, the KCCD will sample the Teanaway River sites
One set of TSS and turbidity samples will be taken from all sites in early April, before irrigation canals begin delivering water. Irrigation deliveries in the Kittitas Valley historically begin the third week of April. Twenty sampling events are planned; however, not all sites will be sampled during each sampling event.
weekly from mid-April through mid-June, and then monthly July through October).
Quality Assurance Project Plan 2006 Upper Yakima Effectiveness Monitoring Page 6
Table 2: Planned sampling schedule for 2006.
Event No.
QA sample dates1
Date (all Tuesdays)
Location Sampler(s)
1 X April 4, 2006 All sites All 2 X April 18, 2006 All sites All 3 April 25, 2006 Teanaway sites only KCCD 4 X May 2, 2006 All sites All 5 May 9, 2006 Teanaway sites only KCCD 6 X May 16, 2006 All sites All 7 May 23, 2006 Teanaway sites only KCCD 8 X May 30, 2006 All sites All 9 June 6, 2006 Teanaway sites only KCCD 10 June 13, 2006 All sites All 11 X June 27, 2006 All sites All 12 July 11, 2006 All sites All 13 July 25, 2006 All sites except Teanaway Ecology and KCWP 14 X August 8, 2006 All sites All 15 August 22, 2006 All sites except Teanaway Ecology and KCWP 16 X September 5, 2006 All sites All 17 September 19, 2006 All sites except Teanaway Ecology and KCWP 18 X October 3, 2006 All sites All 19 October 17, 2006 All sites except Teanaway Ecology and KCWP 20 X October 31, 2006 All sites All
Where possible, flow data will be collected at the sampling sites using established Bureau of Reclamation, USGS or irrigation district gages. Gaging stations are located at the Yakima River at Umtanum Creek and at Roza Dam. There are also U.S Bureau of Reclamation (USBR) gages near the mouth of the Teanaway River, and on Wilson and Cherry Creeks just above their confluence (note: data from these latter two gages will be reviewed with USBR for accuracy). At sampling sites where no gage stations exist, staff gage2
As part of this evaluation project, Ecology staff will meet with stakeholders and organizations throughout the project area to describe and quantify the best management practices (BMPs) for
levels will be recorded. Additionally, at these staff gage sites, either 1) instantaneous flows will be collected when possible and new rated charts established, OR 2) previously-established rated charts may be used with prior approval by Ecology EAP staff. See Table 6 for more information on sites for discharge collection. Flow measurements will be used in several ways. They will be used to estimate TSS loads (tons/day) from the monitored tributaries to the Yakima River. They will also be used to compare hydrologic conditions in 1999 to 2006 since total discharge, its timing, and water velocities have significant influences on suspended sediment loading.
1 For description of QA sampling, see “Comparability” section on p. 6. 2 The “tape down” method can also be used for stage measurement in the same locations that staff gages are used. A separate rated chart would need to be developed for each tape down site. In the interests of simplicity, only staff gages will be discussed in this QAPP, but both methods are acceptable.
Quality Assurance Project Plan 2006 Upper Yakima Effectiveness Monitoring
Page 7
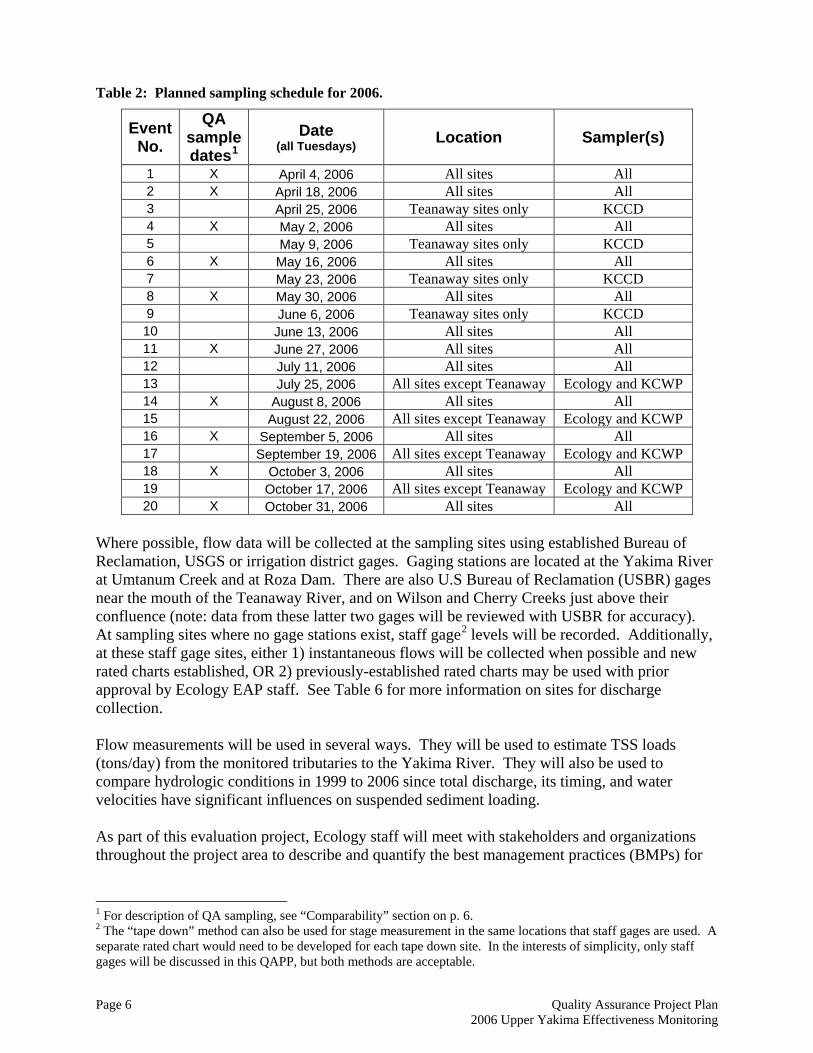
sediment reduction that have been implemented during the life of this TMDL. This information will be included in the final report as well. Laboratory analyses for TSS and turbidity will be conducted by qualified staff at laboratories accredited by Ecology for all analyses required for this project. KCWP staff will analyze samples at the KCWP’s accredited lab. Ecology and the KCCD will use Cascade Analytical Laboratory. Discharge data will be collected to coincide with sample collection periods as closely as possible. Continuous discharge measurements will be obtained from gage stations operated by the USBR and Ecology. Instantaneous flow data and staff gage readings will be collected at sites without continuously recording gage stations; rated charts will be developed for each of these sites. Expenses accrued by the KCWP and the KCCD in accordance with this effectiveness monitoring project will be paid by existing water quality grants from Ecology that both parties administer. Estimated Budget for Samples collected by Ecology Lab Costs including sample analysis and QA….$7,000 Vehicle Expenses…………………………….…$4,500 Personnel…………………………………….….0.35 FTE Estimated Budget for Samples collected by KCWP Lab Costs including sample analysis and QA.…$9,600 Vehicle Expenses…………………………….…...$370 Personnel……………………………….….……$9,700 Estimated Budget for Samples collected by KCCD Lab Costs including sample analysis and QA.…$2,750 Vehicle Expenses……………………….….….…$625 Personnel………………………………….……$7,620 Table 3: Project schedule
Sample collection April – October 2006 Data compilation, verification, and validation November – December 2006 Data review and analysis January 2007 Draft report completed by Ecology April 2007 EIM entry complete May 2007 Final report September 2007
Upon completion of the monitoring portion of this project and the associated data analyses, a report will be completed detailing the information collected for surface-water quality in the upper Yakima River. The report, prepared by Ecology, will specifically indicate whether the upper Yakima River and selected tributaries are meeting the interim turbidity targets described in the Upper Yakima River Basin Suspended Sediment, Turbidity and Organochlorine Pesticide TMDL.
Quality Assurance Project Plan 2006 Upper Yakima Effectiveness Monitoring Page 8
The report findings will be reviewed by Ecology EAP and WQ staff, and by KCCD and KCWP staff before presenting them to stakeholders in the upper Yakima River basin. The final report should be ready by June 2007.
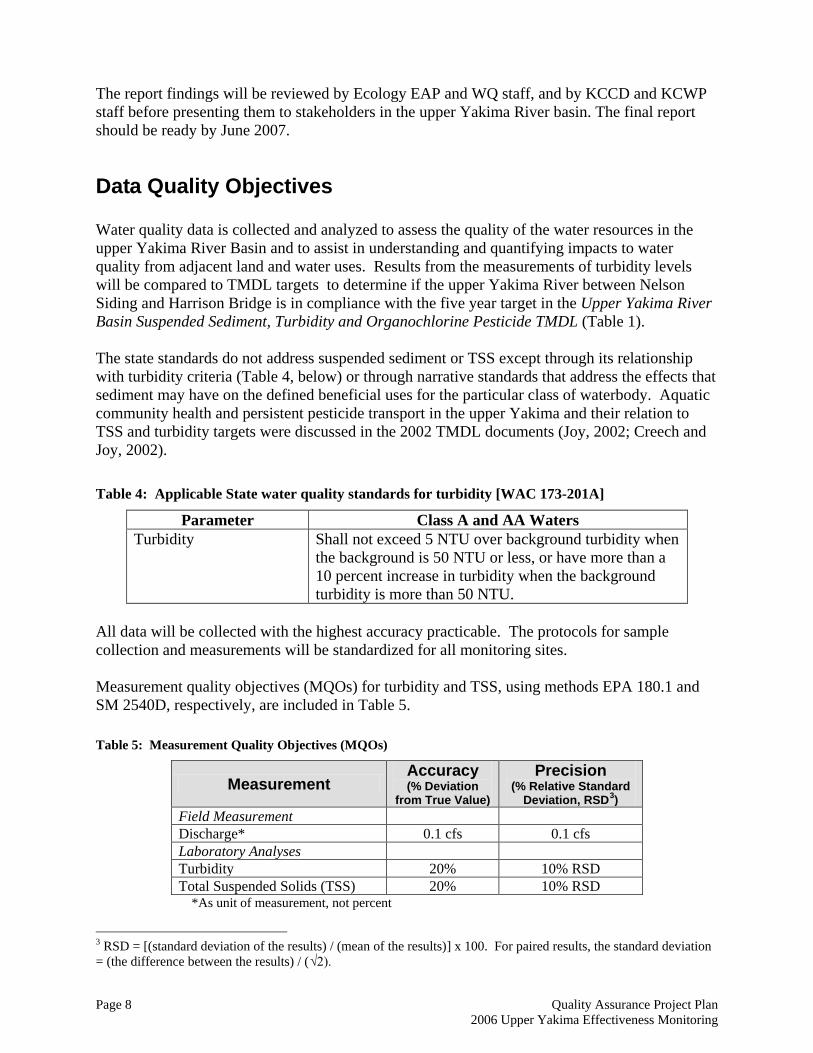
Data Quality Objectives Water quality data is collected and analyzed to assess the quality of the water resources in the upper Yakima River Basin and to assist in understanding and quantifying impacts to water quality from adjacent land and water uses. Results from the measurements of turbidity levels will be compared to TMDL targets to determine if the upper Yakima River between Nelson Siding and Harrison Bridge is in compliance with the five year target in the Upper Yakima River Basin Suspended Sediment, Turbidity and Organochlorine Pesticide TMDL (Table 1). The state standards do not address suspended sediment or TSS except through its relationship with turbidity criteria (Table 4, below) or through narrative standards that address the effects that sediment may have on the defined beneficial uses for the particular class of waterbody. Aquatic community health and persistent pesticide transport in the upper Yakima and their relation to TSS and turbidity targets were discussed in the 2002 TMDL documents (Joy, 2002; Creech and Joy, 2002). Table 4: Applicable State water quality standards for turbidity [WAC 173-201A]
Parameter Class A and AA Waters Turbidity Shall not exceed 5 NTU over background turbidity when
the background is 50 NTU or less, or have more than a 10 percent increase in turbidity when the background turbidity is more than 50 NTU.
All data will be collected with the highest accuracy practicable. The protocols for sample collection and measurements will be standardized for all monitoring sites. Measurement quality objectives (MQOs) for turbidity and TSS, using methods EPA 180.1 and SM 2540D, respectively, are included in Table 5.
Table 5: Measurement Quality Objectives (MQOs)
Measurement Accuracy (% Deviation
from True Value)
Precision (% Relative Standard
Deviation, RSD3
Field Measurement )
Discharge* 0.1 cfs 0.1 cfs Laboratory Analyses Turbidity 20% 10% RSD Total Suspended Solids (TSS) 20% 10% RSD
*As unit of measurement, not percent
3 RSD = [(standard deviation of the results) / (mean of the results)] x 100. For paired results, the standard deviation = (the difference between the results) / (√2).

Quality Assurance Project Plan 2006 Upper Yakima Effectiveness Monitoring
Page 9
Bias inherent in sampling and sample analysis will be minimized because: 1) turbidity and sediment data will be used to compare background conditions against mid-reach and end-of-reach conditions and 2) sampling protocols will be standardized throughout the project area.
Sampling Process Design Study design Locations along the upper Yakima River and on selected tributaries will be monitored from April through the end of October 2006 (Table 6 & Table 3). Most of these sites were selected based upon the 1999 TMDL study site network while others were added because of their location and accessibility. If sampling opportunities are limited, additional monitoring may be required to ensure adequate data is obtained for analyses. The upstream (background) site for the Yakima River at the John Wayne Trail Bridge is approximately 0.1 mile downstream of the 1999 TMDL site at the Interstate 90 bridge. The Teanaway River site at Lambert Road is approximately 0.5 mile upstream from the Highway 10 Bridge used in 1999. Both sites were moved to increase the safety of the samplers, while no significant change in water quality is expected at either site. The other mainstem and tributary mouth sites are the same as they were in 1999 TMDL study. Of the three tributary background sites, Naneum Creek is the same as in 1999 while the Manastash Creek and North Fork Teanaway River sites are new. The new sites are expected to provide additional information on the variability of background turbidities from these sub-basins. Sample collection will be conducted biweekly throughout the monitoring period (other than the exceptions noted in the Teanaway). If at any time biweekly sampling is not possible, weekly sampling will be temporarily employed to maintain the total number of samples planned for the project. All samples will be analyzed for TSS and turbidity. Other than discharge measurements, no other field measurements or analyses will be conducted.
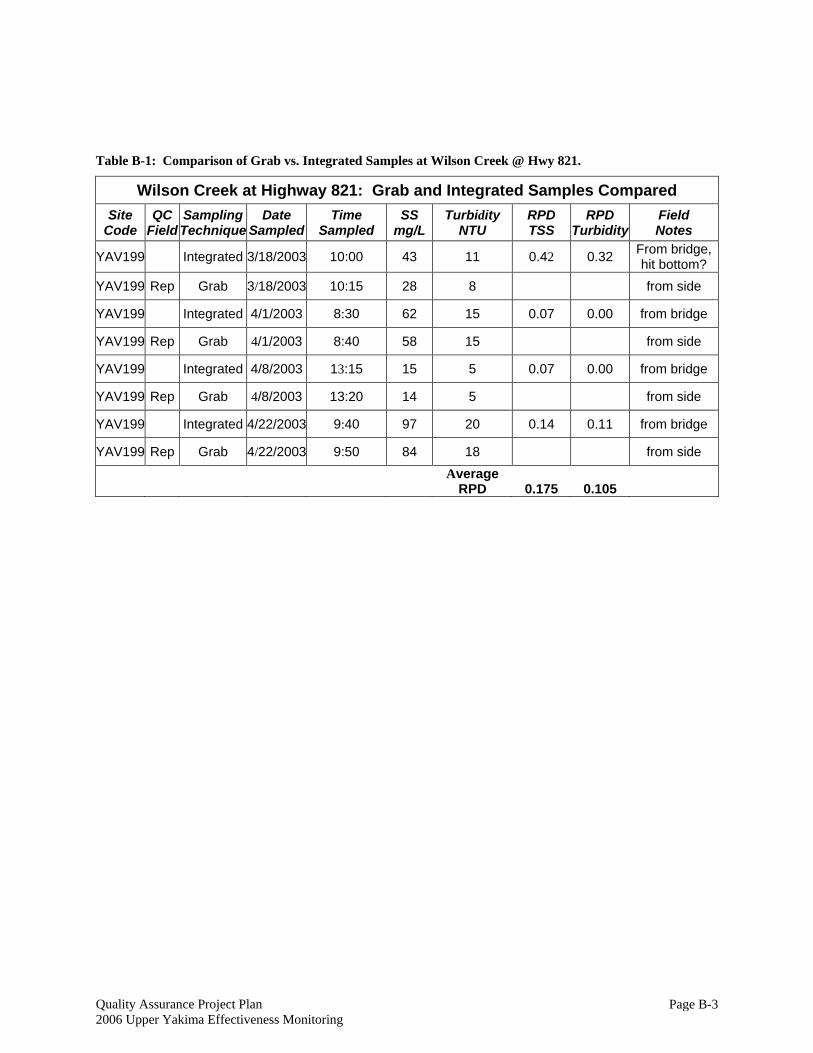
1) At the site at Wilson Creek @ Hwy 821 – samples at this site will be collected using grab sampling techniques due to safety concerns. The KCWP has collected a limited data set
Assumptions underlying design Representativeness: Both the sampling schedule and the monitoring site location should accurately describe the conditions to be evaluated by this project. Samples will be collected every two weeks during the critical period (as identified in the TMDL), as well as immediately before and after the season, in order to characterize conditions. The only exception to the bi-weekly sampling will be the stratified sampling in the Teanaway, which is based on years of Teanaway data collected by the KCCD. All samples will be collected using an integrated sampler to represent width and depth variations, with two exceptions:
Quality Assurance Project Plan 2006 Upper Yakima Effectiveness Monitoring Page 10
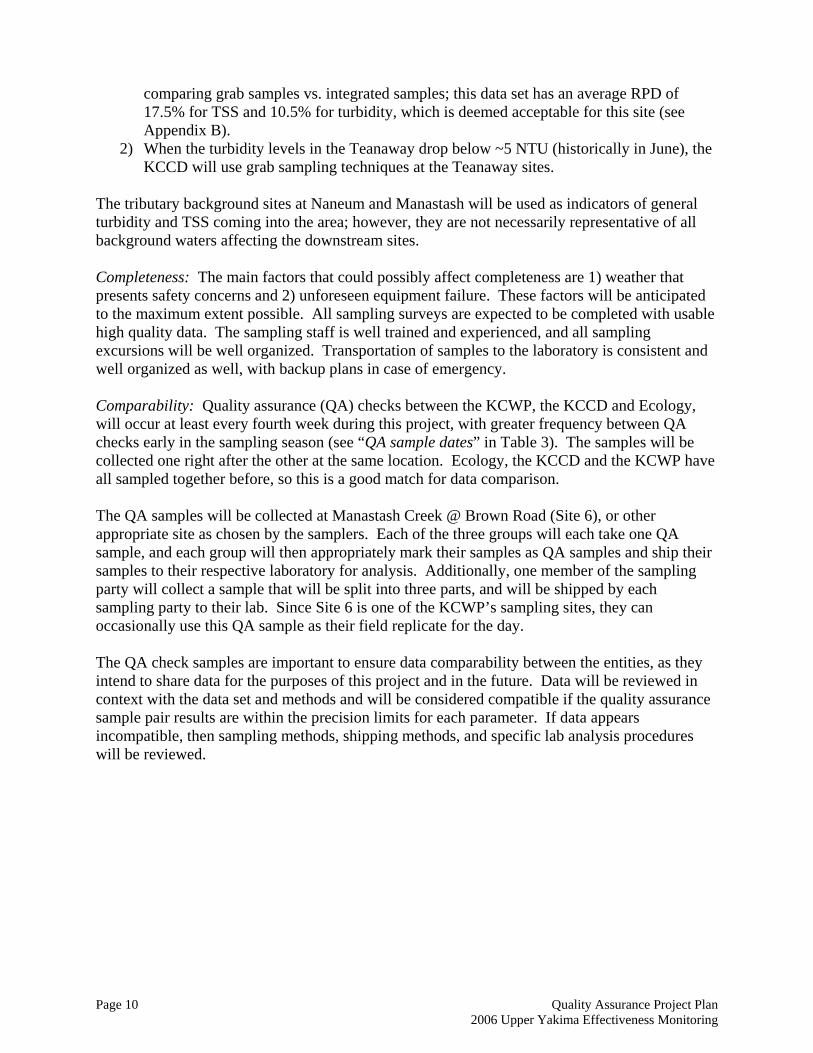
comparing grab samples vs. integrated samples; this data set has an average RPD of 17.5% for TSS and 10.5% for turbidity, which is deemed acceptable for this site (see Appendix B).
2) When the turbidity levels in the Teanaway drop below ~5 NTU (historically in June), the KCCD will use grab sampling techniques at the Teanaway sites.
The tributary background sites at Naneum and Manastash will be used as indicators of general turbidity and TSS coming into the area; however, they are not necessarily representative of all background waters affecting the downstream sites. Completeness: The main factors that could possibly affect completeness are 1) weather that presents safety concerns and 2) unforeseen equipment failure. These factors will be anticipated to the maximum extent possible. All sampling surveys are expected to be completed with usable high quality data. The sampling staff is well trained and experienced, and all sampling excursions will be well organized. Transportation of samples to the laboratory is consistent and well organized as well, with backup plans in case of emergency. Comparability: Quality assurance (QA) checks between the KCWP, the KCCD and Ecology, will occur at least every fourth week during this project, with greater frequency between QA checks early in the sampling season (see “QA sample dates” in Table 3). The samples will be collected one right after the other at the same location. Ecology, the KCCD and the KCWP have all sampled together before, so this is a good match for data comparison. The QA samples will be collected at Manastash Creek @ Brown Road (Site 6), or other appropriate site as chosen by the samplers. Each of the three groups will each take one QA sample, and each group will then appropriately mark their samples as QA samples and ship their samples to their respective laboratory for analysis. Additionally, one member of the sampling party will collect a sample that will be split into three parts, and will be shipped by each sampling party to their lab. Since Site 6 is one of the KCWP’s sampling sites, they can occasionally use this QA sample as their field replicate for the day. The QA check samples are important to ensure data comparability between the entities, as they intend to share data for the purposes of this project and in the future. Data will be reviewed in context with the data set and methods and will be considered compatible if the quality assurance sample pair results are within the precision limits for each parameter. If data appears incompatible, then sampling methods, shipping methods, and specific lab analysis procedures will be reviewed.
Quality Assurance Project Plan 2006 Upper Yakima Effectiveness Monitoring
Page 11
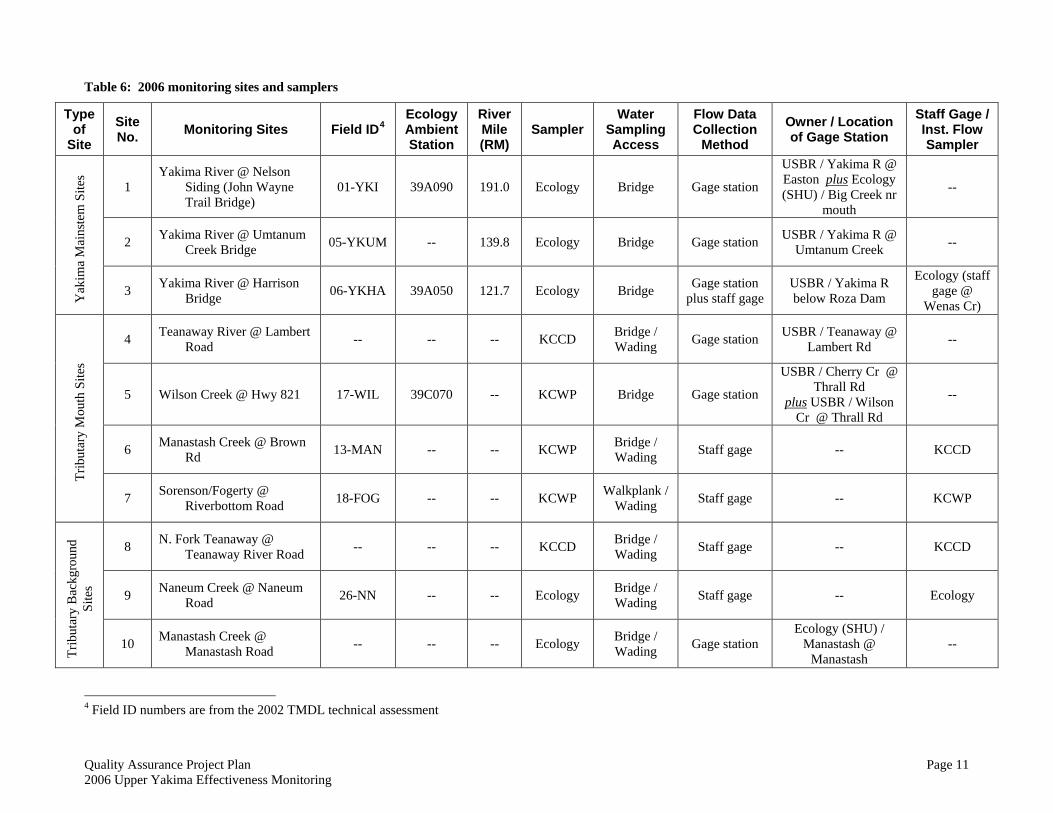
Table 6: 2006 monitoring sites and samplers
Type of
Site Site No. Monitoring Sites Field ID4
Ecology Ambient Station
River Mile (RM)
Sampler Water
Sampling Access
Flow Data Collection
Method Owner / Location of Gage Station
Staff Gage / Inst. Flow Sampler
Yak
ima
Mai
nste
m S
ites
1 Yakima River @ Nelson
Siding (John Wayne Trail Bridge)
01-YKI 39A090 191.0 Ecology Bridge Gage station
USBR / Yakima R @ Easton plus -- Ecology (SHU) / Big Creek nr
mouth
2 Yakima River @ Umtanum Creek Bridge 05-YKUM -- 139.8 Ecology Bridge Gage station USBR / Yakima R @
Umtanum Creek --
3 Yakima River @ Harrison Bridge 06-YKHA 39A050 121.7 Ecology Bridge Gage station
plus staff gage USBR / Yakima R below Roza Dam
Ecology (staff gage @
Wenas Cr)
Trib
utar
y M
outh
Site
s
4 Teanaway River @ Lambert Road -- -- -- KCCD Bridge /
Wading Gage station USBR / Teanaway @ Lambert Rd --
5 Wilson Creek @ Hwy 821 17-WIL 39C070 -- KCWP Bridge Gage station
USBR / Cherry Cr @ Thrall Rd
plus -- USBR / Wilson Cr @ Thrall Rd
6 Manastash Creek @ Brown Rd 13-MAN -- -- KCWP Bridge /
Wading Staff gage -- KCCD
7 Sorenson/Fogerty @ Riverbottom Road 18-FOG -- -- KCWP Walkplank /
Wading Staff gage -- KCWP
Trib
utar
y B
ackg
roun
d Si
tes
8 N. Fork Teanaway @ Teanaway River Road -- -- -- KCCD Bridge /
Wading Staff gage -- KCCD
9 Naneum Creek @ Naneum Road 26-NN -- -- Ecology Bridge /
Wading Staff gage -- Ecology
10 Manastash Creek @ Manastash Road -- -- -- Ecology Bridge /
Wading Gage station Ecology (SHU) /
Manastash @ Manastash
--
4 Field ID numbers are from the 2002 TMDL technical assessment
Quality Assurance Project Plan 2006 Upper Yakima Effectiveness Monitoring Page 12
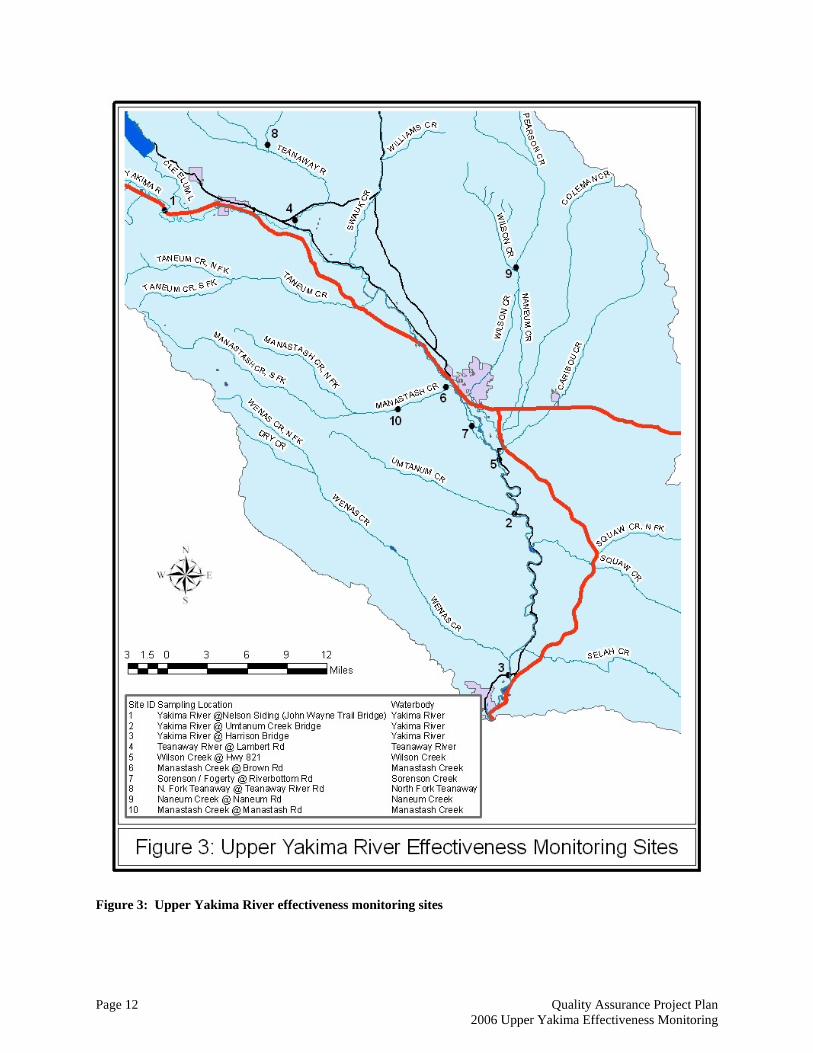
Figure 3: Upper Yakima River effectiveness monitoring sites
Quality Assurance Project Plan 2006 Upper Yakima Effectiveness Monitoring
Page 13
Sampling Procedures All three groups (KCWP, KCCD and Ecology) that will be conducting sampling for this TMDL are experienced in water quality sampling. The following procedures are an overview of how all three groups will address specifically sampling issues. Supplies Nalgene plastic containers (1, 2 or 3 liter) Glass sample collection bottles 100’ Rope DH-81 Depth Integrated Suspended Hand Sampler with collection containers DH-59 Depth Integrated Suspended Hand Line Sampler with collection containers DH-76 Depth Integrated Suspended Hand Line Sampler with collection containers (Note: integrated samplers similar to the DH series samplers may be used with prior approval from the project manager)
All monitoring sites consist of a transect that is near perpendicular to the stream channel.
Field Procedures All monitoring sites on the mainstem of the upper Yakima River are located at bridges. Most tributary sites are also located at bridges, except for one walkplank site. Depth and width integrated samples will be collected at all sites, with two exceptions: 1) Wilson Creek at Hwy 821 – samples at this site will be collected using grab sampling techniques, as the KCWP has documented that grab samples have a high correlation with integrated samples at this site (see Appendix B), and 2) when the turbidity levels in the Teanaway drop below ~5 NTU (historically in June), the KCCD will use grab samples at the Teanaway sites also.
5 The width of the channel is measured and divided into sections that represent equal widths of the stream cross section. Vertical sampling points are selected for sample collection6
5 Note that where the bridge is not perpendicular to the stream flow, adjustments to the calculations will be made to correct for angles of stream:bridge not equal to 90 degrees. 6 See Appendix A for further description of integrated sampling procedures.
. Adjustments may be required to avoid obstructions and debris in the river below the sampling point, or to take a sample from the thalweg. In the case of obstructions, the sampling point is moved laterally in the direction of the nearest clear access to flowing water until a sample can be obtained. Culvert and wading-only sites will follow the above protocol also to the extent possible, using an appropriate sampling device. Sampling in the mainstem of the upper Yakima River will start at approximately 7 AM at the upstream end of the project area and work downstream. All mainstem samples will be collected on the same day. Where possible, samples collected from tributaries will be collected upstream to downstream. The preferred timing is sampling the same day as the mainstem. If it is not possible to collect all samples in one day, then individual tributary sampling should be conducted in an upstream to downstream sequence as close in time as possible to the mainstem sampling period.
Quality Assurance Project Plan 2006 Upper Yakima Effectiveness Monitoring Page 14
Samples will be collected with FISP (Federal Interagency Sedimentation Project) designed samplers that permit the retrieval of a depth and width integrated sample. The US DH-59 and US DH-76 are weighted samplers that are lowered into the current while attached to a rope tether to collect a depth integrated, isokinetic sample. The DH-76 is heavier than the DH-59 and is more suitable for fast moving water. The DH-76 can also accommodate a slightly larger sample bottle, if desired. The DH-81 sampler operates in the same manner as the others but is not weighted and is controlled using a hand held rod instead of a tether. The DH-81 is better suited for use on smaller creeks and drains where there is direct access to water of wading depth. The determination of which sampler to use will be at the discretion of the field crew after observing stream conditions. As needed, nozzles may be changed depending on the depth and velocity of the water. The US-DH 81 sampler is mounted to a two-liter plastic container that is used to collect and transport the water sample. When the US-DH 59 or US-DH 76 is used for sample collection, sub-samples (< pint) collected at each sampling vertical in the stream cross section will be composited into a two or three-liter plastic bottle. The equal-width-increment (EWI) sampling method is used for the collection of samples and is described in greater detail by the U.S. Geological Survey (see Appendix A). The type of sampler used will be noted on the field data sheets. Sub-sample collection bottles and two-liter transport bottles will be washed and rinsed with filtered, de-ionized water prior to sampling at all of the sampling sites. At each stream sampling site the bottle is rinsed with a representative sample of the site water and emptied before a sample is collected. One field blank will created by each sampling group during each sampling event. The field blank will be created by filling a sample container with deionized (or distilled) water during sample collection; the field blank will be clearly marked as a blank to avoid use for analytical duplicates or matrix spikes. The field blanks will be placed in the ice chest and transported by the sampling group throughout the sampling event. A field data sheet will be completed at each of the monitoring sites. The sheet will record the date, time of sampling, personnel present, person doing the water collection, general weather conditions and any comments pertinent to the event. All surface-water samples collected in the field will be immediately sealed, labeled, and stored in ice for transport to the lab. Field blanks will be stored and transported along with the collected samples. Water samples will be transported as soon as realistically possible after sampling and stored in a cooler or refrigerator unit at the lab at 4ºC or less until analysis. Analysis by the lab will be completed within 48 hours of collection. Instrument Calibration Flow meters will be checked for calibration per the manufacturer’s recommended schedules and methods.
Quality Assurance Project Plan 2006 Upper Yakima Effectiveness Monitoring
Page 15
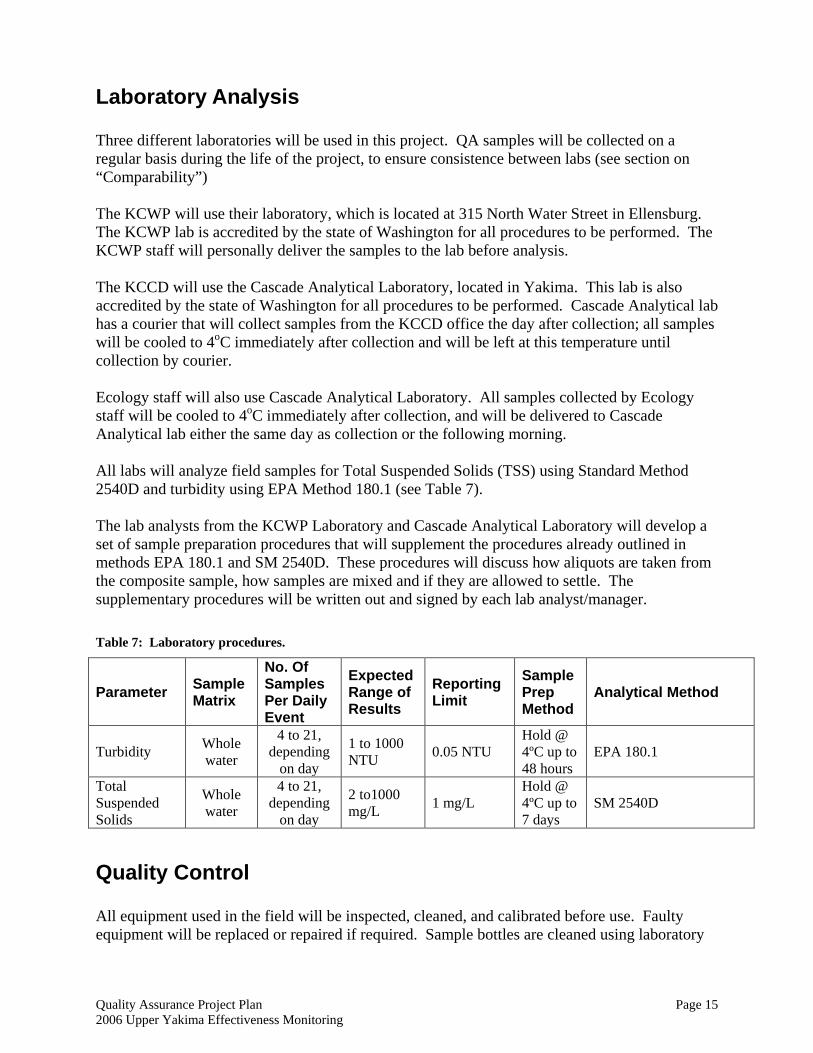
Laboratory Analysis Three different laboratories will be used in this project. QA samples will be collected on a regular basis during the life of the project, to ensure consistence between labs (see section on “Comparability”) The KCWP will use their laboratory, which is located at 315 North Water Street in Ellensburg. The KCWP lab is accredited by the state of Washington for all procedures to be performed. The KCWP staff will personally deliver the samples to the lab before analysis. The KCCD will use the Cascade Analytical Laboratory, located in Yakima. This lab is also accredited by the state of Washington for all procedures to be performed. Cascade Analytical lab has a courier that will collect samples from the KCCD office the day after collection; all samples will be cooled to 4oC immediately after collection and will be left at this temperature until collection by courier. Ecology staff will also use Cascade Analytical Laboratory. All samples collected by Ecology staff will be cooled to 4oC immediately after collection, and will be delivered to Cascade Analytical lab either the same day as collection or the following morning. All labs will analyze field samples for Total Suspended Solids (TSS) using Standard Method 2540D and turbidity using EPA Method 180.1 (see Table 7). The lab analysts from the KCWP Laboratory and Cascade Analytical Laboratory will develop a set of sample preparation procedures that will supplement the procedures already outlined in methods EPA 180.1 and SM 2540D. These procedures will discuss how aliquots are taken from the composite sample, how samples are mixed and if they are allowed to settle. The supplementary procedures will be written out and signed by each lab analyst/manager. Table 7: Laboratory procedures.
Parameter Sample Matrix
No. Of Samples Per Daily Event
Expected Range of Results
Reporting Limit
Sample Prep Method
Analytical Method
Turbidity Whole water
4 to 21, depending
on day
1 to 1000 NTU 0.05 NTU
Hold @ 4ºC up to 48 hours
EPA 180.1
Total Suspended Solids
Whole water
4 to 21, depending
on day
2 to1000 mg/L 1 mg/L
Hold @ 4ºC up to 7 days
SM 2540D
Quality Control All equipment used in the field will be inspected, cleaned, and calibrated before use. Faulty equipment will be replaced or repaired if required. Sample bottles are cleaned using laboratory
Quality Assurance Project Plan 2006 Upper Yakima Effectiveness Monitoring Page 16
soap and triple rinsed before use. The DH-81, DH-59 and DH-77 are stored to prevent contamination or damage. Field QC will consist of each sampling group collecting replicate samples during each monitoring event. Replicates consist of a full sampling of one of the monitoring sites selected randomly, but representing the full range of TSS concentrations and turbidities encountered over the course of the study. Ten percent or more of the total number of water quality samples collected for this project will be replicated in order to assess variability in field sampling. Ten percent or more of the sample analyses will also be replicated in the lab to assess analytical variability. Table 8: QC Schedule for each sampling event
Parameter Field Replicates Check against standards Laboratory
Turbidity 1/day N/A 1/day TSS 1/day N/A 1/day
NOTE: The field replicates in this table do not include the additional monthly QA samples discussed in the comparability section. The QA/comparability samples will be collected in addition to the usual field replicates. The precision statistic used is the percent difference in relative standard deviation (RSD) between replicate or duplicate pairs. For TSS and turbidity, the Ecology’s Ambient Monitoring Program has a quality assurance goal of 7% RSD between replicate or duplicate pairs (Hallock and Ehinger, 2003). This TMDL effectiveness monitoring project will also use the goal of 7% RSD. Discharge data from each of the continuously-recording gage stations identified in Table 6 will be downloaded at least every month by Ecology staff. Where necessary, Ecology will contact the owner of the gage station to ensure validity of data. Additionally, when all groups meet at the QA site (Manastash @ Brown Road), they will occasionally collect stream flow data, one after another, and compare the results; this will help ensure that all groups are using similar techniques for collecting flow data. The QC goal is 14% RSD for these flow measurement comparisons.
Data Acquisition Requirements The data analyses from this effectiveness-monitoring project will be comparable to historical data collected by USGS and the 2002 TMDL evaluation. Historical data will be collected as needed. Reference material will be collected from the TMDL and USGS reports.
Data Management All field notes are recorded during sample collection, on field data sheets. Data sheets include information of date, time, location, staff, and water quality parameters being collected. Notes are recorded for weather conditions and any other specific information needed for sample analysis or
Quality Assurance Project Plan 2006 Upper Yakima Effectiveness Monitoring
Page 17
data interpretation. Data is stored in spreadsheet format on a PC using Microsoft Excel©. The original field data sheets and photo copies will be preserved and kept on file by Ecology, the KCWP and the KCCD. The KCWP and KCCD will send provisional data to the team leader on a schedule of at least every two months. This will allow the team leader to regularly review the provisional data and check that QA goals are being met. After review, the data will be analyzed and summarized accordingly as required to complete reports. Ecology staff will be responsible for entering all data from this project into the Environmental Information Management (EIM) system.
Collect BMP Information Ecology will work closely with the KCCD, KCWP, Kittitas County, Washington State Dept of Transportation, US Forest Service and other stakeholders throughout the project area to describe and (where possible) quantify the sediment-reduction BMPs that have been implemented during the life of this TMDL. Specifically, Ecology WQP staff will interview stakeholders participating in TMDL implementation, and collect general information regarding the types and quantities of BMP implementation (e.g., miles of forest roads closed and waterbarred, acres of irrigated agricultural ground using improved irrigation practices, etc.). This information will be included in the final report as well.
Audits and Reports This project will include a written report, prepared by Ecology to address whether TMDL turbidity targets have been met. It will describe the project and include:
• A map of the study area showing sampling sites, • Descriptions of field and laboratory methods, • A discussion of data quality, estimates of precision and bias, and the significance of any
problems encountered, • A comparison with earlier studies and findings, • An evaluation of significant finding including whether turbidity targets are being met, • Description and (where possible) quantification of the sediment-reduction BMPs that
have been implemented during the life of this TMDL, and, • Recommendations for follow-up, as warranted.
A draft of this report will be reviewed by the KCCD, KCWP and Ecology’s EAP and WQP staff. The report will then be finalized by Ecology staff by September 30, 2007.
Quality Assurance Project Plan 2006 Upper Yakima Effectiveness Monitoring Page 18
Assessment and Response Actions The project manager will observe and assess team performance and will address any deviations in protocol and/or quality control measures. Any suspected deviations in data results will be investigated on a case-by-case basis to make a determination if it is a result of an analytical error, data management error or an error in the sample collection process. If errors in sampling techniques are identified, they will be addressed by the project manager and adjustments will be made. Adjustments made in the field or deviations from established protocols will be noted on the field data sheets. Analytical errors in data management will be addressed by the project manager and the quality assurance officer (Bill Kammin). Recalculation of data will result if necessary.
Data Review, Validation, and Verification All field notes will be reviewed internally by the project manager. Input into database will be compared to that on field sheets to insure that:
• Information has been accurately transcribed. • Established protocols have been followed.
The labs will verify all data before reporting the results to the project manager. The project manager will be responsible for the review of lab data and narratives for errors or omissions. Data validation will be done by the project lead using professional judgment as to whether the lab followed the procedures in this QAPP and the laboratory Quality Assurance Manual and that the requirements for this project have been met.
Data Quality Assessment After the data have been validated, the following steps will be conducted to assess the data quality prior to preparing the report:
• Review of the data quality objectives and the sampling design • Conduct a preliminary data review • Apply statistical tests as needed to assess quality assurance • Draw conclusions from the data
Reconciliation with Data Quality Objectives A final quality assurance section will be included in the final report providing a project summary of the QA/QC project including accomplishments, results of performance, quality control checks, and any significant problems encountered. In addition, the final report will provide a data quality assessment in terms of precision, accuracy, and comparability as well as a discussion regarding whether the QA objectives were met.
Quality Assurance Project Plan 2006 Upper Yakima Effectiveness Monitoring
Page 19
References Creech, J. and J. Joy. 2002. Upper Yakima River Basin Suspended Sediment, Turbidity and
Organochlorine Pesticide Total Maximum Daily Load: Submittal Report. Washington State Department of Ecology, Water Quality Program, Olympia, WA. Publication No. 02-10-047. (Available via the internet at: http://www.ecy.wa.gov/biblio/0210047.html)
Hallock, D. and W. Ehinger. 2003. Quality assurance monitoring plan: stream ambient water
quality monitoring. (Publication No. 03-03-200). Environmental Assessment Program, Washington State Department of Ecology, Olympia, WA. 32 pp.
Joy, J. 2002. Upper Yakima River basin suspended sediment and organochlorine pesticide Total
Daily Maximum Load evaluation. Publication No. 02-30-012. Environmental Assessment Program, Washington Department of Ecology, Olympia, WA 74 pages.
Joy, J., and B. Patterson. 1997. A suspended sediment and DDT Total Maximum Daily Load
evaluation report for the Yakima River. Publication No. 97-321. Washington Department of Ecology, Olympia, WA 87 pages.
Lombard, S. and C. Kirchmer. 2004. Guidelines for preparing quality assurance project plans
for environmental studies. Publication No. 04-03-030. Environmental Assessment Program, Washington Department of Ecology, Olympia, WA 100 pages
US Environmental Protection Agency (EPA). 1997. Memorandum of agreement between the
United States Environmental Protection Agency and the Washington State Department of Ecology regarding the implementation of Section 303(d) of the Federal Clean Water Act.
Webb, W.E., D.B. Radtke, and R.T. Iwatsubo. Surface-water sampling: Collection methods at
flowing-water and still-water sites. U.S. Geological Survey, Techniques of Water-Resource Investigations, Book 9, Chapter A4.

Quality Assurance Project Plan 2006 Upper Yakima Effectiveness Monitoring
Page A-1
Appendix A: Integrated Sampling Methods

Quality Assurance Project Plan 2006 Upper Yakima Effectiveness Monitoring Page A-2
Quality Assurance Project Plan 2006 Upper Yakima Effectiveness Monitoring
Page A-3
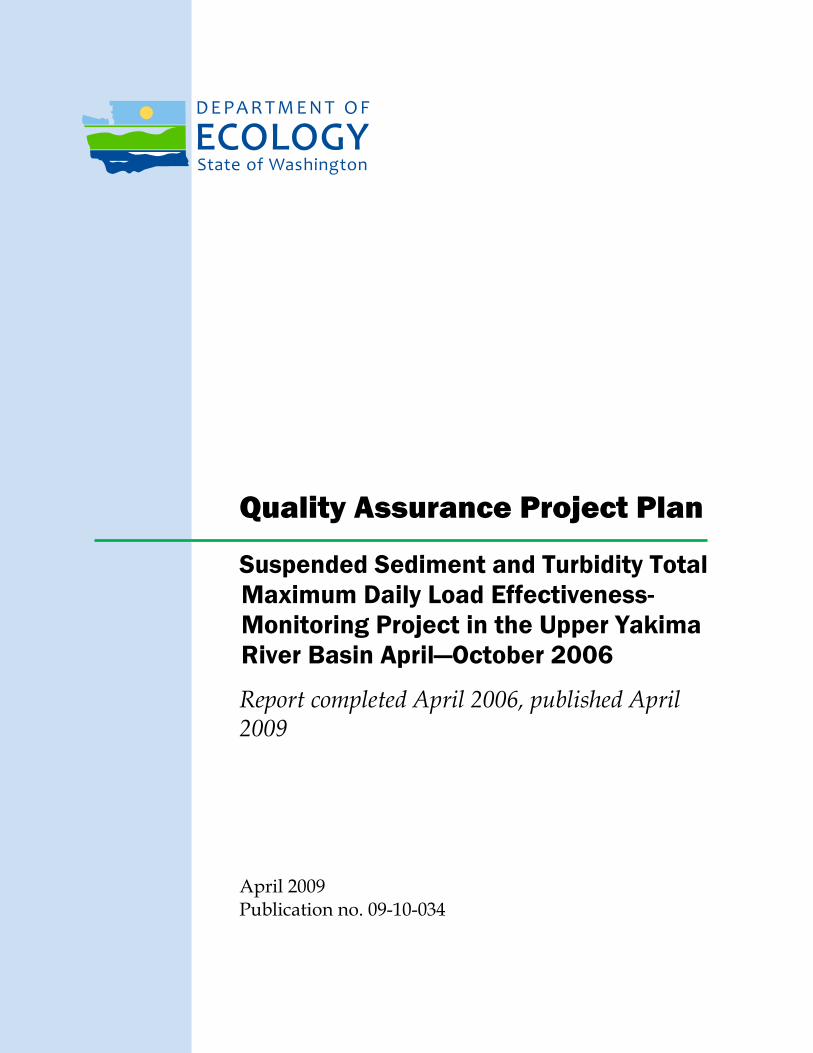
The information below is excerpted from the National Field Manual: Flowing-Water Sites 4.1.1, written by USGS Water Resources, Office of Water Quality.
Flowing stream water is collected using either isokinetic, depth-integrating or nonisokinetic sampling methods. Isokinetic, depth-integrating methods are designed to produce a discharge- weighted (velocity-weighted) sample; that is, each unit of stream discharge is equally represented in the sample (Office of Water Quality Technical Memorandum 99.02). The analyte concentrations determined in a discharge-weighted sample are multiplied by the stream discharge to obtain the discharge of the analyte.
Collection of an isokinetic, depth-integrated, discharge-weighted sample is standard procedure; however, site characteristics, sampling-equipment limitations, or study objectives constrain how a sample is collected and could necessitate use of other methods. If the QC plan calls for collection of concurrent samples, then the relevant procedures must be reviewed and the appropriate equipment prepared (section 4.3).
Nonisokinetic sampling methods, such as those involving use of an automated point sampler, generally do not result in a discharge-weighted sample unless the stream is completely mixed laterally and vertically. Thus, the analytical results cannot be used to directly compute analyte discharges.
4.1.1.A Isokinetic, Depth-Integrated Sampling Methods
Collection of isokinetic, depth-integrated samples involves using either an equal-width-increment (EWI) or equal-discharge-increment (EDI) sampling method. The EWI or EDI methods usually result in a composite sample that represents the discharge-weighted concentrations of the stream cross section being sampled. The EWI and EDI methods are used to divide a selected cross section of a stream into increments having a specified width. The term vertical refers to that location within the increment at which the sampler is lowered and raised through the water column. EWI verticals are located at the midpoint of each width increment. EDI verticals are located at the centroid, a point within each increment at which stream discharge is equal on either side of the vertical.
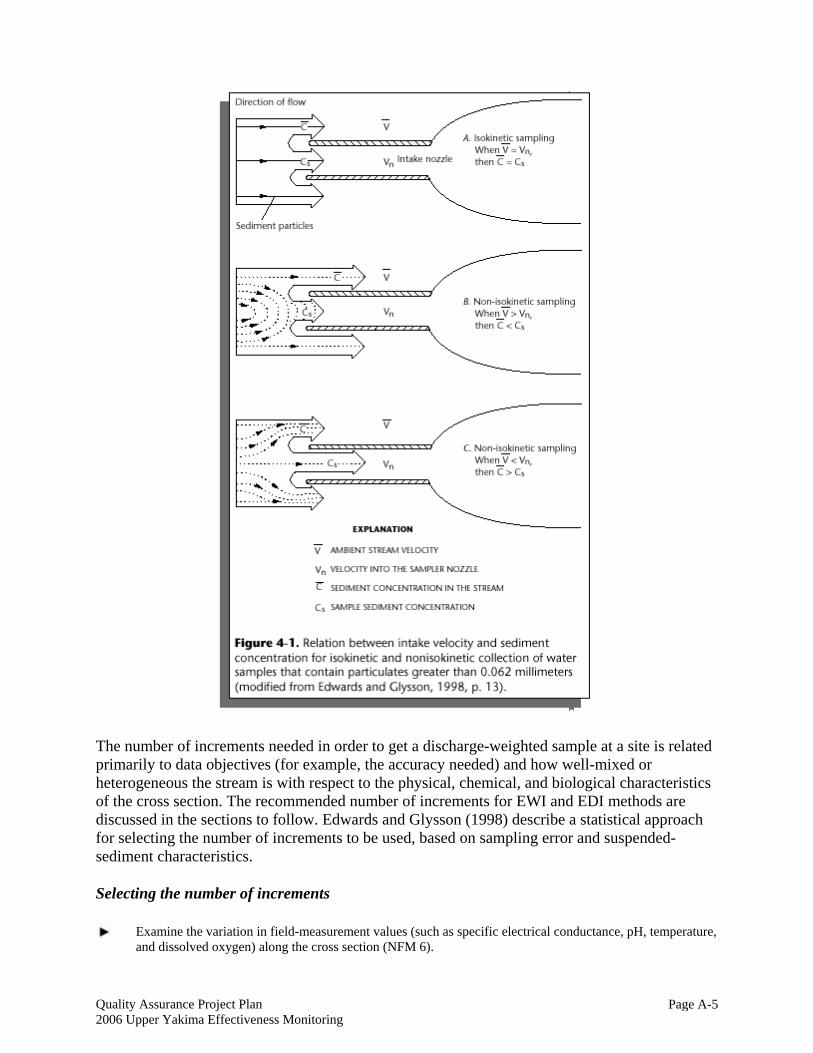
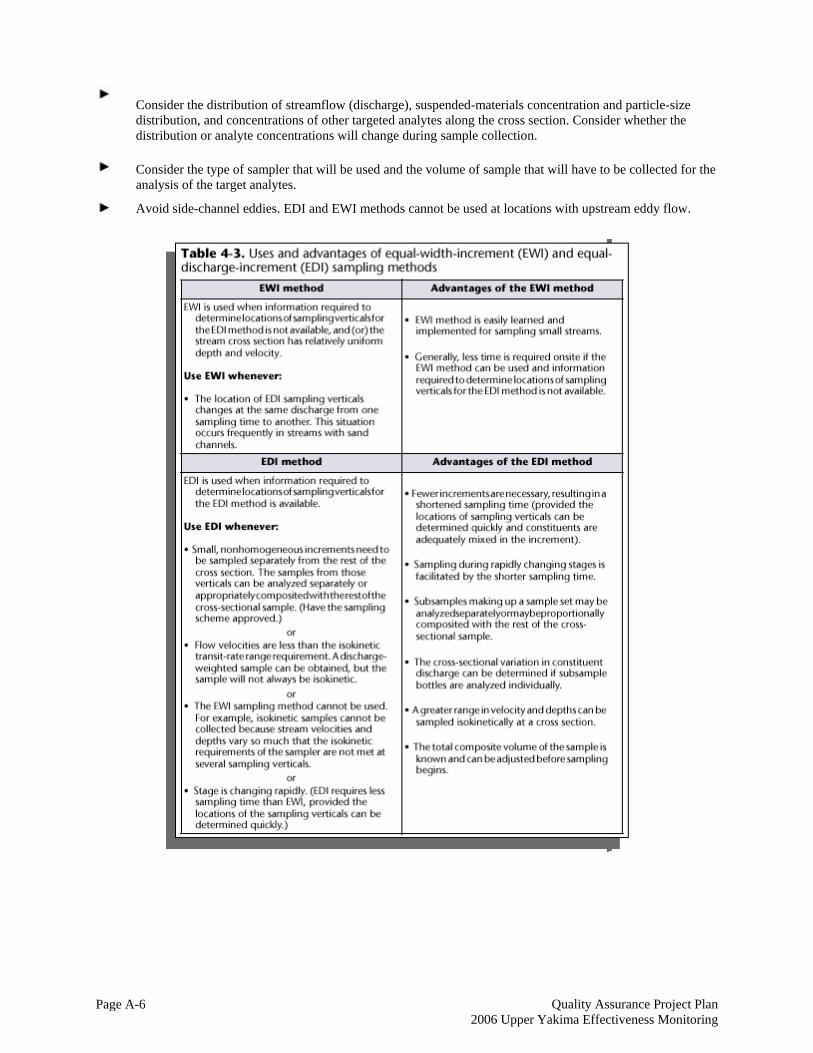
Isokinetic samplers usually are used to obtain a discharge-weighted sample along the stream cross section. When using an isokinetic sampler there should be no change in velocity (speed and direction) as the sample enters the intake (fig. 4-1). If properly implemented, EDI and EWI methods should yield identical results. The uses and advantages of each method are summarized below and in table 4-3.
Collect isokinetic, depth-integrated samples by using a standard depth- and width-integrating method if analysis of a representative sample from a cross section of flowing water is required for discharge computations. Appendix A4-A and Edwards and Glysson (1998, figures 39- 43), provide detailed information about isokinetic, depth-integrating transit rates for collecting samples.
Document the sampling method used on the appropriate field form for each sample.
Quality Assurance Project Plan 2006 Upper Yakima Effectiveness Monitoring Page A-4
For isokinetic sampling, the mean velocity of the vertical that is sampled must exceed the minimum-velocity requirement of an isokinetic sampler—the minimum velocity requirement is either 1.5 ft/s for a bottle sampler or 3 ft/s for a bag sampler (Appendix A4-A; NFM 2).
-- The transit rate (the rate at which the sampler is lowered or raised) used to collect an isokinetic, depth-integrated sample is mainly a function of the nozzle diameter of the sampler, volume of the sampler container, stream velocity, and sampling depth (Appendix A4-A; NFM 2). Note that water temperature can affect isokinetic sampling. For example, bag samplers do not work isokinetically in water temperatures that are less than about 7 ° C.
-- An error in concentrations of suspended particulates coarser than 62 mm can be significant when the velocity of the sample entering the nozzle and the stream velocity differ significantly. The velocity of the sample entering the nozzle also can be affected by the transit rate: too fast a transit rate will cause a sampler to undersample sand-sized particulates (Edwards and Glysson, 1998).
-- The transit rate must be kept constant during sampler descent through a vertical and also during sampler
ascent through a vertical. Although not necessary, usually the same transit rate is used for raising the sampler as was used for lowering the sampler through a given vertical.
RULE OF THUMB : For isokinetic, depth-integrating sampling, do not exceed the designated maximum transit rate.
Quality Assurance Project Plan 2006 Upper Yakima Effectiveness Monitoring
Page A-5
The number of increments needed in order to get a discharge-weighted sample at a site is related primarily to data objectives (for example, the accuracy needed) and how well-mixed or heterogeneous the stream is with respect to the physical, chemical, and biological characteristics of the cross section. The recommended number of increments for EWI and EDI methods are discussed in the sections to follow. Edwards and Glysson (1998) describe a statistical approach for selecting the number of increments to be used, based on sampling error and suspended-sediment characteristics.
Selecting the number of increments
Examine the variation in field-measurement values (such as specific electrical conductance, pH, temperature, and dissolved oxygen) along the cross section (NFM 6).
Quality Assurance Project Plan 2006 Upper Yakima Effectiveness Monitoring Page A-6
Consider the distribution of streamflow (discharge), suspended-materials concentration and particle-size distribution, and concentrations of other targeted analytes along the cross section. Consider whether the distribution or analyte concentrations will change during sample collection.
Consider the type of sampler that will be used and the volume of sample that will have to be collected for the analysis of the target analytes.
Avoid side-channel eddies. EDI and EWI methods cannot be used at locations with upstream eddy flow.
Quality Assurance Project Plan 2006 Upper Yakima Effectiveness Monitoring
Page A-7
Equal-width-increment (EWI) method
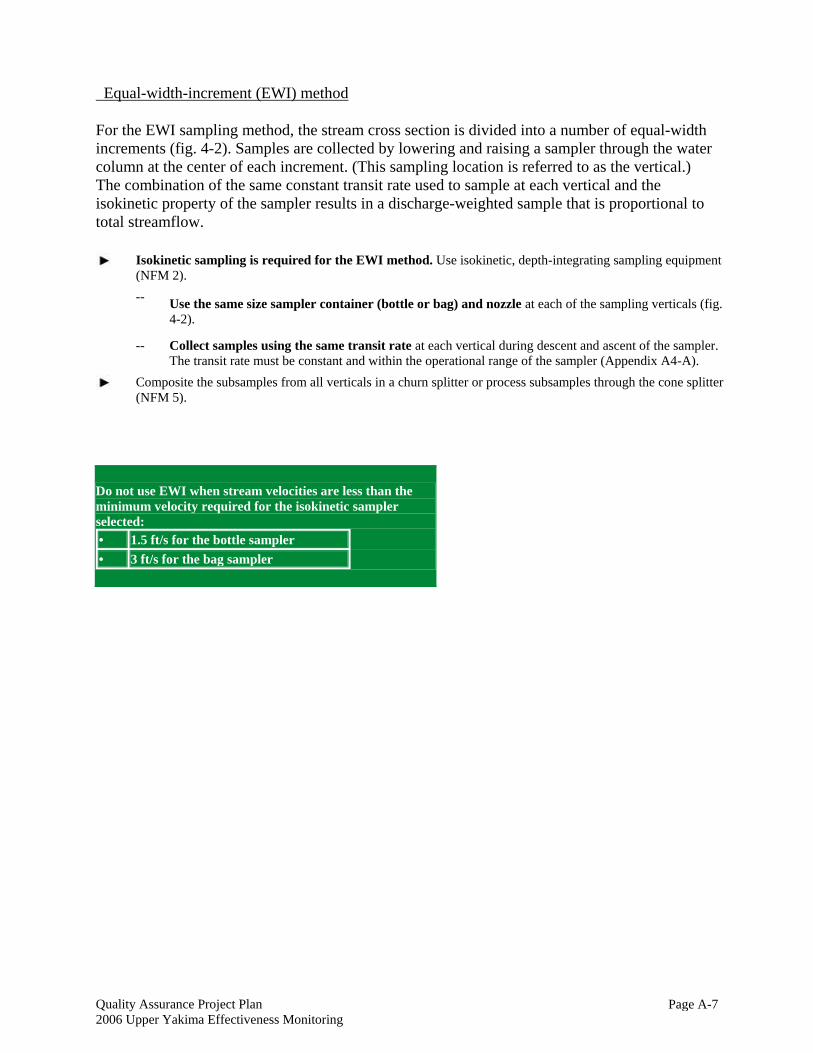
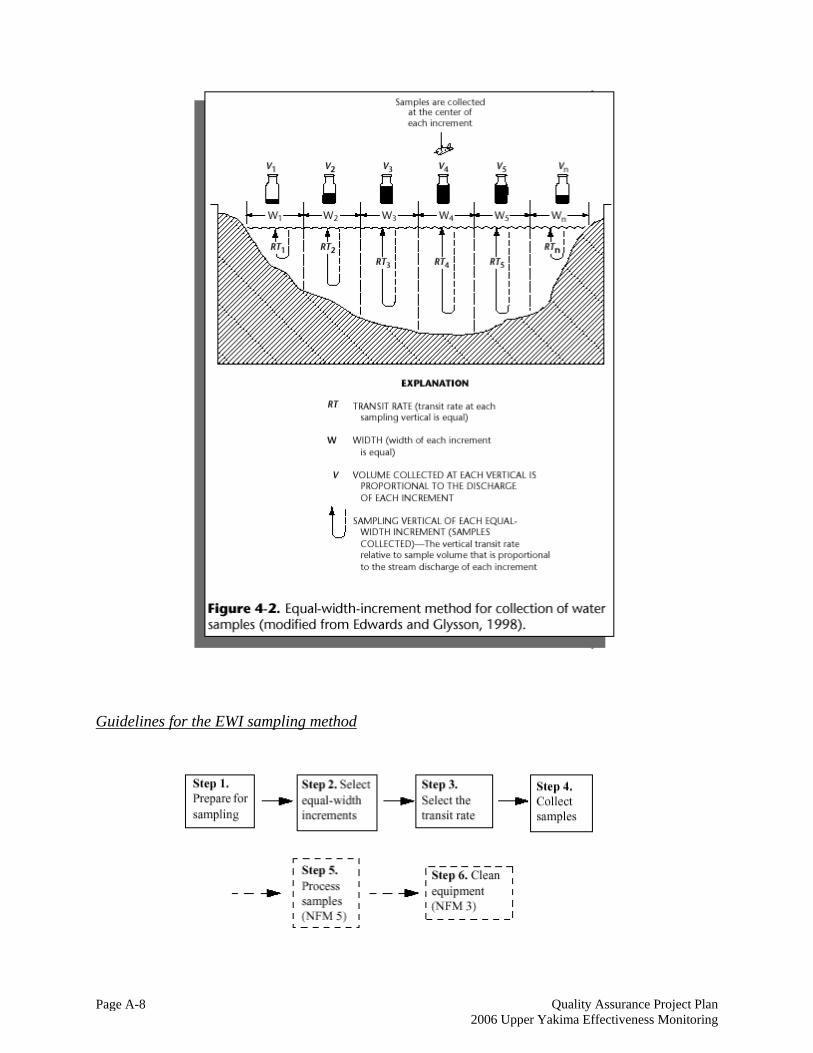
For the EWI sampling method, the stream cross section is divided into a number of equal-width increments (fig. 4-2). Samples are collected by lowering and raising a sampler through the water column at the center of each increment. (This sampling location is referred to as the vertical.) The combination of the same constant transit rate used to sample at each vertical and the isokinetic property of the sampler results in a discharge-weighted sample that is proportional to total streamflow.
Isokinetic sampling is required for the EWI method. Use isokinetic, depth-integrating sampling equipment (NFM 2).
-- Use the same size sampler container (bottle or bag) and nozzle at each of the sampling verticals (fig.
4-2).
-- Collect samples using the same transit rate at each vertical during descent and ascent of the sampler. The transit rate must be constant and within the operational range of the sampler (Appendix A4-A).
Composite the subsamples from all verticals in a churn splitter or process subsamples through the cone splitter (NFM 5).
Do not use EWI when stream velocities are less than the minimum velocity required for the isokinetic sampler selected: • 1.5 ft/s for the bottle sampler • 3 ft/s for the bag sampler
Quality Assurance Project Plan 2006 Upper Yakima Effectiveness Monitoring Page A-8
Guidelines for the EWI sampling method
Quality Assurance Project Plan 2006 Upper Yakima Effectiveness Monitoring
Page A-9
Be sure that the field effort is adequately staffed and equipped. Check QC requirements before departing—QC samples require additional equipment and supplies.
Step 1. Prepare for sampling7
a. Upon arrival at the field site, set out safety equipment such as traffic cones and signs. Park vehicle in a location and direction so as to prevent sample contamination from vehicle emissions.
b. Assemble sampling equipment and set up a clean work space. • Organic compounds. Select equipment with fluorocarbon polymer, glass, or metal
components if components will directly contact samples to be analyzed for organic compounds. Do not use plastics other than fluorocarbon polymers.
• Inorganic constituents. Select equipment with components made of fluorocarbon polymer or other relatively inert and uncolored plastics or glass if components will directly contact samples to be analyzed for inorganic constituents. Do not use metal or rubber components for trace-element sampling.
• Microbiological analyses. Collect samples for microbiological analyses using equipment and techniques described in NFM 7.
Step 2. Select the number and width of equal-width increments.
a. Visually inspect the stream from bank to bank and longitudinally, observing velocity, width, and depth distribution, and apparent distribution of sediment and aquatic biota along the cross section. Note and document the location of stagnant water, eddies, backwater, reverse flows, areas of faster than normal flow, and piers or other features along the cross section.
b. Determine stream width from a tagline or from distance markings on a bridge railing or cableway. c. At sites with little sampling history, measure and record the cross-sectional variation of field measurements
(such as specific electrical conductance, pH, temperature, and dissolved oxygen). Review the magnitude of the variations along the cross section.
d. Determine the width of the increment. To obtain the number of increments, divide the stream width by the increment width. The number of increments must be a whole number. Increment width is based on study objectives, variation in field measurements and flow, and stream-channel characteristics along the cross section.
• Collect the subsample at the center of each equal-width increment (the vertical). • If the subsample does not represent the mean value for that increment, decrease the increment width until
the mean value for the increment is represented. This will increase the number of increments sampled.
e. Locate the first sampling vertical at a distance of one-half of the selected increment width from the edge of the water. Locate all the other verticals at the center of each remaining equal-width increment along the cross section.
Example: • If a stream 56 ft wide has been divided into 14 increments of 4 ft each, the first sampling
vertical would be 2 ft from the water’s edge and subsequent verticals would be at 6, 10, 14 ft from the water’s edge, and so forth.
• Even if streamflow is divided, as in a braided channel, equal-width increments must be identical from channel to channel, and the same constant transit rate must be used at each vertical.
Quality Assurance Project Plan 2006 Upper Yakima Effectiveness Monitoring Page A-10
f. Make slight adjustments to sampling locations, if necessary, to avoid sampling where the flow is affected by a pier or other obstruction.
TECHNICAL NOTE: Sampling near or downstream from large in-stream obstructions such as bridges and piers could result in artificially elevated concentrations of suspended sediments if the sampler is immersed in an eddy that is caused by the obstruction. If it is necessary to include an eddy in the cross section to be sampled, consider treating the eddy as a solid obstruction: subtract the eddy width from that of the total cross section, and determine the width of the increments based on the remaining stream width.
RULE OF THUMB When selecting the number of equal-width increments: • Cross-sectional width 5 ft—use a minimum of 10 equal-width
increments.
• Cross-sectional width <5 ft—use as many increments as practical, but equally spaced a minimum of 3 in. apart.
Equipment limitations also constrain the number of increments selected; for example: • When using a D-95 at maximum depth with a 14-L churn splitter, EWI
samples can be collected at approximately 14 verticals. If an 8-L churn splitter is used, samples can be collected at approximately 10 verticals.
• When using a D-77 and a 14-L churn splitter, the maximum average depth must not exceed 5 ft when samples are collected at 10 verticals.
Step 3. Select the transit rate.
a. Refer to Appendix A4-A for guidelines for determining the transit rates for collecting isokinetic, depth-integrated samples. Unless the mean velocity is actually determined, use the trial-and-error method to determine the minimum transit rate.
b. Locate the equal-width increment containing the largest dis-charge (largest product of depth times velocity) by sounding for depth and either measuring or estimating velocity. At the vertical for this increment, use of the minimum transit rate results in the maximum allowable filling of the sampler bottle or bag during one vertical traverse.
c. Determine the minimum transit rate at this vertical for the type of sampler (bottle or bag), size of sampler nozzle, and the desired sample volume.
• Approximate the mean velocity of the vertical in feet per second by timing a floating marker (such as a peanut) as it travels a known distance. (A known length of flagging tape tied to the cable where the sampler is attached often is used to measure the distance.) Divide the distance (in feet) by the time (in seconds) and multiply by 0.86.
Quality Assurance Project Plan 2006 Upper Yakima Effectiveness Monitoring
Page A-11
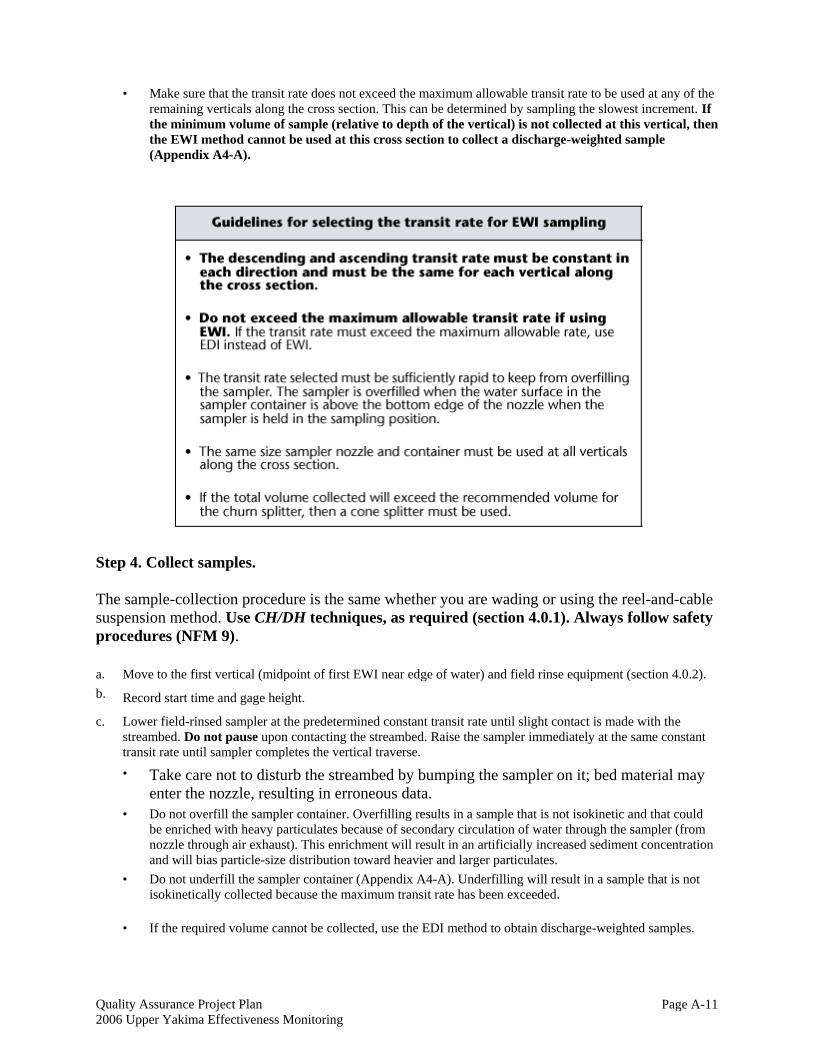
• Make sure that the transit rate does not exceed the maximum allowable transit rate to be used at any of the remaining verticals along the cross section. This can be determined by sampling the slowest increment. If the minimum volume of sample (relative to depth of the vertical) is not collected at this vertical, then the EWI method cannot be used at this cross section to collect a discharge-weighted sample (Appendix A4-A).
Step 4. Collect samples.
The sample-collection procedure is the same whether you are wading or using the reel-and-cable suspension method. Use CH/DH techniques, as required (section 4.0.1). Always follow safety procedures (NFM 9).
a. Move to the first vertical (midpoint of first EWI near edge of water) and field rinse equipment (section 4.0.2). b. Record start time and gage height.
c. Lower field-rinsed sampler at the predetermined constant transit rate until slight contact is made with the streambed. Do not pause upon contacting the streambed. Raise the sampler immediately at the same constant transit rate until sampler completes the vertical traverse.
• Take care not to disturb the streambed by bumping the sampler on it; bed material may enter the nozzle, resulting in erroneous data.
• Do not overfill the sampler container. Overfilling results in a sample that is not isokinetic and that could be enriched with heavy particulates because of secondary circulation of water through the sampler (from nozzle through air exhaust). This enrichment will result in an artificially increased sediment concentration and will bias particle-size distribution toward heavier and larger particulates.
• Do not underfill the sampler container (Appendix A4-A). Underfilling will result in a sample that is not isokinetically collected because the maximum transit rate has been exceeded.
• If the required volume cannot be collected, use the EDI method to obtain discharge-weighted samples.
Quality Assurance Project Plan 2006 Upper Yakima Effectiveness Monitoring Page A-12
d. Inspect each subsample as it is collected, looking for overfilling or underfilling of the sampler container and (or) the presence of anomalously large amounts of particulates that might have been captured because of excessive streambed disturbance during sample collection. If you note any of these conditions, discard the sample, making sure there are no residual particulates left in the container, and resample.
e. Move sampling equipment to the next vertical. Maintain the selected transit rate. The volume of the subsample can vary considerably among verticals. Subsamples can be collected at several verticals before emptying the sampler container, as long as the maximum volume of sample in a bottle or bag sampler has not been exceeded. If the container is overfilled, it is necessary to resample.
TECHNICAL NOTE: The tables in Appendix A4-A apply to the first complete round-trip transit starting with an empty sampler container. These tables cannot be used if the sampler is not emptied between verticals.
f. Continue to the next vertical until no more samples can be collected without overfilling the sampler container. Empty the subsample into a field-rinsed churn or cone splitter and repeat sample collection in the same manner until subsamples have been collected at all the verticals.
• If the total volume of the subsamples to be collected will exceed the operational capacity of the churn, select from the following options: use either a sampler with a smaller bottle or a bag sampler with a smaller nozzle; or use a cone splitter; or use the EDI method, if appropriate.
• To ensure that all particulates are transferred with the sample, swirl the subsample gently to keep particulates suspended and pour the subsample quickly into the churn or cone splitter.
• Sample EWI verticals as many times as necessary to ensure that an adequate sample volume is collected as required for analysis, but sample at each vertical an equal number of times. (The composite cross-sectional sample will remain proportional to flow at the time of sampling.)
• If flow is stable during sampling, then multiple samples can be collected at each vertical during a single traverse along the cross section. If flow is changing, however, study objectives should determine whether to collect multiple samples at each vertical during a single traverse or to collect one sample at each vertical during multiple traverses along the cross section. Document on field forms the method used.
g. Record the following information after all samples have been collected:
• Sampling end time. • Ending gage height. • All field observations and any deviations from standard sampling procedures.
Step 5. Process Samples Refer to NFM 5.
Step 6. Clean Equipment Refer to NFM 3.
• If the sampler will not be reused during a field trip, rinse sampler components with deionized water before they dry and place them into a plastic bag for transporting to the office laboratory to be cleaned.
Quality Assurance Project Plan 2006 Upper Yakima Effectiveness Monitoring
Page A-13
• If the sampler will be reused during the field trip, rinse the components with DIW while still wet from sampling and then field-clean while at the sampling site using the prescribed procedures (NFM 3). Reassemble the sampler.
• Collect a field blank, if required, after sampling equipment has been cleaned at the sampling site.
• Place the cleaned sampler into a plastic bag and seal for transport to the next site.

Quality Assurance Project Plan 2006 Upper Yakima Effectiveness Monitoring
Page B-1
Appendix B: Grab vs. Integrated Samples at Wilson Creek @ Hwy 821 Site

Quality Assurance Project Plan 2006 Upper Yakima Effectiveness Monitoring Page B-2
Quality Assurance Project Plan 2006 Upper Yakima Effectiveness Monitoring
Page B-3
Table B-1: Comparison of Grab vs. Integrated Samples at Wilson Creek @ Hwy 821.
Wilson Creek at Highway 821: Grab and Integrated Samples Compared Site
Code QC
Field Sampling Technique
Date Sampled
Time Sampled
SS mg/L
Turbidity NTU
RPD TSS
RPD Turbidity
Field Notes
YAV199 Integrated 3/18/2003 10:00 43 11 0.42 0.32 From bridge, hit bottom?
YAV199 Rep Grab 3/18/2003 10:15 28 8 from side
YAV199 Integrated 4/1/2003 8:30 62 15 0.07 0.00 from bridge
YAV199 Rep Grab 4/1/2003 8:40 58 15 from side
YAV199 Integrated 4/8/2003 13:15 15 5 0.07 0.00 from bridge
YAV199 Rep Grab 4/8/2003 13:20 14 5 from side
YAV199 Integrated 4/22/2003 9:40 97 20 0.14 0.11 from bridge
YAV199 Rep Grab 4/22/2003 9:50 84 18 from side
Average
RPD 0.175 0.105
Recommended