Qualitative and Quantitative Sampling
Types of Nonprobability Sampling
Nonprobability sampling Typically used by qualitative researchers Rarely determine sample size in advance Limited knowledge about larger group or population
Types Haphazard Quota Purposive Snowball Deviant Case Sequential
Populations and Samples
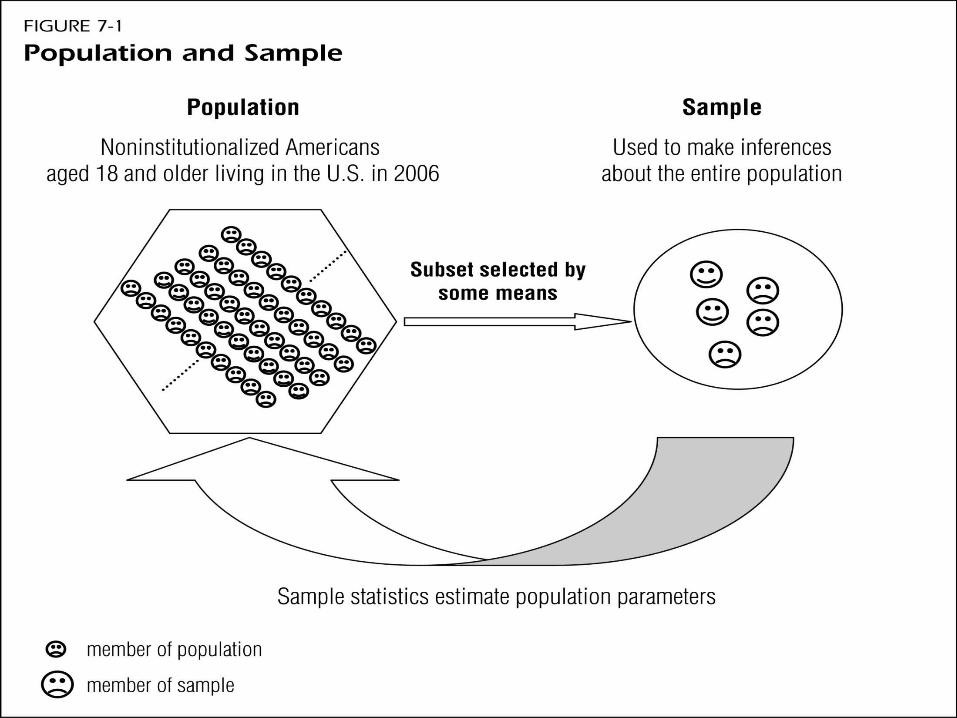
A population is any well-defined set of units of analysis.
The population is determined largely by the research question; the population should be consistent through all parts of a research project.
A sample is a subset of a population. Samples are drawn through a systematic
procedure called a sampling method. Sample statistics measure characteristics of the
sample to estimate the value of population parameters that describe the characteristics of a population.
Populations and Samples
A population would be the first choice for analysis.
Resources and feasibility usually preclude analysis of population data.
Most research uses samples.
Haphazard Sampling
Cheap and quick Can produce ineffective, highly
unrepresentative samples NOT recommended Person-on-the-street interviews Clip out survey from a newspaper and
mail it in
Quota Sampling
First you identify relevant categories of people
Then you figure out how many to sample from each category
Ensures that some differences are in the sample
Still haphazard sampling within the category, however
Purposive Sampling
Expert uses judgment in selecting cases with a specific purpose in mind Especially informative cases
Cultural themed magazines Difficult-to-reach, specialized population
Prostitutes Particular types of cases
Gamson study in the book
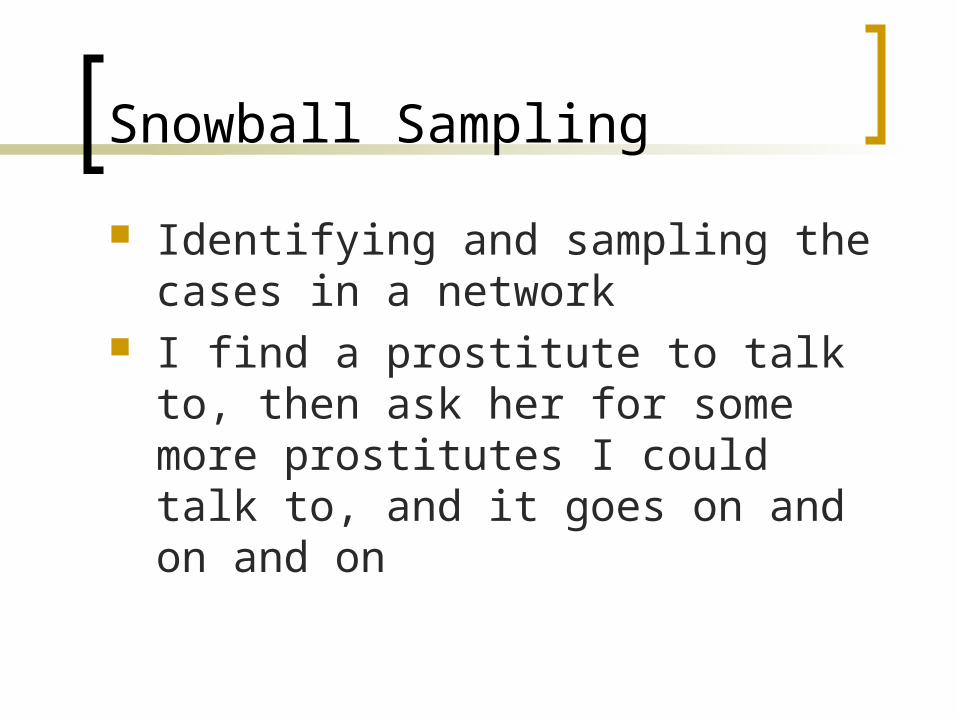
Snowball Sampling
Identifying and sampling the cases in a network
I find a prostitute to talk to, then ask her for some more prostitutes I could talk to, and it goes on and on and on
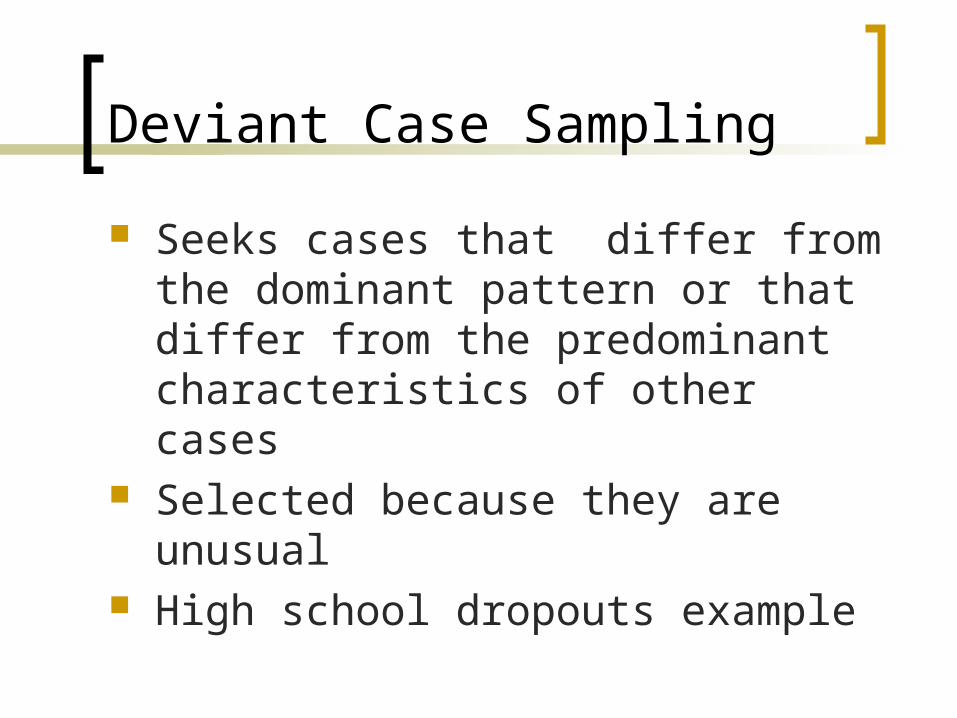
Deviant Case Sampling
Seeks cases that differ from the dominant pattern or that differ from the predominant characteristics of other cases
Selected because they are unusual High school dropouts example
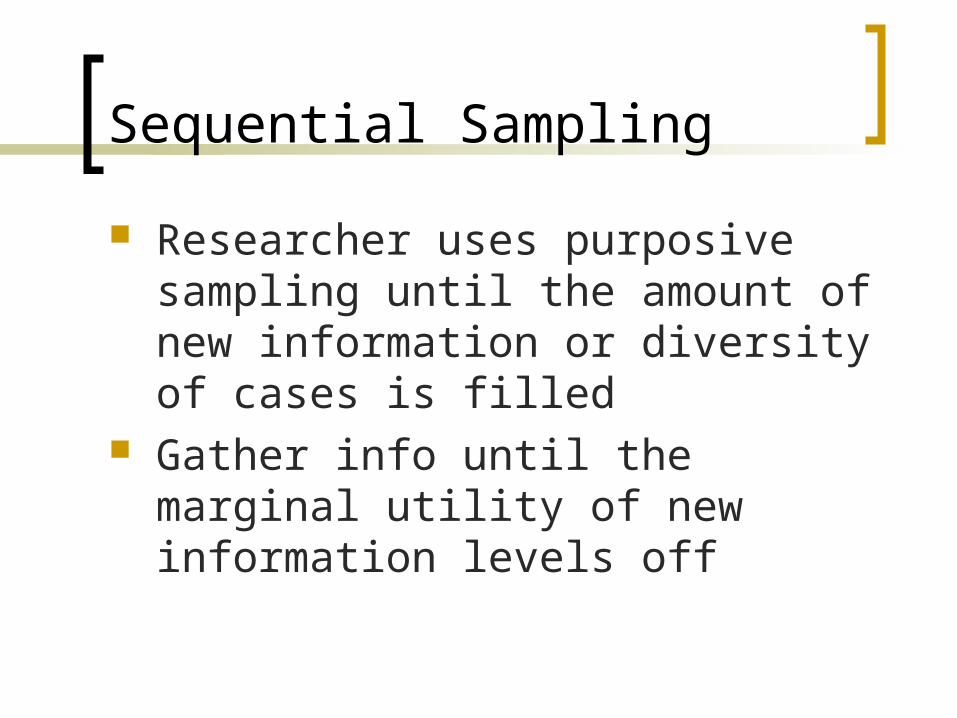
Sequential Sampling
Researcher uses purposive sampling until the amount of new information or diversity of cases is filled
Gather info until the marginal utility of new information levels off
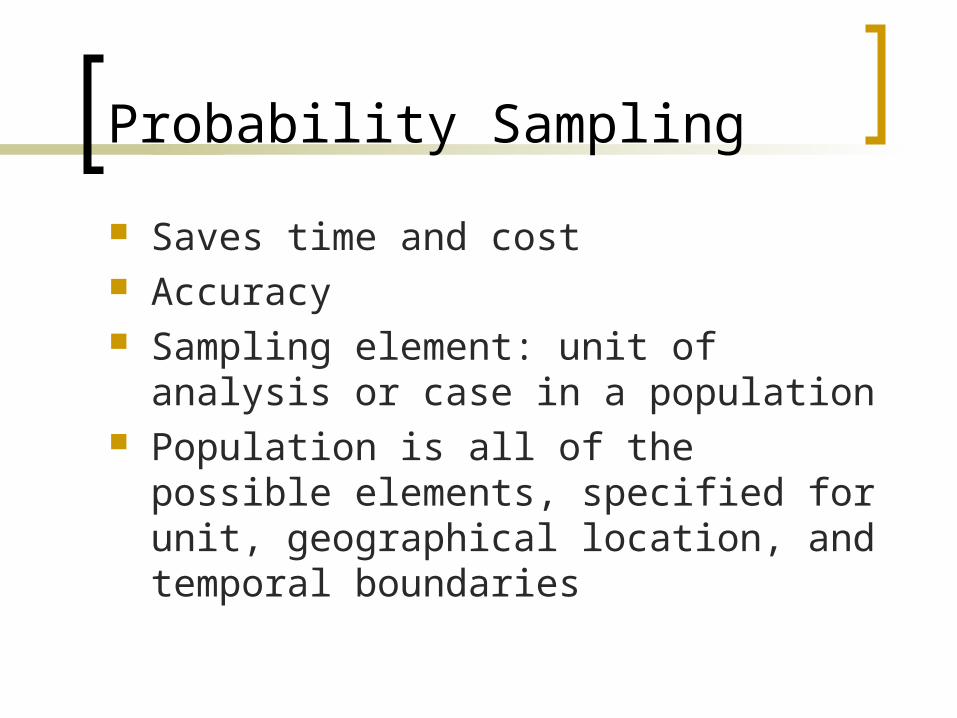
Probability Sampling
Saves time and cost Accuracy Sampling element: unit of analysis or
case in a population Population is all of the possible
elements, specified for unit, geographical location, and temporal boundaries
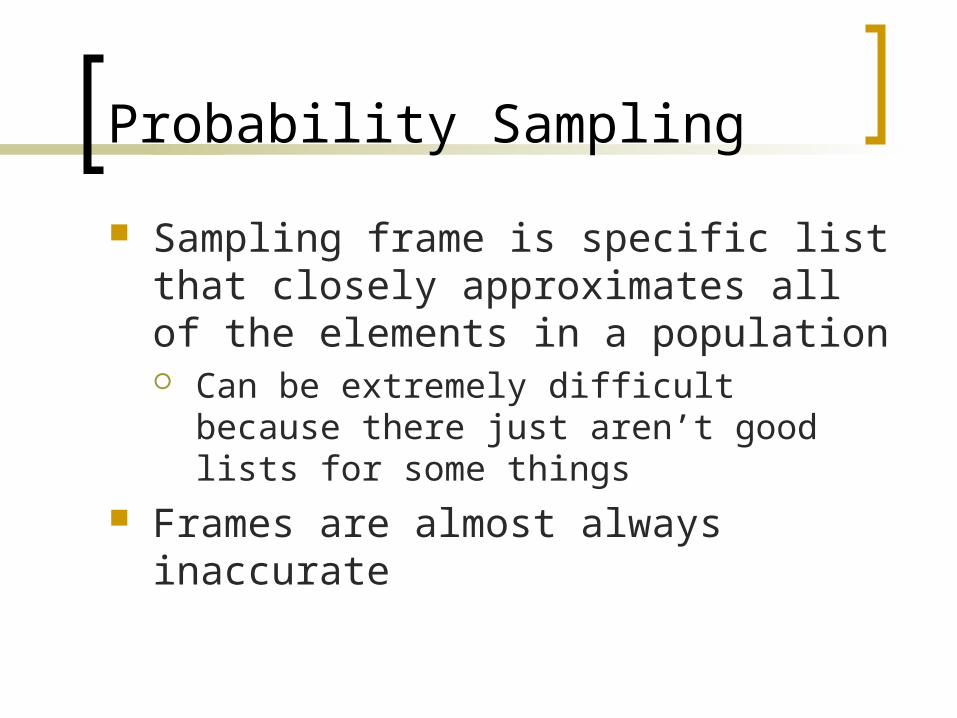
Probability Sampling
Sampling frame is specific list that closely approximates all of the elements in a population Can be extremely difficult because there
just aren’t good lists for some things Frames are almost always inaccurate
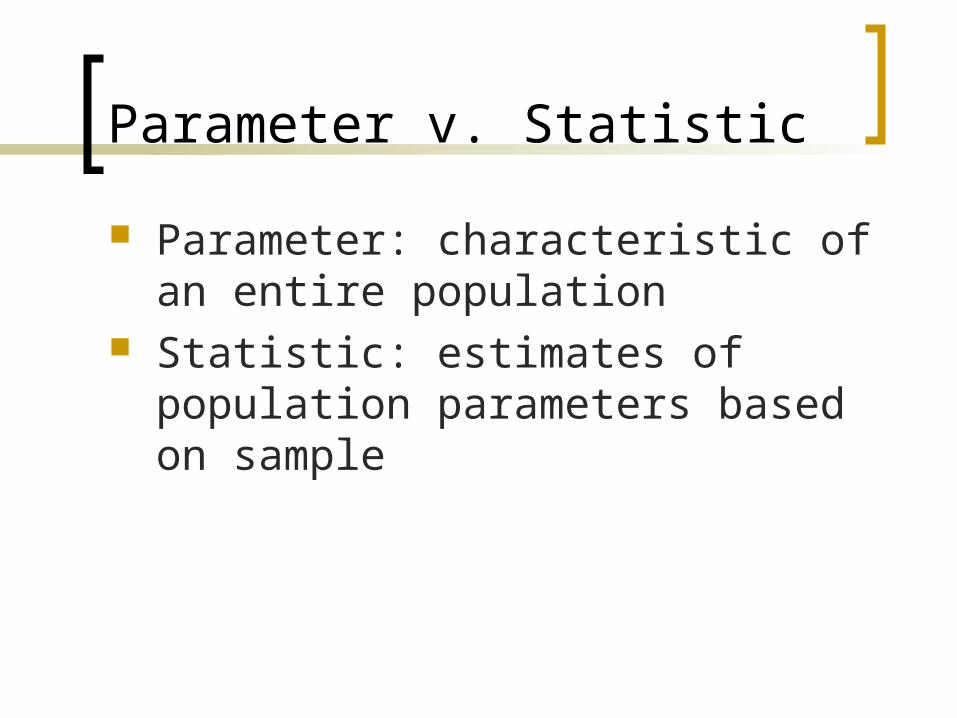
Parameter v. Statistic
Parameter: characteristic of an entire population
Statistic: estimates of population parameters based on sample
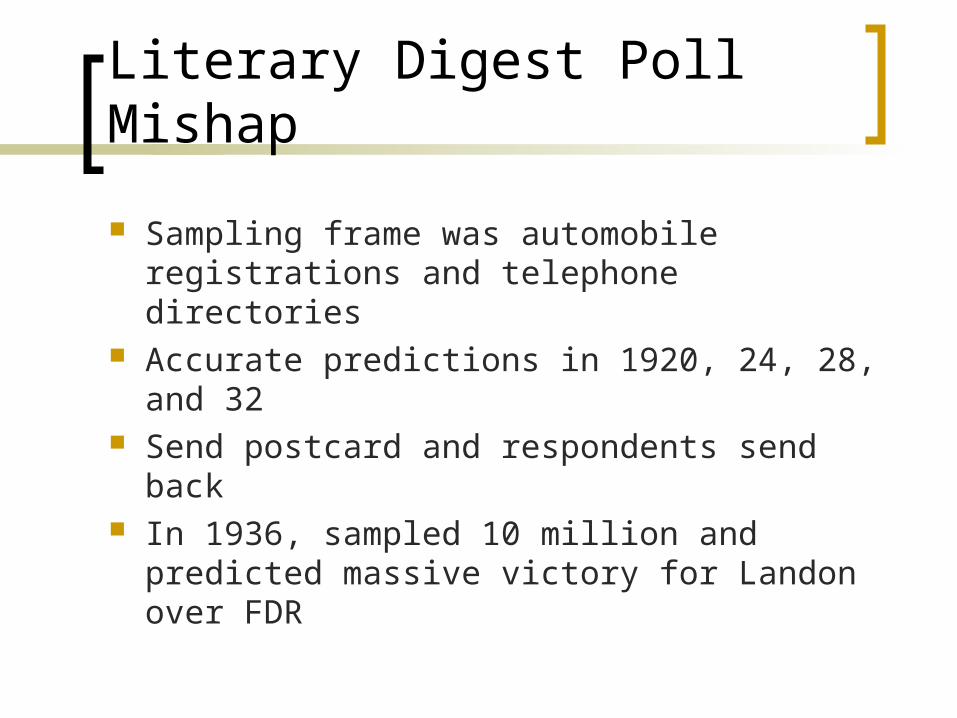
Literary Digest Poll Mishap
Sampling frame was automobile registrations and telephone directories
Accurate predictions in 1920, 24, 28, and 32
Send postcard and respondents send back
In 1936, sampled 10 million and predicted massive victory for Landon over FDR
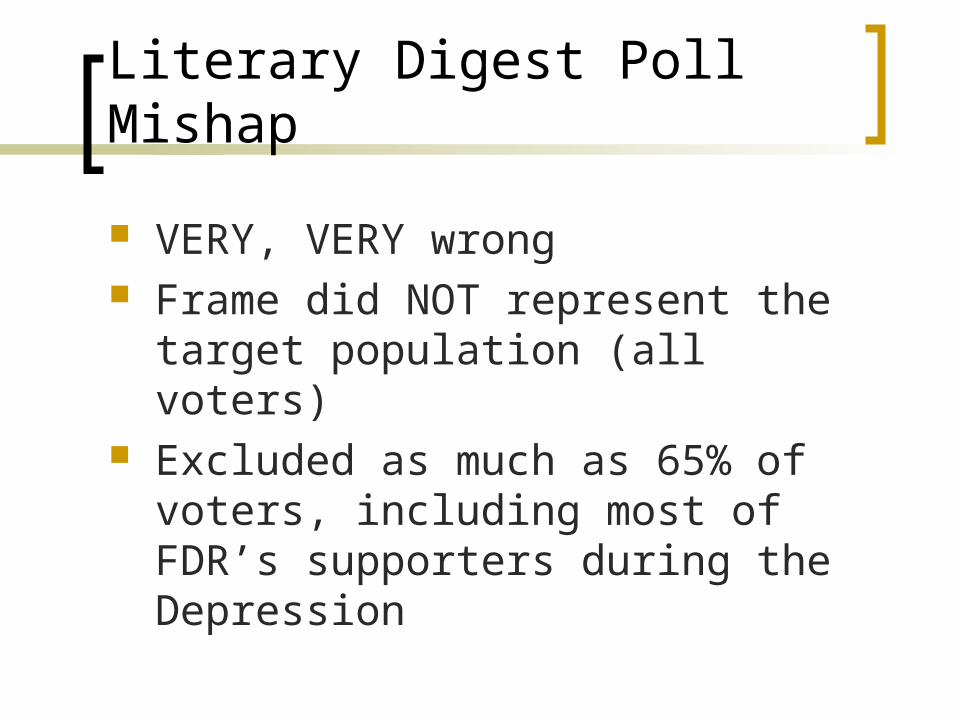
Literary Digest Poll Mishap
VERY, VERY wrong Frame did NOT represent the target
population (all voters) Excluded as much as 65% of voters,
including most of FDR’s supporters during the Depression
Why Random Sampling?
Each element has an equal probability of selection
Can statistically calculate the relationship between sample and the population—sampling error
Types: Simple Random Systematic Stratified Cluster
Simple Random Sample
Number all of the elements in a sampling frame and use a list of random numbers to select elements (or pull from a hat etc.)
Pulling marbles out of a jar Random chance can make it so we’re off
on the actual population, but over repeated independent samples, the true number will emerge
Simple Random Sample
We will end up with a normal bell curve the more we sample
Random sampling does NOT mean that every random sample will perfectly represent the population
Confidence intervals are ranges around a specific point used to estimate a parameter I am 95% certain that the population parameter lies
between 2,450 and 2,550 red marbles in the jar
Systematic Sampling
Simple random sampling with a shortcut for selection
Number each element in the sampling frame
Calculate a sampling interval—tells researcher how to select elements by skip pattern
Systematic Sampling
I want to sample 500 names from a list of 1000
Sampling interval is 2 I select a random starting point and
choose every other name to give me 500 Big problem when elements in a sample
are organized in some kind of cycle or pattern
Stratified Sampling
First divide the population into subpopulations on basis of supplemental info and then do a random sample from each subpopulation
Guarantees representation This can allow for oversampling as well
for specific research purposes
Cluster Sampling
Useful when there is no good sampling frame available All high school basketball players, for
example First you random sample clusters of
information then draw a random sample of elements from within the clusters you selected
Cluster Sampling
Example Want to sample individuals from
Cleveland Randomly select city blocks, then
households within blocks, then individuals within households
Less expensive, but also less precise Error shows up in each sample drawn
How Large Should a Sample Be?
It depends Smaller the population, the bigger your
sampling ratio will need to be to be accurate
< 1,000 = 30% 10,000 = 10% > 150,000 = 1% > 10,000,000 = .025%
How Large Should a Sample Be?
For small samples, small increases in sample size produce big gains in accuracy
Decision about best sample size depends on: Degree of accuracy required Degree of variability in population Number of variables measured simultaneously
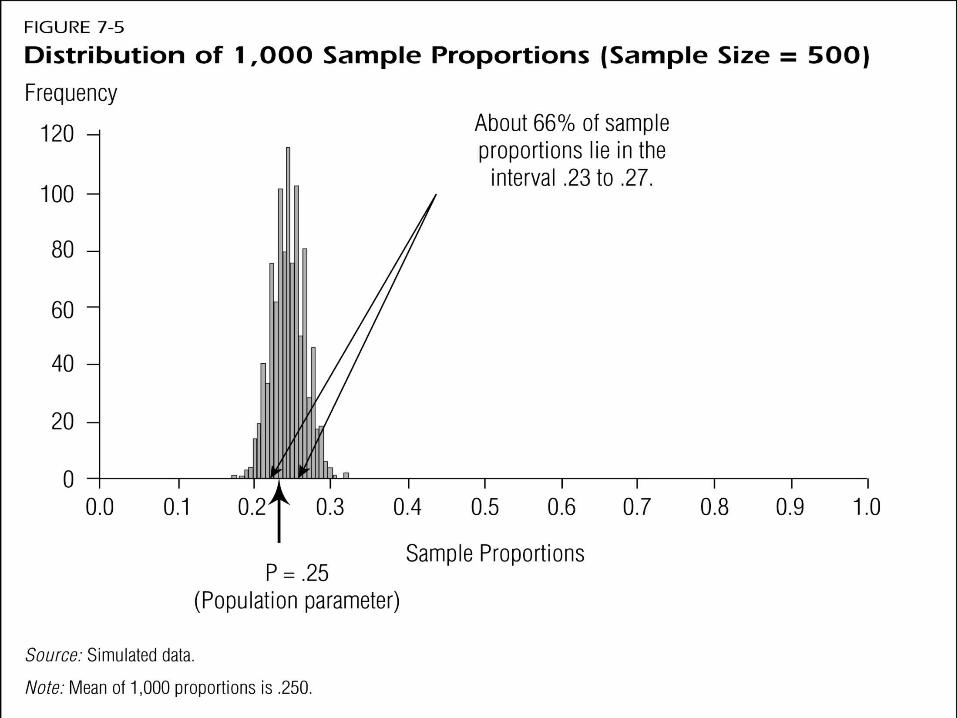
Inference The goal of statistical inference is to make
supportable conclusions about the unknown characteristics, or parameters, of a population based on the known characteristics of a sample measured through sample statistics.
Any difference between the value of a population parameter and a sample statistic is bias and can be attributed to sampling error.
Inference
On average, a sample statistic will equal the value of the population parameter.
Any single sample statistic, however, may not equal the value of the population parameter.
Consider the sampling distribution: When the means from an infinite number of samples drawn from a population are plotted on a frequency distribution, the mean of the distribution of means will equal the population parameter.
Inference
Inference
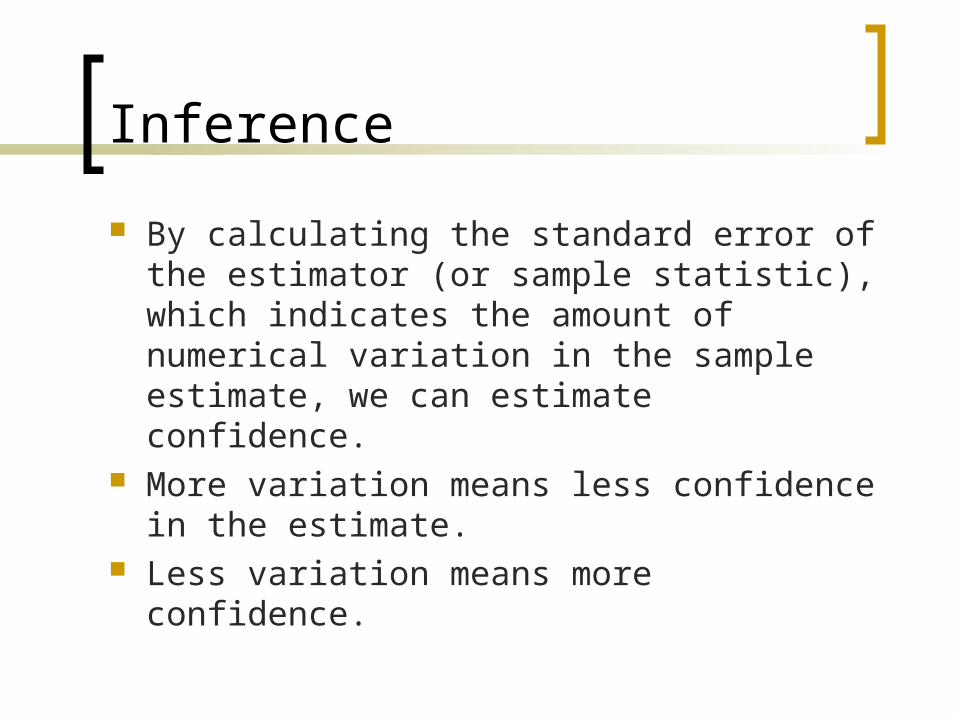
By calculating the standard error of the estimator (or sample statistic), which indicates the amount of numerical variation in the sample estimate, we can estimate confidence.
More variation means less confidence in the estimate.
Less variation means more confidence.
Inference
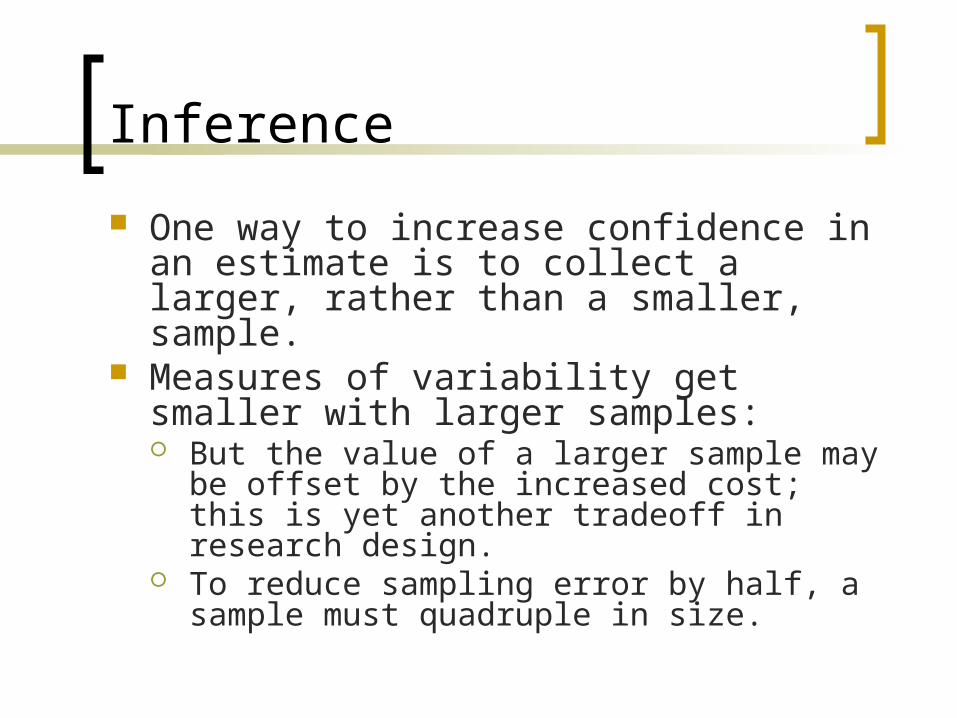
One way to increase confidence in an estimate is to collect a larger, rather than a smaller, sample.
Measures of variability get smaller with larger samples: But the value of a larger sample may be
offset by the increased cost; this is yet another tradeoff in research design.
To reduce sampling error by half, a sample must quadruple in size.
Recommended


