EVENT TITLEQ416 Earnings Call
© 2017 Advanced Emissions Solutions, Inc. All rights reserved. Confidential and Proprietary.
March 14, 2017
© 2017 Advanced Emissions Solutions, Inc. All rights reserved. Confidential and Proprietary.
Safe HarborThis presentation includes forward-looking statements within the meaning of Section 21E of the Securities Exchange Act of 1934, which provides a "safeharbor" for such statements in certain circumstances. The forward-looking statements include statements or expectations regarding future growth,strategic review of alternatives for our Emissions Control (“EC”) business, amount and timing of production of Refined Coal (“RC”), Tinuum Group, LLCand Tinuum Services, LLC cash flow and ability to make distributions and Tinuum Group’s ability to lease or sell remaining RC facilities; future revenues,expenses, cash flow, liquidity, and other financial and accounting measures; our ability to commercialize EC products and intellectual property;expectations about the timing and amount of future dividend payments; returning value to stockholders; and related matters. These statements arebased on current expectations, estimates, projections, beliefs and assumptions of our management. Such statements involve significant risks anduncertainties. Actual events or results could differ materially from those discussed in the forward-looking statements as a result of various factors,including but not limited to, changes and timing in laws, regulations, IRS interpretations or guidance, accounting rules and any pending court decisions,legal challenges to or repeal of them; changes in prices, economic conditions and market demand; the ability of the RC facilities to produce coal thatqualifies for tax credits; the timing, terms and changes in contracts for RC facilities, or failure to lease or sell RC facilities; impact of competition;availability, cost of and demand for alternative tax credit vehicles and other technologies; technical, start-up and operational difficulties; availability of rawmaterials; loss of key personnel; the value of our products, technologies and intellectual property to customers and strategic investors; intellectualproperty infringement claims from third parties; the outcome of pending litigation; seasonality and other factors discussed in greater detail in our filingswith the SEC. You are cautioned not to place undue reliance on such statements and to consult our SEC filings for additional risks and uncertainties thatmay apply to our business and the ownership of our securities. Our forward-looking statements are presented as of the date made, and we disclaim anyduty to update such statements unless required by law to do so.
-2-
© 2017 Advanced Emissions Solutions, Inc. All rights reserved. Confidential and Proprietary. -3-
2016 Strategic Priorities
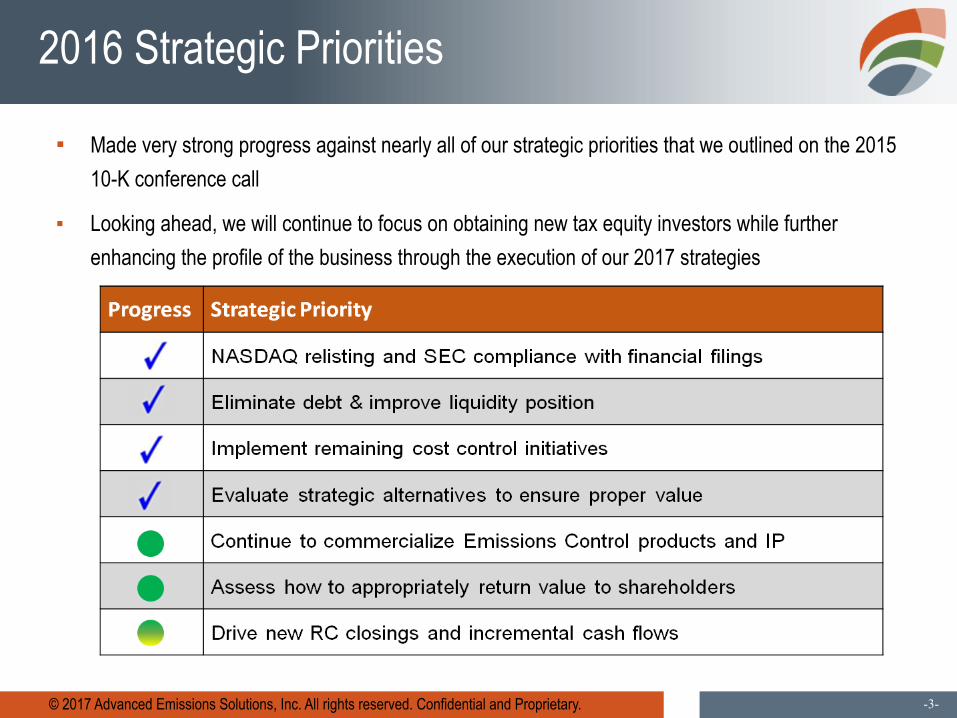
▪ Made very strong progress against nearly all of our strategic priorities that we outlined on the 201510-K conference call
▪ Looking ahead, we will continue to focus on obtaining new tax equity investors while furtherenhancing the profile of the business through the execution of our 2017 strategies
© 2017 Advanced Emissions Solutions, Inc. All rights reserved. Confidential and Proprietary. -4-
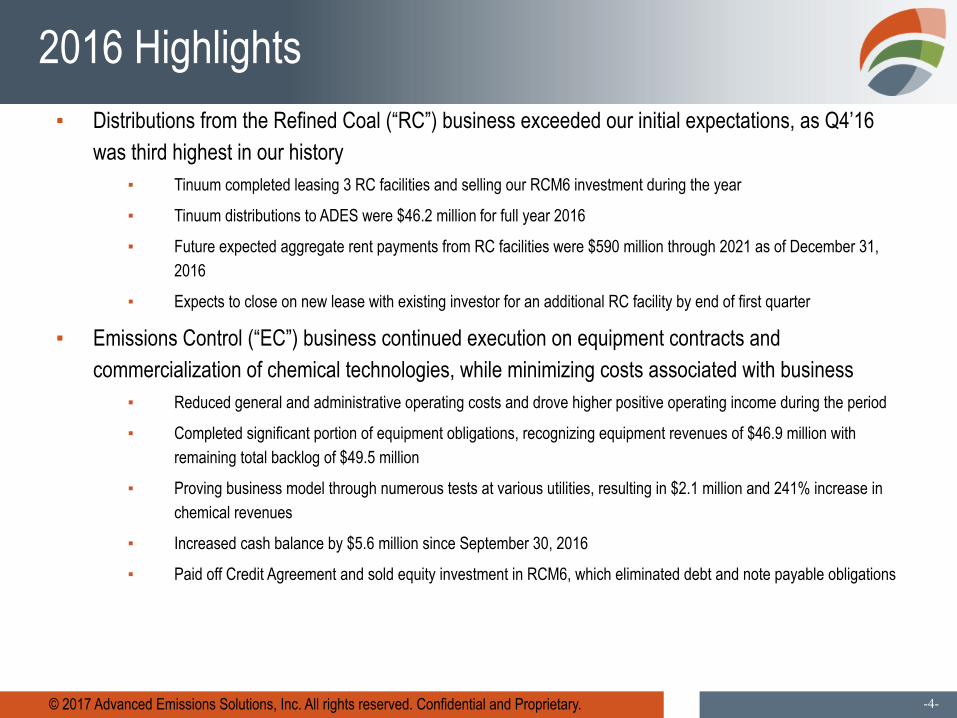
2016 Highlights▪ Distributions from the Refined Coal (“RC”) business exceeded our initial expectations, as Q4’16
was third highest in our history▪ Tinuum completed leasing 3 RC facilities and selling our RCM6 investment during the year
▪ Tinuum distributions to ADES were $46.2 million for full year 2016
▪ Future expected aggregate rent payments from RC facilities were $590 million through 2021 as of December 31,2016
▪ Expects to close on new lease with existing investor for an additional RC facility by end of first quarter
▪ Emissions Control (“EC”) business continued execution on equipment contracts andcommercialization of chemical technologies, while minimizing costs associated with business
▪ Reduced general and administrative operating costs and drove higher positive operating income during the period
▪ Completed significant portion of equipment obligations, recognizing equipment revenues of $46.9 million withremaining total backlog of $49.5 million
▪ Proving business model through numerous tests at various utilities, resulting in $2.1 million and 241% increase inchemical revenues
▪ Increased cash balance by $5.6 million since September 30, 2016
▪ Paid off Credit Agreement and sold equity investment in RCM6, which eliminated debt and note payable obligations
© 2017 Advanced Emissions Solutions, Inc. All rights reserved. Confidential and Proprietary.
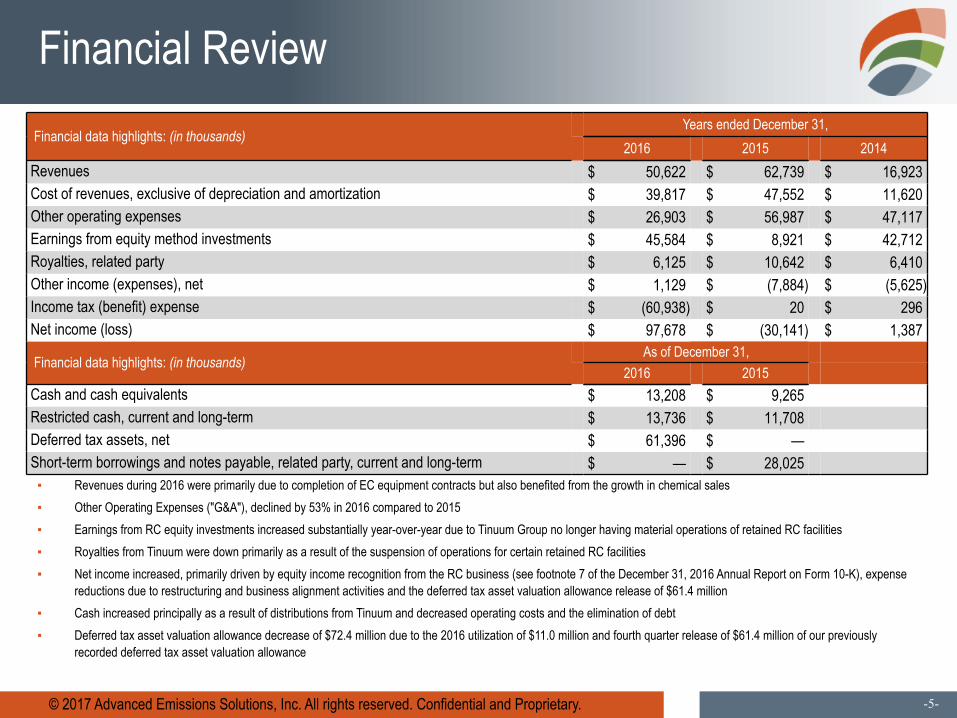
Financial data highlights: (in thousands)Years ended December 31,
2016 2015 2014Revenues $ 50,622 $ 62,739 $ 16,923Cost of revenues, exclusive of depreciation and amortization $ 39,817 $ 47,552 $ 11,620Other operating expenses $ 26,903 $ 56,987 $ 47,117Earnings from equity method investments $ 45,584 $ 8,921 $ 42,712Royalties, related party $ 6,125 $ 10,642 $ 6,410Other income (expenses), net $ 1,129 $ (7,884) $ (5,625)Income tax (benefit) expense $ (60,938) $ 20 $ 296Net income (loss) $ 97,678 $ (30,141) $ 1,387
Financial data highlights: (in thousands)As of December 31,
2016 2015Cash and cash equivalents $ 13,208 $ 9,265Restricted cash, current and long-term $ 13,736 $ 11,708Deferred tax assets, net $ 61,396 $ —Short-term borrowings and notes payable, related party, current and long-term $ — $ 28,025
-5-
Financial Review
▪ Revenues during 2016 were primarily due to completion of EC equipment contracts but also benefited from the growth in chemical sales▪ Other Operating Expenses ("G&A"), declined by 53% in 2016 compared to 2015 ▪ Earnings from RC equity investments increased substantially year-over-year due to Tinuum Group no longer having material operations of retained RC facilities ▪ Royalties from Tinuum were down primarily as a result of the suspension of operations for certain retained RC facilities▪ Net income increased, primarily driven by equity income recognition from the RC business (see footnote 7 of the December 31, 2016 Annual Report on Form 10-K), expense
reductions due to restructuring and business alignment activities and the deferred tax asset valuation allowance release of $61.4 million▪ Cash increased principally as a result of distributions from Tinuum and decreased operating costs and the elimination of debt ▪ Deferred tax asset valuation allowance decrease of $72.4 million due to the 2016 utilization of $11.0 million and fourth quarter release of $61.4 million of our previously
recorded deferred tax asset valuation allowance
© 2017 Advanced Emissions Solutions, Inc. All rights reserved. Confidential and Proprietary.
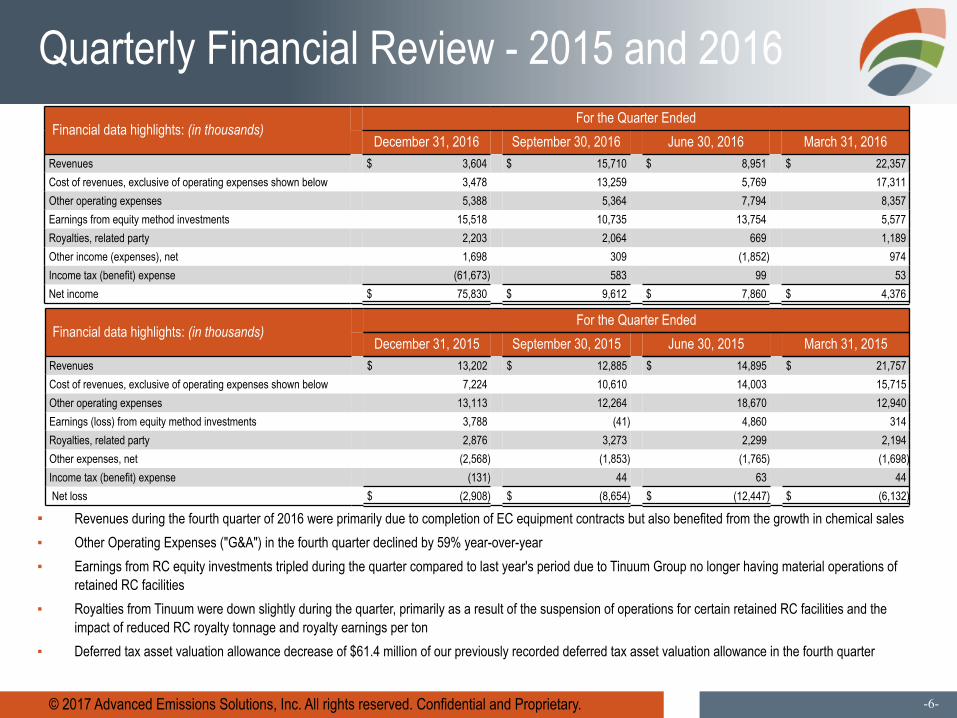
Financial data highlights: (in thousands)For the Quarter Ended
December 31, 2016 September 30, 2016 June 30, 2016 March 31, 2016Revenues $ 3,604 $ 15,710 $ 8,951 $ 22,357Cost of revenues, exclusive of operating expenses shown below 3,478 13,259 5,769 17,311Other operating expenses 5,388 5,364 7,794 8,357Earnings from equity method investments 15,518 10,735 13,754 5,577Royalties, related party 2,203 2,064 669 1,189Other income (expenses), net 1,698 309 (1,852) 974Income tax (benefit) expense (61,673) 583 99 53Net income $ 75,830 $ 9,612 $ 7,860 $ 4,376
-6-
Quarterly Financial Review - 2015 and 2016
▪ Revenues during the fourth quarter of 2016 were primarily due to completion of EC equipment contracts but also benefited from the growth in chemical sales▪ Other Operating Expenses ("G&A") in the fourth quarter declined by 59% year-over-year▪ Earnings from RC equity investments tripled during the quarter compared to last year's period due to Tinuum Group no longer having material operations of
retained RC facilities ▪ Royalties from Tinuum were down slightly during the quarter, primarily as a result of the suspension of operations for certain retained RC facilities and the
impact of reduced RC royalty tonnage and royalty earnings per ton▪ Deferred tax asset valuation allowance decrease of $61.4 million of our previously recorded deferred tax asset valuation allowance in the fourth quarter
Financial data highlights: (in thousands)For the Quarter Ended
December 31, 2015 September 30, 2015 June 30, 2015 March 31, 2015Revenues $ 13,202 $ 12,885 $ 14,895 $ 21,757Cost of revenues, exclusive of operating expenses shown below 7,224 10,610 14,003 15,715Other operating expenses 13,113 12,264 18,670 12,940Earnings (loss) from equity method investments 3,788 (41) 4,860 314Royalties, related party 2,876 3,273 2,299 2,194Other expenses, net (2,568) (1,853) (1,765) (1,698)Income tax (benefit) expense (131) 44 63 44 Net loss $ (2,908) $ (8,654) $ (12,447) $ (6,132)
© 2017 Advanced Emissions Solutions, Inc. All rights reserved. Confidential and Proprietary. -7-
Select Components of Net Income (Loss)
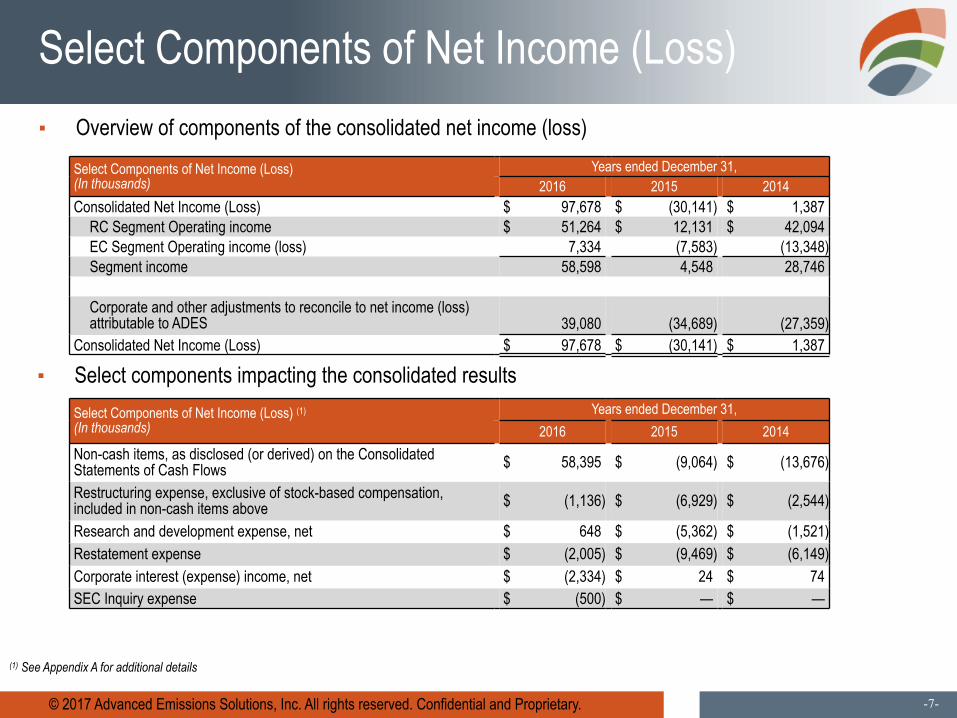
Select Components of Net Income (Loss)(In thousands)
Years ended December 31,2016 2015 2014
Consolidated Net Income (Loss) $ 97,678 $ (30,141) $ 1,387RC Segment Operating income $ 51,264 $ 12,131 $ 42,094EC Segment Operating income (loss) 7,334 (7,583) (13,348)Segment income 58,598 4,548 28,746
Corporate and other adjustments to reconcile to net income (loss)attributable to ADES 39,080 (34,689) (27,359)
Consolidated Net Income (Loss) $ 97,678 $ (30,141) $ 1,387
▪ Overview of components of the consolidated net income (loss)
Select Components of Net Income (Loss) (1)
(In thousands)Years ended December 31,
2016 2015 2014Non-cash items, as disclosed (or derived) on the ConsolidatedStatements of Cash Flows $ 58,395 $ (9,064) $ (13,676)
Restructuring expense, exclusive of stock-based compensation,included in non-cash items above $ (1,136) $ (6,929) $ (2,544)
Research and development expense, net $ 648 $ (5,362) $ (1,521)Restatement expense $ (2,005) $ (9,469) $ (6,149)Corporate interest (expense) income, net $ (2,334) $ 24 $ 74SEC Inquiry expense $ (500) $ — $ —
▪ Select components impacting the consolidated results
(1) See Appendix A for additional details
Refined Coal
© 2017 Advanced Emissions Solutions, Inc. All rights reserved. Confidential and Proprietary. -9-
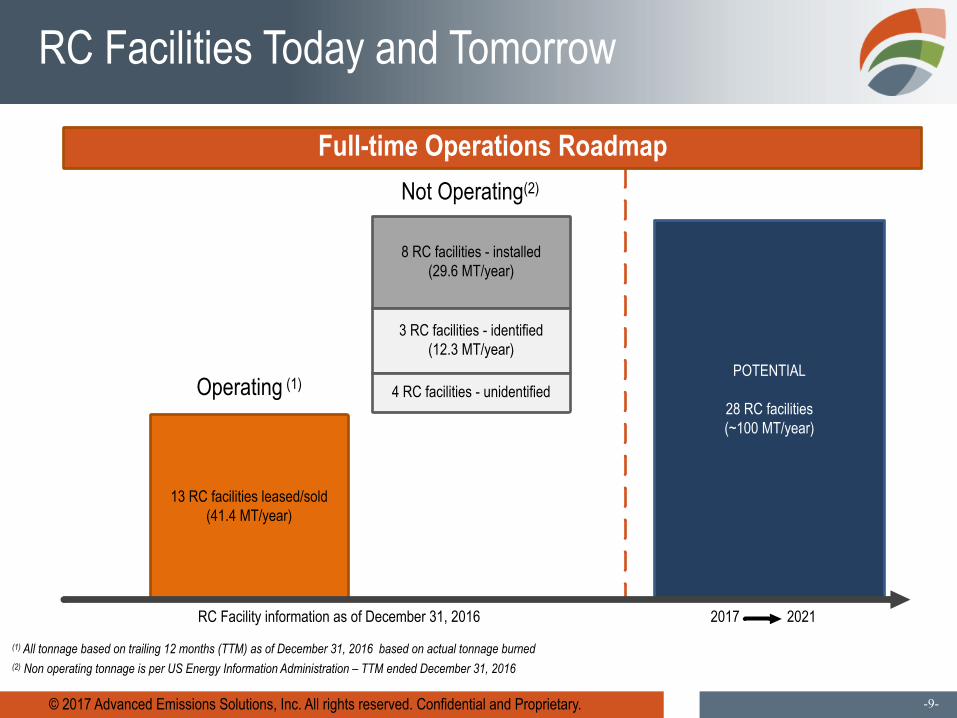
RC Facilities Today and Tomorrow
POTENTIAL
28 RC facilities(~100 MT/year)
8 RC facilities - installed(29.6 MT/year)
2017 2021RC Facility information as of December 31, 2016
13 RC facilities leased/sold(41.4 MT/year)
Operating (1)
Not Operating(2)
3 RC facilities - identified(12.3 MT/year)
Full-time Operations Roadmap
(1) All tonnage based on trailing 12 months (TTM) as of December 31, 2016 based on actual tonnage burned(2) Non operating tonnage is per US Energy Information Administration – TTM ended December 31, 2016
4 RC facilities - unidentified
© 2017 Advanced Emissions Solutions, Inc. All rights reserved. Confidential and Proprietary. -10-
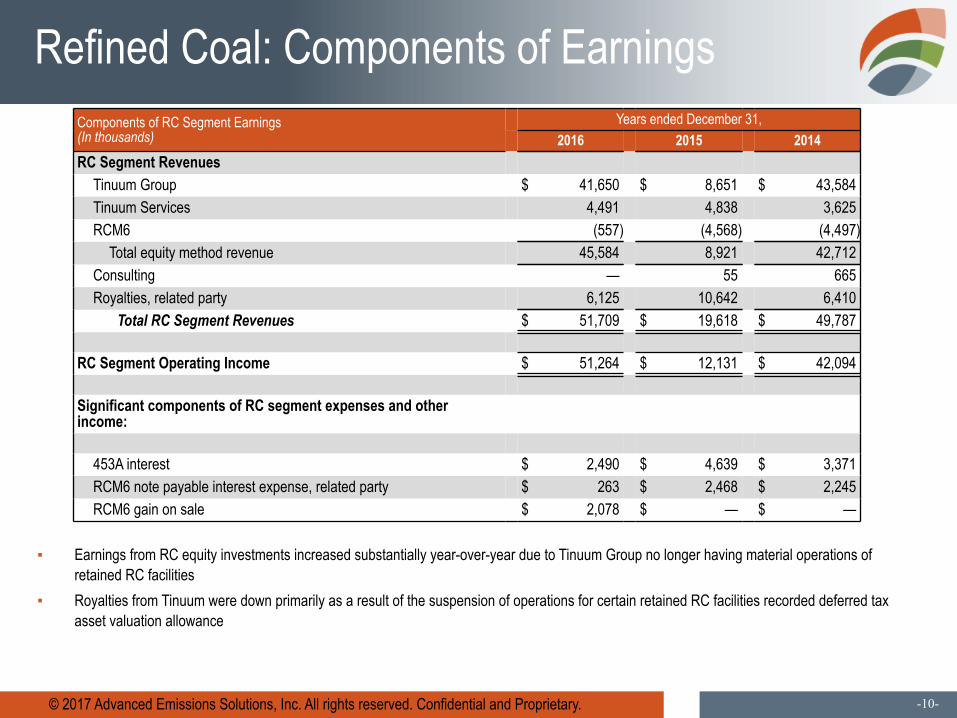
Refined Coal: Components of EarningsComponents of RC Segment Earnings(In thousands)
Years ended December 31,2016 2015 2014
RC Segment RevenuesTinuum Group $ 41,650 $ 8,651 $ 43,584Tinuum Services 4,491 4,838 3,625RCM6 (557) (4,568) (4,497)
Total equity method revenue 45,584 8,921 42,712Consulting — 55 665Royalties, related party 6,125 10,642 6,410
Total RC Segment Revenues $ 51,709 $ 19,618 $ 49,787
RC Segment Operating Income $ 51,264 $ 12,131 $ 42,094
Significant components of RC segment expenses and otherincome:
453A interest $ 2,490 $ 4,639 $ 3,371RCM6 note payable interest expense, related party $ 263 $ 2,468 $ 2,245RCM6 gain on sale $ 2,078 $ — $ —
▪ Earnings from RC equity investments increased substantially year-over-year due to Tinuum Group no longer having material operations ofretained RC facilities
▪ Royalties from Tinuum were down primarily as a result of the suspension of operations for certain retained RC facilities recorded deferred taxasset valuation allowance
© 2017 Advanced Emissions Solutions, Inc. All rights reserved. Confidential and Proprietary. -11-
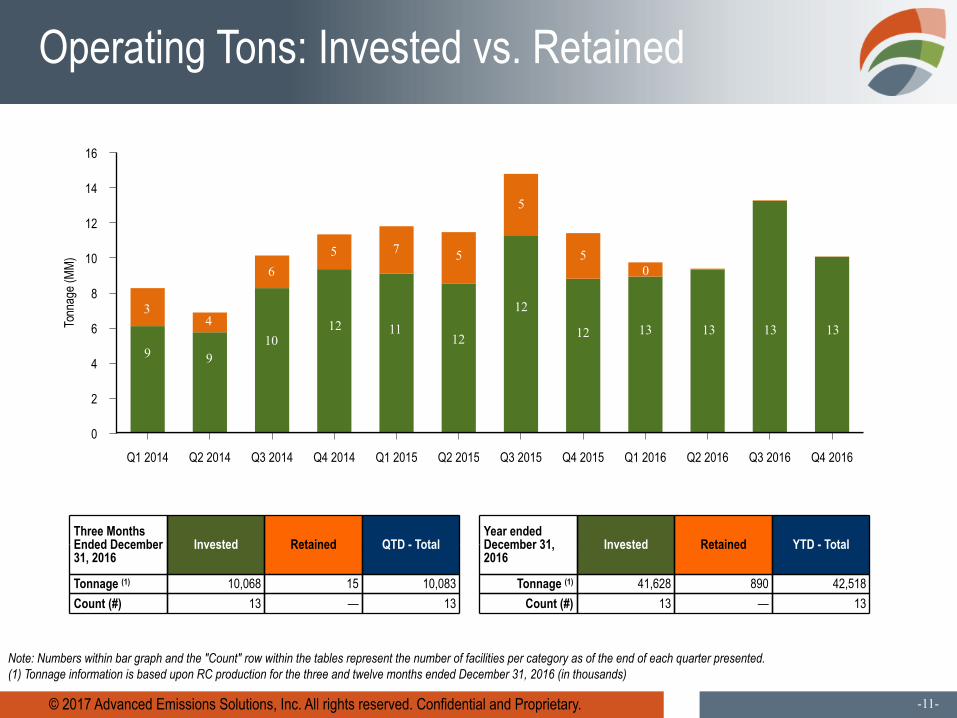
Operating Tons: Invested vs. Retained
Note: Numbers within bar graph and the "Count" row within the tables represent the number of facilities per category as of the end of each quarter presented.(1) Tonnage information is based upon RC production for the three and twelve months ended December 31, 2016 (in thousands)
16
14
12
10
8
6
4
2
0
Tonn
age(
MM)
Q1 2014 Q2 2014 Q3 2014 Q4 2014 Q1 2015 Q2 2015 Q3 2015 Q4 2015 Q1 2016 Q2 2016 Q3 2016 Q4 2016
Three MonthsEnded December31, 2016
Invested Retained QTD - TotalYear endedDecember 31,2016
Invested Retained YTD - Total
Tonnage (1) 10,068 15 10,083 Tonnage (1) 41,628 890 42,518Count (#) 13 — 13 Count (#) 13 — 13
3
3
9 910
12 1112
12
12 13 13 4
65 7 5
5
50
13 13
© 2017 Advanced Emissions Solutions, Inc. All rights reserved. Confidential and Proprietary. -12-
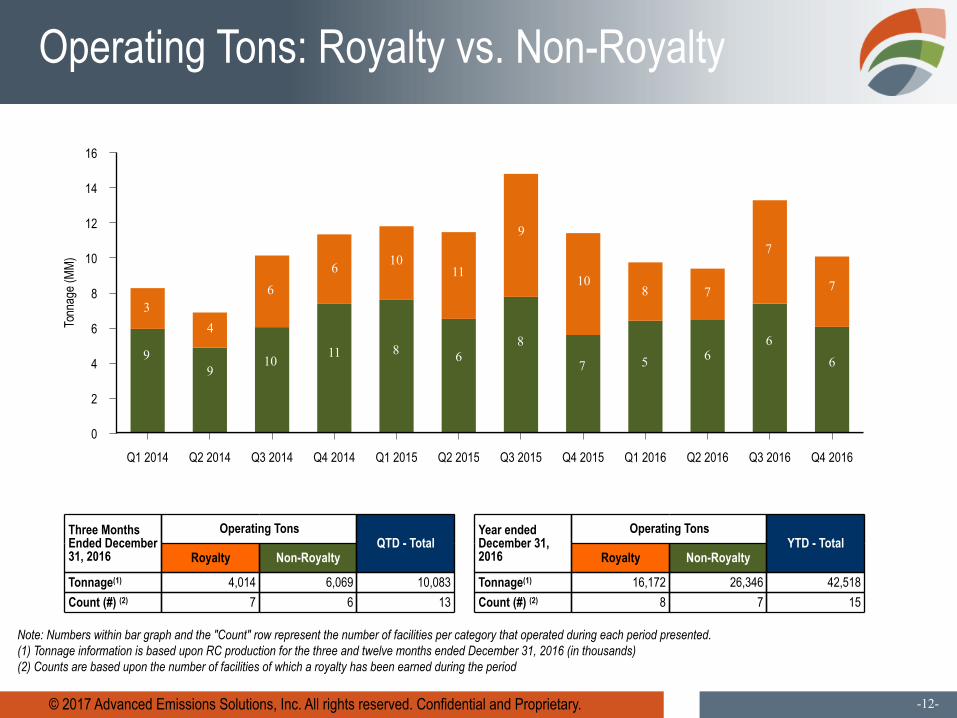
Operating Tons: Royalty vs. Non-Royalty
Note: Numbers within bar graph and the "Count" row represent the number of facilities per category that operated during each period presented.(1) Tonnage information is based upon RC production for the three and twelve months ended December 31, 2016 (in thousands)(2) Counts are based upon the number of facilities of which a royalty has been earned during the period
16
14
12
10
8
6
4
2
0
Tonn
age(
MM)
Q1 2014 Q2 2014 Q3 2014 Q4 2014 Q1 2015 Q2 2015 Q3 2015 Q4 2015 Q1 2016 Q2 2016 Q3 2016 Q4 2016
Three MonthsEnded December31, 2016
Operating TonsQTD - Total
Year endedDecember 31,2016
Operating TonsYTD - Total
Royalty Non-Royalty Royalty Non-Royalty
Tonnage(1) 4,014 6,069 10,083 Tonnage(1) 16,172 26,346 42,518Count (#) (2) 7 6 13 Count (#) (2) 8 7 15
3
9 9
10 11 8 6
8
7 5 6
4
6 6 10
11
9
10 8
7
7
6
7
6
© 2017 Advanced Emissions Solutions, Inc. All rights reserved. Confidential and Proprietary. -13-
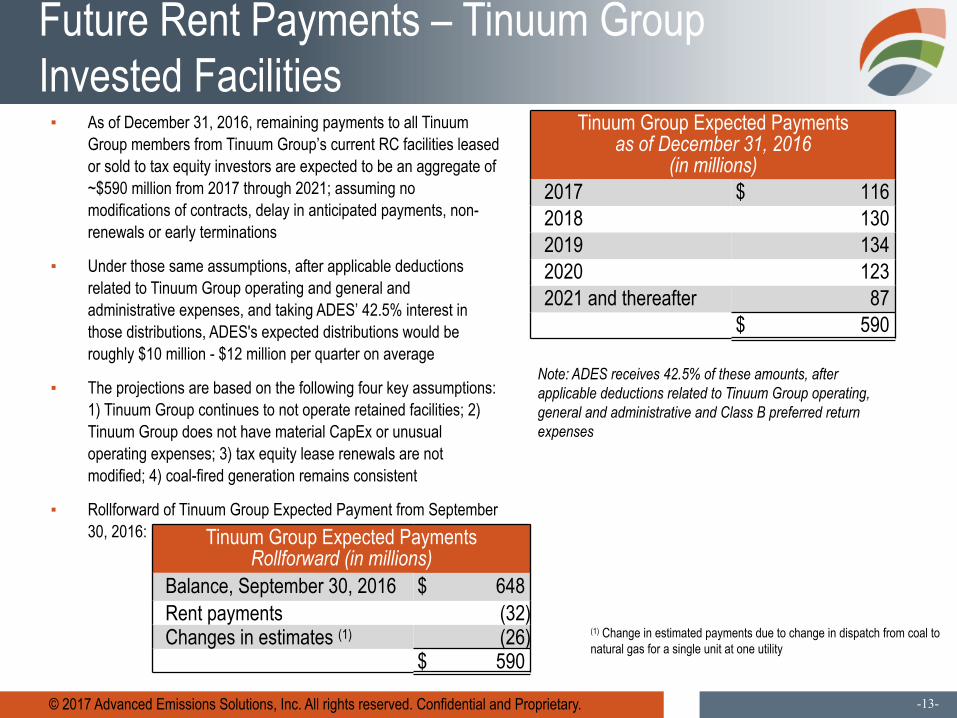
Future Rent Payments – Tinuum GroupInvested Facilities
▪ As of December 31, 2016, remaining payments to all TinuumGroup members from Tinuum Group’s current RC facilities leasedor sold to tax equity investors are expected to be an aggregate of~$590 million from 2017 through 2021; assuming nomodifications of contracts, delay in anticipated payments, non-renewals or early terminations
▪ Under those same assumptions, after applicable deductionsrelated to Tinuum Group operating and general andadministrative expenses, and taking ADES’ 42.5% interest inthose distributions, ADES's expected distributions would beroughly $10 million - $12 million per quarter on average
▪ The projections are based on the following four key assumptions:1) Tinuum Group continues to not operate retained facilities; 2)Tinuum Group does not have material CapEx or unusualoperating expenses; 3) tax equity lease renewals are notmodified; 4) coal-fired generation remains consistent
▪ Rollforward of Tinuum Group Expected Payment from September30, 2016:
Tinuum Group Expected Paymentsas of December 31, 2016
(in millions)2017 $ 1162018 1302019 1342020 1232021 and thereafter 87
$ 590
Note: ADES receives 42.5% of these amounts, afterapplicable deductions related to Tinuum Group operating,general and administrative and Class B preferred returnexpenses
(1) Change in estimated payments due to change in dispatch from coal tonatural gas for a single unit at one utility
Tinuum Group Expected PaymentsRollforward (in millions)
Balance, September 30, 2016 $ 648Rent payments (32)Changes in estimates (1) (26)
$ 590
© 2017 Advanced Emissions Solutions, Inc. All rights reserved. Confidential and Proprietary. -14-
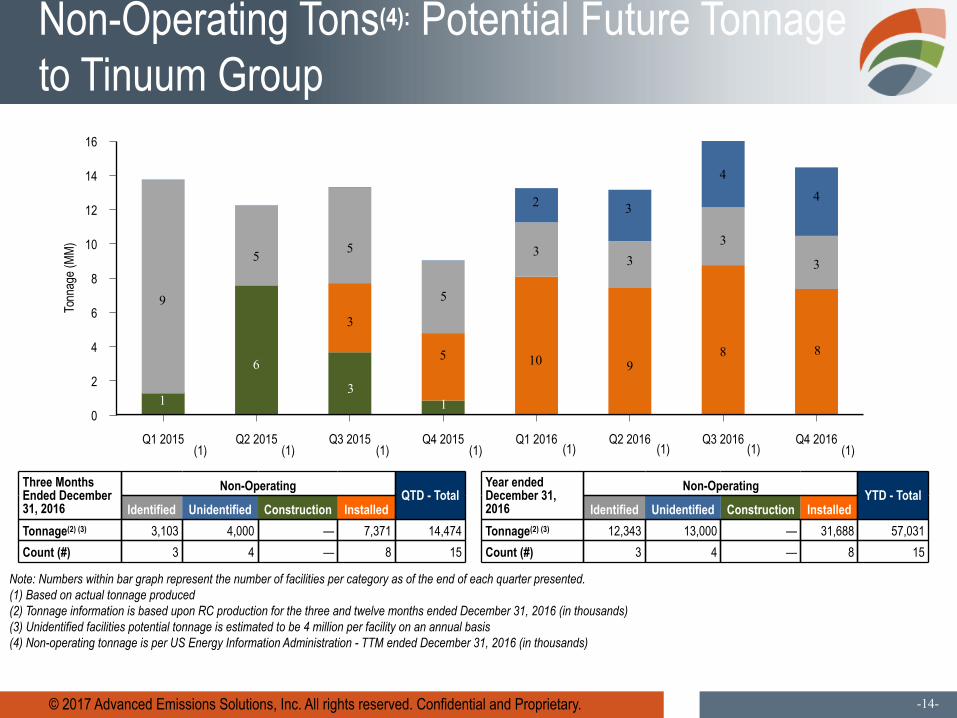
Non-Operating Tons(4): Potential Future Tonnageto Tinuum Group
Note: Numbers within bar graph represent the number of facilities per category as of the end of each quarter presented.(1) Based on actual tonnage produced(2) Tonnage information is based upon RC production for the three and twelve months ended December 31, 2016 (in thousands)(3) Unidentified facilities potential tonnage is estimated to be 4 million per facility on an annual basis(4) Non-operating tonnage is per US Energy Information Administration - TTM ended December 31, 2016 (in thousands)
16
14
12
10
8
6
4
2
0
Tonn
age(
MM)
Q1 2015 Q2 2015 Q3 2015 Q4 2015 Q1 2016 Q2 2016 Q3 2016 Q4 2016
Three MonthsEnded December31, 2016
Non-OperatingQTD - Total
Identified Unidentified Construction InstalledTonnage(2) (3) 3,103 4,000 — 7,371 14,474Count (#) 3 4 — 8 15
9
1
6
5 5
3
3
5
5
1
9
3
10
3
(1)(1)(1) (1)(1) (1)
Year endedDecember 31,2016
Non-OperatingYTD - Total
Identified Unidentified Construction InstalledTonnage(2) (3) 12,343 13,000 — 31,688 57,031Count (#) 3 4 — 8 15
3 2
4
3
8
(1)
4
3
8
(1)
Emissions Control
© 2017 Advanced Emissions Solutions, Inc. All rights reserved. Confidential and Proprietary. -16-
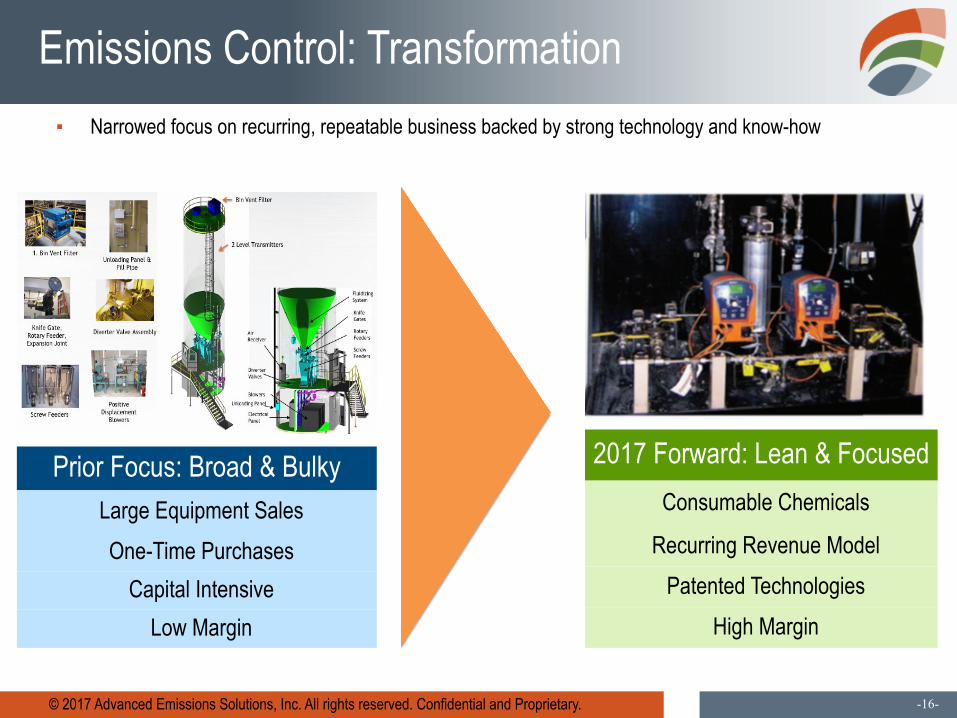
Emissions Control: Transformation▪ Narrowed focus on recurring, repeatable business backed by strong technology and know-how
Prior Focus: Broad & BulkyLarge Equipment SalesOne-Time Purchases
Capital IntensiveLow Margin
2017 Forward: Lean & FocusedConsumable Chemicals
Recurring Revenue ModelPatented Technologies
High Margin
© 2017 Advanced Emissions Solutions, Inc. All rights reserved. Confidential and Proprietary. -17-
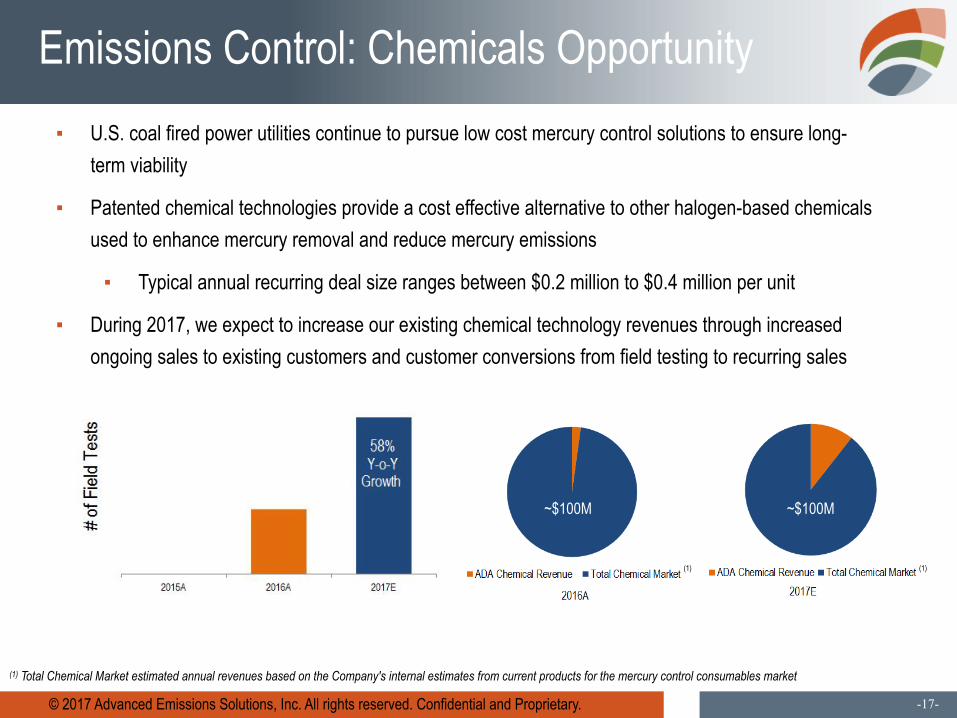
Emissions Control: Chemicals Opportunity▪ U.S. coal fired power utilities continue to pursue low cost mercury control solutions to ensure long-
term viability
▪ Patented chemical technologies provide a cost effective alternative to other halogen-based chemicalsused to enhance mercury removal and reduce mercury emissions
▪ Typical annual recurring deal size ranges between $0.2 million to $0.4 million per unit
▪ During 2017, we expect to increase our existing chemical technology revenues through increasedongoing sales to existing customers and customer conversions from field testing to recurring sales
(1) (1)
(1) Total Chemical Market estimated annual revenues based on the Company's internal estimates from current products for the mercury control consumables market
~$100M ~$100M
© 2017 Advanced Emissions Solutions, Inc. All rights reserved. Confidential and Proprietary. -18-
Emissions Control: Future Focus
▪ We also plan to perform assessments requiring minimal capital related to technology andcommercial feasibility related to multiple potential complimentary products to our existingmercury control chemical technologies
▪ Evaluate dynamic and fragmented fossil fuel power market in the U.S. or the broader energymarket to potentially provide partnership or M&A opportunities aligned with the followingcriteria:
▪ EBITDA positive
▪ Enable tax asset monetization
▪ Revenue and expense synergies
▪ Disciplined approach to ensure accretive shareholder value is provided
© 2017 Advanced Emissions Solutions, Inc. All rights reserved. Confidential and Proprietary. -19-
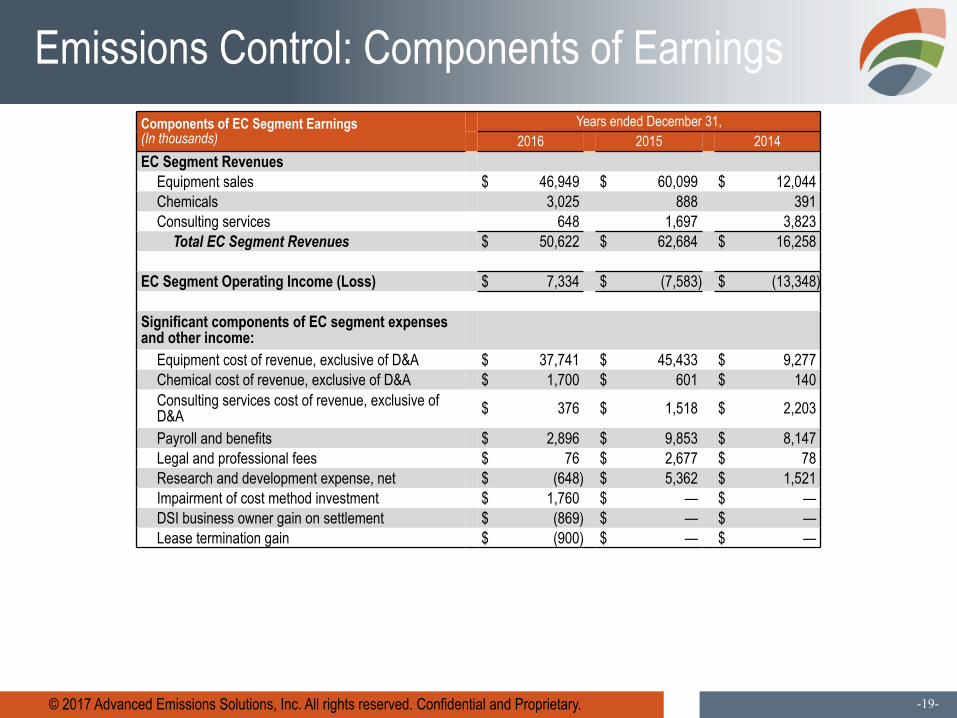
Emissions Control: Components of EarningsComponents of EC Segment Earnings(In thousands)
Years ended December 31,2016 2015 2014
EC Segment RevenuesEquipment sales $ 46,949 $ 60,099 $ 12,044Chemicals 3,025 888 391Consulting services 648 1,697 3,823
Total EC Segment Revenues $ 50,622 $ 62,684 $ 16,258
EC Segment Operating Income (Loss) $ 7,334 $ (7,583) $ (13,348)
Significant components of EC segment expensesand other income:
Equipment cost of revenue, exclusive of D&A $ 37,741 $ 45,433 $ 9,277Chemical cost of revenue, exclusive of D&A $ 1,700 $ 601 $ 140Consulting services cost of revenue, exclusive ofD&A $ 376 $ 1,518 $ 2,203
Payroll and benefits $ 2,896 $ 9,853 $ 8,147Legal and professional fees $ 76 $ 2,677 $ 78Research and development expense, net $ (648) $ 5,362 $ 1,521Impairment of cost method investment $ 1,760 $ — $ —DSI business owner gain on settlement $ (869) $ — $ —Lease termination gain $ (900) $ — $ —
© 2017 Advanced Emissions Solutions, Inc. All rights reserved. Confidential and Proprietary. -20-
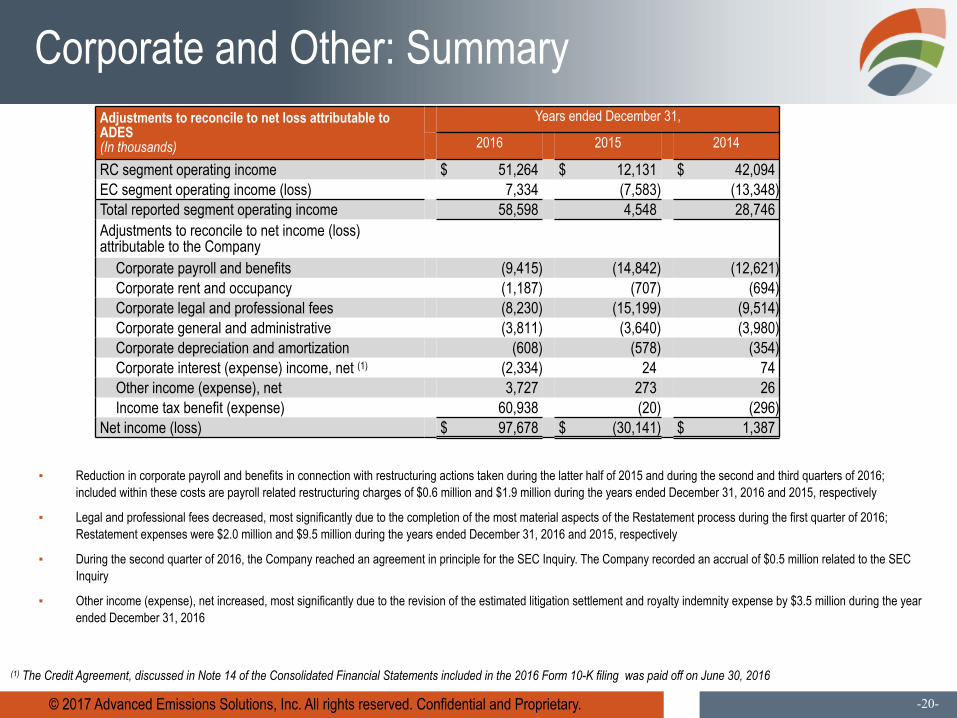
Corporate and Other: SummaryAdjustments to reconcile to net loss attributable toADES(In thousands)
Years ended December 31,
2016 2015 2014
RC segment operating income $ 51,264 $ 12,131 $ 42,094EC segment operating income (loss) 7,334 (7,583) (13,348)Total reported segment operating income 58,598 4,548 28,746Adjustments to reconcile to net income (loss)attributable to the Company
Corporate payroll and benefits (9,415) (14,842) (12,621)Corporate rent and occupancy (1,187) (707) (694)Corporate legal and professional fees (8,230) (15,199) (9,514)Corporate general and administrative (3,811) (3,640) (3,980)Corporate depreciation and amortization (608) (578) (354)Corporate interest (expense) income, net (1) (2,334) 24 74Other income (expense), net 3,727 273 26Income tax benefit (expense) 60,938 (20) (296)
Net income (loss) $ 97,678 $ (30,141) $ 1,387
▪ Reduction in corporate payroll and benefits in connection with restructuring actions taken during the latter half of 2015 and during the second and third quarters of 2016;included within these costs are payroll related restructuring charges of $0.6 million and $1.9 million during the years ended December 31, 2016 and 2015, respectively
▪ Legal and professional fees decreased, most significantly due to the completion of the most material aspects of the Restatement process during the first quarter of 2016;Restatement expenses were $2.0 million and $9.5 million during the years ended December 31, 2016 and 2015, respectively
▪ During the second quarter of 2016, the Company reached an agreement in principle for the SEC Inquiry. The Company recorded an accrual of $0.5 million related to the SECInquiry
▪ Other income (expense), net increased, most significantly due to the revision of the estimated litigation settlement and royalty indemnity expense by $3.5 million during the yearended December 31, 2016
(1) The Credit Agreement, discussed in Note 14 of the Consolidated Financial Statements included in the 2016 Form 10-K filing was paid off on June 30, 2016
© 2017 Advanced Emissions Solutions, Inc. All rights reserved. Confidential and Proprietary. -21-
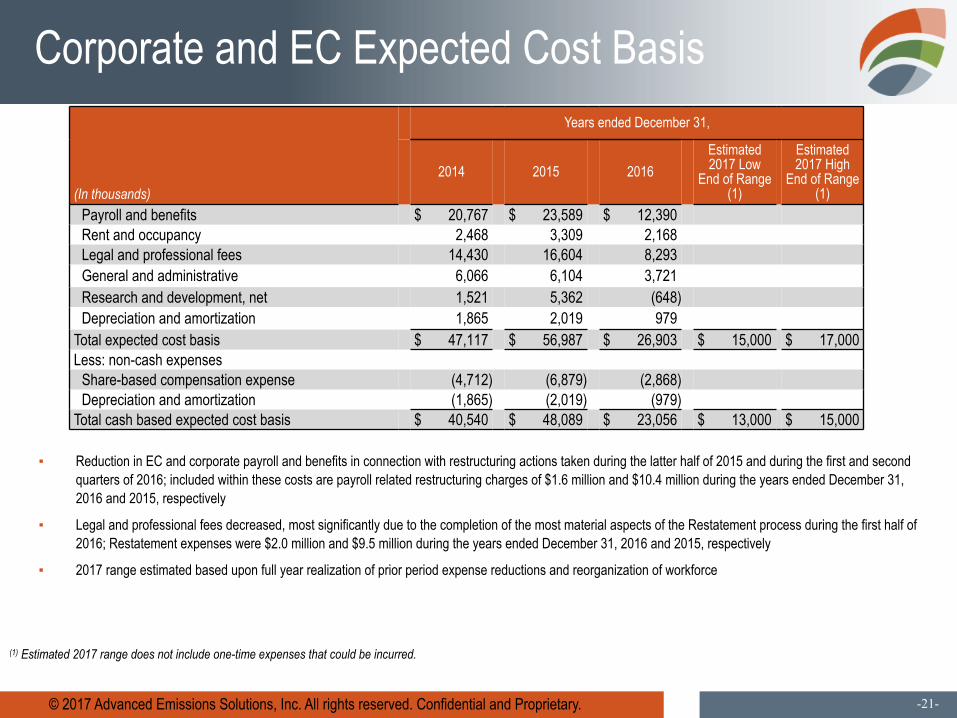
Corporate and EC Expected Cost Basis
(In thousands)
Years ended December 31,
2014 2015 2016Estimated2017 Low
End of Range(1)
Estimated2017 High
End of Range(1)
Payroll and benefits $ 20,767 $ 23,589 $ 12,390Rent and occupancy 2,468 3,309 2,168Legal and professional fees 14,430 16,604 8,293General and administrative 6,066 6,104 3,721Research and development, net 1,521 5,362 (648)Depreciation and amortization 1,865 2,019 979
Total expected cost basis $ 47,117 $ 56,987 $ 26,903 $ 15,000 $ 17,000Less: non-cash expenses
Share-based compensation expense (4,712) (6,879) (2,868)Depreciation and amortization (1,865) (2,019) (979)
Total cash based expected cost basis $ 40,540 $ 48,089 $ 23,056 $ 13,000 $ 15,000
▪ Reduction in EC and corporate payroll and benefits in connection with restructuring actions taken during the latter half of 2015 and during the first and secondquarters of 2016; included within these costs are payroll related restructuring charges of $1.6 million and $10.4 million during the years ended December 31,2016 and 2015, respectively
▪ Legal and professional fees decreased, most significantly due to the completion of the most material aspects of the Restatement process during the first half of2016; Restatement expenses were $2.0 million and $9.5 million during the years ended December 31, 2016 and 2015, respectively
▪ 2017 range estimated based upon full year realization of prior period expense reductions and reorganization of workforce
(1) Estimated 2017 range does not include one-time expenses that could be incurred.
© 2017 Advanced Emissions Solutions, Inc. All rights reserved. Confidential and Proprietary. -22-
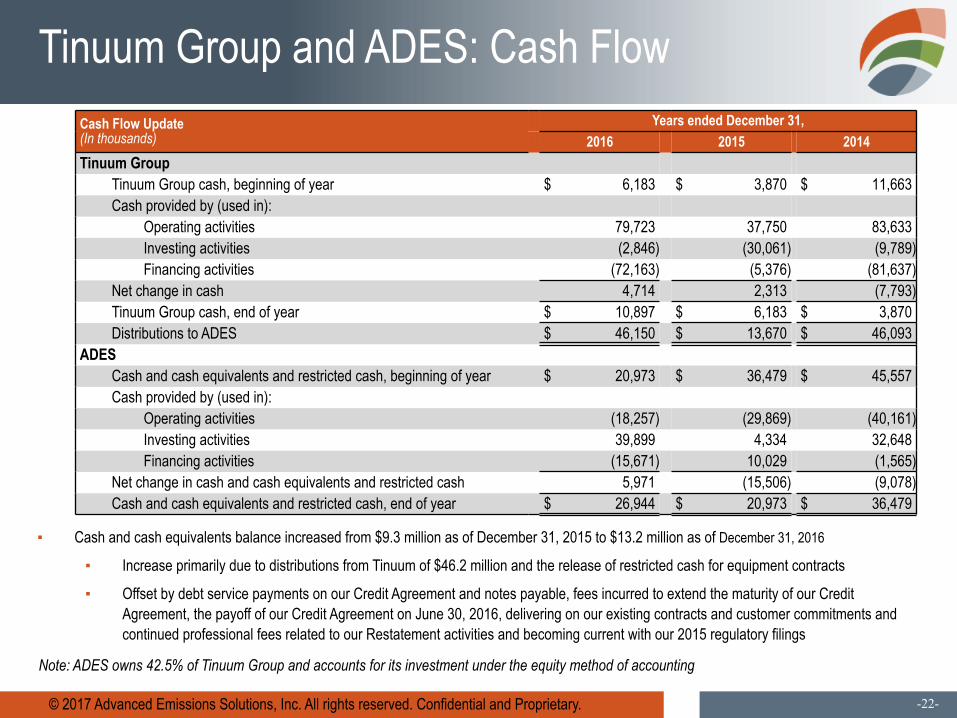
Tinuum Group and ADES: Cash FlowCash Flow Update(In thousands)
Years ended December 31,2016 2015 2014
Tinuum GroupTinuum Group cash, beginning of year $ 6,183 $ 3,870 $ 11,663Cash provided by (used in):
Operating activities 79,723 37,750 83,633Investing activities (2,846) (30,061) (9,789)Financing activities (72,163) (5,376) (81,637)
Net change in cash 4,714 2,313 (7,793)Tinuum Group cash, end of year $ 10,897 $ 6,183 $ 3,870Distributions to ADES $ 46,150 $ 13,670 $ 46,093
ADESCash and cash equivalents and restricted cash, beginning of year $ 20,973 $ 36,479 $ 45,557Cash provided by (used in):
Operating activities (18,257) (29,869) (40,161)Investing activities 39,899 4,334 32,648Financing activities (15,671) 10,029 (1,565)
Net change in cash and cash equivalents and restricted cash 5,971 (15,506) (9,078)Cash and cash equivalents and restricted cash, end of year $ 26,944 $ 20,973 $ 36,479
▪ Cash and cash equivalents balance increased from $9.3 million as of December 31, 2015 to $13.2 million as of December 31, 2016
▪ Increase primarily due to distributions from Tinuum of $46.2 million and the release of restricted cash for equipment contracts
▪ Offset by debt service payments on our Credit Agreement and notes payable, fees incurred to extend the maturity of our CreditAgreement, the payoff of our Credit Agreement on June 30, 2016, delivering on our existing contracts and customer commitments andcontinued professional fees related to our Restatement activities and becoming current with our 2015 regulatory filings
Note: ADES owns 42.5% of Tinuum Group and accounts for its investment under the equity method of accounting
© 2017 Advanced Emissions Solutions, Inc. All rights reserved. Confidential and Proprietary. -23-
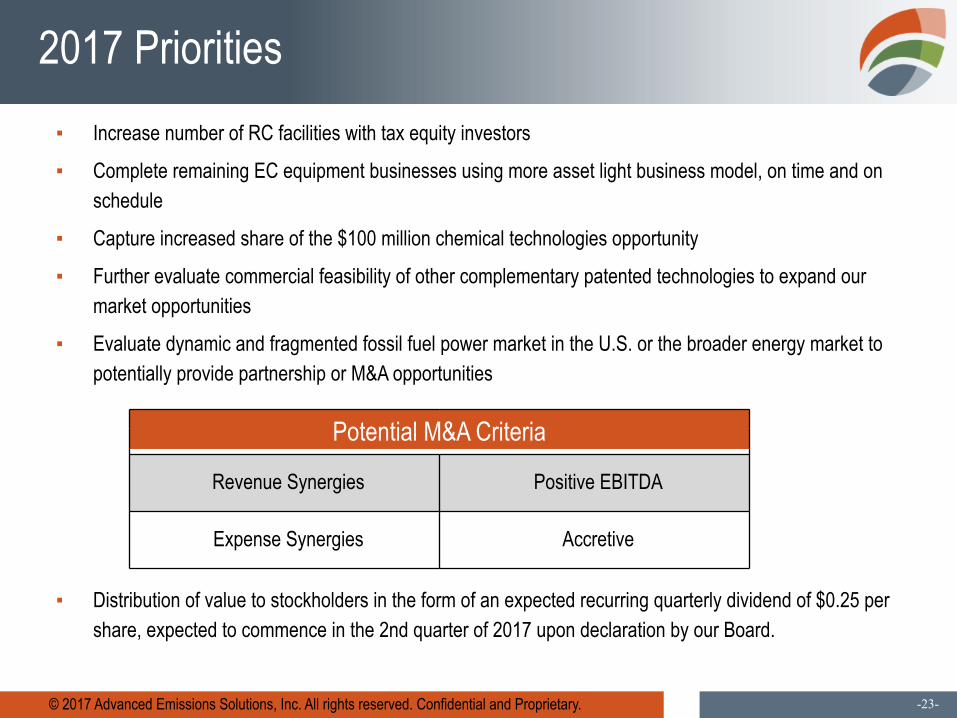
2017 Priorities▪ Increase number of RC facilities with tax equity investors
▪ Complete remaining EC equipment businesses using more asset light business model, on time and onschedule
▪ Capture increased share of the $100 million chemical technologies opportunity
▪ Further evaluate commercial feasibility of other complementary patented technologies to expand ourmarket opportunities
▪ Evaluate dynamic and fragmented fossil fuel power market in the U.S. or the broader energy market topotentially provide partnership or M&A opportunities
▪ Distribution of value to stockholders in the form of an expected recurring quarterly dividend of $0.25 pershare, expected to commence in the 2nd quarter of 2017 upon declaration by our Board.
Potential M&A Criteria
Revenue Synergies Positive EBITDA
Expense Synergies Accretive
Appendix
© 2017 Advanced Emissions Solutions, Inc. All rights reserved. Confidential and Proprietary. -25-
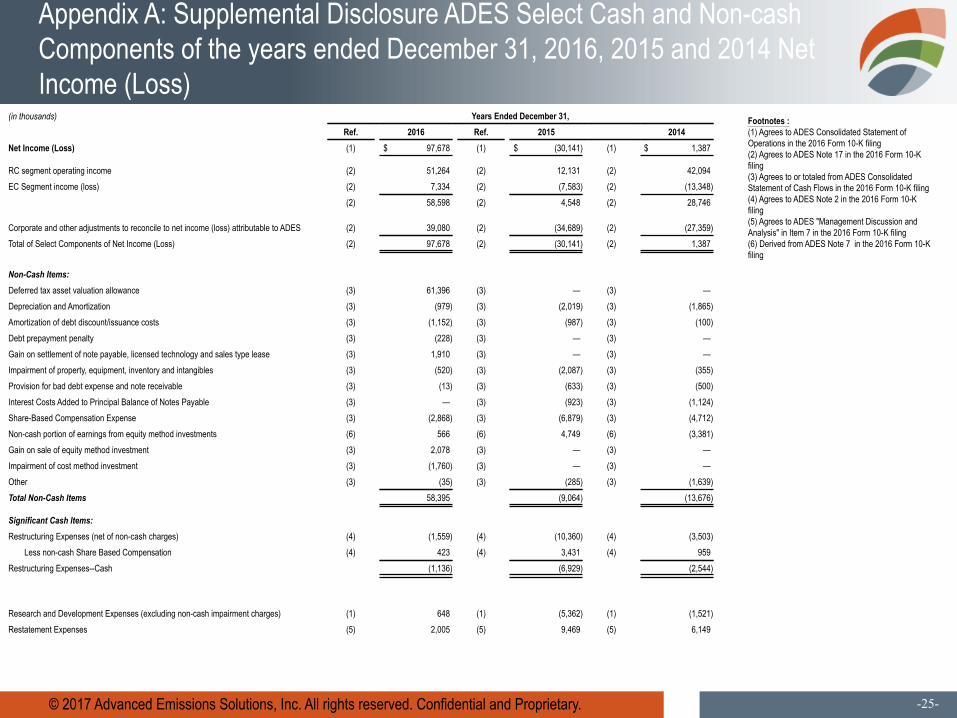
Appendix A: Supplemental Disclosure ADES Select Cash and Non-cashComponents of the years ended December 31, 2016, 2015 and 2014 NetIncome (Loss)
(in thousands) Years Ended December 31,Ref. 2016 Ref. 2015 2014
Net Income (Loss) (1) $ 97,678 (1) $ (30,141) (1) $ 1,387
RC segment operating income (2) 51,264 (2) 12,131 (2) 42,094EC Segment income (loss) (2) 7,334 (2) (7,583) (2) (13,348)
(2) 58,598 (2) 4,548 (2) 28,746
Corporate and other adjustments to reconcile to net income (loss) attributable to ADES (2) 39,080 (2) (34,689) (2) (27,359)Total of Select Components of Net Income (Loss) (2) 97,678 (2) (30,141) (2) 1,387
Non-Cash Items:Deferred tax asset valuation allowance (3) 61,396 (3) — (3) —Depreciation and Amortization (3) (979) (3) (2,019) (3) (1,865)Amortization of debt discount/issuance costs (3) (1,152) (3) (987) (3) (100)Debt prepayment penalty (3) (228) (3) — (3) —Gain on settlement of note payable, licensed technology and sales type lease (3) 1,910 (3) — (3) —Impairment of property, equipment, inventory and intangibles (3) (520) (3) (2,087) (3) (355)Provision for bad debt expense and note receivable (3) (13) (3) (633) (3) (500)Interest Costs Added to Principal Balance of Notes Payable (3) — (3) (923) (3) (1,124)Share-Based Compensation Expense (3) (2,868) (3) (6,879) (3) (4,712)Non-cash portion of earnings from equity method investments (6) 566 (6) 4,749 (6) (3,381)Gain on sale of equity method investment (3) 2,078 (3) — (3) —Impairment of cost method investment (3) (1,760) (3) — (3) —Other (3) (35) (3) (285) (3) (1,639)Total Non-Cash Items 58,395 (9,064) (13,676)
Significant Cash Items:Restructuring Expenses (net of non-cash charges) (4) (1,559) (4) (10,360) (4) (3,503)
Less non-cash Share Based Compensation (4) 423 (4) 3,431 (4) 959Restructuring Expenses--Cash (1,136) (6,929) (2,544)
Research and Development Expenses (excluding non-cash impairment charges) (1) 648 (1) (5,362) (1) (1,521)Restatement Expenses (5) 2,005 (5) 9,469 (5) 6,149
Footnotes :(1) Agrees to ADES Consolidated Statement ofOperations in the 2016 Form 10-K filing(2) Agrees to ADES Note 17 in the 2016 Form 10-Kfiling(3) Agrees to or totaled from ADES ConsolidatedStatement of Cash Flows in the 2016 Form 10-K filing(4) Agrees to ADES Note 2 in the 2016 Form 10-Kfiling(5) Agrees to ADES "Management Discussion andAnalysis" in Item 7 in the 2016 Form 10-K filing(6) Derived from ADES Note 7 in the 2016 Form 10-Kfiling
© 2017 Advanced Emissions Solutions, Inc. All rights reserved. Confidential and Proprietary. -26-
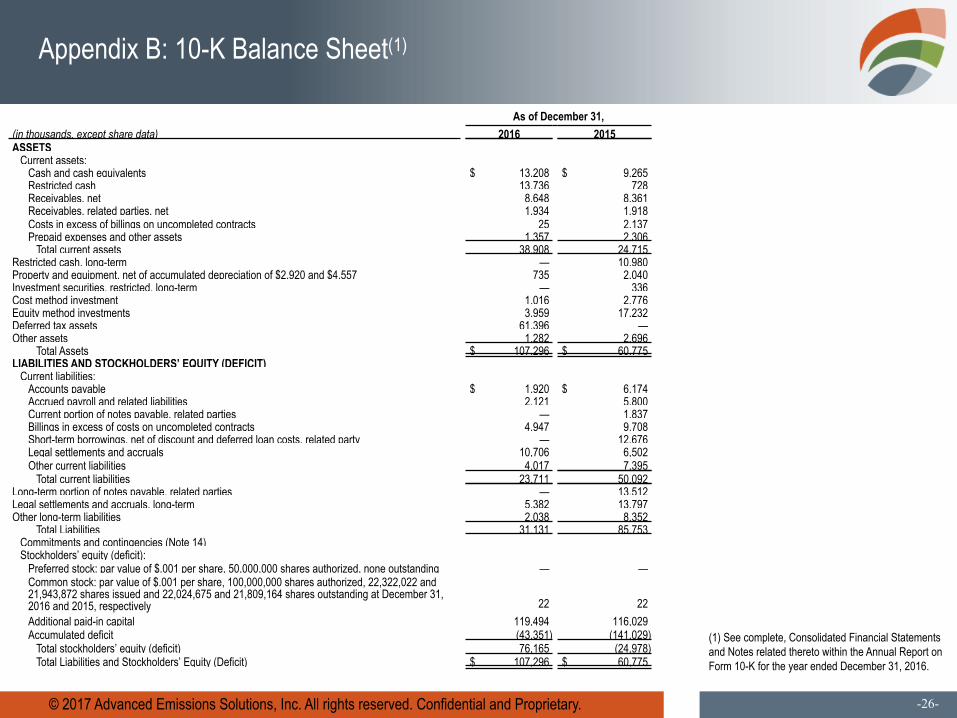
Appendix B: 10-K Balance Sheet(1)
(1) See complete, Consolidated Financial Statementsand Notes related thereto within the Annual Report onForm 10-K for the year ended December 31, 2016.
As of December 31,(in thousands, except share data) 2016 2015ASSETS
Current assets:Cash and cash equivalents $ 13,208 $ 9,265Restricted cash 13,736 728Receivables, net 8,648 8,361Receivables, related parties, net 1,934 1,918Costs in excess of billings on uncompleted contracts 25 2,137Prepaid expenses and other assets 1,357 2,306
Total current assets 38,908 24,715Restricted cash, long-term — 10,980Property and equipment, net of accumulated depreciation of $2,920 and $4,557 735 2,040Investment securities, restricted, long-term — 336Cost method investment 1,016 2,776Equity method investments 3,959 17,232Deferred tax assets 61,396 —Other assets 1,282 2,696
Total Assets $ 107,296 $ 60,775LIABILITIES AND STOCKHOLDERS’ EQUITY (DEFICIT)
Current liabilities:Accounts payable $ 1,920 $ 6,174Accrued payroll and related liabilities 2,121 5,800Current portion of notes payable, related parties — 1,837Billings in excess of costs on uncompleted contracts 4,947 9,708Short-term borrowings, net of discount and deferred loan costs, related party — 12,676Legal settlements and accruals 10,706 6,502Other current liabilities 4,017 7,395
Total current liabilities 23,711 50,092Long-term portion of notes payable, related parties — 13,512Legal settlements and accruals, long-term 5,382 13,797Other long-term liabilities 2,038 8,352
Total Liabilities 31,131 85,753Commitments and contingencies (Note 14)Stockholders’ equity (deficit):
Preferred stock: par value of $.001 per share, 50,000,000 shares authorized, none outstanding — —Common stock: par value of $.001 per share, 100,000,000 shares authorized, 22,322,022 and21,943,872 shares issued and 22,024,675 and 21,809,164 shares outstanding at December 31,2016 and 2015, respectively 22 22Additional paid-in capital 119,494 116,029Accumulated deficit (43,351) (141,029)
Total stockholders’ equity (deficit) 76,165 (24,978)Total Liabilities and Stockholders’ Equity (Deficit) $ 107,296 $ 60,775
© 2017 Advanced Emissions Solutions, Inc. All rights reserved. Confidential and Proprietary. -27-
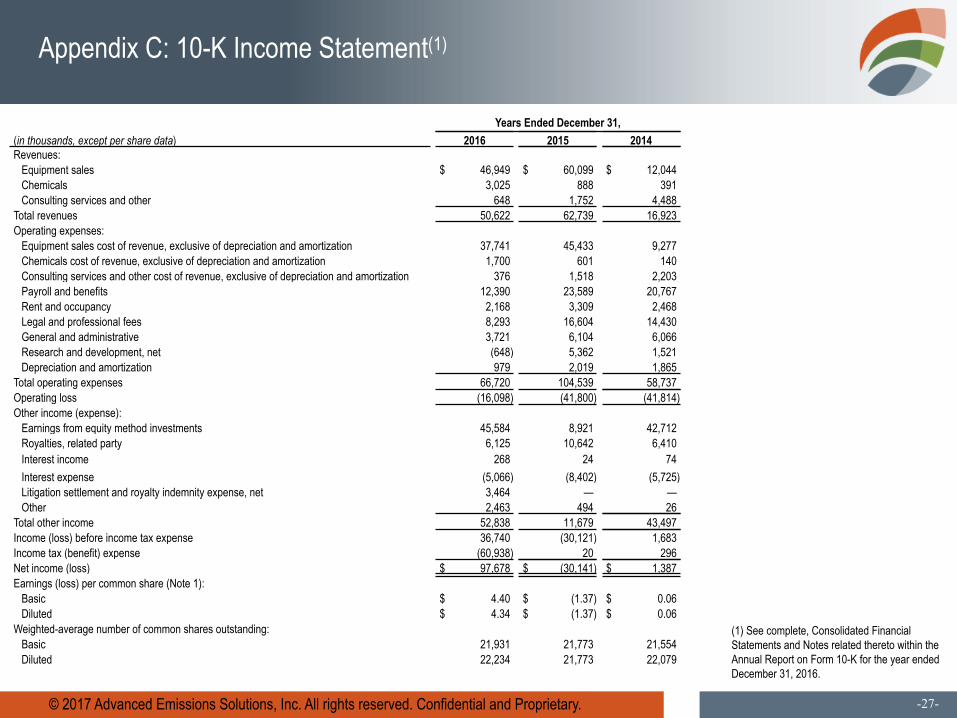
Appendix C: 10-K Income Statement(1)
(1) See complete, Consolidated FinancialStatements and Notes related thereto within theAnnual Report on Form 10-K for the year endedDecember 31, 2016.
Years Ended December 31,(in thousands, except per share data) 2016 2015 2014Revenues:
Equipment sales $ 46,949 $ 60,099 $ 12,044Chemicals 3,025 888 391Consulting services and other 648 1,752 4,488
Total revenues 50,622 62,739 16,923Operating expenses:
Equipment sales cost of revenue, exclusive of depreciation and amortization 37,741 45,433 9,277Chemicals cost of revenue, exclusive of depreciation and amortization 1,700 601 140Consulting services and other cost of revenue, exclusive of depreciation and amortization 376 1,518 2,203Payroll and benefits 12,390 23,589 20,767Rent and occupancy 2,168 3,309 2,468Legal and professional fees 8,293 16,604 14,430General and administrative 3,721 6,104 6,066Research and development, net (648) 5,362 1,521Depreciation and amortization 979 2,019 1,865
Total operating expenses 66,720 104,539 58,737Operating loss (16,098) (41,800) (41,814)Other income (expense):
Earnings from equity method investments 45,584 8,921 42,712Royalties, related party 6,125 10,642 6,410Interest income 268 24 74Interest expense (5,066) (8,402) (5,725)Litigation settlement and royalty indemnity expense, net 3,464 — —Other 2,463 494 26
Total other income 52,838 11,679 43,497Income (loss) before income tax expense 36,740 (30,121) 1,683Income tax (benefit) expense (60,938) 20 296Net income (loss) $ 97,678 $ (30,141) $ 1,387Earnings (loss) per common share (Note 1):
Basic $ 4.40 $ (1.37) $ 0.06Diluted $ 4.34 $ (1.37) $ 0.06
Weighted-average number of common shares outstanding:Basic 21,931 21,773 21,554Diluted 22,234 21,773 22,079
© 2017 Advanced Emissions Solutions, Inc. All rights reserved. Confidential and Proprietary. -28-
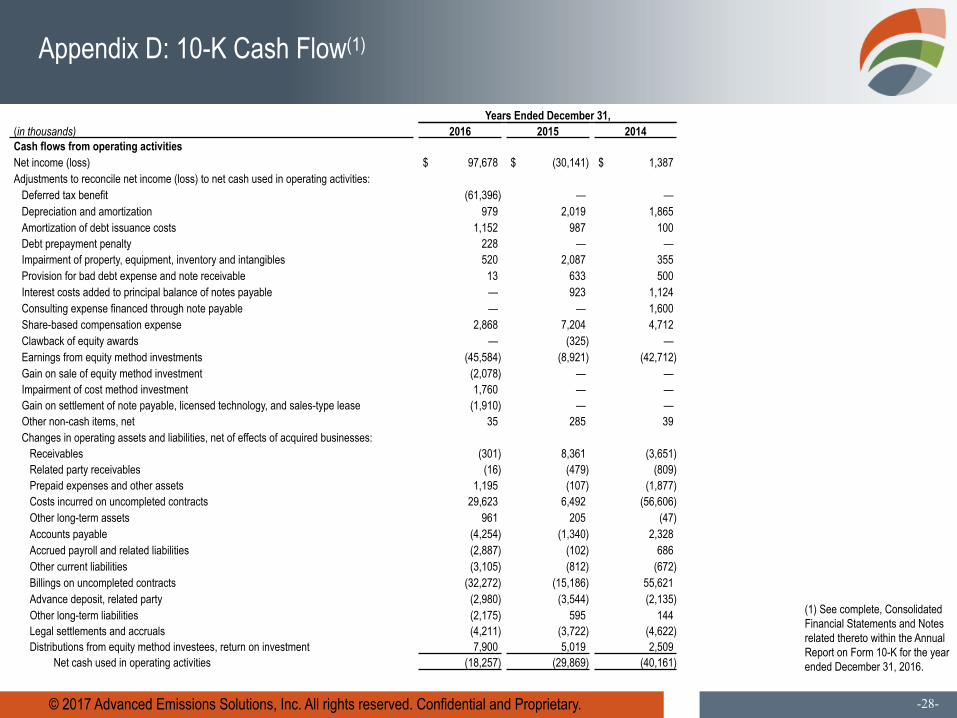
Appendix D: 10-K Cash Flow(1)
(1) See complete, ConsolidatedFinancial Statements and Notesrelated thereto within the AnnualReport on Form 10-K for the yearended December 31, 2016.
Years Ended December 31,(in thousands) 2016 2015 2014Cash flows from operating activitiesNet income (loss) $ 97,678 $ (30,141) $ 1,387Adjustments to reconcile net income (loss) to net cash used in operating activities:
Deferred tax benefit (61,396) — —Depreciation and amortization 979 2,019 1,865Amortization of debt issuance costs 1,152 987 100Debt prepayment penalty 228 — —Impairment of property, equipment, inventory and intangibles 520 2,087 355Provision for bad debt expense and note receivable 13 633 500Interest costs added to principal balance of notes payable — 923 1,124Consulting expense financed through note payable — — 1,600Share-based compensation expense 2,868 7,204 4,712Clawback of equity awards — (325) —Earnings from equity method investments (45,584) (8,921) (42,712)Gain on sale of equity method investment (2,078) — —Impairment of cost method investment 1,760 — —Gain on settlement of note payable, licensed technology, and sales-type lease (1,910) — —Other non-cash items, net 35 285 39Changes in operating assets and liabilities, net of effects of acquired businesses:
Receivables (301) 8,361 (3,651)Related party receivables (16) (479) (809)Prepaid expenses and other assets 1,195 (107) (1,877)Costs incurred on uncompleted contracts 29,623 6,492 (56,606)Other long-term assets 961 205 (47)Accounts payable (4,254) (1,340) 2,328Accrued payroll and related liabilities (2,887) (102) 686Other current liabilities (3,105) (812) (672)Billings on uncompleted contracts (32,272) (15,186) 55,621Advance deposit, related party (2,980) (3,544) (2,135)Other long-term liabilities (2,175) 595 144Legal settlements and accruals (4,211) (3,722) (4,622)Distributions from equity method investees, return on investment 7,900 5,019 2,509
Net cash used in operating activities (18,257) (29,869) (40,161)
© 2017 Advanced Emissions Solutions, Inc. All rights reserved. Confidential and Proprietary. -29-
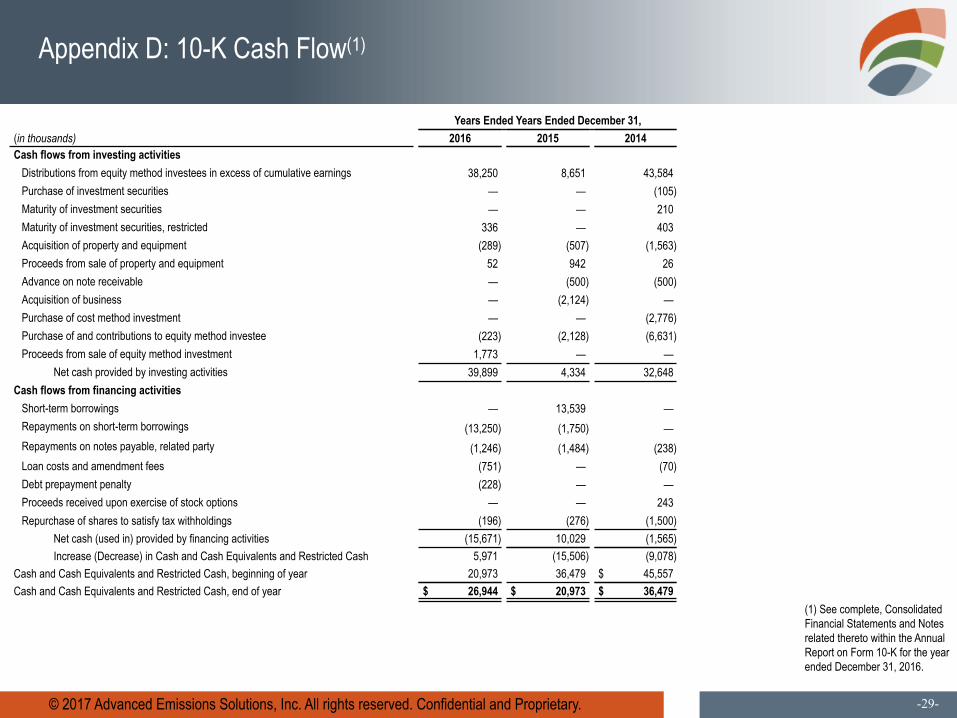
Appendix D: 10-K Cash Flow(1)
(1) See complete, ConsolidatedFinancial Statements and Notesrelated thereto within the AnnualReport on Form 10-K for the yearended December 31, 2016.
Years Ended Years Ended December 31,(in thousands) 2016 2015 2014Cash flows from investing activities
Distributions from equity method investees in excess of cumulative earnings 38,250 8,651 43,584Purchase of investment securities — — (105)Maturity of investment securities — — 210Maturity of investment securities, restricted 336 — 403Acquisition of property and equipment (289) (507) (1,563)Proceeds from sale of property and equipment 52 942 26Advance on note receivable — (500) (500)Acquisition of business — (2,124) —Purchase of cost method investment — — (2,776)Purchase of and contributions to equity method investee (223) (2,128) (6,631)Proceeds from sale of equity method investment 1,773 — —
Net cash provided by investing activities 39,899 4,334 32,648Cash flows from financing activities
Short-term borrowings — 13,539 —Repayments on short-term borrowings (13,250) (1,750) —Repayments on notes payable, related party (1,246) (1,484) (238)Loan costs and amendment fees (751) — (70)Debt prepayment penalty (228) — —Proceeds received upon exercise of stock options — — 243Repurchase of shares to satisfy tax withholdings (196) (276) (1,500)
Net cash (used in) provided by financing activities (15,671) 10,029 (1,565)Increase (Decrease) in Cash and Cash Equivalents and Restricted Cash 5,971 (15,506) (9,078)
Cash and Cash Equivalents and Restricted Cash, beginning of year 20,973 36,479 $ 45,557Cash and Cash Equivalents and Restricted Cash, end of year $ 26,944 $ 20,973 $ 36,479
Recommended