Putnam Variable TrustPutnam VT Multi-Asset Absolute Return Fund
IMPORTANT NOTICE: Delivery of paper fund reportsIn accordance with regulations adopted by the Securities and Exchange Commission, beginning on or after January 1, 2021, at the election of your insurance provider, you may not receive paper reports like this one in the mail from the insurance provider that offers your variable annuity contract or variable life insurance policy unless you specifically request it. Instead, they will be available on a website, and your insurance provider will notify you by mail whenever a new one is available, and provide you with a website link to access the report.
If you wish to continue to receive paper reports free of charge after January 1, 2021, please contact your insurance provider.
If you already receive these reports electronically, no action is required.
Semiannual report 6 | 30 | 19
Message from the TrusteesAugust 9, 2019
Dear Shareholder:
If there is any lesson to be learned from constantly changing financial markets, it is the importance of positioning your investment portfolio for your long-term goals. We believe that one strategy is to diversify across different asset classes and investment approaches.
We also believe your mutual fund investment offers a number of advantages, including constant monitoring by experienced investment professionals who maintain a long-term perspective. Putnam’s portfolio managers and analysts take a research-intensive approach that includes risk management strategies designed to serve you through changing conditions.
Another key strategy, in our view, is seeking the counsel of a financial advisor. For over 80 years, Putnam has recognized the importance of professional investment advice. Your financial advisor can help in many ways, including defining and planning for goals such as retirement, evaluating the level of risk appropriate for you, and reviewing your investments on a regular basis and making adjustments as necessary.
As always, your fund’s Board of Trustees remains committed to protecting the interests of Putnam shareholders like you, and we thank you for investing with Putnam.
Respectfully yours,
Robert L. Reynolds Kenneth R. LeiblerPresident and Chief Executive Officer Chair, Board of TrusteesPutnam Investments
The views expressed in this report are exclusively those of Putnam Management and are subject to change. They are not meant as investment advice. Please note that the holdings discussed in this report may not have been held by the fund for the entire period. Portfolio composition is subject to review in accordance with the fund’s investment strategy and may vary in the future.
Consider these risks before investing: Allocation of assets among asset classes may hurt performance. The value of investments in the fund’s port-folio may fall or fail to rise over extended periods of time for a variety of reasons, including general economic, political or financial market conditions, investor sentiment and market perceptions, government actions, geopolitical events or changes, and factors related to a specific issuer, asset class, geography, industry or sector. These and other factors may lead to increased volatility and reduced liquidity in the fund’s portfolio holdings. Growth stocks may be more susceptible to earnings disappointments, and value stocks may fail to rebound. Bond investments are subject to interest-rate risk (the risk of bond prices falling if interest rates rise) and credit risk (the risk of an issuer defaulting on interest or principal payments). Interest-rate risk is generally greater for longer-term bonds, and credit risk is generally greater for below-investment-grade bonds. Unlike bonds, funds that invest in bonds have fees and expenses. Lower-rated bonds may offer higher yields in return for more risk. Funds that invest in government securities are not guaranteed. Mortgage-backed securities are subject to prepayment risk, which means that they may increase in value less than other bonds when interest rates decline and decline in value more than other bonds when interest rates rise. The fund may have to invest the proceeds from prepaid investments, including mortgage- and asset-backed investments, in other investments with less attractive terms and yields. International investing involves currency, economic, and political risks. Emerging-market securities have illiquidity and volatility risks. Our alpha strategy may lose money or not earn a return sufficient to cover associated trading and other costs. Our use of leverage obtained through derivatives increases these risks by increasing investment exposure. Risks associated with derivatives include increased investment exposure (which may be considered leverage) and, in the case of over-the-counter instruments, the potential inability to terminate or sell derivatives positions and the potential failure of the other party to the instrument to meet its obligations. The fund’s efforts to produce lower-volatility returns may not be successful. The fund may not achieve its goal, and it is not intended to be a complete investment program. You can lose money by investing in the fund. The fund’s prospectus lists additional risks.The fund is not intended to outperform stocks and bonds during strong market rallies.
Putnam VT Multi-Asset Absolute Return Fund 1
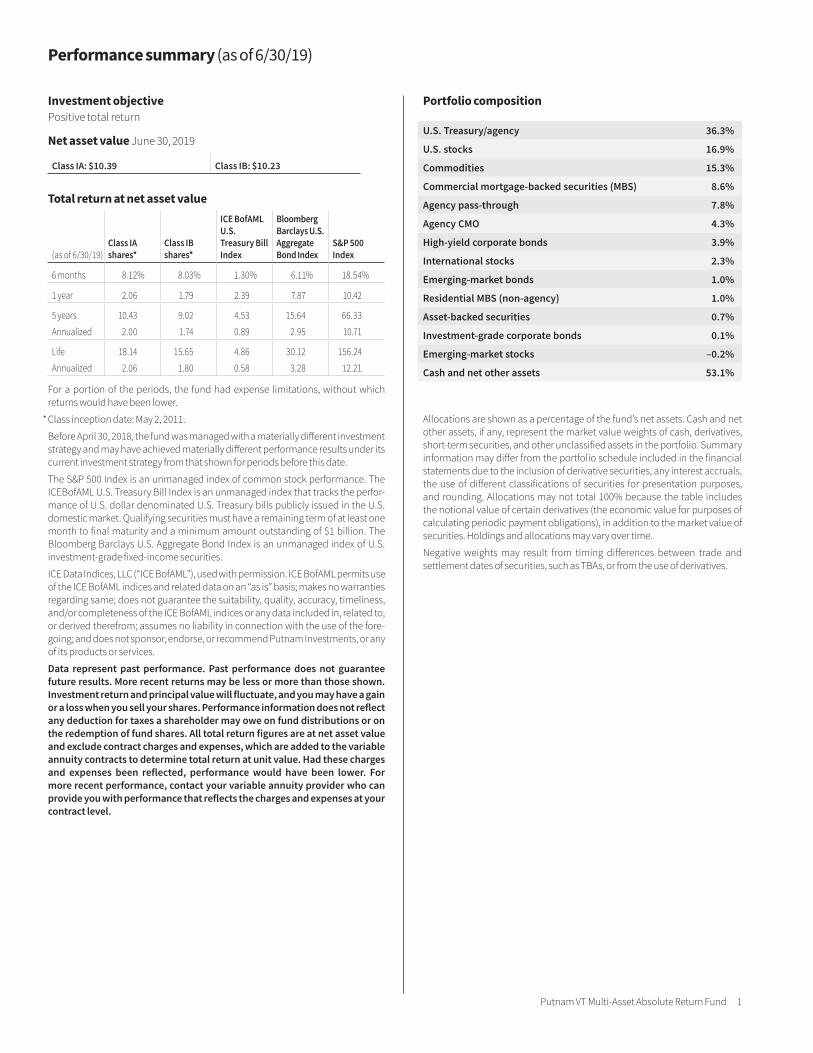
Portfolio composition
U.S. Treasury/agency 36.3%
U.S. stocks 16.9%
Commodities 15.3%
Commercial mortgage-backed securities (MBS) 8.6%
Agency pass-through 7.8%
Agency CMO 4.3%
High-yield corporate bonds 3.9%
International stocks 2.3%
Emerging-market bonds 1.0%
Residential MBS (non-agency) 1.0%
Asset-backed securities 0.7%
Investment-grade corporate bonds 0.1%
Emerging-market stocks –0.2%
Cash and net other assets 53.1%
Allocations are shown as a percentage of the fund’s net assets. Cash and net other assets, if any, represent the market value weights of cash, derivatives, short-term securities, and other unclassified assets in the portfolio. Summary information may differ from the portfolio schedule included in the financial statements due to the inclusion of derivative securities, any interest accruals, the use of different classifications of securities for presentation purposes, and rounding. Allocations may not total 100% because the table includes the notional value of certain derivatives (the economic value for purposes of calculating periodic payment obligations), in addition to the market value of securities. Holdings and allocations may vary over time.
Negative weights may result from timing differences between trade and settlement dates of securities, such as TBAs, or from the use of derivatives.
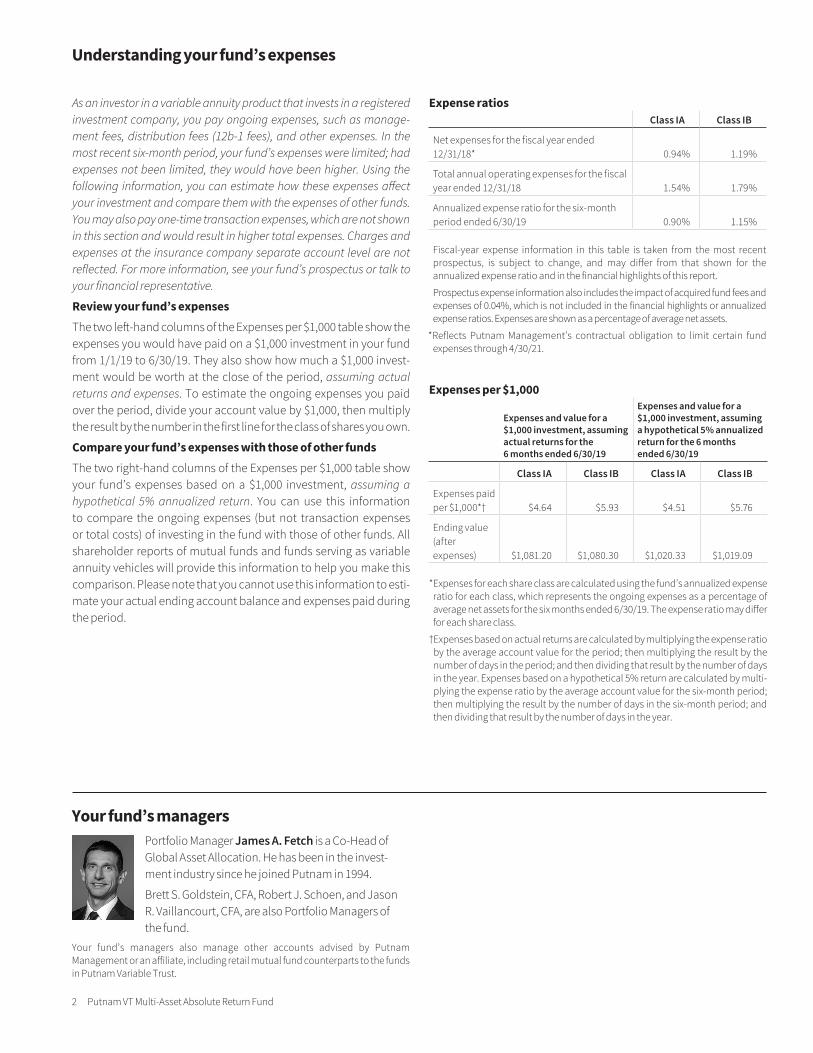
Performance summary (as of 6/30/19)
Investment objectivePositive total return
Net asset value June 30, 2019
Class IA: $10.39 Class IB: $10.23
Total return at net asset value
(as of 6/30/19)Class IA shares*
Class IB shares*
ICE BofAML U.S. Treasury Bill Index
Bloomberg Barclays U.S. Aggregate Bond Index
S&P 500Index
6 months 8.12% 8.03% 1.30% 6.11% 18.54%
1 year 2.06 1.79 2.39 7.87 10.42
5 years 10.43 9.02 4.53 15.64 66.33
Annualized 2.00 1.74 0.89 2.95 10.71
Life 18.14 15.65 4.86 30.12 156.24
Annualized 2.06 1.80 0.58 3.28 12.21
For a portion of the periods, the fund had expense limitations, without which returns would have been lower.
* Class inception date: May 2, 2011.
Before April 30, 2018, the fund was managed with a materially different investment strategy and may have achieved materially different performance results under its current investment strategy from that shown for periods before this date.
The S&P 500 Index is an unmanaged index of common stock performance. The ICEBofAML U.S. Treasury Bill Index is an unmanaged index that tracks the perfor-mance of U.S. dollar denominated U.S. Treasury bills publicly issued in the U.S. domestic market. Qualifying securities must have a remaining term of at least one month to final maturity and a minimum amount outstanding of $1 billion. The Bloomberg Barclays U.S. Aggregate Bond Index is an unmanaged index of U.S. investment-grade fixed-income securities.
ICE Data Indices, LLC (“ICE BofAML”), used with permission. ICE BofAML permits use of the ICE BofAML indices and related data on an “as is” basis; makes no warranties regarding same; does not guarantee the suitability, quality, accuracy, timeliness, and/or completeness of the ICE BofAML indices or any data included in, related to, or derived therefrom; assumes no liability in connection with the use of the fore-going; and does not sponsor, endorse, or recommend Putnam Investments, or any of its products or services.
Data represent past performance. Past performance does not guarantee future results. More recent returns may be less or more than those shown. Investment return and principal value will fluctuate, and you may have a gain or a loss when you sell your shares. Performance information does not reflect any deduction for taxes a shareholder may owe on fund distributions or on the redemption of fund shares. All total return figures are at net asset value and exclude contract charges and expenses, which are added to the variable annuity contracts to determine total return at unit value. Had these charges and expenses been reflected, performance would have been lower. For more recent performance, contact your variable annuity provider who can provide you with performance that reflects the charges and expenses at your contract level.
2 Putnam VT Multi-Asset Absolute Return Fund
Understanding your fund’s expenses
As an investor in a variable annuity product that invests in a registered investment company, you pay ongoing expenses, such as manage-ment fees, distribution fees (12b-1 fees), and other expenses. In the most recent six-month period, your fund’s expenses were limited; had expenses not been limited, they would have been higher. Using the following information, you can estimate how these expenses affect your investment and compare them with the expenses of other funds. You may also pay one-time transaction expenses, which are not shown in this section and would result in higher total expenses. Charges and expenses at the insurance company separate account level are not reflected. For more information, see your fund’s prospectus or talk to your financial representative.
Review your fund’s expensesThe two left-hand columns of the Expenses per $1,000 table show the expenses you would have paid on a $1,000 investment in your fund from 1/1/19 to 6/30/19. They also show how much a $1,000 invest-ment would be worth at the close of the period, assuming actual returns and expenses. To estimate the ongoing expenses you paid over the period, divide your account value by $1,000, then multiply the result by the number in the first line for the class of shares you own.
Compare your fund’s expenses with those of other fundsThe two right-hand columns of the Expenses per $1,000 table show your fund’s expenses based on a $1,000 investment, assuming a hypothetical 5% annualized return. You can use this information to compare the ongoing expenses (but not transaction expenses or total costs) of investing in the fund with those of other funds. All shareholder reports of mutual funds and funds serving as variable annuity vehicles will provide this information to help you make this comparison. Please note that you cannot use this information to esti-mate your actual ending account balance and expenses paid during the period.
Expense ratiosClass IA Class IB
Net expenses for the fiscal year ended 12/31/18* 0.94% 1.19%
Total annual operating expenses for the fiscal year ended 12/31/18 1.54% 1.79%
Annualized expense ratio for the six-month period ended 6/30/19 0.90% 1.15%
Fiscal-year expense information in this table is taken from the most recent prospectus, is subject to change, and may differ from that shown for the annualized expense ratio and in the financial highlights of this report.
Prospectus expense information also includes the impact of acquired fund fees and expenses of 0.04%, which is not included in the financial highlights or annualized expense ratios. Expenses are shown as a percentage of average net assets.
*Reflects Putnam Management’s contractual obligation to limit certain fund expenses through 4/30/21.
Expenses per $1,000
Expenses and value for a $1,000 investment, assuming actual returns for the 6 months ended 6/30/19
Expenses and value for a $1,000 investment, assuming a hypothetical 5% annualized return for the 6 months ended 6/30/19
Class IA Class IB Class IA Class IB
Expenses paid per $1,000*† $4.64 $5.93 $4.51 $5.76
Ending value (after expenses) $1,081.20 $1,080.30 $1,020.33 $1,019.09
* Expenses for each share class are calculated using the fund’s annualized expense ratio for each class, which represents the ongoing expenses as a percentage of average net assets for the six months ended 6/30/19. The expense ratio may differ for each share class.
† Expenses based on actual returns are calculated by multiplying the expense ratio by the average account value for the period; then multiplying the result by the number of days in the period; and then dividing that result by the number of days in the year. Expenses based on a hypothetical 5% return are calculated by multi-plying the expense ratio by the average account value for the six-month period; then multiplying the result by the number of days in the six-month period; and then dividing that result by the number of days in the year.
Your fund’s managersPortfolio Manager James A. Fetch is a Co-Head of Global Asset Allocation. He has been in the invest-ment industry since he joined Putnam in 1994.
Brett S. Goldstein, CFA, Robert J. Schoen, and Jason R. Vaillancourt, CFA, are also Portfolio Managers of the fund.
Your fund’s managers also manage other accounts advised by Putnam Management or an affiliate, including retail mutual fund counterparts to the funds in Putnam Variable Trust.
Putnam VT Multi-Asset Absolute Return Fund 3
ABOUT DERIVATIVES
Derivatives are an increasingly common type of investment instrument, the performance of which is derived from an underlying security, index, currency, or other area of the capital markets. Derivatives employed by the fund’s managers generally serve one of two main purposes: to implement a strategy that may be difficult or more expensive to invest in through traditional securities, or to hedge unwanted risk associated with a particular position.
For example, the fund’s managers might use currency forward contracts to capitalize on an anticipated change in exchange rates between two currencies. This approach would require a significantly smaller outlay of capital than purchasing traditional bonds denominated in the underlying currencies. In another example, the managers may identify a bond that they believe is undervalued relative to its risk of default, but may seek to reduce the interest-rate risk of that bond by using interest-rate swaps, a derivative through which two parties “swap” payments based on the movement of certain rates. In other examples, the managers may use options and futures contracts to hedge against a variety of risks by establishing a combination of long and short exposures to specific equity markets or sectors.
Like any other investment, derivatives may not appreciate in value and may lose money. Derivatives may amplify traditional investment risks through the creation of leverage and may be less liquid than traditional securities. And because derivatives typically represent contractual agreements between two financial institutions, derivatives entail “counterparty risk,” which is the risk that the other party is unable or unwilling to pay. Putnam monitors the counterparty risks we assume. For example, Putnam often enters into collateral agreements that require the counterparties to post collateral on a regular basis to cover their obligations to the fund. Counterparty risk for exchange-traded futures and centrally cleared swaps is mitigated by the daily exchange of margin and other safeguards against default through their respective clearinghouses.
4 Putnam VT Multi-Asset Absolute Return Fund
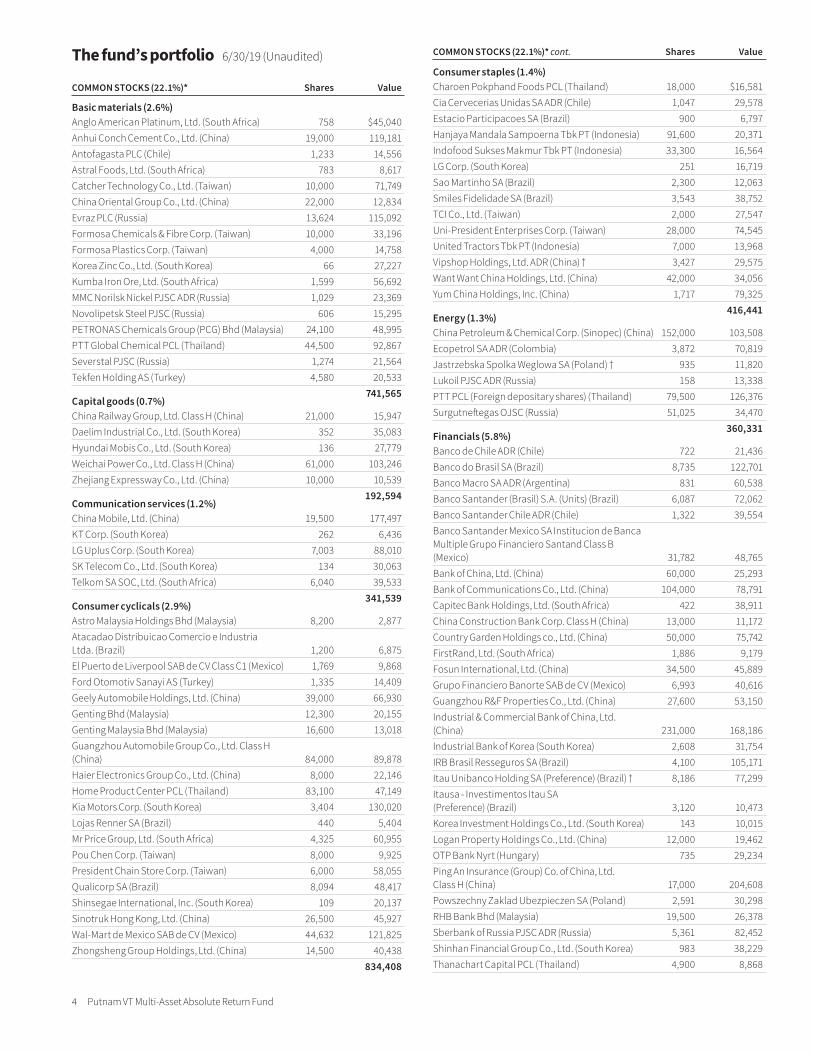
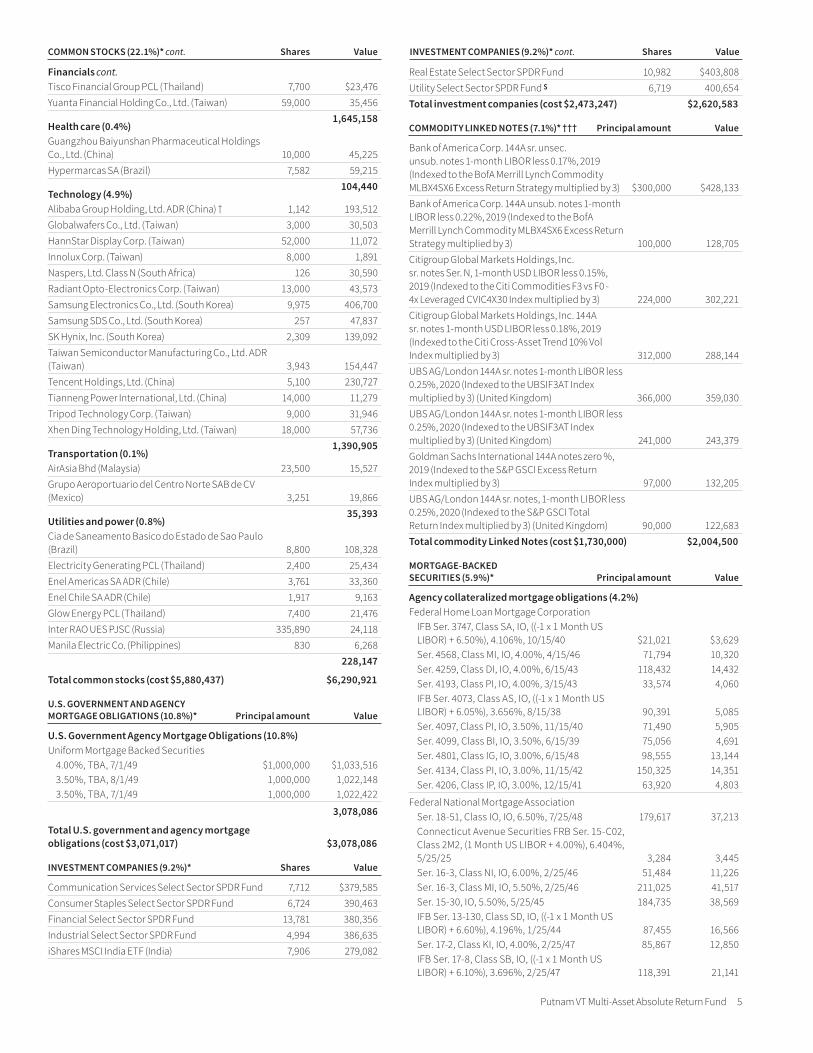
COMMON STOCKS (22.1%)* Shares Value
Basic materials (2.6%)Anglo American Platinum, Ltd. (South Africa) 758 $45,040Anhui Conch Cement Co., Ltd. (China) 19,000 119,181Antofagasta PLC (Chile) 1,233 14,556Astral Foods, Ltd. (South Africa) 783 8,617Catcher Technology Co., Ltd. (Taiwan) 10,000 71,749China Oriental Group Co., Ltd. (China) 22,000 12,834Evraz PLC (Russia) 13,624 115,092Formosa Chemicals & Fibre Corp. (Taiwan) 10,000 33,196Formosa Plastics Corp. (Taiwan) 4,000 14,758Korea Zinc Co., Ltd. (South Korea) 66 27,227Kumba Iron Ore, Ltd. (South Africa) 1,599 56,692MMC Norilsk Nickel PJSC ADR (Russia) 1,029 23,369Novolipetsk Steel PJSC (Russia) 606 15,295PETRONAS Chemicals Group (PCG) Bhd (Malaysia) 24,100 48,995PTT Global Chemical PCL (Thailand) 44,500 92,867Severstal PJSC (Russia) 1,274 21,564Tekfen Holding AS (Turkey) 4,580 20,533 741,565Capital goods (0.7%)China Railway Group, Ltd. Class H (China) 21,000 15,947Daelim Industrial Co., Ltd. (South Korea) 352 35,083Hyundai Mobis Co., Ltd. (South Korea) 136 27,779Weichai Power Co., Ltd. Class H (China) 61,000 103,246Zhejiang Expressway Co., Ltd. (China) 10,000 10,539 192,594Communication services (1.2%)China Mobile, Ltd. (China) 19,500 177,497KT Corp. (South Korea) 262 6,436LG Uplus Corp. (South Korea) 7,003 88,010SK Telecom Co., Ltd. (South Korea) 134 30,063Telkom SA SOC, Ltd. (South Africa) 6,040 39,533 341,539Consumer cyclicals (2.9%)Astro Malaysia Holdings Bhd (Malaysia) 8,200 2,877Atacadao Distribuicao Comercio e Industria Ltda. (Brazil) 1,200 6,875El Puerto de Liverpool SAB de CV Class C1 (Mexico) 1,769 9,868Ford Otomotiv Sanayi AS (Turkey) 1,335 14,409Geely Automobile Holdings, Ltd. (China) 39,000 66,930Genting Bhd (Malaysia) 12,300 20,155Genting Malaysia Bhd (Malaysia) 16,600 13,018Guangzhou Automobile Group Co., Ltd. Class H (China) 84,000 89,878Haier Electronics Group Co., Ltd. (China) 8,000 22,146Home Product Center PCL (Thailand) 83,100 47,149Kia Motors Corp. (South Korea) 3,404 130,020Lojas Renner SA (Brazil) 440 5,404Mr Price Group, Ltd. (South Africa) 4,325 60,955Pou Chen Corp. (Taiwan) 8,000 9,925President Chain Store Corp. (Taiwan) 6,000 58,055Qualicorp SA (Brazil) 8,094 48,417Shinsegae International, Inc. (South Korea) 109 20,137Sinotruk Hong Kong, Ltd. (China) 26,500 45,927Wal-Mart de Mexico SAB de CV (Mexico) 44,632 121,825Zhongsheng Group Holdings, Ltd. (China) 14,500 40,438 834,408
Consumer staples (1.4%)Charoen Pokphand Foods PCL (Thailand) 18,000 $16,581Cia Cervecerias Unidas SA ADR (Chile) 1,047 29,578Estacio Participacoes SA (Brazil) 900 6,797Hanjaya Mandala Sampoerna Tbk PT (Indonesia) 91,600 20,371Indofood Sukses Makmur Tbk PT (Indonesia) 33,300 16,564LG Corp. (South Korea) 251 16,719Sao Martinho SA (Brazil) 2,300 12,063Smiles Fidelidade SA (Brazil) 3,543 38,752TCI Co., Ltd. (Taiwan) 2,000 27,547Uni-President Enterprises Corp. (Taiwan) 28,000 74,545United Tractors Tbk PT (Indonesia) 7,000 13,968Vipshop Holdings, Ltd. ADR (China) † 3,427 29,575Want Want China Holdings, Ltd. (China) 42,000 34,056Yum China Holdings, Inc. (China) 1,717 79,325 416,441Energy (1.3%)China Petroleum & Chemical Corp. (Sinopec) (China) 152,000 103,508Ecopetrol SA ADR (Colombia) 3,872 70,819Jastrzebska Spolka Weglowa SA (Poland) † 935 11,820Lukoil PJSC ADR (Russia) 158 13,338PTT PCL (Foreign depositary shares) (Thailand) 79,500 126,376Surgutneftegas OJSC (Russia) 51,025 34,470 360,331Financials (5.8%)Banco de Chile ADR (Chile) 722 21,436Banco do Brasil SA (Brazil) 8,735 122,701Banco Macro SA ADR (Argentina) 831 60,538Banco Santander (Brasil) S.A. (Units) (Brazil) 6,087 72,062Banco Santander Chile ADR (Chile) 1,322 39,554Banco Santander Mexico SA Institucion de Banca Multiple Grupo Financiero Santand Class B (Mexico) 31,782 48,765Bank of China, Ltd. (China) 60,000 25,293Bank of Communications Co., Ltd. (China) 104,000 78,791Capitec Bank Holdings, Ltd. (South Africa) 422 38,911China Construction Bank Corp. Class H (China) 13,000 11,172Country Garden Holdings co., Ltd. (China) 50,000 75,742FirstRand, Ltd. (South Africa) 1,886 9,179Fosun International, Ltd. (China) 34,500 45,889Grupo Financiero Banorte SAB de CV (Mexico) 6,993 40,616Guangzhou R&F Properties Co., Ltd. (China) 27,600 53,150Industrial & Commercial Bank of China, Ltd. (China) 231,000 168,186Industrial Bank of Korea (South Korea) 2,608 31,754IRB Brasil Resseguros SA (Brazil) 4,100 105,171Itau Unibanco Holding SA (Preference) (Brazil) † 8,186 77,299Itausa - Investimentos Itau SA (Preference) (Brazil) 3,120 10,473Korea Investment Holdings Co., Ltd. (South Korea) 143 10,015Logan Property Holdings Co., Ltd. (China) 12,000 19,462OTP Bank Nyrt (Hungary) 735 29,234Ping An Insurance (Group) Co. of China, Ltd. Class H (China) 17,000 204,608Powszechny Zaklad Ubezpieczen SA (Poland) 2,591 30,298RHB Bank Bhd (Malaysia) 19,500 26,378Sberbank of Russia PJSC ADR (Russia) 5,361 82,452Shinhan Financial Group Co., Ltd. (South Korea) 983 38,229Thanachart Capital PCL (Thailand) 4,900 8,868
COMMON STOCKS (22.1%)* cont. Shares ValueThe fund’s portfolio 6/30/19 (Unaudited)
Putnam VT Multi-Asset Absolute Return Fund 5
Financials cont.Tisco Financial Group PCL (Thailand) 7,700 $23,476Yuanta Financial Holding Co., Ltd. (Taiwan) 59,000 35,456 1,645,158Health care (0.4%)Guangzhou Baiyunshan Pharmaceutical Holdings Co., Ltd. (China) 10,000 45,225Hypermarcas SA (Brazil) 7,582 59,215 104,440Technology (4.9%)Alibaba Group Holding, Ltd. ADR (China) † 1,142 193,512Globalwafers Co., Ltd. (Taiwan) 3,000 30,503HannStar Display Corp. (Taiwan) 52,000 11,072Innolux Corp. (Taiwan) 8,000 1,891Naspers, Ltd. Class N (South Africa) 126 30,590Radiant Opto-Electronics Corp. (Taiwan) 13,000 43,573Samsung Electronics Co., Ltd. (South Korea) 9,975 406,700Samsung SDS Co., Ltd. (South Korea) 257 47,837SK Hynix, Inc. (South Korea) 2,309 139,092Taiwan Semiconductor Manufacturing Co., Ltd. ADR (Taiwan) 3,943 154,447Tencent Holdings, Ltd. (China) 5,100 230,727Tianneng Power International, Ltd. (China) 14,000 11,279Tripod Technology Corp. (Taiwan) 9,000 31,946Xhen Ding Technology Holding, Ltd. (Taiwan) 18,000 57,736 1,390,905Transportation (0.1%)AirAsia Bhd (Malaysia) 23,500 15,527Grupo Aeroportuario del Centro Norte SAB de CV (Mexico) 3,251 19,866 35,393Utilities and power (0.8%)Cia de Saneamento Basico do Estado de Sao Paulo (Brazil) 8,800 108,328Electricity Generating PCL (Thailand) 2,400 25,434Enel Americas SA ADR (Chile) 3,761 33,360Enel Chile SA ADR (Chile) 1,917 9,163Glow Energy PCL (Thailand) 7,400 21,476Inter RAO UES PJSC (Russia) 335,890 24,118Manila Electric Co. (Philippines) 830 6,268 228,147
Total common stocks (cost $5,880,437) $6,290,921
U.S. GOVERNMENT AND AGENCY MORTGAGE OBLIGATIONS (10.8%)* Principal amount Value
U.S. Government Agency Mortgage Obligations (10.8%)Uniform Mortgage Backed Securities
4.00%, TBA, 7/1/49 $1,000,000 $1,033,5163.50%, TBA, 8/1/49 1,000,000 1,022,1483.50%, TBA, 7/1/49 1,000,000 1,022,422
3,078,086
Total U.S. government and agency mortgage obligations (cost $3,071,017) $3,078,086
INVESTMENT COMPANIES (9.2%)* Shares Value
Communication Services Select Sector SPDR Fund 7,712 $379,585Consumer Staples Select Sector SPDR Fund 6,724 390,463Financial Select Sector SPDR Fund 13,781 380,356Industrial Select Sector SPDR Fund 4,994 386,635iShares MSCI India ETF (India) 7,906 279,082
Real Estate Select Sector SPDR Fund 10,982 $403,808Utility Select Sector SPDR Fund S 6,719 400,654Total investment companies (cost $2,473,247) $2,620,583
COMMODITY LINKED NOTES (7.1%)* ††† Principal amount Value
Bank of America Corp. 144A sr. unsec. unsub. notes 1-month LIBOR less 0.17%, 2019 (Indexed to the BofA Merrill Lynch Commodity MLBX4SX6 Excess Return Strategy multiplied by 3) $300,000 $428,133Bank of America Corp. 144A unsub. notes 1-month LIBOR less 0.22%, 2019 (Indexed to the BofA Merrill Lynch Commodity MLBX4SX6 Excess Return Strategy multiplied by 3) 100,000 128,705Citigroup Global Markets Holdings, Inc. sr. notes Ser. N, 1-month USD LIBOR less 0.15%, 2019 (Indexed to the Citi Commodities F3 vs F0 - 4x Leveraged CVIC4X30 Index multiplied by 3) 224,000 302,221Citigroup Global Markets Holdings, Inc. 144A sr. notes 1-month USD LIBOR less 0.18%, 2019 (Indexed to the Citi Cross-Asset Trend 10% Vol Index multiplied by 3) 312,000 288,144UBS AG/London 144A sr. notes 1-month LIBOR less 0.25%, 2020 (Indexed to the UBSIF3AT Index multiplied by 3) (United Kingdom) 366,000 359,030UBS AG/London 144A sr. notes 1-month LIBOR less 0.25%, 2020 (Indexed to the UBSIF3AT Index multiplied by 3) (United Kingdom) 241,000 243,379Goldman Sachs International 144A notes zero %, 2019 (Indexed to the S&P GSCI Excess Return Index multiplied by 3) 97,000 132,205UBS AG/London 144A sr. notes, 1-month LIBOR less 0.25%, 2020 (Indexed to the S&P GSCI Total Return Index multiplied by 3) (United Kingdom) 90,000 122,683Total commodity Linked Notes (cost $1,730,000) $2,004,500
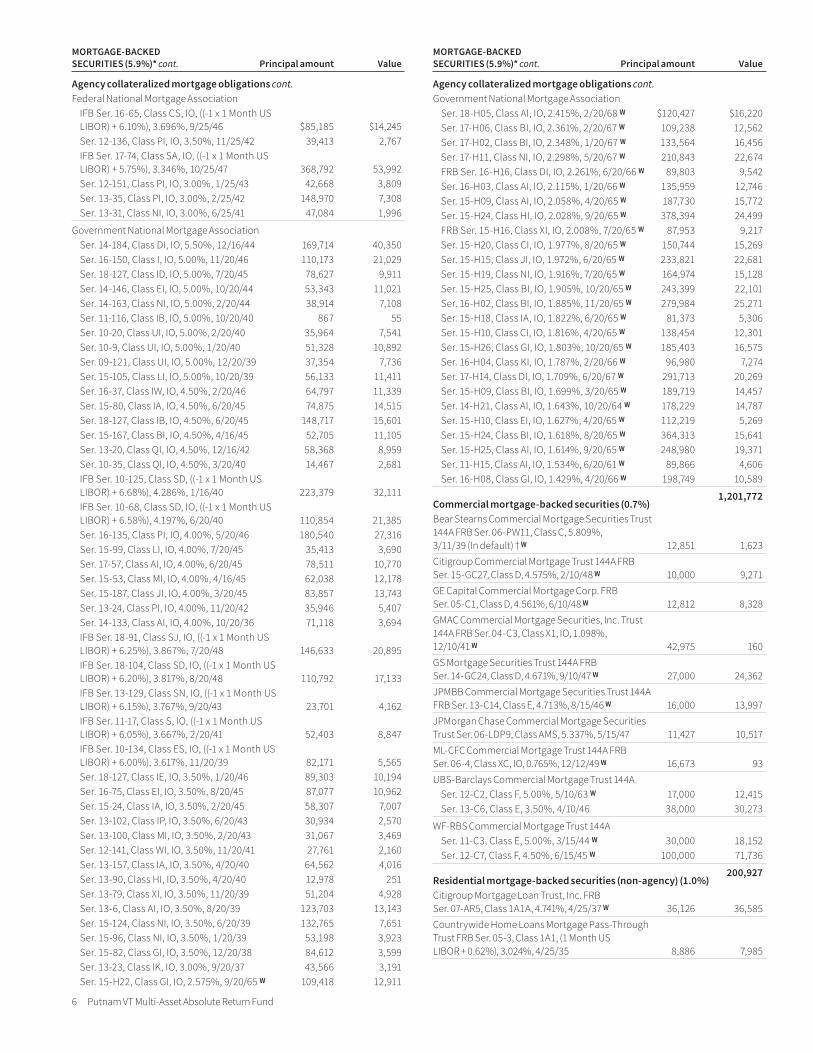
MORTGAGE-BACKED SECURITIES (5.9%)* Principal amount Value
Agency collateralized mortgage obligations (4.2%)Federal Home Loan Mortgage Corporation
IFB Ser. 3747, Class SA, IO, ((-1 x 1 Month US LIBOR) + 6.50%), 4.106%, 10/15/40 $21,021 $3,629Ser. 4568, Class MI, IO, 4.00%, 4/15/46 71,794 10,320Ser. 4259, Class DI, IO, 4.00%, 6/15/43 118,432 14,432Ser. 4193, Class PI, IO, 4.00%, 3/15/43 33,574 4,060IFB Ser. 4073, Class AS, IO, ((-1 x 1 Month US LIBOR) + 6.05%), 3.656%, 8/15/38 90,391 5,085Ser. 4097, Class PI, IO, 3.50%, 11/15/40 71,490 5,905Ser. 4099, Class BI, IO, 3.50%, 6/15/39 75,056 4,691Ser. 4801, Class IG, IO, 3.00%, 6/15/48 98,555 13,144Ser. 4134, Class PI, IO, 3.00%, 11/15/42 150,325 14,351Ser. 4206, Class IP, IO, 3.00%, 12/15/41 63,920 4,803
Federal National Mortgage AssociationSer. 18-51, Class IO, IO, 6.50%, 7/25/48 179,617 37,213Connecticut Avenue Securities FRB Ser. 15-C02, Class 2M2, (1 Month US LIBOR + 4.00%), 6.404%, 5/25/25 3,284 3,445Ser. 16-3, Class NI, IO, 6.00%, 2/25/46 51,484 11,226Ser. 16-3, Class MI, IO, 5.50%, 2/25/46 211,025 41,517Ser. 15-30, IO, 5.50%, 5/25/45 184,735 38,569IFB Ser. 13-130, Class SD, IO, ((-1 x 1 Month US LIBOR) + 6.60%), 4.196%, 1/25/44 87,455 16,566Ser. 17-2, Class KI, IO, 4.00%, 2/25/47 85,867 12,850IFB Ser. 17-8, Class SB, IO, ((-1 x 1 Month US LIBOR) + 6.10%), 3.696%, 2/25/47 118,391 21,141
COMMON STOCKS (22.1%)* cont. Shares Value INVESTMENT COMPANIES (9.2%)* cont. Shares Value
6 Putnam VT Multi-Asset Absolute Return Fund
Agency collateralized mortgage obligations cont.Federal National Mortgage Association
IFB Ser. 16-65, Class CS, IO, ((-1 x 1 Month US LIBOR) + 6.10%), 3.696%, 9/25/46 $85,185 $14,245Ser. 12-136, Class PI, IO, 3.50%, 11/25/42 39,413 2,767IFB Ser. 17-74, Class SA, IO, ((-1 x 1 Month US LIBOR) + 5.75%), 3.346%, 10/25/47 368,792 53,992Ser. 12-151, Class PI, IO, 3.00%, 1/25/43 42,668 3,809Ser. 13-35, Class PI, IO, 3.00%, 2/25/42 148,970 7,308Ser. 13-31, Class NI, IO, 3.00%, 6/25/41 47,084 1,996
Government National Mortgage AssociationSer. 14-184, Class DI, IO, 5.50%, 12/16/44 169,714 40,350Ser. 16-150, Class I, IO, 5.00%, 11/20/46 110,173 21,029Ser. 18-127, Class ID, IO, 5.00%, 7/20/45 78,627 9,911Ser. 14-146, Class EI, IO, 5.00%, 10/20/44 53,343 11,021Ser. 14-163, Class NI, IO, 5.00%, 2/20/44 38,914 7,108Ser. 11-116, Class IB, IO, 5.00%, 10/20/40 867 55Ser. 10-20, Class UI, IO, 5.00%, 2/20/40 35,964 7,541Ser. 10-9, Class UI, IO, 5.00%, 1/20/40 51,328 10,892Ser. 09-121, Class UI, IO, 5.00%, 12/20/39 37,354 7,736Ser. 15-105, Class LI, IO, 5.00%, 10/20/39 56,133 11,411Ser. 16-37, Class IW, IO, 4.50%, 2/20/46 64,797 11,339Ser. 15-80, Class IA, IO, 4.50%, 6/20/45 74,875 14,515Ser. 18-127, Class IB, IO, 4.50%, 6/20/45 148,717 15,601Ser. 15-167, Class BI, IO, 4.50%, 4/16/45 52,705 11,105Ser. 13-20, Class QI, IO, 4.50%, 12/16/42 58,368 8,959Ser. 10-35, Class QI, IO, 4.50%, 3/20/40 14,467 2,681IFB Ser. 10-125, Class SD, ((-1 x 1 Month US LIBOR) + 6.68%), 4.286%, 1/16/40 223,379 32,111IFB Ser. 10-68, Class SD, IO, ((-1 x 1 Month US LIBOR) + 6.58%), 4.197%, 6/20/40 110,854 21,385Ser. 16-135, Class PI, IO, 4.00%, 5/20/46 180,540 27,316Ser. 15-99, Class LI, IO, 4.00%, 7/20/45 35,413 3,690Ser. 17-57, Class AI, IO, 4.00%, 6/20/45 78,511 10,770Ser. 15-53, Class MI, IO, 4.00%, 4/16/45 62,038 12,178Ser. 15-187, Class JI, IO, 4.00%, 3/20/45 83,857 13,743Ser. 13-24, Class PI, IO, 4.00%, 11/20/42 35,946 5,407Ser. 14-133, Class AI, IO, 4.00%, 10/20/36 71,118 3,694IFB Ser. 18-91, Class SJ, IO, ((-1 x 1 Month US LIBOR) + 6.25%), 3.867%, 7/20/48 146,633 20,895IFB Ser. 18-104, Class SD, IO, ((-1 x 1 Month US LIBOR) + 6.20%), 3.817%, 8/20/48 110,792 17,133IFB Ser. 13-129, Class SN, IO, ((-1 x 1 Month US LIBOR) + 6.15%), 3.767%, 9/20/43 23,701 4,162IFB Ser. 11-17, Class S, IO, ((-1 x 1 Month US LIBOR) + 6.05%), 3.667%, 2/20/41 52,403 8,847IFB Ser. 10-134, Class ES, IO, ((-1 x 1 Month US LIBOR) + 6.00%), 3.617%, 11/20/39 82,171 5,565Ser. 18-127, Class IE, IO, 3.50%, 1/20/46 89,303 10,194Ser. 16-75, Class EI, IO, 3.50%, 8/20/45 87,077 10,962Ser. 15-24, Class IA, IO, 3.50%, 2/20/45 58,307 7,007Ser. 13-102, Class IP, IO, 3.50%, 6/20/43 30,934 2,570Ser. 13-100, Class MI, IO, 3.50%, 2/20/43 31,067 3,469Ser. 12-141, Class WI, IO, 3.50%, 11/20/41 27,761 2,160Ser. 13-157, Class IA, IO, 3.50%, 4/20/40 64,562 4,016Ser. 13-90, Class HI, IO, 3.50%, 4/20/40 12,978 251Ser. 13-79, Class XI, IO, 3.50%, 11/20/39 51,204 4,928Ser. 13-6, Class AI, IO, 3.50%, 8/20/39 123,703 13,143Ser. 15-124, Class NI, IO, 3.50%, 6/20/39 132,765 7,651Ser. 15-96, Class NI, IO, 3.50%, 1/20/39 53,198 3,923Ser. 15-82, Class GI, IO, 3.50%, 12/20/38 84,612 3,599Ser. 13-23, Class IK, IO, 3.00%, 9/20/37 43,566 3,191Ser. 15-H22, Class GI, IO, 2.575%, 9/20/65 W 109,418 12,911
Agency collateralized mortgage obligations cont.Government National Mortgage Association
Ser. 18-H05, Class AI, IO, 2.415%, 2/20/68 W $120,427 $16,220Ser. 17-H06, Class BI, IO, 2.361%, 2/20/67 W 109,238 12,562Ser. 17-H02, Class BI, IO, 2.348%, 1/20/67 W 133,564 16,456Ser. 17-H11, Class NI, IO, 2.298%, 5/20/67 W 210,843 22,674FRB Ser. 16-H16, Class DI, IO, 2.261%, 6/20/66 W 89,803 9,542Ser. 16-H03, Class AI, IO, 2.115%, 1/20/66 W 135,959 12,746Ser. 15-H09, Class AI, IO, 2.058%, 4/20/65 W 187,730 15,772Ser. 15-H24, Class HI, IO, 2.028%, 9/20/65 W 378,394 24,499FRB Ser. 15-H16, Class XI, IO, 2.008%, 7/20/65 W 87,953 9,217Ser. 15-H20, Class CI, IO, 1.977%, 8/20/65 W 150,744 15,269Ser. 15-H15, Class JI, IO, 1.972%, 6/20/65 W 233,821 22,681Ser. 15-H19, Class NI, IO, 1.916%, 7/20/65 W 164,974 15,128Ser. 15-H25, Class BI, IO, 1.905%, 10/20/65 W 243,399 22,101Ser. 16-H02, Class BI, IO, 1.885%, 11/20/65 W 279,984 25,271Ser. 15-H18, Class IA, IO, 1.822%, 6/20/65 W 81,373 5,306Ser. 15-H10, Class CI, IO, 1.816%, 4/20/65 W 138,454 12,301Ser. 15-H26, Class GI, IO, 1.803%, 10/20/65 W 185,403 16,575Ser. 16-H04, Class KI, IO, 1.787%, 2/20/66 W 96,980 7,274Ser. 17-H14, Class DI, IO, 1.709%, 6/20/67 W 291,713 20,269Ser. 15-H09, Class BI, IO, 1.699%, 3/20/65 W 189,719 14,457Ser. 14-H21, Class AI, IO, 1.643%, 10/20/64 W 178,229 14,787Ser. 15-H10, Class EI, IO, 1.627%, 4/20/65 W 112,219 5,269Ser. 15-H24, Class BI, IO, 1.618%, 8/20/65 W 364,313 15,641Ser. 15-H25, Class AI, IO, 1.614%, 9/20/65 W 248,980 19,371Ser. 11-H15, Class AI, IO, 1.534%, 6/20/61 W 89,866 4,606Ser. 16-H08, Class GI, IO, 1.429%, 4/20/66 W 198,749 10,589
1,201,772Commercial mortgage-backed securities (0.7%)Bear Stearns Commercial Mortgage Securities Trust 144A FRB Ser. 06-PW11, Class C, 5.809%, 3/11/39 (In default) † W 12,851 1,623Citigroup Commercial Mortgage Trust 144A FRB Ser. 15-GC27, Class D, 4.575%, 2/10/48 W 10,000 9,271GE Capital Commercial Mortgage Corp. FRB Ser. 05-C1, Class D, 4.561%, 6/10/48 W 12,812 8,328GMAC Commercial Mortgage Securities, Inc. Trust 144A FRB Ser. 04-C3, Class X1, IO, 1.098%, 12/10/41 W 42,975 160GS Mortgage Securities Trust 144A FRB Ser. 14-GC24, Class D, 4.671%, 9/10/47 W 27,000 24,362JPMBB Commercial Mortgage Securities Trust 144A FRB Ser. 13-C14, Class E, 4.713%, 8/15/46 W 16,000 13,997JPMorgan Chase Commercial Mortgage Securities Trust Ser. 06-LDP9, Class AMS, 5.337%, 5/15/47 11,427 10,517ML-CFC Commercial Mortgage Trust 144A FRB Ser. 06-4, Class XC, IO, 0.765%, 12/12/49 W 16,673 93UBS-Barclays Commercial Mortgage Trust 144A
Ser. 12-C2, Class F, 5.00%, 5/10/63 W 17,000 12,415Ser. 13-C6, Class E, 3.50%, 4/10/46 38,000 30,273
WF-RBS Commercial Mortgage Trust 144ASer. 11-C3, Class E, 5.00%, 3/15/44 W 30,000 18,152Ser. 12-C7, Class F, 4.50%, 6/15/45 W 100,000 71,736
200,927Residential mortgage-backed securities (non-agency) (1.0%)Citigroup Mortgage Loan Trust, Inc. FRB Ser. 07-AR5, Class 1A1A, 4.741%, 4/25/37 W 36,126 36,585Countrywide Home Loans Mortgage Pass-Through Trust FRB Ser. 05-3, Class 1A1, (1 Month US LIBOR + 0.62%), 3.024%, 4/25/35 8,886 7,985
MORTGAGE-BACKED SECURITIES (5.9%)* cont. Principal amount Value
MORTGAGE-BACKED SECURITIES (5.9%)* cont. Principal amount Value
Putnam VT Multi-Asset Absolute Return Fund 7
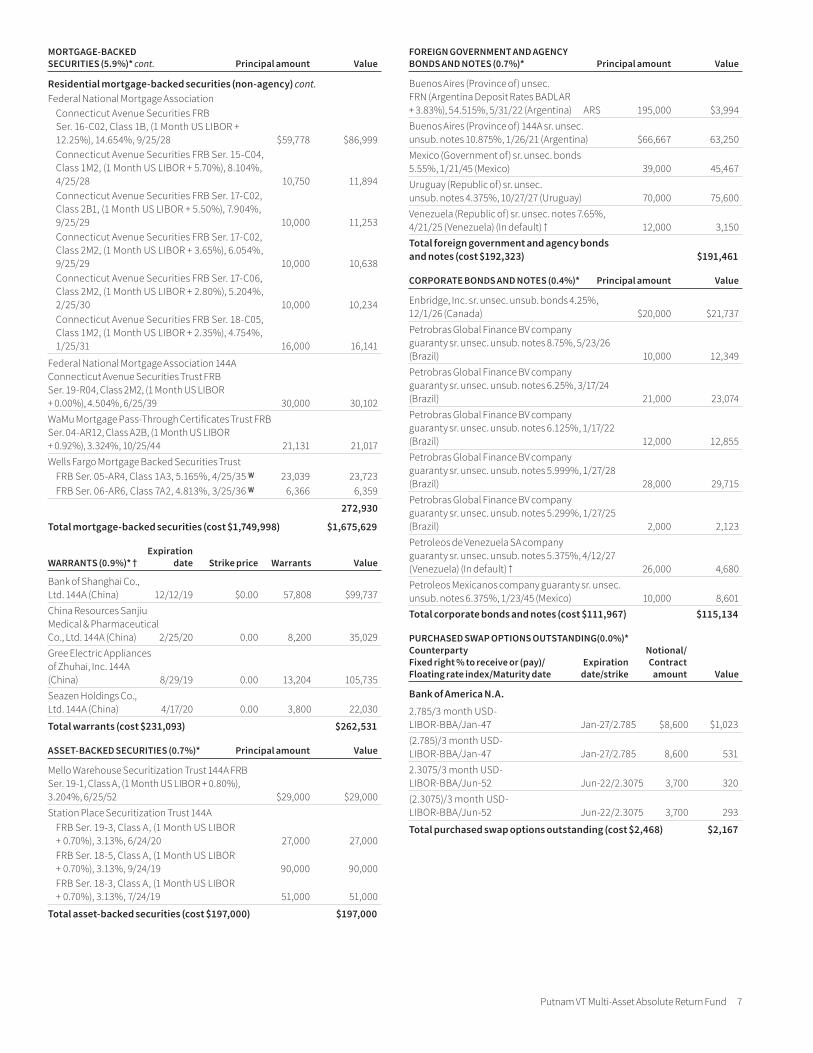
Residential mortgage-backed securities (non-agency) cont.Federal National Mortgage Association
Connecticut Avenue Securities FRB Ser. 16-C02, Class 1B, (1 Month US LIBOR + 12.25%), 14.654%, 9/25/28 $59,778 $86,999Connecticut Avenue Securities FRB Ser. 15-C04, Class 1M2, (1 Month US LIBOR + 5.70%), 8.104%, 4/25/28 10,750 11,894Connecticut Avenue Securities FRB Ser. 17-C02, Class 2B1, (1 Month US LIBOR + 5.50%), 7.904%, 9/25/29 10,000 11,253Connecticut Avenue Securities FRB Ser. 17-C02, Class 2M2, (1 Month US LIBOR + 3.65%), 6.054%, 9/25/29 10,000 10,638Connecticut Avenue Securities FRB Ser. 17-C06, Class 2M2, (1 Month US LIBOR + 2.80%), 5.204%, 2/25/30 10,000 10,234Connecticut Avenue Securities FRB Ser. 18-C05, Class 1M2, (1 Month US LIBOR + 2.35%), 4.754%, 1/25/31 16,000 16,141
Federal National Mortgage Association 144A Connecticut Avenue Securities Trust FRB Ser. 19-R04, Class 2M2, (1 Month US LIBOR + 0.00%), 4.504%, 6/25/39 30,000 30,102WaMu Mortgage Pass-Through Certificates Trust FRB Ser. 04-AR12, Class A2B, (1 Month US LIBOR + 0.92%), 3.324%, 10/25/44 21,131 21,017Wells Fargo Mortgage Backed Securities Trust
FRB Ser. 05-AR4, Class 1A3, 5.165%, 4/25/35 W 23,039 23,723FRB Ser. 06-AR6, Class 7A2, 4.813%, 3/25/36 W 6,366 6,359
272,930
Total mortgage-backed securities (cost $1,749,998) $1,675,629
Expiration WARRANTS (0.9%)* † date Strike price Warrants Value
Bank of Shanghai Co., Ltd. 144A (China) 12/12/19 $0.00 57,808 $99,737China Resources Sanjiu Medical & Pharmaceutical Co., Ltd. 144A (China) 2/25/20 0.00 8,200 35,029Gree Electric Appliances of Zhuhai, Inc. 144A (China) 8/29/19 0.00 13,204 105,735Seazen Holdings Co., Ltd. 144A (China) 4/17/20 0.00 3,800 22,030
Total warrants (cost $231,093) $262,531
ASSET-BACKED SECURITIES (0.7%)* Principal amount Value
Mello Warehouse Securitization Trust 144A FRB Ser. 19-1, Class A, (1 Month US LIBOR + 0.80%), 3.204%, 6/25/52 $29,000 $29,000Station Place Securitization Trust 144A
FRB Ser. 19-3, Class A, (1 Month US LIBOR + 0.70%), 3.13%, 6/24/20 27,000 27,000FRB Ser. 18-5, Class A, (1 Month US LIBOR + 0.70%), 3.13%, 9/24/19 90,000 90,000FRB Ser. 18-3, Class A, (1 Month US LIBOR + 0.70%), 3.13%, 7/24/19 51,000 51,000
Total asset-backed securities (cost $197,000) $197,000
FOREIGN GOVERNMENT AND AGENCY BONDS AND NOTES (0.7%)* Principal amount Value
Buenos Aires (Province of) unsec. FRN (Argentina Deposit Rates BADLAR + 3.83%), 54.515%, 5/31/22 (Argentina) ARS 195,000 $3,994Buenos Aires (Province of) 144A sr. unsec. unsub. notes 10.875%, 1/26/21 (Argentina) $66,667 63,250Mexico (Government of) sr. unsec. bonds 5.55%, 1/21/45 (Mexico) 39,000 45,467Uruguay (Republic of) sr. unsec. unsub. notes 4.375%, 10/27/27 (Uruguay) 70,000 75,600Venezuela (Republic of) sr. unsec. notes 7.65%, 4/21/25 (Venezuela) (In default) † 12,000 3,150Total foreign government and agency bonds and notes (cost $192,323) $191,461
CORPORATE BONDS AND NOTES (0.4%)* Principal amount Value
Enbridge, Inc. sr. unsec. unsub. bonds 4.25%, 12/1/26 (Canada) $20,000 $21,737Petrobras Global Finance BV company guaranty sr. unsec. unsub. notes 8.75%, 5/23/26 (Brazil) 10,000 12,349Petrobras Global Finance BV company guaranty sr. unsec. unsub. notes 6.25%, 3/17/24 (Brazil) 21,000 23,074Petrobras Global Finance BV company guaranty sr. unsec. unsub. notes 6.125%, 1/17/22 (Brazil) 12,000 12,855Petrobras Global Finance BV company guaranty sr. unsec. unsub. notes 5.999%, 1/27/28 (Brazil) 28,000 29,715Petrobras Global Finance BV company guaranty sr. unsec. unsub. notes 5.299%, 1/27/25 (Brazil) 2,000 2,123Petroleos de Venezuela SA company guaranty sr. unsec. unsub. notes 5.375%, 4/12/27 (Venezuela) (In default) † 26,000 4,680Petroleos Mexicanos company guaranty sr. unsec. unsub. notes 6.375%, 1/23/45 (Mexico) 10,000 8,601Total corporate bonds and notes (cost $111,967) $115,134
PURCHASED SWAP OPTIONS OUTSTANDING (0.0%)* Counterparty Notional/ Fixed right % to receive or (pay)/ Expiration Contract Floating rate index/Maturity date date/strike amount Value
Bank of America N.A.
2.785/3 month USD- LIBOR-BBA/Jan-47 Jan-27/2.785 $8,600 $1,023(2.785)/3 month USD- LIBOR-BBA/Jan-47 Jan-27/2.785 8,600 5312.3075/3 month USD- LIBOR-BBA/Jun-52 Jun-22/2.3075 3,700 320(2.3075)/3 month USD- LIBOR-BBA/Jun-52 Jun-22/2.3075 3,700 293
Total purchased swap options outstanding (cost $2,468) $2,167
MORTGAGE-BACKED SECURITIES (5.9%)* cont. Principal amount Value
8 Putnam VT Multi-Asset Absolute Return Fund
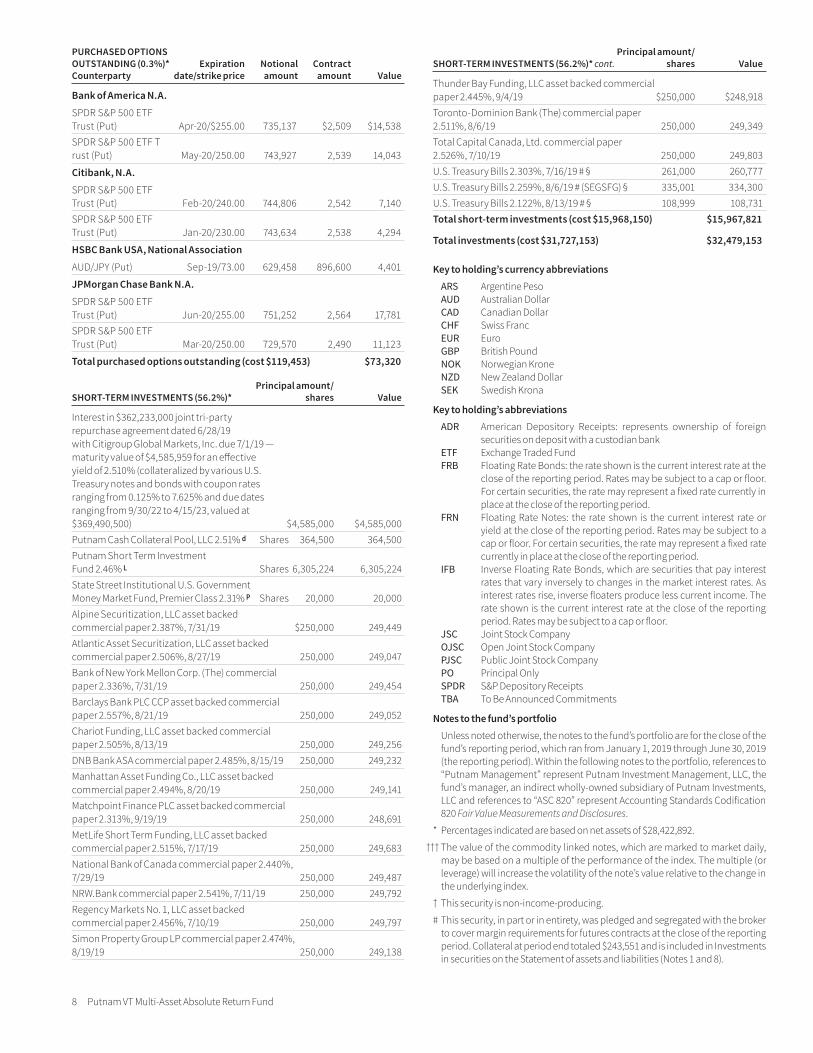
PURCHASED OPTIONS OUTSTANDING (0.3%)* Expiration Notional Contract Counterparty date/strike price amount amount Value
Bank of America N.A.
SPDR S&P 500 ETF Trust (Put) Apr-20/$255.00 735,137 $2,509 $14,538SPDR S&P 500 ETF T rust (Put) May-20/250.00 743,927 2,539 14,043
Citibank, N.A.
SPDR S&P 500 ETF Trust (Put) Feb-20/240.00 744,806 2,542 7,140SPDR S&P 500 ETF Trust (Put) Jan-20/230.00 743,634 2,538 4,294
HSBC Bank USA, National Association
AUD/JPY (Put) Sep-19/73.00 629,458 896,600 4,401
JPMorgan Chase Bank N.A.
SPDR S&P 500 ETF Trust (Put) Jun-20/255.00 751,252 2,564 17,781SPDR S&P 500 ETF Trust (Put) Mar-20/250.00 729,570 2,490 11,123
Total purchased options outstanding (cost $119,453) $73,320
Principal amount/ SHORT-TERM INVESTMENTS (56.2%)* shares Value
Interest in $362,233,000 joint tri-party repurchase agreement dated 6/28/19 with Citigroup Global Markets, Inc. due 7/1/19 — maturity value of $4,585,959 for an effective yield of 2.510% (collateralized by various U.S. Treasury notes and bonds with coupon rates ranging from 0.125% to 7.625% and due dates ranging from 9/30/22 to 4/15/23, valued at $369,490,500) $4,585,000 $4,585,000Putnam Cash Collateral Pool, LLC 2.51% d Shares 364,500 364,500Putnam Short Term Investment Fund 2.46% L Shares 6,305,224 6,305,224State Street Institutional U.S. Government Money Market Fund, Premier Class 2.31% P Shares 20,000 20,000Alpine Securitization, LLC asset backed commercial paper 2.387%, 7/31/19 $250,000 249,449Atlantic Asset Securitization, LLC asset backed commercial paper 2.506%, 8/27/19 250,000 249,047Bank of New York Mellon Corp. (The) commercial paper 2.336%, 7/31/19 250,000 249,454Barclays Bank PLC CCP asset backed commercial paper 2.557%, 8/21/19 250,000 249,052Chariot Funding, LLC asset backed commercial paper 2.505%, 8/13/19 250,000 249,256DNB Bank ASA commercial paper 2.485%, 8/15/19 250,000 249,232Manhattan Asset Funding Co., LLC asset backed commercial paper 2.494%, 8/20/19 250,000 249,141Matchpoint Finance PLC asset backed commercial paper 2.313%, 9/19/19 250,000 248,691MetLife Short Term Funding, LLC asset backed commercial paper 2.515%, 7/17/19 250,000 249,683National Bank of Canada commercial paper 2.440%, 7/29/19 250,000 249,487NRW.Bank commercial paper 2.541%, 7/11/19 250,000 249,792Regency Markets No. 1, LLC asset backed commercial paper 2.456%, 7/10/19 250,000 249,797Simon Property Group LP commercial paper 2.474%, 8/19/19 250,000 249,138
Principal amount/ SHORT-TERM INVESTMENTS (56.2%)* cont. shares Value
Thunder Bay Funding, LLC asset backed commercial paper 2.445%, 9/4/19 $250,000 $248,918Toronto-Dominion Bank (The) commercial paper 2.511%, 8/6/19 250,000 249,349Total Capital Canada, Ltd. commercial paper 2.526%, 7/10/19 250,000 249,803U.S. Treasury Bills 2.303%, 7/16/19 # § 261,000 260,777U.S. Treasury Bills 2.259%, 8/6/19 # (SEGSFG) § 335,001 334,300U.S. Treasury Bills 2.122%, 8/13/19 # § 108,999 108,731Total short-term investments (cost $15,968,150) $15,967,821
Total investments (cost $31,727,153) $32,479,153
Key to holding’s currency abbreviations ARS Argentine Peso AUD Australian Dollar CAD Canadian Dollar CHF Swiss Franc EUR Euro GBP British Pound NOK Norwegian Krone NZD New Zealand Dollar SEK Swedish Krona
Key to holding’s abbreviations ADR American Depository Receipts: represents ownership of foreign
securities on deposit with a custodian bank ETF Exchange Traded Fund FRB Floating Rate Bonds: the rate shown is the current interest rate at the
close of the reporting period. Rates may be subject to a cap or floor. For certain securities, the rate may represent a fixed rate currently in place at the close of the reporting period.
FRN Floating Rate Notes: the rate shown is the current interest rate or yield at the close of the reporting period. Rates may be subject to a cap or floor. For certain securities, the rate may represent a fixed rate currently in place at the close of the reporting period.
IFB Inverse Floating Rate Bonds, which are securities that pay interest rates that vary inversely to changes in the market interest rates. As interest rates rise, inverse floaters produce less current income. The rate shown is the current interest rate at the close of the reporting period. Rates may be subject to a cap or floor.
JSC Joint Stock Company OJSC Open Joint Stock Company PJSC Public Joint Stock Company PO Principal Only SPDR S&P Depository Receipts TBA To Be Announced Commitments
Notes to the fund’s portfolio Unless noted otherwise, the notes to the fund’s portfolio are for the close of the
fund’s reporting period, which ran from January 1, 2019 through June 30, 2019 (the reporting period). Within the following notes to the portfolio, references to “Putnam Management” represent Putnam Investment Management, LLC, the fund’s manager, an indirect wholly-owned subsidiary of Putnam Investments, LLC and references to “ASC 820” represent Accounting Standards Codification 820 Fair Value Measurements and Disclosures.
* Percentages indicated are based on net assets of $28,422,892.
††† The value of the commodity linked notes, which are marked to market daily, may be based on a multiple of the performance of the index. The multiple (or leverage) will increase the volatility of the note’s value relative to the change in the underlying index.
† This security is non-income-producing.
# This security, in part or in entirety, was pledged and segregated with the broker to cover margin requirements for futures contracts at the close of the reporting period. Collateral at period end totaled $243,551 and is included in Investments in securities on the Statement of assets and liabilities (Notes 1 and 8).
Putnam VT Multi-Asset Absolute Return Fund 9
∆ This security, in part or in entirety, was pledged and segregated with the custo-dian for collateral on certain derivative contracts at the close of the reporting period. Collateral at period end totaled $110,745 and is included in Investments in securities on the Statement of assets and liabilities (Notes 1 and 8).
§ This security, in part or in entirety, was pledged and segregated with the custo-dian for collateral on the initial margin on certain centrally cleared derivative contracts at the close of the reporting period. Collateral at period end totaled $161,737 and is included in Investments in securities on the Statement of assets and liabilities (Notes 1 and 8).
d Affiliated company. See Notes 1 and 5 to the financial statements regarding securities lending. The rate quoted in the security description is the annualized 7-day yield of the fund at the close of the reporting period.
L Affiliated company (Note 5). The rate quoted in the security description is the annualized 7-day yield of the fund at the close of the reporting period.
P This security was pledged, or purchased with cash that was pledged, to the fund for collateral on certain derivative contracts. The rate quoted in the
security description is the annualized 7-day yield of the fund at the close of the reporting period.
S Security on loan, in part or in entirety, at the close of the reporting period (Note 1).
At the close of the reporting period, the fund maintained liquid assets totaling $3,545,057 to cover certain derivative contracts and delayed delivery securities.
Unless otherwise noted, the rates quoted in Short-term investments security descriptions represent the weighted average yield to maturity.
Debt obligations are considered secured unless otherwise indicated.
144A after the name of an issuer represents securities exempt from registration under Rule 144A of the Securities Act of 1933, as amended. These securities may be resold in transactions exempt from registration, normally to qualified institutional buyers.
See Note 1 to the financial statements regarding TBA commitments.
The dates shown on debt obligations are the original maturity dates.
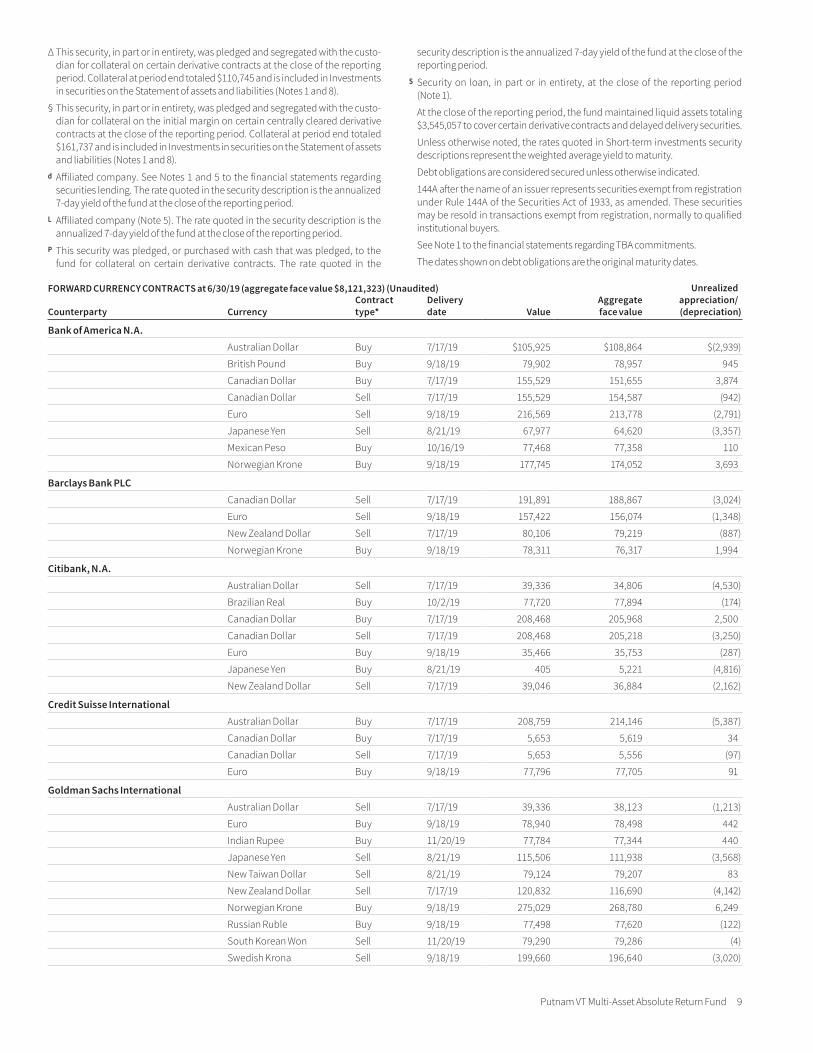
FORWARD CURRENCY CONTRACTS at 6/30/19 (aggregate face value $8,121,323) (Unaudited) Unrealized appreciation/ (depreciation)Counterparty Currency
Contract type*
Delivery date Value
Aggregate face value
Bank of America N.A.Australian Dollar Buy 7/17/19 $105,925 $108,864 $(2,939)
British Pound Buy 9/18/19 79,902 78,957 945
Canadian Dollar Buy 7/17/19 155,529 151,655 3,874
Canadian Dollar Sell 7/17/19 155,529 154,587 (942)
Euro Sell 9/18/19 216,569 213,778 (2,791)
Japanese Yen Sell 8/21/19 67,977 64,620 (3,357)
Mexican Peso Buy 10/16/19 77,468 77,358 110
Norwegian Krone Buy 9/18/19 177,745 174,052 3,693
Barclays Bank PLCCanadian Dollar Sell 7/17/19 191,891 188,867 (3,024)
Euro Sell 9/18/19 157,422 156,074 (1,348)
New Zealand Dollar Sell 7/17/19 80,106 79,219 (887)
Norwegian Krone Buy 9/18/19 78,311 76,317 1,994
Citibank, N.A.Australian Dollar Sell 7/17/19 39,336 34,806 (4,530)
Brazilian Real Buy 10/2/19 77,720 77,894 (174)
Canadian Dollar Buy 7/17/19 208,468 205,968 2,500
Canadian Dollar Sell 7/17/19 208,468 205,218 (3,250)
Euro Buy 9/18/19 35,466 35,753 (287)
Japanese Yen Buy 8/21/19 405 5,221 (4,816)
New Zealand Dollar Sell 7/17/19 39,046 36,884 (2,162)
Credit Suisse InternationalAustralian Dollar Buy 7/17/19 208,759 214,146 (5,387)
Canadian Dollar Buy 7/17/19 5,653 5,619 34
Canadian Dollar Sell 7/17/19 5,653 5,556 (97)
Euro Buy 9/18/19 77,796 77,705 91
Goldman Sachs InternationalAustralian Dollar Sell 7/17/19 39,336 38,123 (1,213)
Euro Buy 9/18/19 78,940 78,498 442
Indian Rupee Buy 11/20/19 77,784 77,344 440
Japanese Yen Sell 8/21/19 115,506 111,938 (3,568)
New Taiwan Dollar Sell 8/21/19 79,124 79,207 83
New Zealand Dollar Sell 7/17/19 120,832 116,690 (4,142)
Norwegian Krone Buy 9/18/19 275,029 268,780 6,249
Russian Ruble Buy 9/18/19 77,498 77,620 (122)
South Korean Won Sell 11/20/19 79,290 79,286 (4)
Swedish Krona Sell 9/18/19 199,660 196,640 (3,020)
10 Putnam VT Multi-Asset Absolute Return Fund
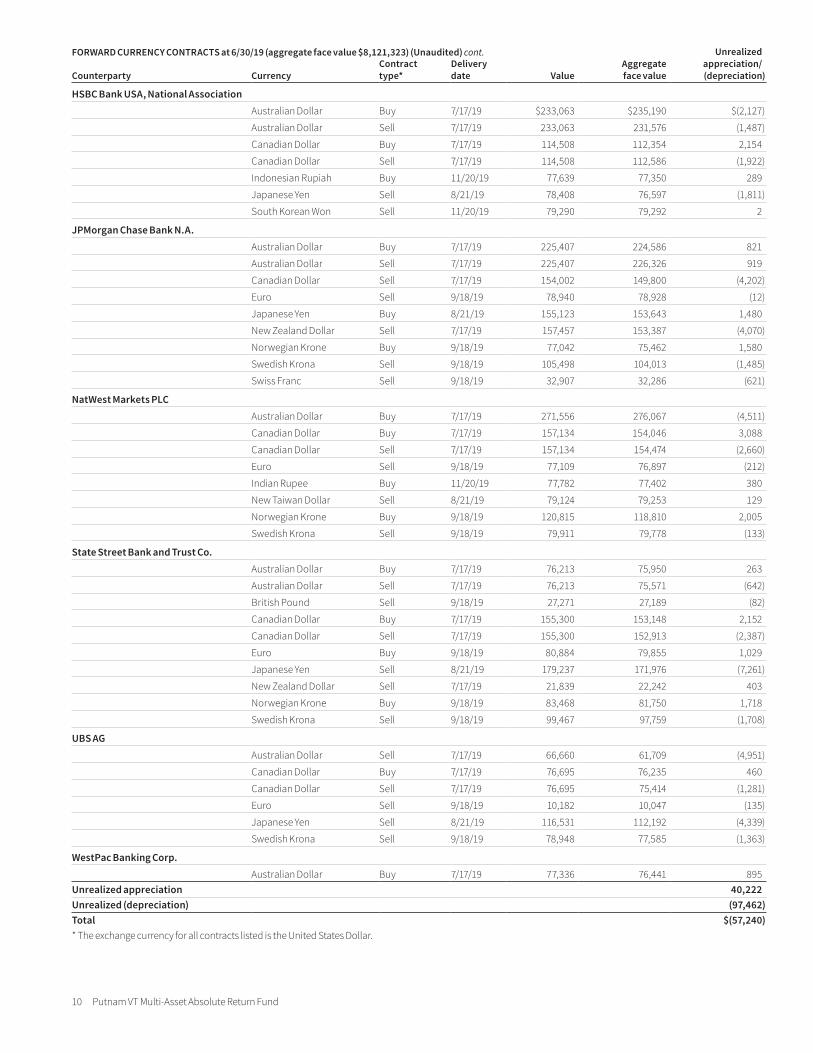
FORWARD CURRENCY CONTRACTS at 6/30/19 (aggregate face value $8,121,323) (Unaudited) cont. Unrealized appreciation/ (depreciation)Counterparty Currency
Contract type*
Delivery date Value
Aggregate face value
HSBC Bank USA, National AssociationAustralian Dollar Buy 7/17/19 $233,063 $235,190 $(2,127)
Australian Dollar Sell 7/17/19 233,063 231,576 (1,487)
Canadian Dollar Buy 7/17/19 114,508 112,354 2,154
Canadian Dollar Sell 7/17/19 114,508 112,586 (1,922)
Indonesian Rupiah Buy 11/20/19 77,639 77,350 289
Japanese Yen Sell 8/21/19 78,408 76,597 (1,811)
South Korean Won Sell 11/20/19 79,290 79,292 2
JPMorgan Chase Bank N.A.Australian Dollar Buy 7/17/19 225,407 224,586 821
Australian Dollar Sell 7/17/19 225,407 226,326 919
Canadian Dollar Sell 7/17/19 154,002 149,800 (4,202)
Euro Sell 9/18/19 78,940 78,928 (12)
Japanese Yen Buy 8/21/19 155,123 153,643 1,480
New Zealand Dollar Sell 7/17/19 157,457 153,387 (4,070)
Norwegian Krone Buy 9/18/19 77,042 75,462 1,580
Swedish Krona Sell 9/18/19 105,498 104,013 (1,485)
Swiss Franc Sell 9/18/19 32,907 32,286 (621)
NatWest Markets PLCAustralian Dollar Buy 7/17/19 271,556 276,067 (4,511)
Canadian Dollar Buy 7/17/19 157,134 154,046 3,088
Canadian Dollar Sell 7/17/19 157,134 154,474 (2,660)
Euro Sell 9/18/19 77,109 76,897 (212)
Indian Rupee Buy 11/20/19 77,782 77,402 380
New Taiwan Dollar Sell 8/21/19 79,124 79,253 129
Norwegian Krone Buy 9/18/19 120,815 118,810 2,005
Swedish Krona Sell 9/18/19 79,911 79,778 (133)
State Street Bank and Trust Co.Australian Dollar Buy 7/17/19 76,213 75,950 263
Australian Dollar Sell 7/17/19 76,213 75,571 (642)
British Pound Sell 9/18/19 27,271 27,189 (82)
Canadian Dollar Buy 7/17/19 155,300 153,148 2,152
Canadian Dollar Sell 7/17/19 155,300 152,913 (2,387)
Euro Buy 9/18/19 80,884 79,855 1,029
Japanese Yen Sell 8/21/19 179,237 171,976 (7,261)
New Zealand Dollar Sell 7/17/19 21,839 22,242 403
Norwegian Krone Buy 9/18/19 83,468 81,750 1,718
Swedish Krona Sell 9/18/19 99,467 97,759 (1,708)
UBS AGAustralian Dollar Sell 7/17/19 66,660 61,709 (4,951)
Canadian Dollar Buy 7/17/19 76,695 76,235 460
Canadian Dollar Sell 7/17/19 76,695 75,414 (1,281)
Euro Sell 9/18/19 10,182 10,047 (135)
Japanese Yen Sell 8/21/19 116,531 112,192 (4,339)
Swedish Krona Sell 9/18/19 78,948 77,585 (1,363)
WestPac Banking Corp.Australian Dollar Buy 7/17/19 77,336 76,441 895
Unrealized appreciation 40,222 Unrealized (depreciation) (97,462)Total $(57,240)* The exchange currency for all contracts listed is the United States Dollar.
Putnam VT Multi-Asset Absolute Return Fund 11
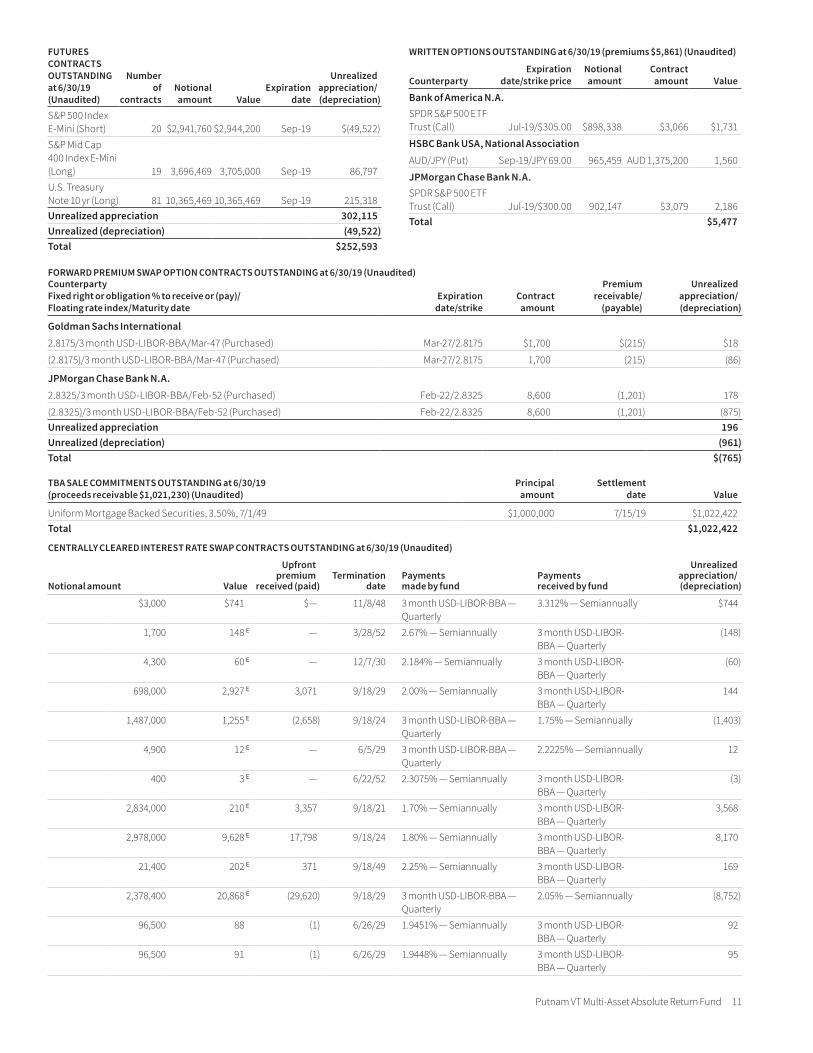
FUTURES CONTRACTS OUTSTANDING at 6/30/19 (Unaudited)
Number of
contractsNotional amount Value
Expiration date
Unrealized appreciation/ (depreciation)
S&P 500 Index E-Mini (Short) 20 $2,941,760 $2,944,200 Sep-19 $(49,522)S&P Mid Cap 400 Index E-Mini (Long) 19 3,696,469 3,705,000 Sep-19 86,797 U.S. Treasury Note 10 yr (Long) 81 10,365,469 10,365,469 Sep-19 215,318 Unrealized appreciation 302,115 Unrealized (depreciation) (49,522)Total $252,593
WRITTEN OPTIONS OUTSTANDING at 6/30/19 (premiums $5,861) (Unaudited)
CounterpartyExpiration
date/strike priceNotional amount
Contract amount Value
Bank of America N.A.SPDR S&P 500 ETF Trust (Call) Jul-19/$305.00 $898,338 $3,066 $1,731
HSBC Bank USA, National AssociationAUD/JPY (Put) Sep-19/JPY 69.00 965,459 AUD 1,375,200 1,560
JPMorgan Chase Bank N.A.SPDR S&P 500 ETF Trust (Call) Jul-19/$300.00 902,147 $3,079 2,186 Total $5,477
FORWARD PREMIUM SWAP OPTION CONTRACTS OUTSTANDING at 6/30/19 (Unaudited) Unrealized appreciation/ (depreciation)
Counterparty Fixed right or obligation % to receive or (pay)/ Floating rate index/Maturity date
Expiration date/strike
Contract amount
Premium receivable/ (payable)
Goldman Sachs International2.8175/3 month USD-LIBOR-BBA/Mar-47 (Purchased) Mar-27/2.8175 $1,700 $(215) $18
(2.8175)/3 month USD-LIBOR-BBA/Mar-47 (Purchased) Mar-27/2.8175 1,700 (215) (86)
JPMorgan Chase Bank N.A.2.8325/3 month USD-LIBOR-BBA/Feb-52 (Purchased) Feb-22/2.8325 8,600 (1,201) 178
(2.8325)/3 month USD-LIBOR-BBA/Feb-52 (Purchased) Feb-22/2.8325 8,600 (1,201) (875)Unrealized appreciation 196 Unrealized (depreciation) (961)Total $(765)
TBA SALE COMMITMENTS OUTSTANDING at 6/30/19 (proceeds receivable $1,021,230) (Unaudited)
Principal amount
Settlement date Value
Uniform Mortgage Backed Securities, 3.50%, 7/1/49 $1,000,000 7/15/19 $1,022,422 Total $1,022,422
CENTRALLY CLEARED INTEREST RATE SWAP CONTRACTS OUTSTANDING at 6/30/19 (Unaudited)
Notional amount Value
Upfront premium
received (paid)Termination
datePayments made by fund
Payments received by fund
Unrealized appreciation/ (depreciation)
$3,000 $741 $— 11/8/48 3 month USD-LIBOR-BBA — Quarterly
3.312% — Semiannually $744
1,700 148 E — 3/28/52 2.67% — Semiannually 3 month USD-LIBOR-BBA — Quarterly
(148 )
4,300 60 E — 12/7/30 2.184% — Semiannually 3 month USD-LIBOR-BBA — Quarterly
(60 )
698,000 2,927 E 3,071 9/18/29 2.00% — Semiannually 3 month USD-LIBOR-BBA — Quarterly
144
1,487,000 1,255 E (2,658 ) 9/18/24 3 month USD-LIBOR-BBA — Quarterly
1.75% — Semiannually (1,403 )
4,900 12 E — 6/5/29 3 month USD-LIBOR-BBA — Quarterly
2.2225% — Semiannually 12
400 3 E — 6/22/52 2.3075% — Semiannually 3 month USD-LIBOR-BBA — Quarterly
(3 )
2,834,000 210 E 3,357 9/18/21 1.70% — Semiannually 3 month USD-LIBOR-BBA — Quarterly
3,568
2,978,000 9,628 E 17,798 9/18/24 1.80% — Semiannually 3 month USD-LIBOR-BBA — Quarterly
8,170
21,400 202 E 371 9/18/49 2.25% — Semiannually 3 month USD-LIBOR-BBA — Quarterly
169
2,378,400 20,868 E (29,620 ) 9/18/29 3 month USD-LIBOR-BBA — Quarterly
2.05% — Semiannually (8,752 )
96,500 88 (1 ) 6/26/29 1.9451% — Semiannually 3 month USD-LIBOR-BBA — Quarterly
92
96,500 91 (1 ) 6/26/29 1.9448% — Semiannually 3 month USD-LIBOR-BBA — Quarterly
95
12 Putnam VT Multi-Asset Absolute Return Fund
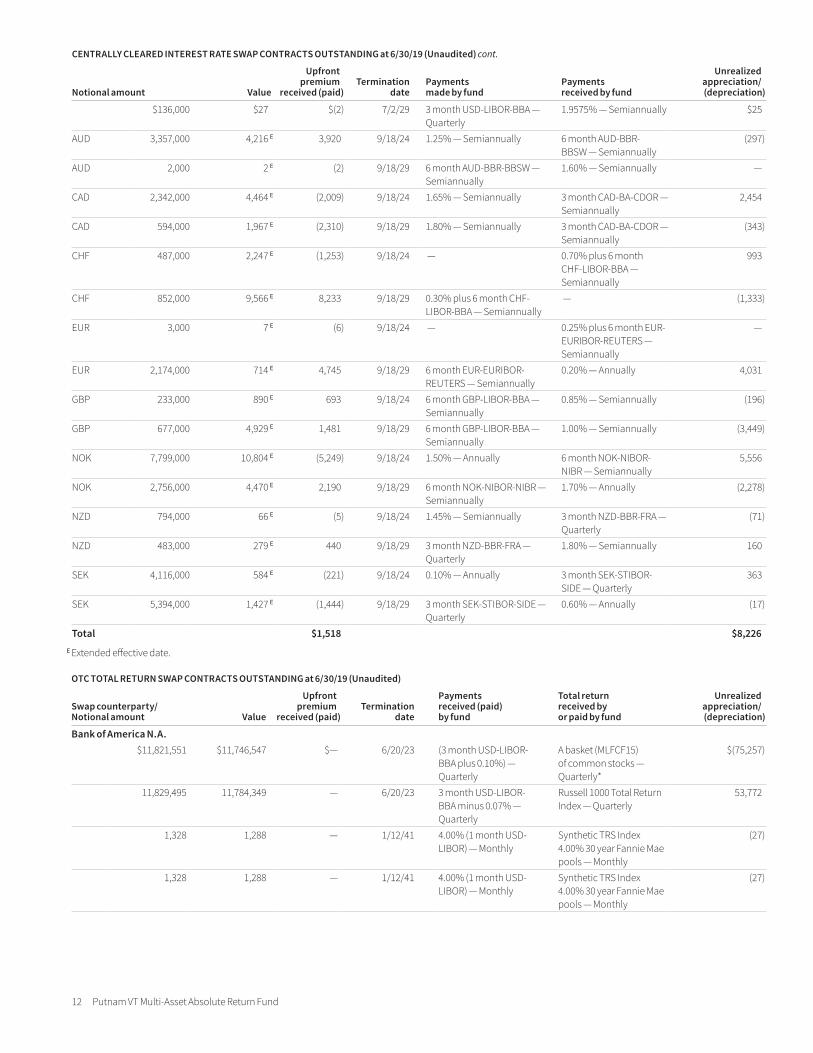
CENTRALLY CLEARED INTEREST RATE SWAP CONTRACTS OUTSTANDING at 6/30/19 (Unaudited) cont.
Notional amount Value
Upfront premium
received (paid)Termination
datePayments made by fund
Payments received by fund
Unrealized appreciation/ (depreciation)
$136,000 $27 $(2 ) 7/2/29 3 month USD-LIBOR-BBA — Quarterly
1.9575% — Semiannually $25
AUD 3,357,000 4,216 E 3,920 9/18/24 1.25% — Semiannually 6 month AUD-BBR-BBSW — Semiannually
(297 )
AUD 2,000 2 E (2 ) 9/18/29 6 month AUD-BBR-BBSW — Semiannually
1.60% — Semiannually —
CAD 2,342,000 4,464 E (2,009 ) 9/18/24 1.65% — Semiannually 3 month CAD-BA-CDOR — Semiannually
2,454
CAD 594,000 1,967 E (2,310 ) 9/18/29 1.80% — Semiannually 3 month CAD-BA-CDOR — Semiannually
(343 )
CHF 487,000 2,247 E (1,253 ) 9/18/24 — 0.70% plus 6 month CHF-LIBOR-BBA — Semiannually
993
CHF 852,000 9,566 E 8,233 9/18/29 0.30% plus 6 month CHF-LIBOR-BBA — Semiannually
— (1,333 )
EUR 3,000 7 E (6 ) 9/18/24 — 0.25% plus 6 month EUR-EURIBOR-REUTERS — Semiannually
—
EUR 2,174,000 714 E 4,745 9/18/29 6 month EUR-EURIBOR-REUTERS — Semiannually
0.20% — Annually 4,031
GBP 233,000 890 E 693 9/18/24 6 month GBP-LIBOR-BBA — Semiannually
0.85% — Semiannually (196 )
GBP 677,000 4,929 E 1,481 9/18/29 6 month GBP-LIBOR-BBA — Semiannually
1.00% — Semiannually (3,449 )
NOK 7,799,000 10,804 E (5,249 ) 9/18/24 1.50% — Annually 6 month NOK-NIBOR-NIBR — Semiannually
5,556
NOK 2,756,000 4,470 E 2,190 9/18/29 6 month NOK-NIBOR-NIBR — Semiannually
1.70% — Annually (2,278 )
NZD 794,000 66 E (5 ) 9/18/24 1.45% — Semiannually 3 month NZD-BBR-FRA — Quarterly
(71 )
NZD 483,000 279 E 440 9/18/29 3 month NZD-BBR-FRA — Quarterly
1.80% — Semiannually 160
SEK 4,116,000 584 E (221 ) 9/18/24 0.10% — Annually 3 month SEK-STIBOR-SIDE — Quarterly
363
SEK 5,394,000 1,427 E (1,444 ) 9/18/29 3 month SEK-STIBOR-SIDE — Quarterly
0.60% — Annually (17 )
Total $1,518 $8,226
E Extended effective date.
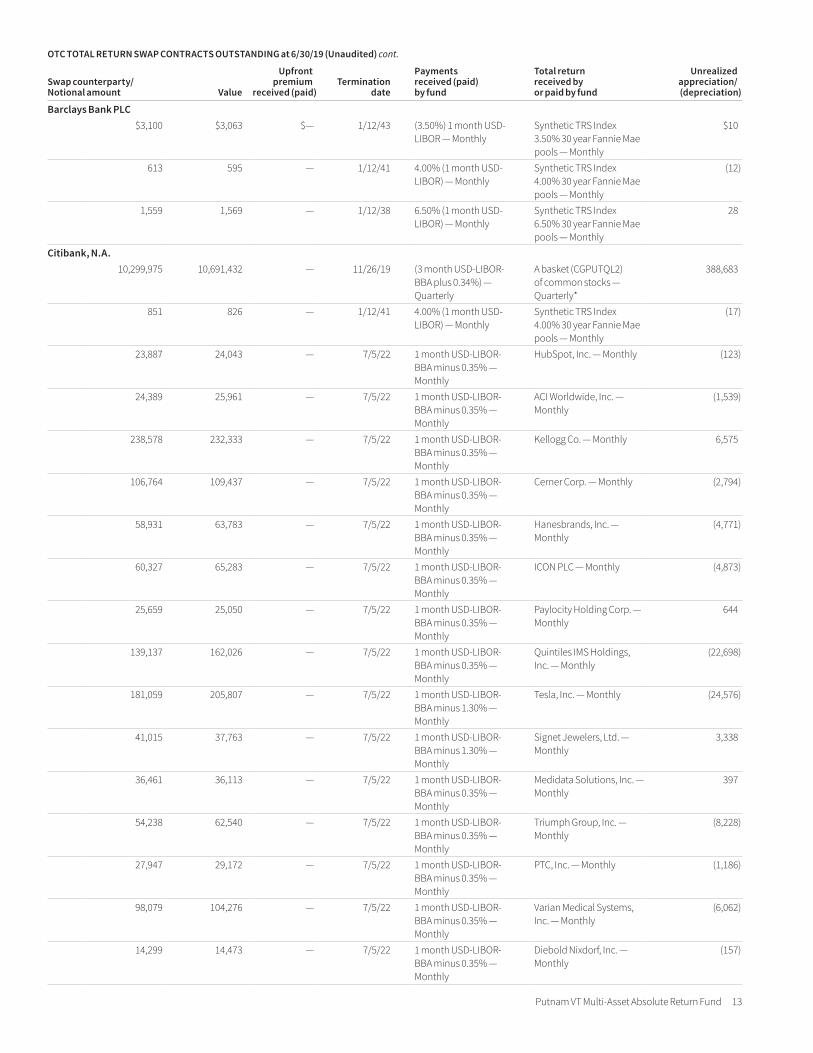
OTC TOTAL RETURN SWAP CONTRACTS OUTSTANDING at 6/30/19 (Unaudited)
Swap counterparty/ Notional amount Value
Upfront premium
received (paid)Termination
date
Payments received (paid) by fund
Total return received by or paid by fund
Unrealized appreciation/ (depreciation)
Bank of America N.A.$11,821,551 $11,746,547 $— 6/20/23 (3 month USD-LIBOR-
BBA plus 0.10%) — Quarterly
A basket (MLFCF15 ) of common stocks — Quarterly*
$(75,257 )
11,829,495 11,784,349 — 6/20/23 3 month USD-LIBOR-BBA minus 0.07% — Quarterly
Russell 1000 Total Return Index — Quarterly
53,772
1,328 1,288 — 1/12/41 4.00% (1 month USD-LIBOR) — Monthly
Synthetic TRS Index 4.00% 30 year Fannie Mae pools — Monthly
(27 )
1,328 1,288 — 1/12/41 4.00% (1 month USD-LIBOR) — Monthly
Synthetic TRS Index 4.00% 30 year Fannie Mae pools — Monthly
(27 )
Putnam VT Multi-Asset Absolute Return Fund 13
OTC TOTAL RETURN SWAP CONTRACTS OUTSTANDING at 6/30/19 (Unaudited) cont.
Swap counterparty/ Notional amount Value
Upfront premium
received (paid)Termination
date
Payments received (paid) by fund
Total return received by or paid by fund
Unrealized appreciation/ (depreciation)
Barclays Bank PLC$3,100 $3,063 $— 1/12/43 (3.50%) 1 month USD-
LIBOR — MonthlySynthetic TRS Index 3.50% 30 year Fannie Mae pools — Monthly
$10
613 595 — 1/12/41 4.00% (1 month USD-LIBOR) — Monthly
Synthetic TRS Index 4.00% 30 year Fannie Mae pools — Monthly
(12 )
1,559 1,569 — 1/12/38 6.50% (1 month USD-LIBOR) — Monthly
Synthetic TRS Index 6.50% 30 year Fannie Mae pools — Monthly
28
Citibank, N.A.10,299,975 10,691,432 — 11/26/19 (3 month USD-LIBOR-
BBA plus 0.34%) — Quarterly
A basket (CGPUTQL2 ) of common stocks — Quarterly*
388,683
851 826 — 1/12/41 4.00% (1 month USD-LIBOR) — Monthly
Synthetic TRS Index 4.00% 30 year Fannie Mae pools — Monthly
(17 )
23,887 24,043 — 7/5/22 1 month USD-LIBOR-BBA minus 0.35% — Monthly
HubSpot, Inc. — Monthly (123 )
24,389 25,961 — 7/5/22 1 month USD-LIBOR-BBA minus 0.35% — Monthly
ACI Worldwide, Inc. — Monthly
(1,539 )
238,578 232,333 — 7/5/22 1 month USD-LIBOR-BBA minus 0.35% — Monthly
Kellogg Co. — Monthly 6,575
106,764 109,437 — 7/5/22 1 month USD-LIBOR-BBA minus 0.35% — Monthly
Cerner Corp. — Monthly (2,794 )
58,931 63,783 — 7/5/22 1 month USD-LIBOR-BBA minus 0.35% — Monthly
Hanesbrands, Inc. — Monthly
(4,771 )
60,327 65,283 — 7/5/22 1 month USD-LIBOR-BBA minus 0.35% — Monthly
ICON PLC — Monthly (4,873 )
25,659 25,050 — 7/5/22 1 month USD-LIBOR-BBA minus 0.35% — Monthly
Paylocity Holding Corp. — Monthly
644
139,137 162,026 — 7/5/22 1 month USD-LIBOR-BBA minus 0.35% — Monthly
Quintiles IMS Holdings, Inc. — Monthly
(22,698 )
181,059 205,807 — 7/5/22 1 month USD-LIBOR-BBA minus 1.30% — Monthly
Tesla, Inc. — Monthly (24,576 )
41,015 37,763 — 7/5/22 1 month USD-LIBOR-BBA minus 1.30% — Monthly
Signet Jewelers, Ltd. — Monthly
3,338
36,461 36,113 — 7/5/22 1 month USD-LIBOR-BBA minus 0.35% — Monthly
Medidata Solutions, Inc. — Monthly
397
54,238 62,540 — 7/5/22 1 month USD-LIBOR-BBA minus 0.35% — Monthly
Triumph Group, Inc. — Monthly
(8,228 )
27,947 29,172 — 7/5/22 1 month USD-LIBOR-BBA minus 0.35% — Monthly
PTC, Inc. — Monthly (1,186 )
98,079 104,276 — 7/5/22 1 month USD-LIBOR-BBA minus 0.35% — Monthly
Varian Medical Systems, Inc. — Monthly
(6,062 )
14,299 14,473 — 7/5/22 1 month USD-LIBOR-BBA minus 0.35% — Monthly
Diebold Nixdorf, Inc. — Monthly
(157 )
14 Putnam VT Multi-Asset Absolute Return Fund
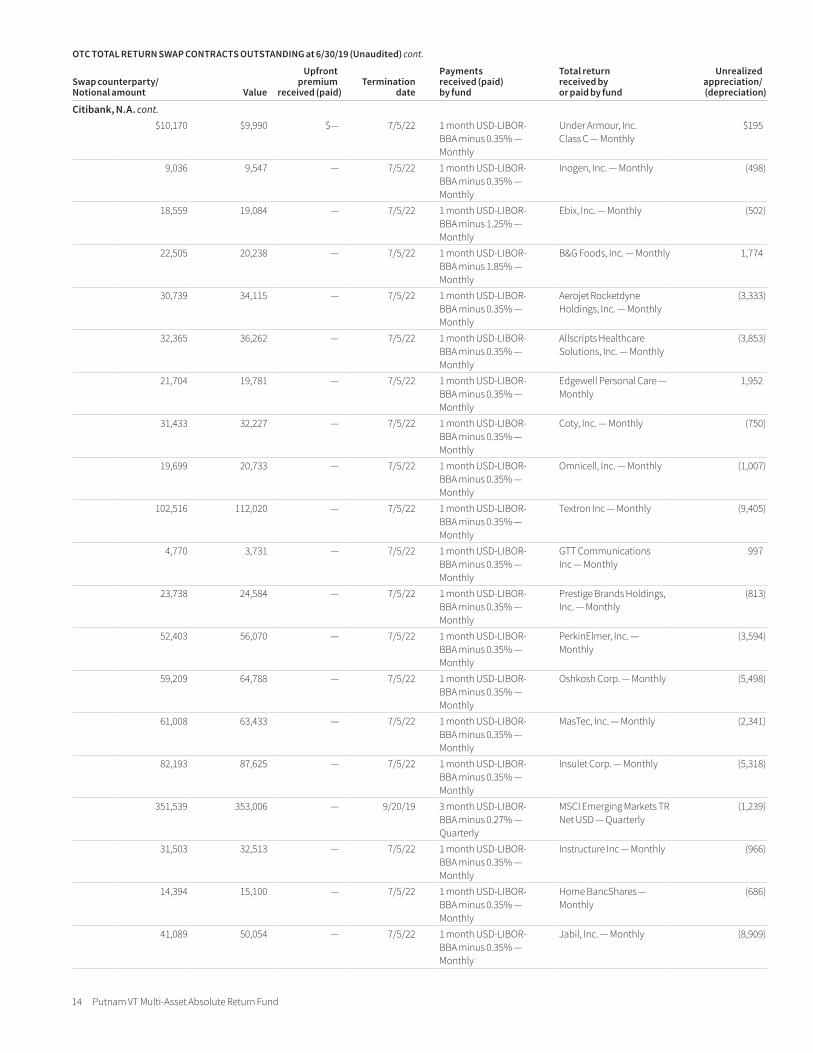
OTC TOTAL RETURN SWAP CONTRACTS OUTSTANDING at 6/30/19 (Unaudited) cont.
Swap counterparty/ Notional amount Value
Upfront premium
received (paid)Termination
date
Payments received (paid) by fund
Total return received by or paid by fund
Unrealized appreciation/ (depreciation)
Citibank, N.A. cont.$10,170 $9,990 $— 7/5/22 1 month USD-LIBOR-
BBA minus 0.35% — Monthly
Under Armour, Inc. Class C — Monthly
$195
9,036 9,547 — 7/5/22 1 month USD-LIBOR-BBA minus 0.35% — Monthly
Inogen, Inc. — Monthly (498 )
18,559 19,084 — 7/5/22 1 month USD-LIBOR-BBA minus 1.25% — Monthly
Ebix, Inc. — Monthly (502 )
22,505 20,238 — 7/5/22 1 month USD-LIBOR-BBA minus 1.85% — Monthly
B&G Foods, Inc. — Monthly 1,774
30,739 34,115 — 7/5/22 1 month USD-LIBOR-BBA minus 0.35% — Monthly
Aerojet Rocketdyne Holdings, Inc. — Monthly
(3,333 )
32,365 36,262 — 7/5/22 1 month USD-LIBOR-BBA minus 0.35% — Monthly
Allscripts Healthcare Solutions, Inc. — Monthly
(3,853 )
21,704 19,781 — 7/5/22 1 month USD-LIBOR-BBA minus 0.35% — Monthly
Edgewell Personal Care — Monthly
1,952
31,433 32,227 — 7/5/22 1 month USD-LIBOR-BBA minus 0.35% — Monthly
Coty, Inc. — Monthly (750 )
19,699 20,733 — 7/5/22 1 month USD-LIBOR-BBA minus 0.35% — Monthly
Omnicell, Inc. — Monthly (1,007 )
102,516 112,020 — 7/5/22 1 month USD-LIBOR-BBA minus 0.35% — Monthly
Textron Inc — Monthly (9,405 )
4,770 3,731 — 7/5/22 1 month USD-LIBOR-BBA minus 0.35% — Monthly
GTT Communications Inc — Monthly
997
23,738 24,584 — 7/5/22 1 month USD-LIBOR-BBA minus 0.35% — Monthly
Prestige Brands Holdings, Inc. — Monthly
(813 )
52,403 56,070 — 7/5/22 1 month USD-LIBOR-BBA minus 0.35% — Monthly
PerkinElmer, Inc. — Monthly
(3,594 )
59,209 64,788 — 7/5/22 1 month USD-LIBOR-BBA minus 0.35% — Monthly
Oshkosh Corp. — Monthly (5,498 )
61,008 63,433 — 7/5/22 1 month USD-LIBOR-BBA minus 0.35% — Monthly
MasTec, Inc. — Monthly (2,341 )
82,193 87,625 — 7/5/22 1 month USD-LIBOR-BBA minus 0.35% — Monthly
Insulet Corp. — Monthly (5,318 )
351,539 353,006 — 9/20/19 3 month USD-LIBOR-BBA minus 0.27% — Quarterly
MSCI Emerging Markets TR Net USD — Quarterly
(1,239 )
31,503 32,513 — 7/5/22 1 month USD-LIBOR-BBA minus 0.35% — Monthly
Instructure Inc — Monthly (966 )
14,394 15,100 — 7/5/22 1 month USD-LIBOR-BBA minus 0.35% — Monthly
Home BancShares — Monthly
(686 )
41,089 50,054 — 7/5/22 1 month USD-LIBOR-BBA minus 0.35% — Monthly
Jabil, Inc. — Monthly (8,909 )
Putnam VT Multi-Asset Absolute Return Fund 15
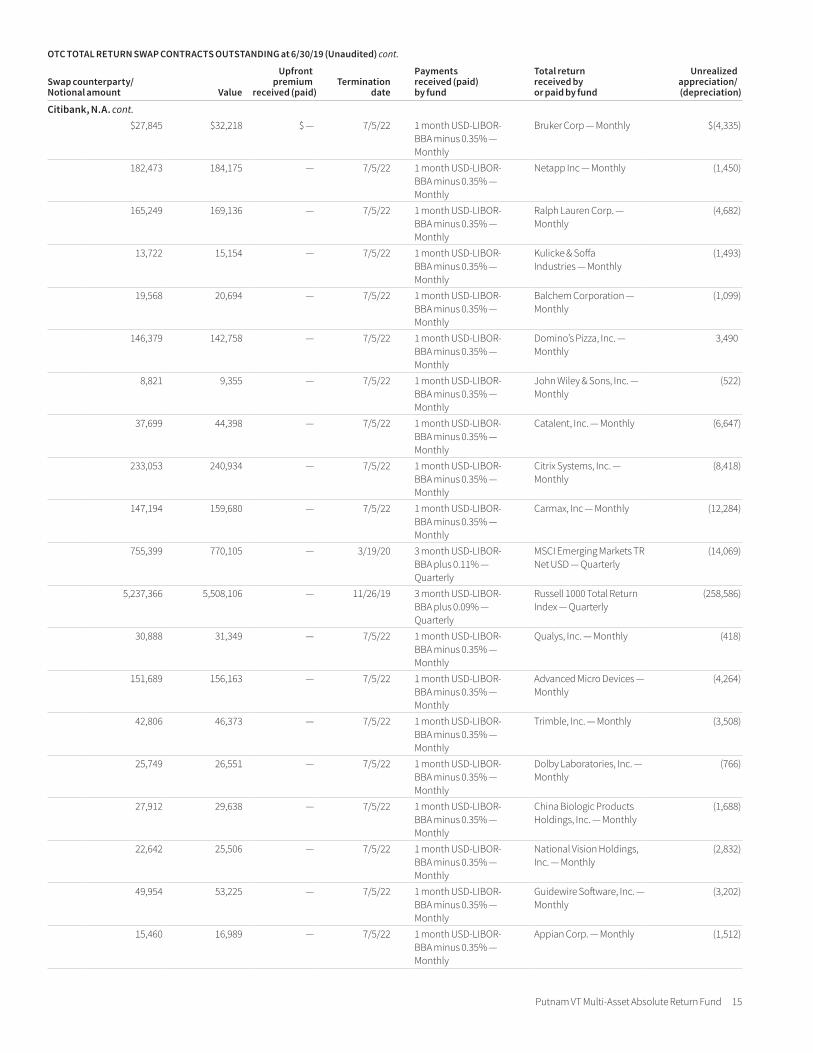
OTC TOTAL RETURN SWAP CONTRACTS OUTSTANDING at 6/30/19 (Unaudited) cont.
Swap counterparty/ Notional amount Value
Upfront premium
received (paid)Termination
date
Payments received (paid) by fund
Total return received by or paid by fund
Unrealized appreciation/ (depreciation)
Citibank, N.A. cont.$27,845 $32,218 $ — 7/5/22 1 month USD-LIBOR-
BBA minus 0.35% — Monthly
Bruker Corp — Monthly $(4,335 )
182,473 184,175 — 7/5/22 1 month USD-LIBOR-BBA minus 0.35% — Monthly
Netapp Inc — Monthly (1,450 )
165,249 169,136 — 7/5/22 1 month USD-LIBOR-BBA minus 0.35% — Monthly
Ralph Lauren Corp. — Monthly
(4,682 )
13,722 15,154 — 7/5/22 1 month USD-LIBOR-BBA minus 0.35% — Monthly
Kulicke & Soffa Industries — Monthly
(1,493 )
19,568 20,694 — 7/5/22 1 month USD-LIBOR-BBA minus 0.35% — Monthly
Balchem Corporation — Monthly
(1,099 )
146,379 142,758 — 7/5/22 1 month USD-LIBOR-BBA minus 0.35% — Monthly
Domino’s Pizza, Inc. — Monthly
3,490
8,821 9,355 — 7/5/22 1 month USD-LIBOR-BBA minus 0.35% — Monthly
John Wiley & Sons, Inc. — Monthly
(522 )
37,699 44,398 — 7/5/22 1 month USD-LIBOR-BBA minus 0.35% — Monthly
Catalent, Inc. — Monthly (6,647 )
233,053 240,934 — 7/5/22 1 month USD-LIBOR-BBA minus 0.35% — Monthly
Citrix Systems, Inc. — Monthly
(8,418 )
147,194 159,680 — 7/5/22 1 month USD-LIBOR-BBA minus 0.35% — Monthly
Carmax, Inc — Monthly (12,284 )
755,399 770,105 — 3/19/20 3 month USD-LIBOR-BBA plus 0.11% — Quarterly
MSCI Emerging Markets TR Net USD — Quarterly
(14,069 )
5,237,366 5,508,106 — 11/26/19 3 month USD-LIBOR-BBA plus 0.09% — Quarterly
Russell 1000 Total Return Index — Quarterly
(258,586 )
30,888 31,349 — 7/5/22 1 month USD-LIBOR-BBA minus 0.35% — Monthly
Qualys, Inc. — Monthly (418 )
151,689 156,163 — 7/5/22 1 month USD-LIBOR-BBA minus 0.35% — Monthly
Advanced Micro Devices — Monthly
(4,264 )
42,806 46,373 — 7/5/22 1 month USD-LIBOR-BBA minus 0.35% — Monthly
Trimble, Inc. — Monthly (3,508 )
25,749 26,551 — 7/5/22 1 month USD-LIBOR-BBA minus 0.35% — Monthly
Dolby Laboratories, Inc. — Monthly
(766 )
27,912 29,638 — 7/5/22 1 month USD-LIBOR-BBA minus 0.35% — Monthly
China Biologic Products Holdings, Inc. — Monthly
(1,688 )
22,642 25,506 — 7/5/22 1 month USD-LIBOR-BBA minus 0.35% — Monthly
National Vision Holdings, Inc. — Monthly
(2,832 )
49,954 53,225 — 7/5/22 1 month USD-LIBOR-BBA minus 0.35% — Monthly
Guidewire Software, Inc. — Monthly
(3,202 )
15,460 16,989 — 7/5/22 1 month USD-LIBOR-BBA minus 0.35% — Monthly
Appian Corp. — Monthly (1,512 )
16 Putnam VT Multi-Asset Absolute Return Fund
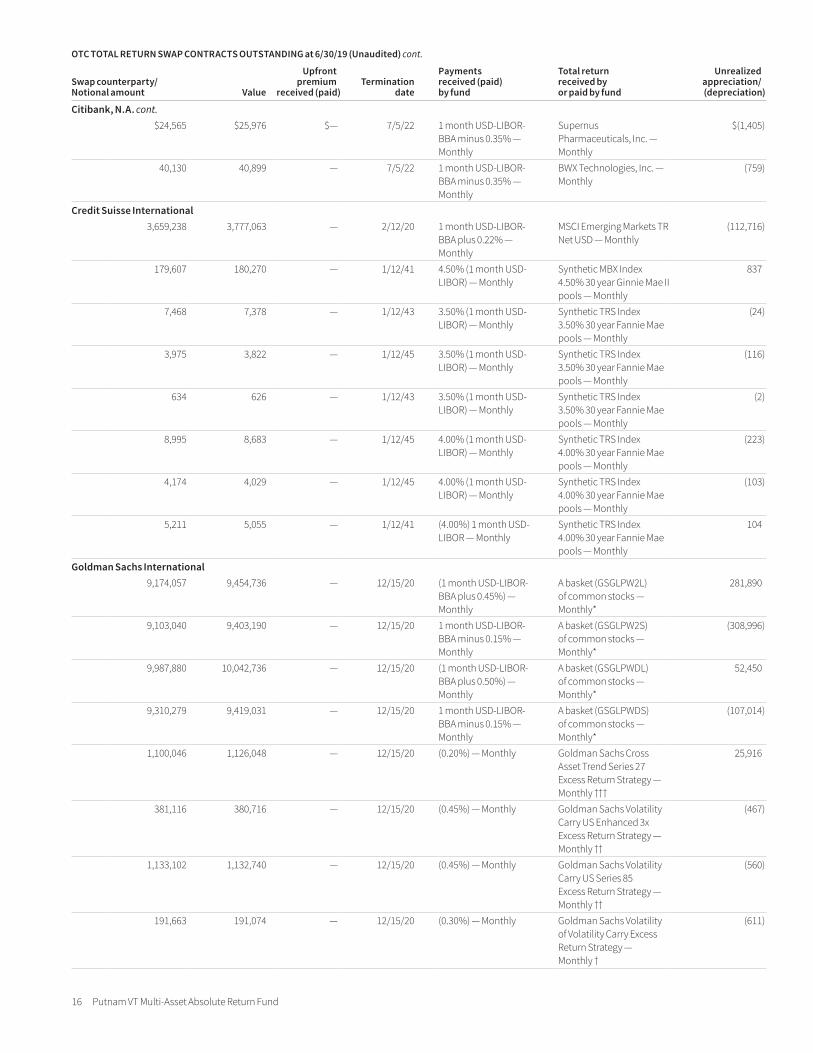
OTC TOTAL RETURN SWAP CONTRACTS OUTSTANDING at 6/30/19 (Unaudited) cont.
Swap counterparty/ Notional amount Value
Upfront premium
received (paid)Termination
date
Payments received (paid) by fund
Total return received by or paid by fund
Unrealized appreciation/ (depreciation)
Citibank, N.A. cont.$24,565 $25,976 $— 7/5/22 1 month USD-LIBOR-
BBA minus 0.35% — Monthly
Supernus Pharmaceuticals, Inc. — Monthly
$(1,405 )
40,130 40,899 — 7/5/22 1 month USD-LIBOR-BBA minus 0.35% — Monthly
BWX Technologies, Inc. — Monthly
(759 )
Credit Suisse International3,659,238 3,777,063 — 2/12/20 1 month USD-LIBOR-
BBA plus 0.22% — Monthly
MSCI Emerging Markets TR Net USD — Monthly
(112,716 )
179,607 180,270 — 1/12/41 4.50% (1 month USD-LIBOR) — Monthly
Synthetic MBX Index 4.50% 30 year Ginnie Mae II pools — Monthly
837
7,468 7,378 — 1/12/43 3.50% (1 month USD-LIBOR) — Monthly
Synthetic TRS Index 3.50% 30 year Fannie Mae pools — Monthly
(24 )
3,975 3,822 — 1/12/45 3.50% (1 month USD-LIBOR) — Monthly
Synthetic TRS Index 3.50% 30 year Fannie Mae pools — Monthly
(116 )
634 626 — 1/12/43 3.50% (1 month USD-LIBOR) — Monthly
Synthetic TRS Index 3.50% 30 year Fannie Mae pools — Monthly
(2 )
8,995 8,683 — 1/12/45 4.00% (1 month USD-LIBOR) — Monthly
Synthetic TRS Index 4.00% 30 year Fannie Mae pools — Monthly
(223 )
4,174 4,029 — 1/12/45 4.00% (1 month USD-LIBOR) — Monthly
Synthetic TRS Index 4.00% 30 year Fannie Mae pools — Monthly
(103 )
5,211 5,055 — 1/12/41 (4.00%) 1 month USD-LIBOR — Monthly
Synthetic TRS Index 4.00% 30 year Fannie Mae pools — Monthly
104
Goldman Sachs International9,174,057 9,454,736 — 12/15/20 (1 month USD-LIBOR-
BBA plus 0.45%) — Monthly
A basket (GSGLPW2L) of common stocks — Monthly*
281,890
9,103,040 9,403,190 — 12/15/20 1 month USD-LIBOR-BBA minus 0.15% — Monthly
A basket (GSGLPW2S) of common stocks — Monthly*
(308,996 )
9,987,880 10,042,736 — 12/15/20 (1 month USD-LIBOR-BBA plus 0.50%) — Monthly
A basket (GSGLPWDL) of common stocks — Monthly*
52,450
9,310,279 9,419,031 — 12/15/20 1 month USD-LIBOR-BBA minus 0.15% — Monthly
A basket (GSGLPWDS) of common stocks — Monthly*
(107,014 )
1,100,046 1,126,048 — 12/15/20 (0.20%) — Monthly Goldman Sachs Cross Asset Trend Series 27 Excess Return Strategy — Monthly †††
25,916
381,116 380,716 — 12/15/20 (0.45%) — Monthly Goldman Sachs Volatility Carry US Enhanced 3x Excess Return Strategy — Monthly ††
(467 )
1,133,102 1,132,740 — 12/15/20 (0.45%) — Monthly Goldman Sachs Volatility Carry US Series 85 Excess Return Strategy — Monthly ††
(560 )
191,663 191,074 — 12/15/20 (0.30%) — Monthly Goldman Sachs Volatility of Volatility Carry Excess Return Strategy — Monthly †
(611 )
Putnam VT Multi-Asset Absolute Return Fund 17
OTC TOTAL RETURN SWAP CONTRACTS OUTSTANDING at 6/30/19 (Unaudited) cont.
Swap counterparty/ Notional amount Value
Upfront premium
received (paid)Termination
date
Payments received (paid) by fund
Total return received by or paid by fund
Unrealized appreciation/ (depreciation)
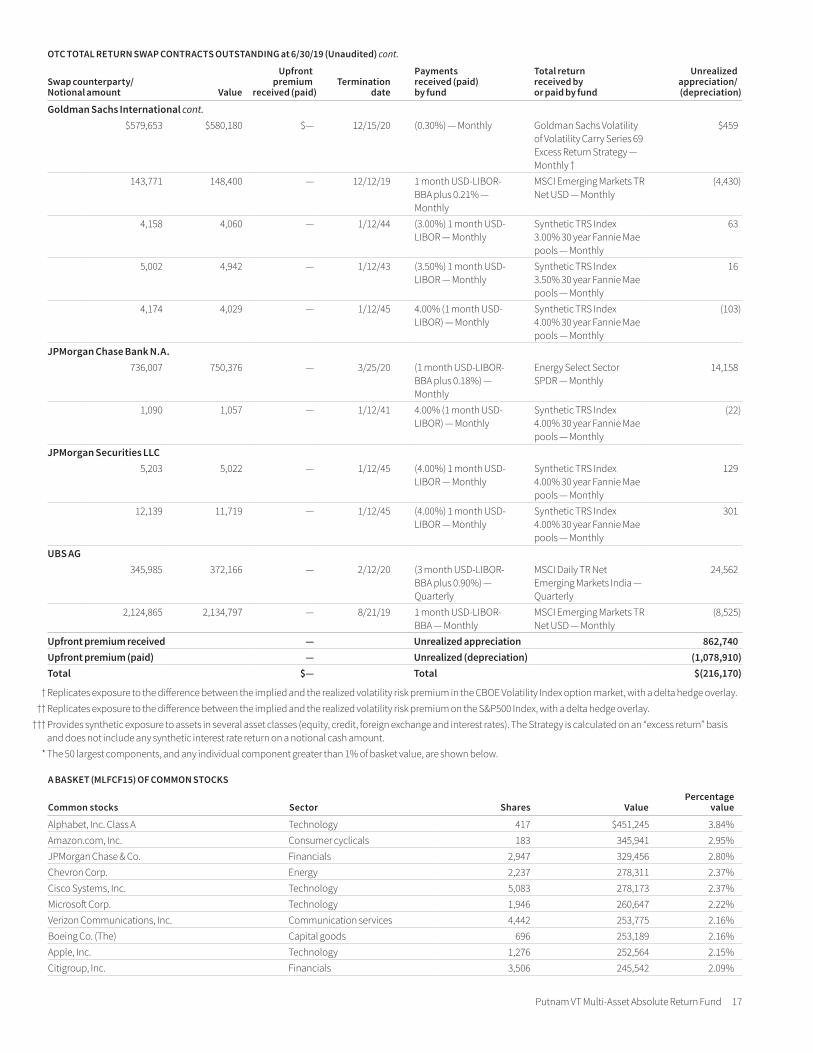
Goldman Sachs International cont.$579,653 $580,180 $— 12/15/20 (0.30%) — Monthly Goldman Sachs Volatility
of Volatility Carry Series 69 Excess Return Strategy — Monthly †
$459
143,771 148,400 — 12/12/19 1 month USD-LIBOR-BBA plus 0.21% — Monthly
MSCI Emerging Markets TR Net USD — Monthly
(4,430 )
4,158 4,060 — 1/12/44 (3.00%) 1 month USD-LIBOR — Monthly
Synthetic TRS Index 3.00% 30 year Fannie Mae pools — Monthly
63
5,002 4,942 — 1/12/43 (3.50%) 1 month USD-LIBOR — Monthly
Synthetic TRS Index 3.50% 30 year Fannie Mae pools — Monthly
16
4,174 4,029 — 1/12/45 4.00% (1 month USD-LIBOR) — Monthly
Synthetic TRS Index 4.00% 30 year Fannie Mae pools — Monthly
(103 )
JPMorgan Chase Bank N.A.736,007 750,376 — 3/25/20 (1 month USD-LIBOR-
BBA plus 0.18%) — Monthly
Energy Select Sector SPDR — Monthly
14,158
1,090 1,057 — 1/12/41 4.00% (1 month USD-LIBOR) — Monthly
Synthetic TRS Index 4.00% 30 year Fannie Mae pools — Monthly
(22 )
JPMorgan Securities LLC5,203 5,022 — 1/12/45 (4.00%) 1 month USD-
LIBOR — MonthlySynthetic TRS Index 4.00% 30 year Fannie Mae pools — Monthly
129
12,139 11,719 — 1/12/45 (4.00%) 1 month USD-LIBOR — Monthly
Synthetic TRS Index 4.00% 30 year Fannie Mae pools — Monthly
301
UBS AG345,985 372,166 — 2/12/20 (3 month USD-LIBOR-
BBA plus 0.90%) — Quarterly
MSCI Daily TR Net Emerging Markets India — Quarterly
24,562
2,124,865 2,134,797 — 8/21/19 1 month USD-LIBOR-BBA — Monthly
MSCI Emerging Markets TR Net USD — Monthly
(8,525 )
Upfront premium received — Unrealized appreciation 862,740Upfront premium (paid) — Unrealized (depreciation) (1,078,910 )Total $— Total $(216,170 )
† Replicates exposure to the difference between the implied and the realized volatility risk premium in the CBOE Volatility Index option market, with a delta hedge overlay. †† Replicates exposure to the difference between the implied and the realized volatility risk premium on the S&P500 Index, with a delta hedge overlay. ††† Provides synthetic exposure to assets in several asset classes (equity, credit, foreign exchange and interest rates). The Strategy is calculated on an “excess return” basis
and does not include any synthetic interest rate return on a notional cash amount. * The 50 largest components, and any individual component greater than 1% of basket value, are shown below.
A BASKET (MLFCF15 ) OF COMMON STOCKS
Common stocks Sector Shares ValuePercentage
value
Alphabet, Inc. Class A Technology 417 $451,245 3.84%Amazon.com, Inc. Consumer cyclicals 183 345,941 2.95%JPMorgan Chase & Co. Financials 2,947 329,456 2.80%Chevron Corp. Energy 2,237 278,311 2.37%Cisco Systems, Inc. Technology 5,083 278,173 2.37%Microsoft Corp. Technology 1,946 260,647 2.22%Verizon Communications, Inc. Communication services 4,442 253,775 2.16%Boeing Co. (The) Capital goods 696 253,189 2.16%Apple, Inc. Technology 1,276 252,564 2.15%Citigroup, Inc. Financials 3,506 245,542 2.09%
18 Putnam VT Multi-Asset Absolute Return Fund
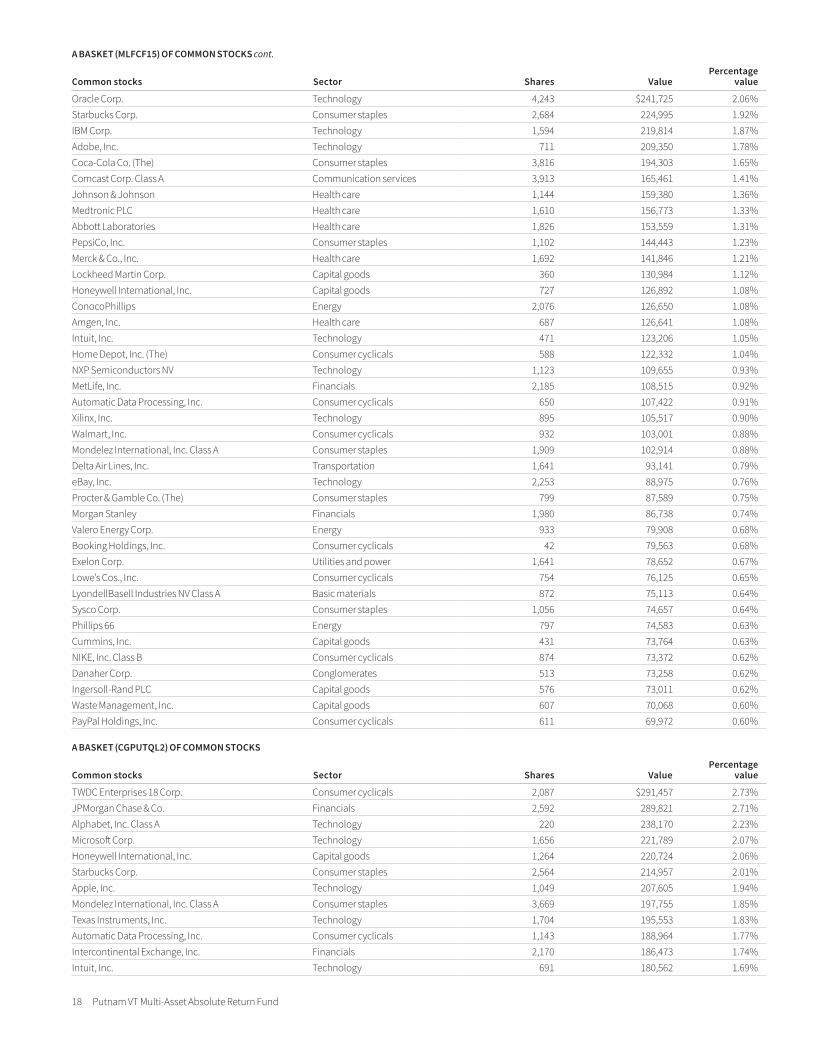
A BASKET (MLFCF15 ) OF COMMON STOCKS cont.
Common stocks Sector Shares ValuePercentage
value
Oracle Corp. Technology 4,243 $241,725 2.06%Starbucks Corp. Consumer staples 2,684 224,995 1.92%IBM Corp. Technology 1,594 219,814 1.87%Adobe, Inc. Technology 711 209,350 1.78%Coca-Cola Co. (The) Consumer staples 3,816 194,303 1.65%Comcast Corp. Class A Communication services 3,913 165,461 1.41%Johnson & Johnson Health care 1,144 159,380 1.36%Medtronic PLC Health care 1,610 156,773 1.33%Abbott Laboratories Health care 1,826 153,559 1.31%PepsiCo, Inc. Consumer staples 1,102 144,443 1.23%Merck & Co., Inc. Health care 1,692 141,846 1.21%Lockheed Martin Corp. Capital goods 360 130,984 1.12%Honeywell International, Inc. Capital goods 727 126,892 1.08%ConocoPhillips Energy 2,076 126,650 1.08%Amgen, Inc. Health care 687 126,641 1.08%Intuit, Inc. Technology 471 123,206 1.05%Home Depot, Inc. (The) Consumer cyclicals 588 122,332 1.04%NXP Semiconductors NV Technology 1,123 109,655 0.93%MetLife, Inc. Financials 2,185 108,515 0.92%Automatic Data Processing, Inc. Consumer cyclicals 650 107,422 0.91%Xilinx, Inc. Technology 895 105,517 0.90%Walmart, Inc. Consumer cyclicals 932 103,001 0.88%Mondelez International, Inc. Class A Consumer staples 1,909 102,914 0.88%Delta Air Lines, Inc. Transportation 1,641 93,141 0.79%eBay, Inc. Technology 2,253 88,975 0.76%Procter & Gamble Co. (The) Consumer staples 799 87,589 0.75%Morgan Stanley Financials 1,980 86,738 0.74%Valero Energy Corp. Energy 933 79,908 0.68%Booking Holdings, Inc. Consumer cyclicals 42 79,563 0.68%Exelon Corp. Utilities and power 1,641 78,652 0.67%Lowe’s Cos., Inc. Consumer cyclicals 754 76,125 0.65%LyondellBasell Industries NV Class A Basic materials 872 75,113 0.64%Sysco Corp. Consumer staples 1,056 74,657 0.64%Phillips 66 Energy 797 74,583 0.63%Cummins, Inc. Capital goods 431 73,764 0.63%NIKE, Inc. Class B Consumer cyclicals 874 73,372 0.62%Danaher Corp. Conglomerates 513 73,258 0.62%Ingersoll-Rand PLC Capital goods 576 73,011 0.62%Waste Management, Inc. Capital goods 607 70,068 0.60%PayPal Holdings, Inc. Consumer cyclicals 611 69,972 0.60%
A BASKET (CGPUTQL2 ) OF COMMON STOCKS
Common stocks Sector Shares ValuePercentage
value
TWDC Enterprises 18 Corp. Consumer cyclicals 2,087 $291,457 2.73%JPMorgan Chase & Co. Financials 2,592 289,821 2.71%Alphabet, Inc. Class A Technology 220 238,170 2.23%Microsoft Corp. Technology 1,656 221,789 2.07%Honeywell International, Inc. Capital goods 1,264 220,724 2.06%Starbucks Corp. Consumer staples 2,564 214,957 2.01%Apple, Inc. Technology 1,049 207,605 1.94%Mondelez International, Inc. Class A Consumer staples 3,669 197,755 1.85%Texas Instruments, Inc. Technology 1,704 195,553 1.83%Automatic Data Processing, Inc. Consumer cyclicals 1,143 188,964 1.77%Intercontinental Exchange, Inc. Financials 2,170 186,473 1.74%Intuit, Inc. Technology 691 180,562 1.69%

Putnam VT Multi-Asset Absolute Return Fund 19
A BASKET (CGPUTQL2 ) OF COMMON STOCKS cont.
Common stocks Sector Shares ValuePercentage
value
American Electric Power Co., Inc. Utilities and power 2,049 $180,365 1.69%TJX Cos., Inc. (The) Consumer cyclicals 3,407 180,143 1.68%Coca-Cola Co. (The) Consumer staples 3,497 178,043 1.67%Northrop Grumman Corp. Capital goods 549 177,526 1.66%U.S. Bancorp Financials 3,346 175,308 1.64%Raytheon Co. Capital goods 966 167,925 1.57%Exelon Corp. Utilities and power 3,476 166,660 1.56%Fidelity National Information Services, Inc. Technology 1,353 166,005 1.55%AutoZone, Inc. Consumer cyclicals 147 161,998 1.52%Exxon Mobil Corp. Energy 2,022 154,948 1.45%Waste Management, Inc. Capital goods 1,328 153,209 1.43%Sysco Corp. Consumer staples 2,130 150,649 1.41%Allstate Corp. (The) Financials 1,472 149,707 1.40%T-Mobile US, Inc. Communication services 1,960 145,350 1.36%Omnicom Group, Inc. Consumer cyclicals 1,762 144,426 1.35%Amazon.com, Inc. Consumer cyclicals 75 141,866 1.33%Johnson & Johnson Health care 1,017 141,589 1.32%Cognizant Technology Solutions Corp. Class A Technology 2,187 138,620 1.30%Humana, Inc. Health care 520 138,050 1.29%Cisco Systems, Inc. Technology 2,420 132,428 1.24%Norfolk Southern Corp. Transportation 624 124,417 1.16%Annaly Capital Management, Inc. Financials 13,366 122,032 1.14%Comerica, Inc. Financials 1,652 119,975 1.12%Verizon Communications, Inc. Communication services 2,038 116,436 1.09%Baxter International, Inc. Health care 1,400 114,639 1.07%Pfizer, Inc. Health care 2,645 114,585 1.07%Occidental Petroleum Corp. Energy 2,243 112,766 1.05%Centene Corp. Health care 2,145 112,458 1.05%Merck & Co., Inc. Health care 1,285 107,773 1.01%VICI Properties, Inc. Financials 4,842 106,724 1.00%Kinder Morgan, Inc. Utilities and power 4,987 104,123 0.97%Ross Stores, Inc. Consumer cyclicals 1,045 103,566 0.97%NXP Semiconductors NV Technology 1,011 98,665 0.92%Cadence Design Systems, Inc. Technology 1,373 97,238 0.91%F5 Networks, Inc. Technology 633 92,141 0.86%Procter & Gamble Co. (The) Consumer staples 833 91,349 0.85%Hershey Co. (The) Consumer staples 681 91,313 0.85%Garmin, Ltd. Technology 1,108 88,379 0.83%
A BASKET (GSGLPW2L) OF COMMON STOCKS
Common stocks Sector Shares ValuePercentage
value
Newcrest Mining, Ltd. (Australia) Basic materials 3,958 $88,738 0.94%Goodman Group (Australia) Financials 7,723 81,456 0.86%Telstra Corp., Ltd. (Australia) Communication services 29,630 80,051 0.85%Swiss Life Holding AG (Switzerland) Financials 157 78,117 0.83%Hoya Corp. (Japan) Technology 1,013 77,619 0.82%Hitachi, Ltd. (Japan) Capital goods 2,102 77,061 0.82%Rio Tinto PLC (United Kingdom) Basic materials 1,237 76,828 0.81%Shin-Etsu Chemical Co., Ltd. (Japan) Basic materials 816 75,989 0.80%BHP Billiton PLC (United Kingdom) Basic materials 2,949 75,619 0.80%Unilever PLC (United Kingdom) Consumer staples 1,196 74,486 0.79%Shinhan Financial Group Co., Ltd. (South Korea) Financials 1,901 73,918 0.78%Dassault Systemes SA (France) Technology 461 73,706 0.78%Partners Group Holding AG (Switzerland) Financials 93 73,242 0.77%Kansai Electric Power Co., Inc. (The) (Japan) Utilities and power 6,240 71,494 0.76%
20 Putnam VT Multi-Asset Absolute Return Fund
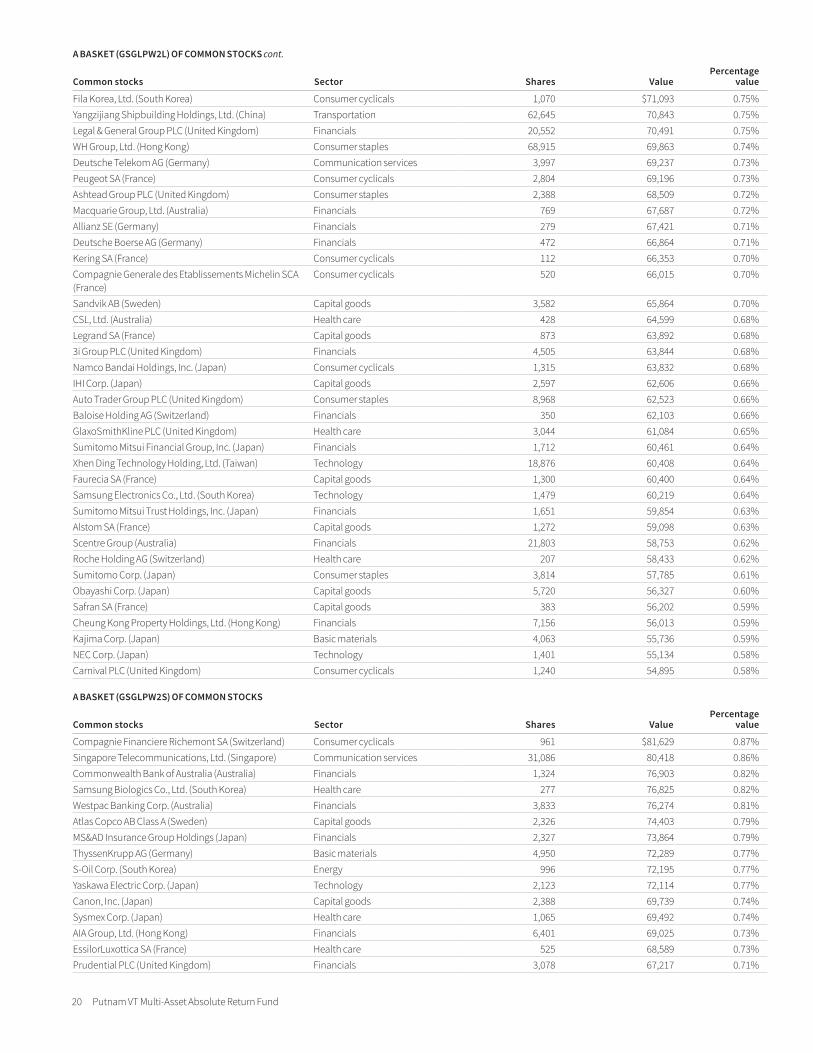
A BASKET (GSGLPW2L) OF COMMON STOCKS cont.
Common stocks Sector Shares ValuePercentage
value
Fila Korea, Ltd. (South Korea) Consumer cyclicals 1,070 $71,093 0.75%Yangzijiang Shipbuilding Holdings, Ltd. (China) Transportation 62,645 70,843 0.75%Legal & General Group PLC (United Kingdom) Financials 20,552 70,491 0.75%WH Group, Ltd. (Hong Kong) Consumer staples 68,915 69,863 0.74%Deutsche Telekom AG (Germany) Communication services 3,997 69,237 0.73%Peugeot SA (France) Consumer cyclicals 2,804 69,196 0.73%Ashtead Group PLC (United Kingdom) Consumer staples 2,388 68,509 0.72%Macquarie Group, Ltd. (Australia) Financials 769 67,687 0.72%Allianz SE (Germany) Financials 279 67,421 0.71%Deutsche Boerse AG (Germany) Financials 472 66,864 0.71%Kering SA (France) Consumer cyclicals 112 66,353 0.70%Compagnie Generale des Etablissements Michelin SCA (France)
Consumer cyclicals 520 66,015 0.70%
Sandvik AB (Sweden) Capital goods 3,582 65,864 0.70%CSL, Ltd. (Australia) Health care 428 64,599 0.68%Legrand SA (France) Capital goods 873 63,892 0.68%3i Group PLC (United Kingdom) Financials 4,505 63,844 0.68%Namco Bandai Holdings, Inc. (Japan) Consumer cyclicals 1,315 63,832 0.68%IHI Corp. (Japan) Capital goods 2,597 62,606 0.66%Auto Trader Group PLC (United Kingdom) Consumer staples 8,968 62,523 0.66%Baloise Holding AG (Switzerland) Financials 350 62,103 0.66%GlaxoSmithKline PLC (United Kingdom) Health care 3,044 61,084 0.65%Sumitomo Mitsui Financial Group, Inc. (Japan) Financials 1,712 60,461 0.64%Xhen Ding Technology Holding, Ltd. (Taiwan) Technology 18,876 60,408 0.64%Faurecia SA (France) Capital goods 1,300 60,400 0.64%Samsung Electronics Co., Ltd. (South Korea) Technology 1,479 60,219 0.64%Sumitomo Mitsui Trust Holdings, Inc. (Japan) Financials 1,651 59,854 0.63%Alstom SA (France) Capital goods 1,272 59,098 0.63%Scentre Group (Australia) Financials 21,803 58,753 0.62%Roche Holding AG (Switzerland) Health care 207 58,433 0.62%Sumitomo Corp. (Japan) Consumer staples 3,814 57,785 0.61%Obayashi Corp. (Japan) Capital goods 5,720 56,327 0.60%Safran SA (France) Capital goods 383 56,202 0.59%Cheung Kong Property Holdings, Ltd. (Hong Kong) Financials 7,156 56,013 0.59%Kajima Corp. (Japan) Basic materials 4,063 55,736 0.59%NEC Corp. (Japan) Technology 1,401 55,134 0.58%Carnival PLC (United Kingdom) Consumer cyclicals 1,240 54,895 0.58%
A BASKET (GSGLPW2S) OF COMMON STOCKS
Common stocks Sector Shares ValuePercentage
value
Compagnie Financiere Richemont SA (Switzerland) Consumer cyclicals 961 $81,629 0.87%Singapore Telecommunications, Ltd. (Singapore) Communication services 31,086 80,418 0.86%Commonwealth Bank of Australia (Australia) Financials 1,324 76,903 0.82%Samsung Biologics Co., Ltd. (South Korea) Health care 277 76,825 0.82%Westpac Banking Corp. (Australia) Financials 3,833 76,274 0.81%Atlas Copco AB Class A (Sweden) Capital goods 2,326 74,403 0.79%MS&AD Insurance Group Holdings (Japan) Financials 2,327 73,864 0.79%ThyssenKrupp AG (Germany) Basic materials 4,950 72,289 0.77%S-Oil Corp. (South Korea) Energy 996 72,195 0.77%Yaskawa Electric Corp. (Japan) Technology 2,123 72,114 0.77%Canon, Inc. (Japan) Capital goods 2,388 69,739 0.74%Sysmex Corp. (Japan) Health care 1,065 69,492 0.74%AIA Group, Ltd. (Hong Kong) Financials 6,401 69,025 0.73%EssilorLuxottica SA (France) Health care 525 68,589 0.73%Prudential PLC (United Kingdom) Financials 3,078 67,217 0.71%
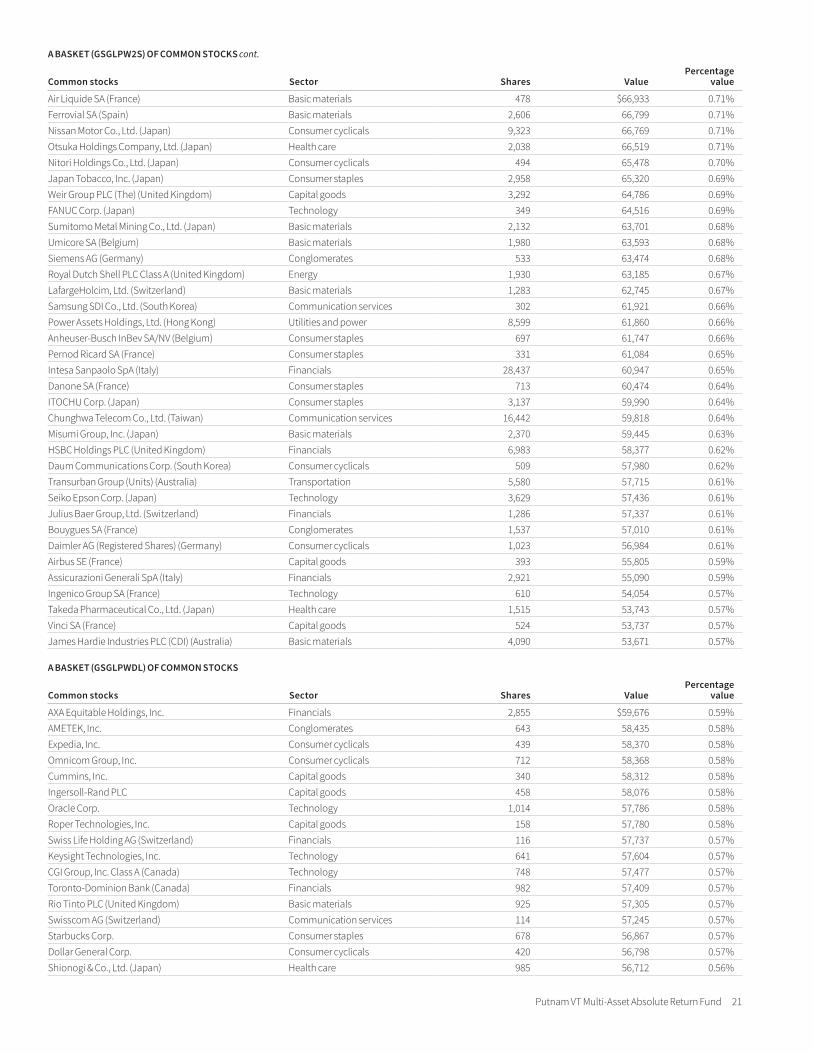
Putnam VT Multi-Asset Absolute Return Fund 21
A BASKET (GSGLPW2S) OF COMMON STOCKS cont.
Common stocks Sector Shares ValuePercentage
value
Air Liquide SA (France) Basic materials 478 $66,933 0.71%Ferrovial SA (Spain) Basic materials 2,606 66,799 0.71%Nissan Motor Co., Ltd. (Japan) Consumer cyclicals 9,323 66,769 0.71%Otsuka Holdings Company, Ltd. (Japan) Health care 2,038 66,519 0.71%Nitori Holdings Co., Ltd. (Japan) Consumer cyclicals 494 65,478 0.70%Japan Tobacco, Inc. (Japan) Consumer staples 2,958 65,320 0.69%Weir Group PLC (The) (United Kingdom) Capital goods 3,292 64,786 0.69%FANUC Corp. (Japan) Technology 349 64,516 0.69%Sumitomo Metal Mining Co., Ltd. (Japan) Basic materials 2,132 63,701 0.68%Umicore SA (Belgium) Basic materials 1,980 63,593 0.68%Siemens AG (Germany) Conglomerates 533 63,474 0.68%Royal Dutch Shell PLC Class A (United Kingdom) Energy 1,930 63,185 0.67%LafargeHolcim, Ltd. (Switzerland) Basic materials 1,283 62,745 0.67%Samsung SDI Co., Ltd. (South Korea) Communication services 302 61,921 0.66%Power Assets Holdings, Ltd. (Hong Kong) Utilities and power 8,599 61,860 0.66%Anheuser-Busch InBev SA/NV (Belgium) Consumer staples 697 61,747 0.66%Pernod Ricard SA (France) Consumer staples 331 61,084 0.65%Intesa Sanpaolo SpA (Italy) Financials 28,437 60,947 0.65%Danone SA (France) Consumer staples 713 60,474 0.64%ITOCHU Corp. (Japan) Consumer staples 3,137 59,990 0.64%Chunghwa Telecom Co., Ltd. (Taiwan) Communication services 16,442 59,818 0.64%Misumi Group, Inc. (Japan) Basic materials 2,370 59,445 0.63%HSBC Holdings PLC (United Kingdom) Financials 6,983 58,377 0.62%Daum Communications Corp. (South Korea) Consumer cyclicals 509 57,980 0.62%Transurban Group (Units) (Australia) Transportation 5,580 57,715 0.61%Seiko Epson Corp. (Japan) Technology 3,629 57,436 0.61%Julius Baer Group, Ltd. (Switzerland) Financials 1,286 57,337 0.61%Bouygues SA (France) Conglomerates 1,537 57,010 0.61%Daimler AG (Registered Shares) (Germany) Consumer cyclicals 1,023 56,984 0.61%Airbus SE (France) Capital goods 393 55,805 0.59%Assicurazioni Generali SpA (Italy) Financials 2,921 55,090 0.59%Ingenico Group SA (France) Technology 610 54,054 0.57%Takeda Pharmaceutical Co., Ltd. (Japan) Health care 1,515 53,743 0.57%Vinci SA (France) Capital goods 524 53,737 0.57%James Hardie Industries PLC (CDI) (Australia) Basic materials 4,090 53,671 0.57%
A BASKET (GSGLPWDL) OF COMMON STOCKS
Common stocks Sector Shares ValuePercentage
value
AXA Equitable Holdings, Inc. Financials 2,855 $59,676 0.59%AMETEK, Inc. Conglomerates 643 58,435 0.58%Expedia, Inc. Consumer cyclicals 439 58,370 0.58%Omnicom Group, Inc. Consumer cyclicals 712 58,368 0.58%Cummins, Inc. Capital goods 340 58,312 0.58%Ingersoll-Rand PLC Capital goods 458 58,076 0.58%Oracle Corp. Technology 1,014 57,786 0.58%Roper Technologies, Inc. Capital goods 158 57,780 0.58%Swiss Life Holding AG (Switzerland) Financials 116 57,737 0.57%Keysight Technologies, Inc. Technology 641 57,604 0.57%CGI Group, Inc. Class A (Canada) Technology 748 57,477 0.57%Toronto-Dominion Bank (Canada) Financials 982 57,409 0.57%Rio Tinto PLC (United Kingdom) Basic materials 925 57,305 0.57%Swisscom AG (Switzerland) Communication services 114 57,245 0.57%Starbucks Corp. Consumer staples 678 56,867 0.57%Dollar General Corp. Consumer cyclicals 420 56,798 0.57%Shionogi & Co., Ltd. (Japan) Health care 985 56,712 0.56%
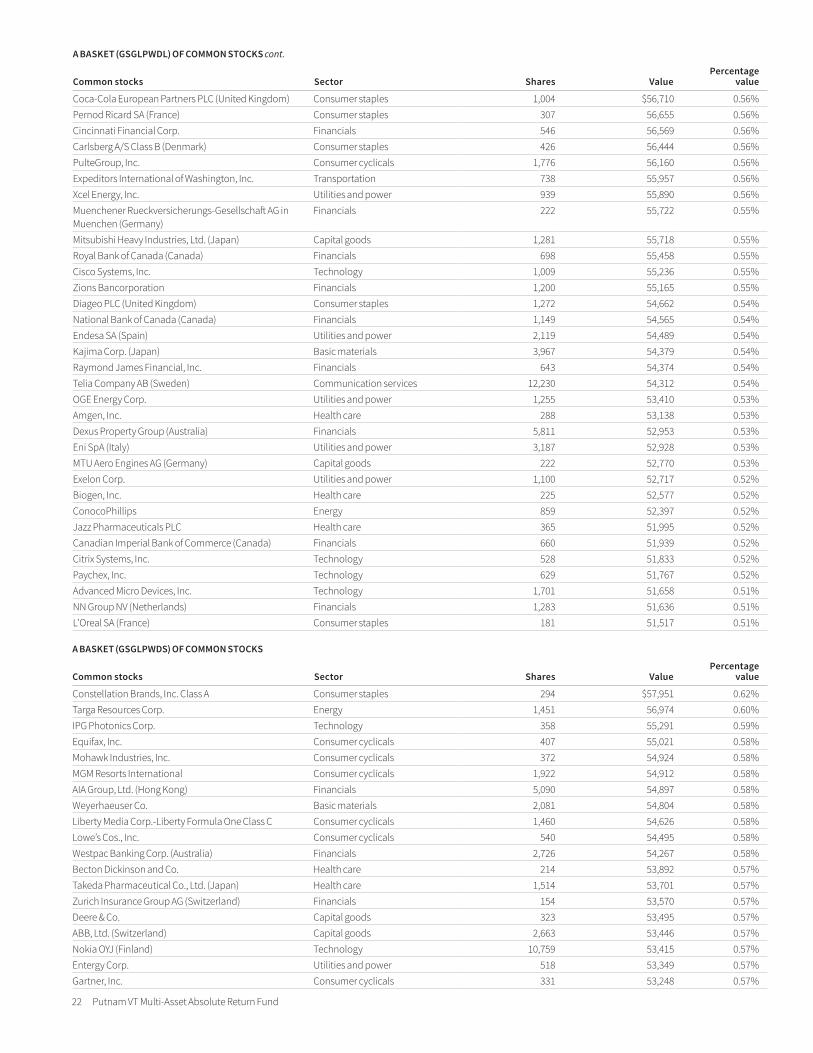
22 Putnam VT Multi-Asset Absolute Return Fund
A BASKET (GSGLPWDL) OF COMMON STOCKS cont.
Common stocks Sector Shares ValuePercentage
value
Coca-Cola European Partners PLC (United Kingdom) Consumer staples 1,004 $56,710 0.56%Pernod Ricard SA (France) Consumer staples 307 56,655 0.56%Cincinnati Financial Corp. Financials 546 56,569 0.56%Carlsberg A/S Class B (Denmark) Consumer staples 426 56,444 0.56%PulteGroup, Inc. Consumer cyclicals 1,776 56,160 0.56%Expeditors International of Washington, Inc. Transportation 738 55,957 0.56%Xcel Energy, Inc. Utilities and power 939 55,890 0.56%Muenchener Rueckversicherungs-Gesellschaft AG in Muenchen (Germany)
Financials 222 55,722 0.55%
Mitsubishi Heavy Industries, Ltd. (Japan) Capital goods 1,281 55,718 0.55%Royal Bank of Canada (Canada) Financials 698 55,458 0.55%Cisco Systems, Inc. Technology 1,009 55,236 0.55%Zions Bancorporation Financials 1,200 55,165 0.55%Diageo PLC (United Kingdom) Consumer staples 1,272 54,662 0.54%National Bank of Canada (Canada) Financials 1,149 54,565 0.54%Endesa SA (Spain) Utilities and power 2,119 54,489 0.54%Kajima Corp. (Japan) Basic materials 3,967 54,379 0.54%Raymond James Financial, Inc. Financials 643 54,374 0.54%Telia Company AB (Sweden) Communication services 12,230 54,312 0.54%OGE Energy Corp. Utilities and power 1,255 53,410 0.53%Amgen, Inc. Health care 288 53,138 0.53%Dexus Property Group (Australia) Financials 5,811 52,953 0.53%Eni SpA (Italy) Utilities and power 3,187 52,928 0.53%MTU Aero Engines AG (Germany) Capital goods 222 52,770 0.53%Exelon Corp. Utilities and power 1,100 52,717 0.52%Biogen, Inc. Health care 225 52,577 0.52%ConocoPhillips Energy 859 52,397 0.52%Jazz Pharmaceuticals PLC Health care 365 51,995 0.52%Canadian Imperial Bank of Commerce (Canada) Financials 660 51,939 0.52%Citrix Systems, Inc. Technology 528 51,833 0.52%Paychex, Inc. Technology 629 51,767 0.52%Advanced Micro Devices, Inc. Technology 1,701 51,658 0.51%NN Group NV (Netherlands) Financials 1,283 51,636 0.51%L’Oreal SA (France) Consumer staples 181 51,517 0.51%
A BASKET (GSGLPWDS) OF COMMON STOCKS
Common stocks Sector Shares ValuePercentage
value
Constellation Brands, Inc. Class A Consumer staples 294 $57,951 0.62%Targa Resources Corp. Energy 1,451 56,974 0.60%IPG Photonics Corp. Technology 358 55,291 0.59%Equifax, Inc. Consumer cyclicals 407 55,021 0.58%Mohawk Industries, Inc. Consumer cyclicals 372 54,924 0.58%MGM Resorts International Consumer cyclicals 1,922 54,912 0.58%AIA Group, Ltd. (Hong Kong) Financials 5,090 54,897 0.58%Weyerhaeuser Co. Basic materials 2,081 54,804 0.58%Liberty Media Corp.-Liberty Formula One Class C Consumer cyclicals 1,460 54,626 0.58%Lowe’s Cos., Inc. Consumer cyclicals 540 54,495 0.58%Westpac Banking Corp. (Australia) Financials 2,726 54,267 0.58%Becton Dickinson and Co. Health care 214 53,892 0.57%Takeda Pharmaceutical Co., Ltd. (Japan) Health care 1,514 53,701 0.57%Zurich Insurance Group AG (Switzerland) Financials 154 53,570 0.57%Deere & Co. Capital goods 323 53,495 0.57%ABB, Ltd. (Switzerland) Capital goods 2,663 53,446 0.57%Nokia OYJ (Finland) Technology 10,759 53,415 0.57%Entergy Corp. Utilities and power 518 53,349 0.57%Gartner, Inc. Consumer cyclicals 331 53,248 0.57%

Putnam VT Multi-Asset Absolute Return Fund 23
A BASKET (GSGLPWDS) OF COMMON STOCKS cont.
Common stocks Sector Shares ValuePercentage
value
Danone SA (France) Consumer staples 627 $53,118 0.56%Weir Group PLC (The) (United Kingdom) Capital goods 2,693 52,880 0.56%CME Group, Inc. Financials 271 52,651 0.56%Sabre Corp. Consumer cyclicals 2,371 52,635 0.56%Prologis, Inc. Financials 656 52,586 0.56%Bunge, Ltd. Consumer staples 944 52,583 0.56%Xylem, Inc. Capital goods 627 52,450 0.56%Iron Mountain, Inc. Consumer cyclicals 1,674 52,403 0.56%Coca-Cola Co. (The) Consumer staples 1,028 52,364 0.56%Panasonic Corp. (Japan) Consumer cyclicals 6,281 52,288 0.56%Markel Corp. Financials 48 52,112 0.55%Autodesk, Inc. Technology 320 52,084 0.55%SBA Communications Corp. Communication services 231 52,018 0.55%FedEx Corp. Transportation 317 51,997 0.55%Fortis, Inc. (Canada) Utilities and power 1,311 51,771 0.55%Dollar Tree, Inc. Consumer cyclicals 482 51,717 0.55%Camden Property Trust Financials 493 51,496 0.55%Cognex Corp. Technology 1,071 51,390 0.55%Mitsubishi Estate Co., Ltd. (Japan) Financials 2,731 50,795 0.54%DBS Group Holdings, Ltd. (Singapore) Financials 2,625 50,373 0.53%Banco Santander SA (Spain) Financials 10,848 50,336 0.53%United Parcel Service, Inc. Class B Transportation 483 49,881 0.53%Compagnie Financiere Richemont SA (Switzerland) Consumer cyclicals 579 49,161 0.52%BioMarin Pharmaceutical, Inc. Health care 569 48,761 0.52%Alexandria Real Estate Equities, Inc. Financials 345 48,637 0.52%Perrigo Co. PLC Health care 1,021 48,612 0.52%Mid-America Apartment Communities, Inc. Financials 412 48,469 0.51%Vornado Realty Trust Financials 754 48,352 0.51%Nasdaq, Inc. Financials 499 48,029 0.51%Liberty Global PLC Class C (United Kingdom) Communication services 1,810 48,015 0.51%Arthur J. Gallagher & Co. Financials 547 47,932 0.51%
OTC CREDIT DEFAULT CONTRACTS OUTSTANDING — PROTECTION SOLD at 6/30/19 (Unaudited)
Swap counterparty/ Referenced debt* Rating***
Upfront premium received
(paid)**Notional amount Value
Termi- nation
datePayments received by fund
Unrealized appreciation/ (depreciation)
Bank of America N.A.CMBX NA BBB–.6 Index BBB–/P $68 $1,000 $100 5/11/63 300 bp — Monthly $(32 )CMBX NA BBB–.6 Index BBB–/P 121 2,000 201 5/11/63 300 bp — Monthly (79 )CMBX NA BBB–.6 Index BBB–/P 247 4,000 402 5/11/63 300 bp — Monthly (153 )CMBX NA BBB–.6 Index BBB–/P 228 4,000 402 5/11/63 300 bp — Monthly (172 )Barclays Bank PLCCMBX NA BBB–.6 Index BBB–/P 887 8,000 803 5/11/63 300 bp — Monthly 88CMBX NA BBB–.7 Index BBB–/P 141 25,000 683 1/17/47 300 bp — Monthly (529 )Citigroup Global Markets, Inc.CMBX NA BB.6 Index BB/P 3,570 17,000 3,524 5/11/63 500 bp — Monthly 60CMBX NA BB.7 Index BB/P 1,087 9,000 940 1/17/47 500 bp — Monthly 155CMBX NA BBB–.6 Index BBB–/P 815 6,000 602 5/11/63 300 bp — Monthly 216CMBX NA BBB–.6 Index BBB–/P 1,387 13,000 1,305 5/11/63 300 bp — Monthly 88CMBX NA BBB–.6 Index BBB–/P 13,423 95,000 9,538 5/11/63 300 bp — Monthly 3,932CMBX NA BBB–.6 Index BBB–/P 38,951 268,000 26,907 5/11/63 300 bp — Monthly 12,178Credit Suisse InternationalCMBX NA A.6 Index A/P 1,015 20,000 26 5/11/63 200 bp — Monthly 1,048CMBX NA A.6 Index A/P 449 9,000 12 5/11/63 200 bp — Monthly 463CMBX NA BBB–.6 Index BBB–/P 760 6,000 602 5/11/63 300 bp — Monthly 160CMBX NA BBB–.6 Index BBB–/P 802 7,000 703 5/11/63 300 bp — Monthly 103
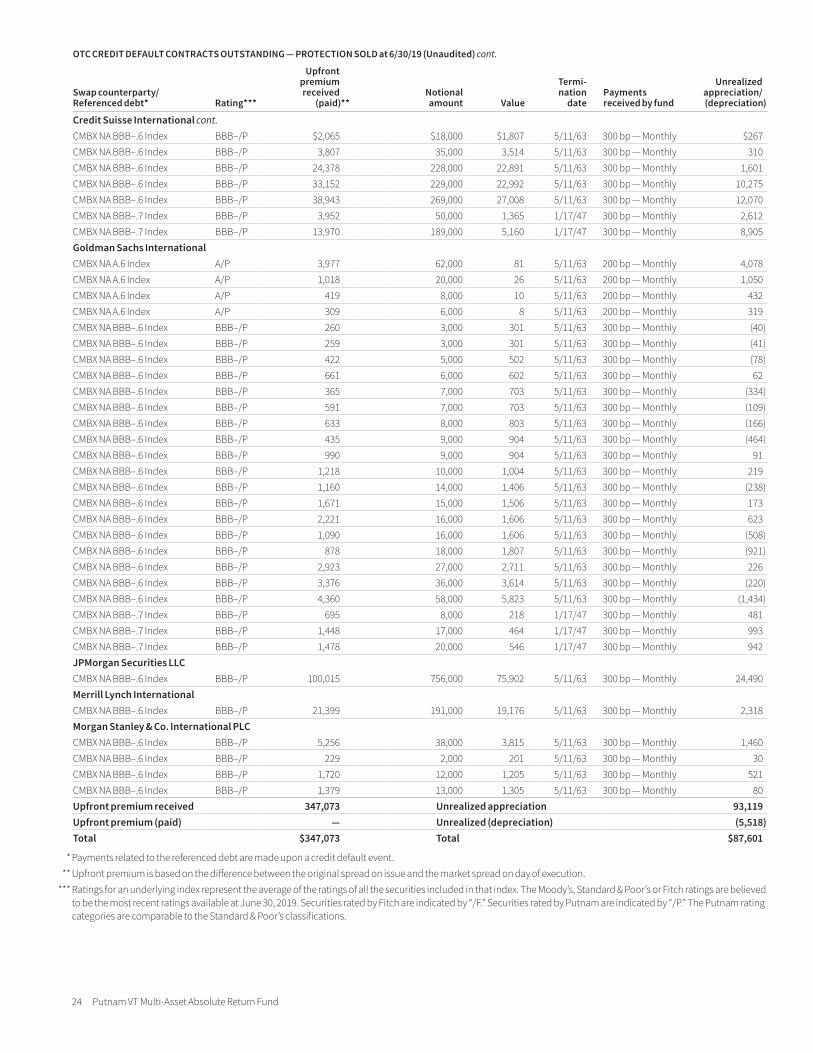
24 Putnam VT Multi-Asset Absolute Return Fund
OTC CREDIT DEFAULT CONTRACTS OUTSTANDING — PROTECTION SOLD at 6/30/19 (Unaudited) cont.
Swap counterparty/ Referenced debt* Rating***
Upfront premium received
(paid)**Notional amount Value
Termi- nation
datePayments received by fund
Unrealized appreciation/ (depreciation)
Credit Suisse International cont.CMBX NA BBB–.6 Index BBB–/P $2,065 $18,000 $1,807 5/11/63 300 bp — Monthly $267CMBX NA BBB–.6 Index BBB–/P 3,807 35,000 3,514 5/11/63 300 bp — Monthly 310CMBX NA BBB–.6 Index BBB–/P 24,378 228,000 22,891 5/11/63 300 bp — Monthly 1,601CMBX NA BBB–.6 Index BBB–/P 33,152 229,000 22,992 5/11/63 300 bp — Monthly 10,275CMBX NA BBB–.6 Index BBB–/P 38,943 269,000 27,008 5/11/63 300 bp — Monthly 12,070CMBX NA BBB–.7 Index BBB–/P 3,952 50,000 1,365 1/17/47 300 bp — Monthly 2,612CMBX NA BBB–.7 Index BBB–/P 13,970 189,000 5,160 1/17/47 300 bp — Monthly 8,905Goldman Sachs InternationalCMBX NA A.6 Index A/P 3,977 62,000 81 5/11/63 200 bp — Monthly 4,078CMBX NA A.6 Index A/P 1,018 20,000 26 5/11/63 200 bp — Monthly 1,050CMBX NA A.6 Index A/P 419 8,000 10 5/11/63 200 bp — Monthly 432CMBX NA A.6 Index A/P 309 6,000 8 5/11/63 200 bp — Monthly 319CMBX NA BBB–.6 Index BBB–/P 260 3,000 301 5/11/63 300 bp — Monthly (40 )CMBX NA BBB–.6 Index BBB–/P 259 3,000 301 5/11/63 300 bp — Monthly (41 )CMBX NA BBB–.6 Index BBB–/P 422 5,000 502 5/11/63 300 bp — Monthly (78 )CMBX NA BBB–.6 Index BBB–/P 661 6,000 602 5/11/63 300 bp — Monthly 62CMBX NA BBB–.6 Index BBB–/P 365 7,000 703 5/11/63 300 bp — Monthly (334 )CMBX NA BBB–.6 Index BBB–/P 591 7,000 703 5/11/63 300 bp — Monthly (109 )CMBX NA BBB–.6 Index BBB–/P 633 8,000 803 5/11/63 300 bp — Monthly (166 )CMBX NA BBB–.6 Index BBB–/P 435 9,000 904 5/11/63 300 bp — Monthly (464 )CMBX NA BBB–.6 Index BBB–/P 990 9,000 904 5/11/63 300 bp — Monthly 91CMBX NA BBB–.6 Index BBB–/P 1,218 10,000 1,004 5/11/63 300 bp — Monthly 219CMBX NA BBB–.6 Index BBB–/P 1,160 14,000 1,406 5/11/63 300 bp — Monthly (238 )CMBX NA BBB–.6 Index BBB–/P 1,671 15,000 1,506 5/11/63 300 bp — Monthly 173CMBX NA BBB–.6 Index BBB–/P 2,221 16,000 1,606 5/11/63 300 bp — Monthly 623CMBX NA BBB–.6 Index BBB–/P 1,090 16,000 1,606 5/11/63 300 bp — Monthly (508 )CMBX NA BBB–.6 Index BBB–/P 878 18,000 1,807 5/11/63 300 bp — Monthly (921 )CMBX NA BBB–.6 Index BBB–/P 2,923 27,000 2,711 5/11/63 300 bp — Monthly 226CMBX NA BBB–.6 Index BBB–/P 3,376 36,000 3,614 5/11/63 300 bp — Monthly (220 )CMBX NA BBB–.6 Index BBB–/P 4,360 58,000 5,823 5/11/63 300 bp — Monthly (1,434 )CMBX NA BBB–.7 Index BBB–/P 695 8,000 218 1/17/47 300 bp — Monthly 481CMBX NA BBB–.7 Index BBB–/P 1,448 17,000 464 1/17/47 300 bp — Monthly 993CMBX NA BBB–.7 Index BBB–/P 1,478 20,000 546 1/17/47 300 bp — Monthly 942JPMorgan Securities LLCCMBX NA BBB–.6 Index BBB–/P 100,015 756,000 75,902 5/11/63 300 bp — Monthly 24,490Merrill Lynch InternationalCMBX NA BBB–.6 Index BBB–/P 21,399 191,000 19,176 5/11/63 300 bp — Monthly 2,318Morgan Stanley & Co. International PLCCMBX NA BBB–.6 Index BBB–/P 5,256 38,000 3,815 5/11/63 300 bp — Monthly 1,460CMBX NA BBB–.6 Index BBB–/P 229 2,000 201 5/11/63 300 bp — Monthly 30CMBX NA BBB–.6 Index BBB–/P 1,720 12,000 1,205 5/11/63 300 bp — Monthly 521CMBX NA BBB–.6 Index BBB–/P 1,379 13,000 1,305 5/11/63 300 bp — Monthly 80Upfront premium received 347,073 Unrealized appreciation 93,119Upfront premium (paid) — Unrealized (depreciation) (5,518 )Total $347,073 Total $87,601
* Payments related to the referenced debt are made upon a credit default event. ** Upfront premium is based on the difference between the original spread on issue and the market spread on day of execution. *** Ratings for an underlying index represent the average of the ratings of all the securities included in that index. The Moody’s, Standard & Poor’s or Fitch ratings are believed
to be the most recent ratings available at June 30, 2019. Securities rated by Fitch are indicated by “/F.” Securities rated by Putnam are indicated by “/P.” The Putnam rating categories are comparable to the Standard & Poor’s classifications.
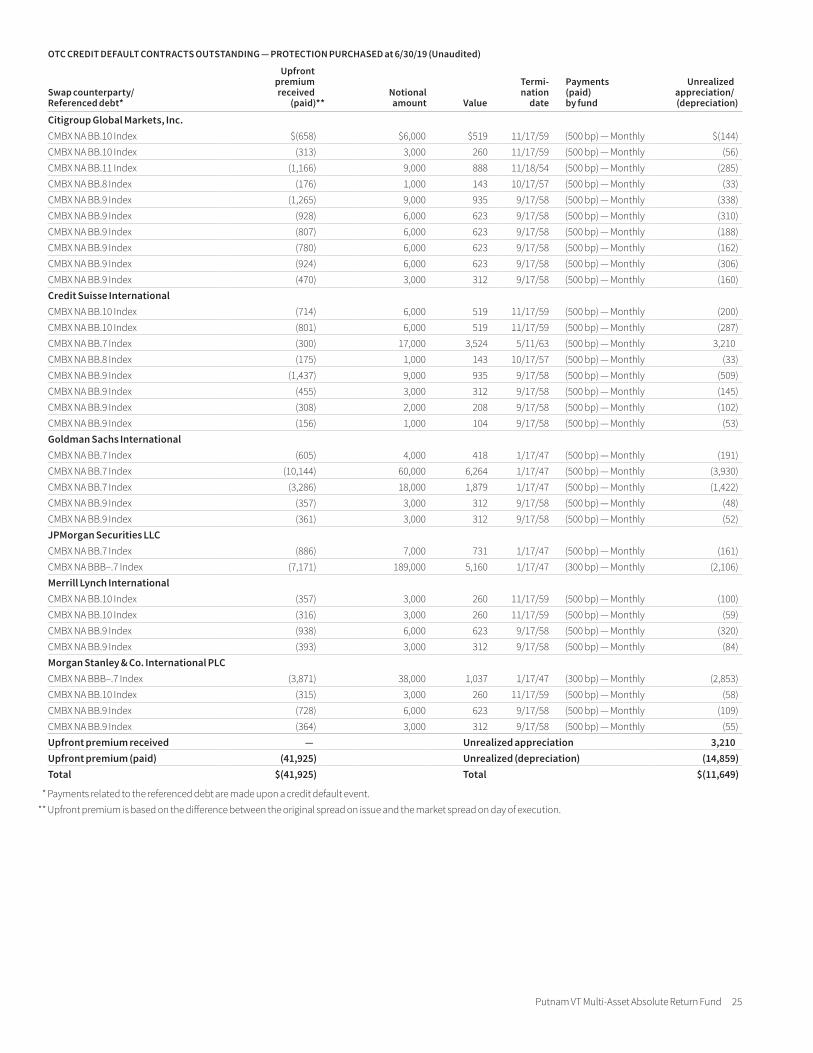
Putnam VT Multi-Asset Absolute Return Fund 25
OTC CREDIT DEFAULT CONTRACTS OUTSTANDING — PROTECTION PURCHASED at 6/30/19 (Unaudited)
Swap counterparty/ Referenced debt*
Upfront premium received
(paid)**Notional amount Value
Termi- nation
date
Payments (paid) by fund
Unrealized appreciation/ (depreciation)
Citigroup Global Markets, Inc.CMBX NA BB.10 Index $(658 ) $6,000 $519 11/17/59 (500 bp) — Monthly $(144 )CMBX NA BB.10 Index (313 ) 3,000 260 11/17/59 (500 bp) — Monthly (56 )CMBX NA BB.11 Index (1,166 ) 9,000 888 11/18/54 (500 bp) — Monthly (285 )CMBX NA BB.8 Index (176 ) 1,000 143 10/17/57 (500 bp) — Monthly (33 )CMBX NA BB.9 Index (1,265 ) 9,000 935 9/17/58 (500 bp) — Monthly (338 )CMBX NA BB.9 Index (928 ) 6,000 623 9/17/58 (500 bp) — Monthly (310 )CMBX NA BB.9 Index (807 ) 6,000 623 9/17/58 (500 bp) — Monthly (188 )CMBX NA BB.9 Index (780 ) 6,000 623 9/17/58 (500 bp) — Monthly (162 )CMBX NA BB.9 Index (924 ) 6,000 623 9/17/58 (500 bp) — Monthly (306 )CMBX NA BB.9 Index (470 ) 3,000 312 9/17/58 (500 bp) — Monthly (160 )Credit Suisse InternationalCMBX NA BB.10 Index (714 ) 6,000 519 11/17/59 (500 bp) — Monthly (200 )CMBX NA BB.10 Index (801 ) 6,000 519 11/17/59 (500 bp) — Monthly (287 )CMBX NA BB.7 Index (300 ) 17,000 3,524 5/11/63 (500 bp) — Monthly 3,210CMBX NA BB.8 Index (175 ) 1,000 143 10/17/57 (500 bp) — Monthly (33 )CMBX NA BB.9 Index (1,437 ) 9,000 935 9/17/58 (500 bp) — Monthly (509 )CMBX NA BB.9 Index (455 ) 3,000 312 9/17/58 (500 bp) — Monthly (145 )CMBX NA BB.9 Index (308 ) 2,000 208 9/17/58 (500 bp) — Monthly (102 )CMBX NA BB.9 Index (156 ) 1,000 104 9/17/58 (500 bp) — Monthly (53 )Goldman Sachs InternationalCMBX NA BB.7 Index (605 ) 4,000 418 1/17/47 (500 bp) — Monthly (191 )CMBX NA BB.7 Index (10,144 ) 60,000 6,264 1/17/47 (500 bp) — Monthly (3,930 )CMBX NA BB.7 Index (3,286 ) 18,000 1,879 1/17/47 (500 bp) — Monthly (1,422 )CMBX NA BB.9 Index (357 ) 3,000 312 9/17/58 (500 bp) — Monthly (48 )CMBX NA BB.9 Index (361 ) 3,000 312 9/17/58 (500 bp) — Monthly (52 )JPMorgan Securities LLCCMBX NA BB.7 Index (886 ) 7,000 731 1/17/47 (500 bp) — Monthly (161 )CMBX NA BBB–.7 Index (7,171 ) 189,000 5,160 1/17/47 (300 bp) — Monthly (2,106 )Merrill Lynch InternationalCMBX NA BB.10 Index (357 ) 3,000 260 11/17/59 (500 bp) — Monthly (100 )CMBX NA BB.10 Index (316 ) 3,000 260 11/17/59 (500 bp) — Monthly (59 )CMBX NA BB.9 Index (938 ) 6,000 623 9/17/58 (500 bp) — Monthly (320 )CMBX NA BB.9 Index (393 ) 3,000 312 9/17/58 (500 bp) — Monthly (84 )Morgan Stanley & Co. International PLCCMBX NA BBB–.7 Index (3,871 ) 38,000 1,037 1/17/47 (300 bp) — Monthly (2,853 )CMBX NA BB.10 Index (315 ) 3,000 260 11/17/59 (500 bp) — Monthly (58 )CMBX NA BB.9 Index (728 ) 6,000 623 9/17/58 (500 bp) — Monthly (109 )CMBX NA BB.9 Index (364 ) 3,000 312 9/17/58 (500 bp) — Monthly (55 )Upfront premium received — Unrealized appreciation 3,210Upfront premium (paid) (41,925 ) Unrealized (depreciation) (14,859 )Total $(41,925 ) Total $(11,649 )
* Payments related to the referenced debt are made upon a credit default event. ** Upfront premium is based on the difference between the original spread on issue and the market spread on day of execution.
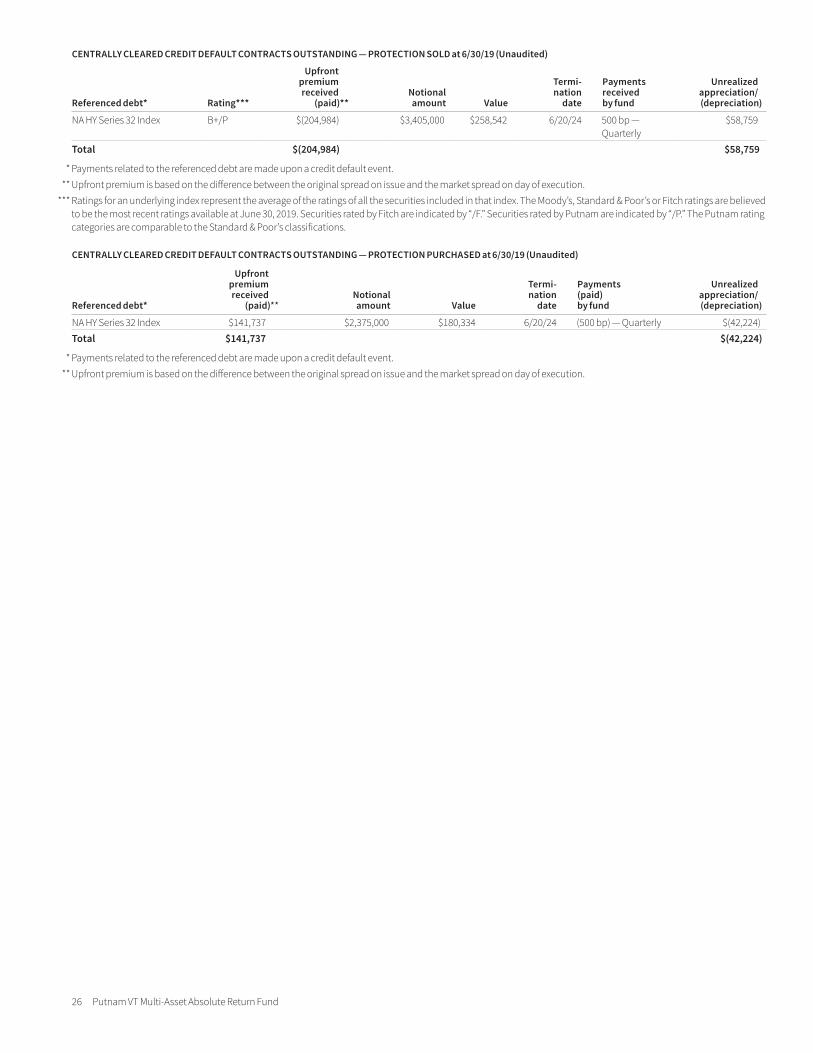
26 Putnam VT Multi-Asset Absolute Return Fund
CENTRALLY CLEARED CREDIT DEFAULT CONTRACTS OUTSTANDING — PROTECTION SOLD at 6/30/19 (Unaudited)
Referenced debt* Rating***
Upfront premium received
(paid)**Notional amount Value
Termi- nation
date
Payments received by fund
Unrealized appreciation/ (depreciation)
NA HY Series 32 Index B+/P $(204,984 ) $3,405,000 $258,542 6/20/24 500 bp — Quarterly
$58,759
Total $(204,984 ) $58,759
* Payments related to the referenced debt are made upon a credit default event. ** Upfront premium is based on the difference between the original spread on issue and the market spread on day of execution. *** Ratings for an underlying index represent the average of the ratings of all the securities included in that index. The Moody’s, Standard & Poor’s or Fitch ratings are believed
to be the most recent ratings available at June 30, 2019. Securities rated by Fitch are indicated by “/F.” Securities rated by Putnam are indicated by “/P.” The Putnam rating categories are comparable to the Standard & Poor’s classifications.
CENTRALLY CLEARED CREDIT DEFAULT CONTRACTS OUTSTANDING — PROTECTION PURCHASED at 6/30/19 (Unaudited)
Referenced debt*
Upfront premium received
(paid)**Notional amount Value
Termi- nation
date
Payments (paid) by fund
Unrealized appreciation/ (depreciation)
NA HY Series 32 Index $141,737 $2,375,000 $180,334 6/20/24 (500 bp) — Quarterly $(42,224 )Total $141,737 $(42,224 )
* Payments related to the referenced debt are made upon a credit default event. ** Upfront premium is based on the difference between the original spread on issue and the market spread on day of execution.
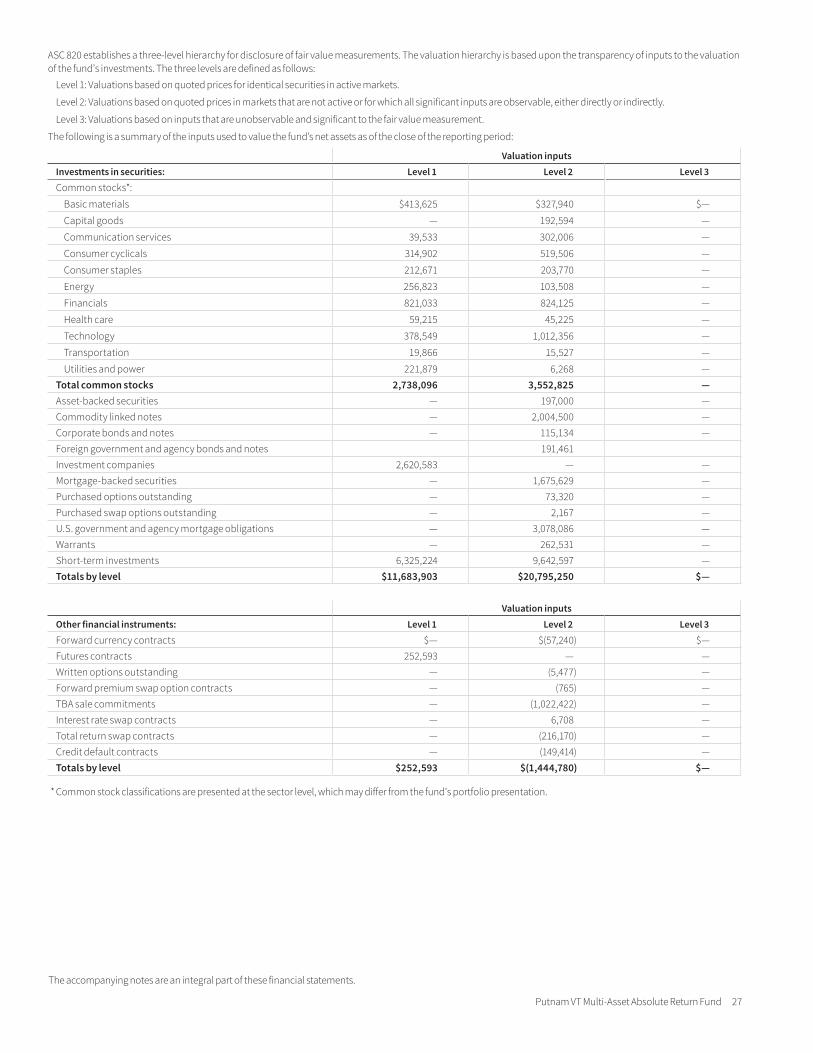
Putnam VT Multi-Asset Absolute Return Fund 27
ASC 820 establishes a three-level hierarchy for disclosure of fair value measurements. The valuation hierarchy is based upon the transparency of inputs to the valuation of the fund’s investments. The three levels are defined as follows:
Level 1: Valuations based on quoted prices for identical securities in active markets.
Level 2: Valuations based on quoted prices in markets that are not active or for which all significant inputs are observable, either directly or indirectly.
Level 3: Valuations based on inputs that are unobservable and significant to the fair value measurement.
The following is a summary of the inputs used to value the fund’s net assets as of the close of the reporting period:
Valuation inputsInvestments in securities: Level 1 Level 2 Level 3Common stocks*:
Basic materials $413,625 $327,940 $—
Capital goods — 192,594 —
Communication services 39,533 302,006 —
Consumer cyclicals 314,902 519,506 —
Consumer staples 212,671 203,770 —
Energy 256,823 103,508 —
Financials 821,033 824,125 —
Health care 59,215 45,225 —
Technology 378,549 1,012,356 —
Transportation 19,866 15,527 —
Utilities and power 221,879 6,268 — Total common stocks 2,738,096 3,552,825 — Asset-backed securities — 197,000 — Commodity linked notes — 2,004,500 — Corporate bonds and notes — 115,134 — Foreign government and agency bonds and notes 191,461Investment companies 2,620,583 — — Mortgage-backed securities — 1,675,629 — Purchased options outstanding — 73,320 — Purchased swap options outstanding — 2,167 — U.S. government and agency mortgage obligations — 3,078,086 — Warrants — 262,531 — Short-term investments 6,325,224 9,642,597 — Totals by level $11,683,903 $20,795,250 $—
Valuation inputsOther financial instruments: Level 1 Level 2 Level 3Forward currency contracts $— $(57,240 ) $— Futures contracts 252,593 — — Written options outstanding — (5,477 ) — Forward premium swap option contracts — (765 ) — TBA sale commitments — (1,022,422 ) — Interest rate swap contracts — 6,708 — Total return swap contracts — (216,170 ) — Credit default contracts — (149,414 ) — Totals by level $252,593 $(1,444,780 ) $—
* Common stock classifications are presented at the sector level, which may differ from the fund’s portfolio presentation.
The accompanying notes are an integral part of these financial statements.
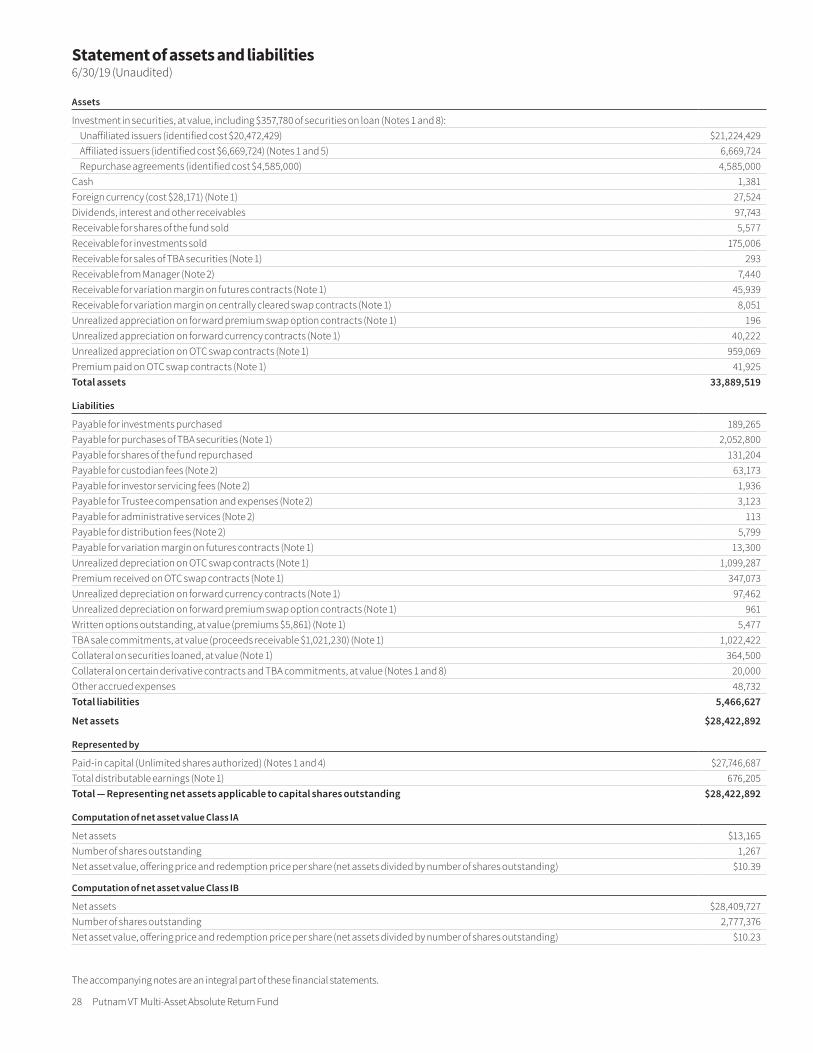
28 Putnam VT Multi-Asset Absolute Return Fund
The accompanying notes are an integral part of these financial statements.
Statement of assets and liabilities6/30/19 (Unaudited)
Assets
Investment in securities, at value, including $357,780 of securities on loan (Notes 1 and 8):Unaffiliated issuers (identified cost $20,472,429) $21,224,429 Affiliated issuers (identified cost $6,669,724) (Notes 1 and 5) 6,669,724 Repurchase agreements (identified cost $4,585,000) 4,585,000
Cash 1,381 Foreign currency (cost $28,171) (Note 1) 27,524 Dividends, interest and other receivables 97,743 Receivable for shares of the fund sold 5,577 Receivable for investments sold 175,006 Receivable for sales of TBA securities (Note 1) 293 Receivable from Manager (Note 2) 7,440 Receivable for variation margin on futures contracts (Note 1) 45,939 Receivable for variation margin on centrally cleared swap contracts (Note 1) 8,051 Unrealized appreciation on forward premium swap option contracts (Note 1) 196 Unrealized appreciation on forward currency contracts (Note 1) 40,222 Unrealized appreciation on OTC swap contracts (Note 1) 959,069 Premium paid on OTC swap contracts (Note 1) 41,925 Total assets 33,889,519
Liabilities
Payable for investments purchased 189,265 Payable for purchases of TBA securities (Note 1) 2,052,800 Payable for shares of the fund repurchased 131,204 Payable for custodian fees (Note 2) 63,173 Payable for investor servicing fees (Note 2) 1,936 Payable for Trustee compensation and expenses (Note 2) 3,123 Payable for administrative services (Note 2) 113 Payable for distribution fees (Note 2) 5,799 Payable for variation margin on futures contracts (Note 1) 13,300 Unrealized depreciation on OTC swap contracts (Note 1) 1,099,287 Premium received on OTC swap contracts (Note 1) 347,073 Unrealized depreciation on forward currency contracts (Note 1) 97,462 Unrealized depreciation on forward premium swap option contracts (Note 1) 961 Written options outstanding, at value (premiums $5,861) (Note 1) 5,477 TBA sale commitments, at value (proceeds receivable $1,021,230) (Note 1) 1,022,422 Collateral on securities loaned, at value (Note 1) 364,500 Collateral on certain derivative contracts and TBA commitments, at value (Notes 1 and 8) 20,000 Other accrued expenses 48,732 Total liabilities 5,466,627
Net assets $28,422,892
Represented by
Paid-in capital (Unlimited shares authorized) (Notes 1 and 4) $27,746,687 Total distributable earnings (Note 1) 676,205 Total — Representing net assets applicable to capital shares outstanding $28,422,892
Computation of net asset value Class IA
Net assets $13,165 Number of shares outstanding 1,267 Net asset value, offering price and redemption price per share (net assets divided by number of shares outstanding) $10.39
Computation of net asset value Class IB
Net assets $28,409,727 Number of shares outstanding 2,777,376 Net asset value, offering price and redemption price per share (net assets divided by number of shares outstanding) $10.23
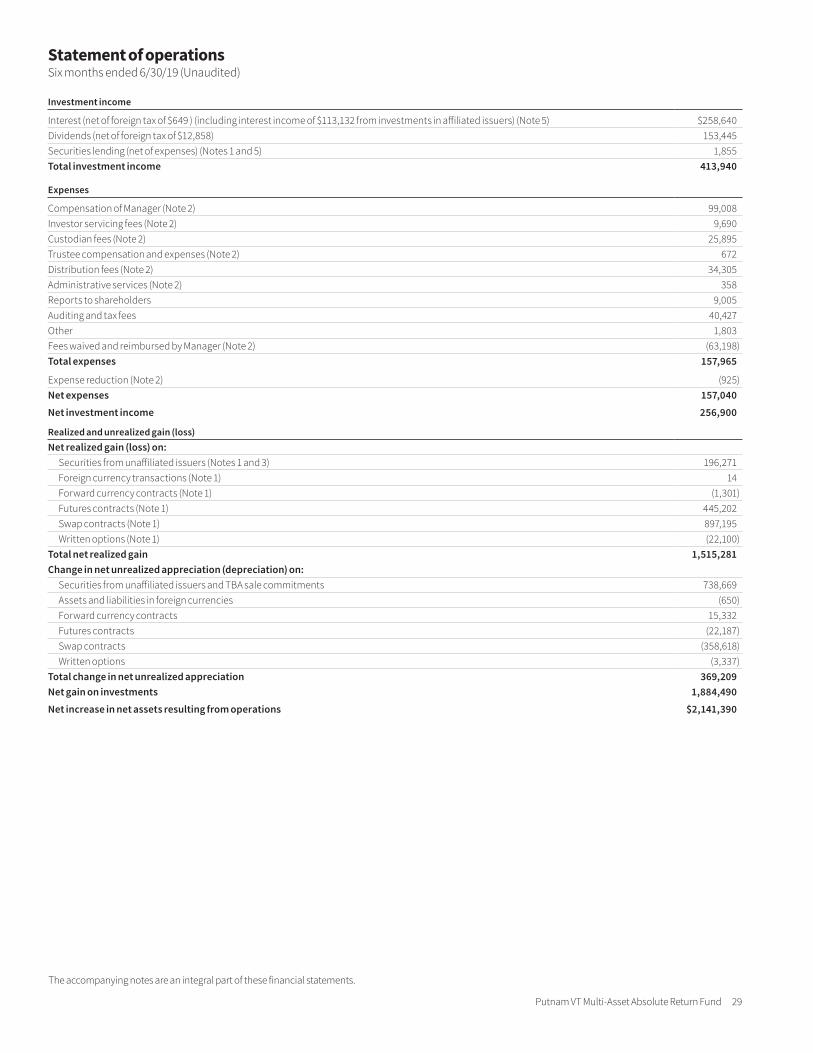
Putnam VT Multi-Asset Absolute Return Fund 29
The accompanying notes are an integral part of these financial statements.
Statement of operationsSix months ended 6/30/19 (Unaudited)
Investment income
Interest (net of foreign tax of $649 ) (including interest income of $113,132 from investments in affiliated issuers) (Note 5) $258,640 Dividends (net of foreign tax of $12,858) 153,445 Securities lending (net of expenses) (Notes 1 and 5) 1,855 Total investment income 413,940
Expenses
Compensation of Manager (Note 2) 99,008 Investor servicing fees (Note 2) 9,690 Custodian fees (Note 2) 25,895 Trustee compensation and expenses (Note 2) 672 Distribution fees (Note 2) 34,305 Administrative services (Note 2) 358 Reports to shareholders 9,005 Auditing and tax fees 40,427 Other 1,803 Fees waived and reimbursed by Manager (Note 2) (63,198)Total expenses 157,965
Expense reduction (Note 2) (925)Net expenses 157,040
Net investment income 256,900
Realized and unrealized gain (loss)Net realized gain (loss) on:
Securities from unaffiliated issuers (Notes 1 and 3) 196,271 Foreign currency transactions (Note 1) 14 Forward currency contracts (Note 1) (1,301)Futures contracts (Note 1) 445,202 Swap contracts (Note 1) 897,195 Written options (Note 1) (22,100)
Total net realized gain 1,515,281 Change in net unrealized appreciation (depreciation) on:
Securities from unaffiliated issuers and TBA sale commitments 738,669 Assets and liabilities in foreign currencies (650)Forward currency contracts 15,332 Futures contracts (22,187)Swap contracts (358,618)Written options (3,337)
Total change in net unrealized appreciation 369,209 Net gain on investments 1,884,490
Net increase in net assets resulting from operations $2,141,390
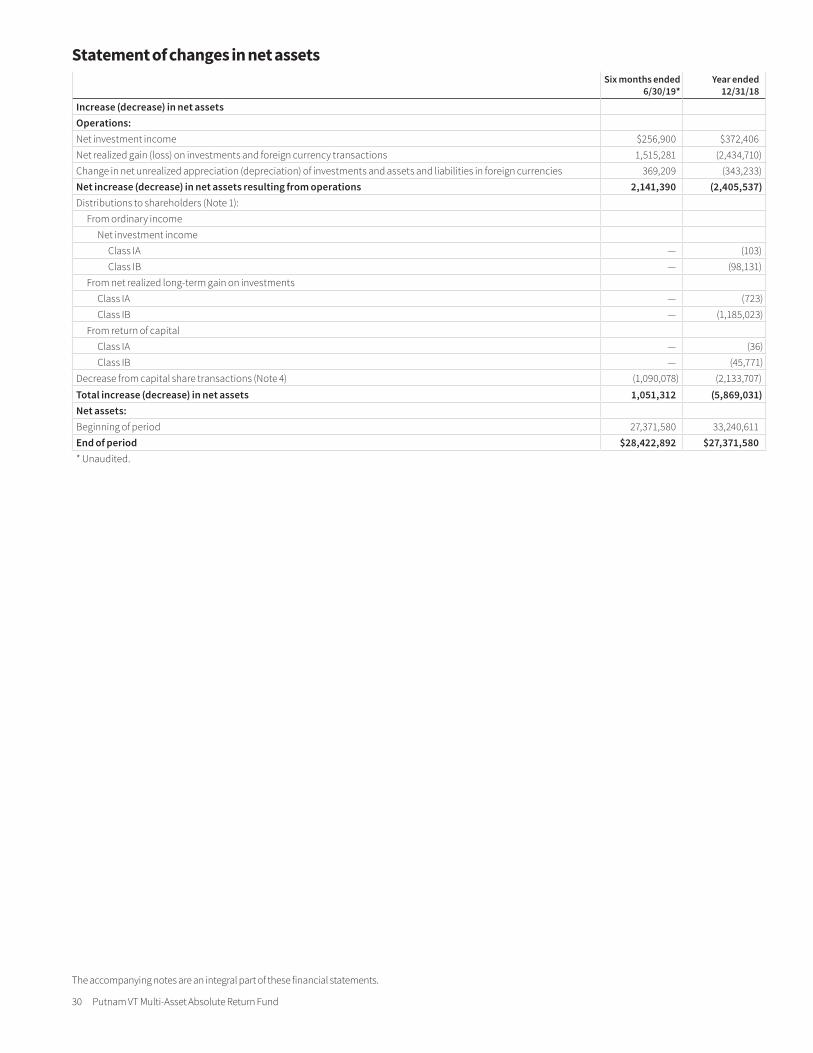
30 Putnam VT Multi-Asset Absolute Return Fund
Statement of changes in net assets Six months ended
6/30/19*Year ended
12/31/18Increase (decrease) in net assetsOperations:Net investment income $256,900 $372,406 Net realized gain (loss) on investments and foreign currency transactions 1,515,281 (2,434,710)Change in net unrealized appreciation (depreciation) of investments and assets and liabilities in foreign currencies 369,209 (343,233)Net increase (decrease) in net assets resulting from operations 2,141,390 (2,405,537)Distributions to shareholders (Note 1):
From ordinary incomeNet investment income
Class IA — (103)Class IB — (98,131)
From net realized long-term gain on investmentsClass IA — (723)Class IB — (1,185,023)
From return of capitalClass IA — (36)Class IB — (45,771)
Decrease from capital share transactions (Note 4) (1,090,078) (2,133,707)
Total increase (decrease) in net assets 1,051,312 (5,869,031)Net assets:Beginning of period 27,371,580 33,240,611 End of period $28,422,892 $27,371,580 * Unaudited.
The accompanying notes are an integral part of these financial statements.
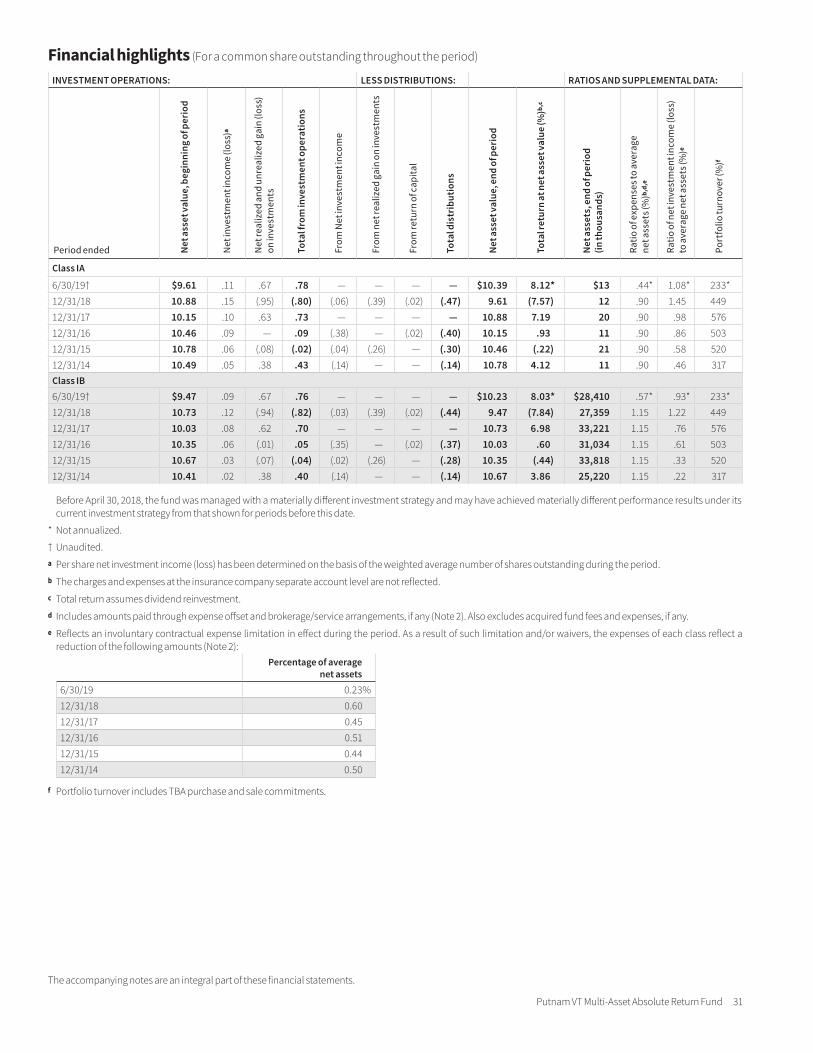
Putnam VT Multi-Asset Absolute Return Fund 31
The accompanying notes are an integral part of these financial statements.
Before April 30, 2018, the fund was managed with a materially different investment strategy and may have achieved materially different performance results under its current investment strategy from that shown for periods before this date.
* Not annualized.
† Unaudited.a Per share net investment income (loss) has been determined on the basis of the weighted average number of shares outstanding during the period.b The charges and expenses at the insurance company separate account level are not reflected.c Total return assumes dividend reinvestment.d Includes amounts paid through expense offset and brokerage/service arrangements, if any (Note 2). Also excludes acquired fund fees and expenses, if any.e Reflects an involuntary contractual expense limitation in effect during the period. As a result of such limitation and/or waivers, the expenses of each class reflect a
reduction of the following amounts (Note 2):Percentage of average
net assets6/30/19 0.23%12/31/18 0.6012/31/17 0.4512/31/16 0.5112/31/15 0.4412/31/14 0.50
f Portfolio turnover includes TBA purchase and sale commitments.
Financial highlights (For a common share outstanding throughout the period)
INVESTMENT OPERATIONS: LESS DISTRIBUTIONS: RATIOS AND SUPPLEMENTAL DATA:
Period ended Net
ass
et va
lue,
beg
inni
ng o
f per
iod
Net
inve
stm
ent i
ncom
e (lo
ss ) a
Net
real
ized
and
unr
ealiz
ed g
ain
(loss
) on
inve
stm
ents
Tota
l fro
m in
vest
men
t ope
ratio
ns
From
Net
inve
stm
ent i
ncom
e
From
net
real
ized
gai
n on
inve
stm
ents
From
retu
rn o
f cap
ital
Tota
l dis
tri b
u tio
ns
Net
ass
et va
lue,
end
of p
erio
d
Tota
l ret
urn
at n
et a
sset
valu
e (%
) b,c
Net
ass
ets,
end
of p
erio
d (in
thou
sand
s )
Ratio
of e
xpen
ses t
o av
erag
e ne
t ass
ets (
% ) b
,d,e
Ratio
of n
et in
vest
men
t inc
ome
(loss
) to
ave
rage
net
ass
ets (
% ) e
Port
folio
turn
over
(% ) f
Class IA
6/30/19 † $9.61 .11 .67 .78 — — — — $10.39 8.12 * $13 .44 * 1.08 * 233 *
12/31/18 10.88 .15 (.95 ) (.80 ) (.06 ) (.39 ) (.02 ) (.47 ) 9.61 (7.57 ) 12 .90 1.45 449 12/31/17 10.15 .10 .63 .73 — — — — 10.88 7.19 20 .90 .98 576 12/31/16 10.46 .09 — .09 (.38 ) — (.02 ) (.40 ) 10.15 .93 11 .90 .86 503 12/31/15 10.78 .06 (.08 ) (.02 ) (.04 ) (.26 ) — (.30 ) 10.46 (.22 ) 21 .90 .58 520 12/31/14 10.49 .05 .38 .43 (.14 ) — — (.14 ) 10.78 4.12 11 .90 .46 317 Class IB 6/30/19 † $9.47 .09 .67 .76 — — — — $10.23 8.03 * $28,410 .57 * .93 * 233 *
12/31/18 10.73 .12 (.94 ) (.82 ) (.03 ) (.39 ) (.02 ) (.44 ) 9.47 (7.84 ) 27,359 1.15 1.22 449 12/31/17 10.03 .08 .62 .70 — — — — 10.73 6.98 33,221 1.15 .76 576 12/31/16 10.35 .06 (.01 ) .05 (.35 ) — (.02 ) (.37 ) 10.03 .60 31,034 1.15 .61 503 12/31/15 10.67 .03 (.07 ) (.04 ) (.02 ) (.26 ) — (.28 ) 10.35 (.44 ) 33,818 1.15 .33 520 12/31/14 10.41 .02 .38 .40 (.14 ) — — (.14 ) 10.67 3.86 25,220 1.15 .22 317
32 Putnam VT Multi-Asset Absolute Return Fund
Notes to financial statements 6/30/19 (Unaudited)
Within the following Notes to financial statements, references to “State Street” represent State Street Bank and Trust Company, references to “the SEC” represent the Securities and Exchange Commission, references to “Putnam Management” represent Putnam Investment Management, LLC, the fund’s manager, an indirect wholly-owned subsidiary of Putnam Investments, LLC and references to “OTC”, if any, represent over-the-counter. Unless otherwise noted, the “reporting period” represents the period from January 1, 2019 through June 30, 2019.
Putnam VT Multi-Asset Absolute Return Fund (the fund) is a diversified series of Putnam Variable Trust (the Trust), a Massachusetts business trust registered under the Investment Company Act of 1940, as amended, as an open-end management investment company. The goal of the fund is to seek positive total return. In pursuing a positive total return, the fund’s strategies are generally intended to produce lower volatility over a reasonable period of time than has been historically associated with traditional asset classes that have earned similar levels of return over long histor-ical periods. The Fund aims to accomplish this objective by combining “direc-tional” strategies and “non-directional” strategies. The directional strategies seek efficient, diversified exposure to investment markets. They also seek to balance risk and provide positive total return by investing, without limit, in many different asset classes, including U.S., international, and emerging markets equity securi-ties (growth or value stocks or both) and fixed-income securities; mortgage- and asset-backed securities; below-investment-grade securities (sometimes referred to as “junk bonds”); inflation-protected securities; commodities; and real estate investment trusts (REITs). The non-directional strategies aim to provide positive returns that have minimal correlation with traditional asset classes, such as equi-ties or equity-like investments. The non-directional strategies are generally imple-mented using paired long and short positions in an effort to capitalize on long-term market inefficiencies and short-term opportunities. The non-directional strategies may involve the use of active trading strategies, currency transactions and options transactions.
Putnam Management may consider, among other factors, a company’s valu-ation, financial strength, growth potential, competitive position in its industry, projected future earnings, cash flows and dividends when deciding whether to buy or sell equity investments, and, among other factors, credit, interest rate and prepayment risks when deciding whether to buy or sell fixed-income invest-ments. Putnam Management may also take into account general market condi-tions when making investment decisions. The fund typically uses derivatives, such as futures, options, certain foreign currency transactions, warrants and swap contracts, to a significant extent for hedging purposes and to increase the fund’s exposure to the asset classes and strategies mentioned above, which may create investment leverage.
The fund offers class IA and class IB shares of beneficial interest. Class IA shares are offered at net asset value and are not subject to a distribution fee. Class IB shares are offered at net asset value and pay an ongoing distribution fee, which is identified in Note 2.
In the normal course of business, the fund enters into contracts that may include agreements to indemnify another party under given circumstances. The fund’s maximum exposure under these arrangements is unknown as this would involve future claims that may be, but have not yet been, made against the fund. However, the fund’s management team expects the risk of material loss to be remote.
The fund has entered into contractual arrangements with an investment adviser, administrator, distributor, shareholder servicing agent and custodian, who each provide services to the fund. Unless expressly stated otherwise, shareholders are not parties to, or intended beneficiaries of these contractual arrangements, and these contractual arrangements are not intended to create any shareholder right to enforce them against the service providers or to seek any remedy under them against the service providers, either directly or on behalf of the fund.
Under the fund’s Amended and Restated Agreement and Declaration of Trust, any claims asserted against or on behalf of the Putnam Funds, including claims against Trustees and Officers, must be brought in state and federal courts located within the Commonwealth of Massachusetts.
Note 1 — Significant accounting policiesThe following is a summary of significant accounting policies consistently followed by the fund in the preparation of its financial statements. The prepara-tion of financial statements is in conformity with accounting principles generally accepted in the United States of America and requires management to make esti-mates and assumptions that affect the reported amounts of assets and liabilities in the financial statements and the reported amounts of increases and decreases
in net assets from operations. Actual results could differ from those estimates. Subsequent events after the Statement of assets and liabilities date through the date that the financial statements were issued have been evaluated in the preparation of the financial statements.
Investment income, realized and unrealized gains and losses and expenses of the fund are borne pro-rata based on the relative net assets of each class to the total net assets of the fund, except that each class bears expenses unique to that class (including the distribution fees applicable to such classes). Each class votes as a class only with respect to its own distribution plan or other matters on which a class vote is required by law or determined by the Trustees. If the fund were liqui-dated, shares of each class would receive their pro-rata share of the net assets of the fund. In addition, the Trustees declare separate dividends on each class of shares.
Security valuation Portfolio securities and other investments are valued using policies and procedures adopted by the Board of Trustees. The Trustees have formed a Pricing Committee to oversee the implementation of these procedures and have delegated responsibility for valuing the fund’s assets in accordance with these procedures to Putnam Management. Putnam Management has established an internal Valuation Committee that is responsible for making fair value deter-minations, evaluating the effectiveness of the pricing policies of the fund and reporting to the Pricing Committee.
Investments for which market quotations are readily available are valued at the last reported sales price on their principal exchange, or official closing price for certain markets, and are classified as Level 1 securities under Accounting Standards Codification 820 Fair Value Measurements and Disclosures (ASC 820). If no sales are reported, as in the case of some securities that are traded OTC, a security is valued at its last reported bid price and is generally categorized as a Level 2 security.
Investments in open-end investment companies (excluding exchange-traded funds), if any, which can be classified as Level 1 or Level 2 securities, are valued based on their net asset value. The net asset value of such investment companies equals the total value of their assets less their liabilities and divided by the number of their outstanding shares.
Market quotations are not considered to be readily available for certain debt obli-gations (including short-term investments with remaining maturities of 60 days or less) and other investments; such investments are valued on the basis of valu-ations furnished by an independent pricing service approved by the Trustees or dealers selected by Putnam Management. Such services or dealers determine valuations for normal institutional-size trading units of such securities using methods based on market transactions for comparable securities and various relationships, generally recognized by institutional traders, between securities (which consider such factors as security prices, yields, maturities and ratings). These securities will generally be categorized as Level 2.
Many securities markets and exchanges outside the U.S. close prior to the sched-uled close of the New York Stock Exchange and therefore the closing prices for securities in such markets or on such exchanges may not fully reflect events that occur after such close but before the scheduled close of the New York Stock Exchange. Accordingly, on certain days, the fund will fair value certain foreign equity securities taking into account multiple factors including movements in the U.S. securities markets, currency valuations and comparisons to the valuation of American Depository Receipts, exchange-traded funds and futures contracts. The foreign equity securities, which would generally be classified as Level 1 securities, will be transferred to Level 2 of the fair value hierarchy when they are valued at fair value. The number of days on which fair value prices will be used will depend on market activity and it is possible that fair value prices will be used by the fund to a significant extent. At the close of the reporting period, fair value pricing was used for certain foreign securities in the portfolio. Securities quoted in foreign currencies, if any, are translated into U.S. dollars at the current exchange rate.
To the extent a pricing service or dealer is unable to value a security or provides a valuation that Putnam Management does not believe accurately reflects the secu-rity’s fair value, the security will be valued at fair value by Putnam Management in accordance with policies and procedures approved by the Trustees. Certain investments, including certain restricted and illiquid securities and derivatives, are also valued at fair value following procedures approved by the Trustees. These valuations consider such factors as significant market or specific security events such as interest rate or credit quality changes, various relationships with other securities, discount rates, U.S. Treasury, U.S. swap and credit yields, index levels, convexity exposures, recovery rates, sales and other multiples and resale
Putnam VT Multi-Asset Absolute Return Fund 33
restrictions. These securities are classified as Level 2 or as Level 3 depending on the priority of the significant inputs.
To assess the continuing appropriateness of fair valuations, the Valuation Committee reviews and affirms the reasonableness of such valuations on a regular basis after considering all relevant information that is reasonably available. Such valuations and procedures are reviewed periodically by the Trustees. Certain securities may be valued on the basis of a price provided by a single source. The fair value of securities is generally determined as the amount that the fund could reasonably expect to realize from an orderly disposition of such securities over a reasonable period of time. By its nature, a fair value price is a good faith estimate of the value of a security in a current sale and does not reflect an actual market price, which may be different by a material amount.
Joint trading account Pursuant to an exemptive order from the SEC, the fund may transfer uninvested cash balances into a joint trading account along with the cash of other registered investment companies and certain other accounts managed by Putnam Management. These balances may be invested in issues of short-term investments having maturities of up to 90 days.
Repurchase agreements The fund, or any joint trading account, through its custodian, receives delivery of the underlying securities, the fair value of which at the time of purchase is required to be in an amount at least equal to the resale price, including accrued interest. Collateral for certain tri-party repurchase agree-ments, which totaled $4,676,863 at the end of the reporting period, is held at the counterparty’s custodian in a segregated account for the benefit of the fund and the counterparty. Putnam Management is responsible for determining that the value of these underlying securities is at all times at least equal to the resale price, including accrued interest. In the event of default or bankruptcy by the other party to the agreement, retention of the collateral may be subject to legal proceedings.
Security transactions and related investment income Security transactions are recorded on the trade date (the date the order to buy or sell is executed). Gains or losses on securities sold are determined on the identified cost basis.
Interest income, net of any applicable withholding taxes and including amortiza-tion and accretion of premiums and discounts on debt securities, is recorded on the accrual basis.
Securities purchased or sold on a delayed delivery basis may be settled at a future date beyond customary settlement time; interest income is accrued based on the terms of the securities. Losses may arise due to changes in the fair value of the underlying securities or if the counterparty does not perform under the contract.
Stripped securities The fund may invest in stripped securities which represent a participation in securities that may be structured in classes with rights to receive different portions of the interest and principal. Interest-only securities receive all of the interest and principal-only securities receive all of the principal. If the interest-only securities experience greater than anticipated prepayments of prin-cipal, the fund may fail to recoup fully its initial investment in these securities. Conversely, principal-only securities increase in value if prepayments are greater than anticipated and decline if prepayments are slower than anticipated. The fair value of these securities is highly sensitive to changes in interest rates.
Foreign currency translation The accounting records of the fund are maintained in U.S. dollars. The fair value of foreign securities, currency holdings, and other assets and liabilities is recorded in the books and records of the fund after trans-lation to U.S. dollars based on the exchange rates on that day. The cost of each security is determined using historical exchange rates. Income and withholding taxes are translated at prevailing exchange rates when earned or incurred. The fund does not isolate that portion of realized or unrealized gains or losses resulting from changes in the foreign exchange rate on investments from fluctuations arising from changes in the market prices of the securities. Such gains and losses are included with the net realized and unrealized gain or loss on investments. Net realized gains and losses on foreign currency transactions represent net realized exchange gains or losses on disposition of foreign currencies, currency gains and losses realized between the trade and settlement dates on securities transac-tions and the difference between the amount of investment income and foreign withholding taxes recorded on the fund’s books and the U.S. dollar equivalent amounts actually received or paid. Net unrealized appreciation and deprecia-tion of assets and liabilities in foreign currencies arise from changes in the value of assets and liabilities other than investments at the period end, resulting from changes in the exchange rate.
Options contracts The fund uses options contracts to hedge duration and convexity, to isolate prepayment risk, to gain exposure to interest rates, to hedge against changes in values of securities it owns, owned or expects to own, to hedge prepayment risk, to generate additional income for the portfolio, to enhance
returns on securities owned, to gain exposure to securities, and to manage down-side risks.
The potential risk to the fund is that the change in value of options contracts may not correspond to the change in value of the hedged instruments. In addition, losses may arise from changes in the value of the underlying instruments if there is an illiquid secondary market for the contracts, if interest or exchange rates move unexpectedly or if the counterparty to the contract is unable to perform. Realized gains and losses on purchased options are included in realized gains and losses on investment securities. If a written call option is exercised, the premium origi-nally received is recorded as an addition to sales proceeds. If a written put option is exercised, the premium originally received is recorded as a reduction to the cost of investments.
Exchange-traded options are valued at the last sale price or, if no sales are reported, the last bid price for purchased options and the last ask price for written options. OTC traded options are valued using prices supplied by dealers.
Options on swaps are similar to options on securities except that the premium paid or received is to buy or grant the right to enter into a previously agreed upon interest rate or credit default contract. Forward premium swap option contracts include premiums that have extended settlement dates. The delayed settlement of the premiums is factored into the daily valuation of the option contracts. In the case of interest rate cap and floor contracts, in return for a premium, ongoing payments between two parties are based on interest rates exceeding a specified rate, in the case of a cap contract, or falling below a specified rate in the case of a floor contract.
Written option contracts outstanding at period end, if any, are listed after the fund’s portfolio.Futures contracts The fund uses futures contracts to manage exposure to market risk, to hedge prepayment risk, to hedge interest rate risk, to gain exposure to interest rates, and to equitize cash.
The potential risk to the fund is that the change in value of futures contracts may not correspond to the change in value of the hedged instruments. In addition, losses may arise from changes in the value of the underlying instruments, if there is an illiquid secondary market for the contracts, if interest or exchange rates move unexpectedly or if the counterparty to the contract is unable to perform. With futures, there is minimal counterparty credit risk to the fund since futures are exchange traded and the exchange’s clearinghouse, as counterparty to all exchange traded futures, guarantees the futures against default. Risks may exceed amounts recognized on the Statement of assets and liabilities. When the contract is closed, the fund records a realized gain or loss equal to the difference between the value of the contract at the time it was opened and the value at the time it was closed.
Futures contracts are valued at the quoted daily settlement prices established by the exchange on which they trade. The fund and the broker agree to exchange an amount of cash equal to the daily fluctuation in the value of the futures contract. Such receipts or payments are known as “variation margin.”
Futures contracts outstanding at period end, if any, are listed after the fund’s portfolio.
Forward currency contracts The fund buys and sells forward currency contracts, which are agreements between two parties to buy and sell currencies at a set price on a future date. These contracts are used to hedge foreign exchange risk, and to gain exposure to currencies.
The U.S. dollar value of forward currency contracts is determined using current forward currency exchange rates supplied by a quotation service. The fair value of the contract will fluctuate with changes in currency exchange rates. The contract is marked to market daily and the change in fair value is recorded as an unreal-ized gain or loss. The fund records a realized gain or loss equal to the difference between the value of the contract at the time it was opened and the value at the time it was closed when the contract matures or by delivery of the currency. The fund could be exposed to risk if the value of the currency changes unfavorably, if the counterparties to the contracts are unable to meet the terms of their contracts or if the fund is unable to enter into a closing position. Risks may exceed amounts recognized on the Statement of assets and liabilities.
Forward currency contracts outstanding at period end, if any, are listed after the fund’s portfolio.
Interest rate swap contracts The fund entered into OTC and/or centrally cleared interest rate swap contracts, which are arrangements between two parties to exchange cash flows based on a notional principal amount, to hedge interest rate risk, to gain exposure on interest rates, and to hedge prepayment risk.
34 Putnam VT Multi-Asset Absolute Return Fund
An OTC and centrally cleared interest rate swap can be purchased or sold with an upfront premium. For OTC interest rate swap contracts, an upfront payment received by the fund is recorded as a liability on the fund’s books. An upfront payment made by the fund is recorded as an asset on the fund’s books. OTC and centrally cleared interest rate swap contracts are marked to market daily based upon quotations from an independent pricing service or market makers. Any change is recorded as an unrealized gain or loss on OTC interest rate swaps. Daily fluctuations in the value of centrally cleared interest rate swaps are settled through a central clearing agent and are recorded in variation margin on the Statement of assets and liabilities and recorded as unrealized gain or loss. Payments, including upfront premiums, received or made are recorded as realized gains or losses at the reset date or the closing of the contract. Certain OTC and centrally cleared interest rate swap contracts may include extended effective dates. Payments related to these swap contracts are accrued based on the terms of the contract.
The fund could be exposed to credit or market risk due to unfavorable changes in the fluctuation of interest rates or if the counterparty defaults, in the case of OTC interest rate contracts, or the central clearing agency or a clearing member defaults, in the case of centrally cleared interest rate swap contracts, on its respec-tive obligation to perform under the contract. The fund’s maximum risk of loss from counterparty risk or central clearing risk is the fair value of the contract. This risk may be mitigated for OTC interest rate swap contracts by having a master netting arrangement between the fund and the counterparty and for centrally cleared interest rate swap contracts through the daily exchange of vari-ation margin. There is minimal counterparty risk with respect to centrally cleared interest rate swap contracts due to the clearinghouse guarantee fund and other resources that are available in the event of a clearing member default. Risk of loss may exceed amounts recognized on the Statement of assets and liabilities.
OTC and centrally cleared interest rate swap contracts outstanding, including their respective notional amounts at period end, if any, are listed after the fund’s portfolio.
Total return swap contracts The fund entered into OTC and/or centrally cleared total return swap contracts, which are arrangements to exchange a market-linked return for a periodic payment, both based on a notional principal amount, to hedge sector exposure, to manage exposure to specific sectors or industries, to manage exposure to specific securities, to gain exposure to a basket of securities, to gain exposure to specific markets or countries, and to gain exposure to specific sectors or industries.
To the extent that the total return of the security, index or other financial measure underlying the transaction exceeds or falls short of the offsetting interest rate obligation, the fund will receive a payment from or make a payment to the coun-terparty. OTC and/or centrally cleared total return swap contracts are marked to market daily based upon quotations from an independent pricing service or market maker. Any change is recorded as an unrealized gain or loss on OTC total return swaps. Daily fluctuations in the value of centrally cleared total return swaps are settled through a central clearing agent and are recorded in variation margin on the Statement of assets and liabilities and recorded as unrealized gain or loss. Payments received or made are recorded as realized gains or losses. Certain OTC and/or centrally cleared total return swap contracts may include extended effec-tive dates. Payments related to these swap contracts are accrued based on the terms of the contract. The fund could be exposed to credit or market risk due to unfavorable changes in the fluctuation of interest rates or in the price of the under-lying security or index, the possibility that there is no liquid market for these agree-ments or that the counterparty may default on its obligation to perform. The fund’s maximum risk of loss from counterparty risk or central clearing risk is the fair value of the contract. This risk may be mitigated for OTC total return swap contracts by having a master netting arrangement between the fund and the counterparty and for centrally cleared total return swap contracts through the daily exchange of variation margin. There is minimal counterparty risk with respect to centrally cleared total return swap contracts due to the clearinghouse guarantee fund and other resources that are available in the event of a clearing member default. Risk of loss may exceed amounts recognized on the Statement of assets and liabilities.
OTC and/or centrally cleared total return swap contracts outstanding, including their respective notional amounts at period end, if any, are listed after the fund’s portfolio.
Credit default contracts The fund entered into OTC and/or centrally cleared credit default contracts to hedge credit risk, to hedge market risk, and to gain exposure on individual names and/or baskets of securities.
In OTC and centrally cleared credit default contracts, the protection buyer typically makes a periodic stream of payments to a counterparty, the protection seller, in exchange for the right to receive a contingent payment upon the occurrence of a
credit event on the reference obligation or all other equally ranked obligations of the reference entity. Credit events are contract specific but may include bankruptcy, failure to pay, restructuring and obligation acceleration. For OTC credit default contracts, an upfront payment received by the fund is recorded as a liability on the fund’s books. An upfront payment made by the fund is recorded as an asset on the fund’s books. Centrally cleared credit default contracts provide the same rights to the protection buyer and seller except the payments between parties, including upfront premiums, are settled through a central clearing agent through variation margin payments. Upfront and periodic payments received or paid by the fund for OTC and centrally cleared credit default contracts are recorded as realized gains or losses at the reset date or close of the contract. The OTC and centrally cleared credit default contracts are marked to market daily based upon quotations from an inde-pendent pricing service or market makers. Any change in value of OTC credit default contracts is recorded as an unrealized gain or loss. Daily fluctuations in the value of centrally cleared credit default contracts are recorded in variation margin on the Statement of assets and liabilities and recorded as unrealized gain or loss. Upon the occurrence of a credit event, the difference between the par value and fair value of the reference obligation, net of any proportional amount of the upfront payment, is recorded as a realized gain or loss.
In addition to bearing the risk that the credit event will occur, the fund could be exposed to market risk due to unfavorable changes in interest rates or in the price of the underlying security or index or the possibility that the fund may be unable to close out its position at the same time or at the same price as if it had purchased the underlying reference obligations. In certain circumstances, the fund may enter into offsetting OTC and centrally cleared credit default contracts which would mitigate its risk of loss. Risks of loss may exceed amounts recognized on the Statement of assets and liabilities. The fund’s maximum risk of loss from coun-terparty risk, either as the protection seller or as the protection buyer, is the fair value of the contract. This risk may be mitigated for OTC credit default contracts by having a master netting arrangement between the fund and the counterparty and for centrally cleared credit default contracts through the daily exchange of varia-tion margin. Counterparty risk is further mitigated with respect to centrally cleared credit default swap contracts due to the clearinghouse guarantee fund and other resources that are available in the event of a clearing member default. Where the fund is a seller of protection, the maximum potential amount of future payments the fund may be required to make is equal to the notional amount.
OTC and centrally cleared credit default contracts outstanding, including their respective notional amounts at period end, if any, are listed after the fund’s portfolio.
TBA commitments The fund may enter into TBA (to be announced) commit-ments to purchase securities for a fixed unit price at a future date beyond customary settlement time. Although the unit price and par amount have been established, the actual securities have not been specified. However, it is antici-pated that the amount of the commitments will not significantly differ from the principal amount. The fund holds, and maintains until settlement date, cash or high-grade debt obligations in an amount sufficient to meet the purchase price, or the fund may enter into offsetting contracts for the forward sale of other securities it owns. Income on the securities will not be earned until settlement date.
The fund may also enter into TBA sale commitments to hedge its portfolio posi-tions, to sell mortgage-backed securities it owns under delayed delivery arrange-ments or to take a short position in mortgage-backed securities. Proceeds of TBA sale commitments are not received until the contractual settlement date. During the time a TBA sale commitment is outstanding, either equivalent deliverable securities or an offsetting TBA purchase commitment deliverable on or before the sale commitment date are held as “cover” for the transaction, or other liquid assets in an amount equal to the notional value of the TBA sale commitment are segregated. If the TBA sale commitment is closed through the acquisition of an offsetting TBA purchase commitment, the fund realizes a gain or loss. If the fund delivers securities under the commitment, the fund realizes a gain or a loss from the sale of the securities based upon the unit price established at the date the commitment was entered into.
TBA commitments, which are accounted for as purchase and sale transactions, may be considered securities themselves, and involve a risk of loss due to changes in the value of the security prior to the settlement date as well as the risk that the counterparty to the transaction will not perform its obligations. Counterparty risk is mitigated by having a master agreement between the fund and the counterparty.
Unsettled TBA commitments are valued at their fair value according to the proce-dures described under “Security valuation” above. The contract is marked to market daily and the change in fair value is recorded by the fund as an unrealized gain or loss. Based on market circumstances, Putnam Management will determine
Putnam VT Multi-Asset Absolute Return Fund 35
whether to take delivery of the underlying securities or to dispose of the TBA commitments prior to settlement.
TBA purchase commitments outstanding at period end, if any, are listed within the fund’s portfolio and TBA sale commitments outstanding at period end, if any, are listed after the fund’s portfolio.
Master agreements The fund is a party to ISDA (International Swaps and Derivatives Association, Inc.) Master Agreements that govern OTC derivative and foreign exchange contracts and Master Securities Forward Transaction Agreements that govern transactions involving mortgage-backed and other asset-backed securities that may result in delayed delivery (Master Agreements) with certain counterparties entered into from time to time. The Master Agreements may contain provisions regarding, among other things, the parties’ general obli-gations, representations, agreements, collateral requirements, events of default and early termination. With respect to certain counterparties, in accordance with the terms of the Master Agreements, collateral posted to the fund is held in a segre-gated account by the fund’s custodian and, with respect to those amounts which can be sold or repledged, are presented in the fund’s portfolio.
Collateral pledged by the fund is segregated by the fund’s custodian and identi-fied in the fund’s portfolio. Collateral can be in the form of cash or debt securities issued by the U.S. Government or related agencies or other securities as agreed to by the fund and the applicable counterparty. Collateral requirements are determined based on the fund’s net position with each counterparty.
With respect to ISDA Master Agreements, termination events applicable to the fund may occur upon a decline in the fund’s net assets below a specified threshold over a certain period of time. Termination events applicable to counterparties may occur upon a decline in the counterparty’s long-term or short-term credit ratings below a specified level. In each case, upon occurrence, the other party may elect to terminate early and cause settlement of all derivative and foreign exchange contracts outstanding, including the payment of any losses and costs resulting from such early termination, as reasonably determined by the terminating party. Any decision by one or more of the fund’s counterparties to elect early termination could impact the fund’s future derivative activity
At the close of the reporting period, the fund had a net liability position of $478,222 on open derivative contracts subject to the Master Agreements. Collateral posted by the fund at period end for these agreements totaled $110,745 and may include amounts related to unsettled agreements.
Securities lending The fund may lend securities, through its agent, to qualified borrowers in order to earn additional income. The loans are collateralized by cash in an amount at least equal to the fair value of the securities loaned. The fair value of securities loaned is determined daily and any additional required collateral is allocated to the fund on the next business day. The remaining maturities of the securities lending transactions are considered overnight and continuous. The risk of borrower default will be borne by the fund’s agent; the fund will bear the risk of loss with respect to the investment of the cash collateral. Income from securi-ties lending, net of expenses, is included in investment income on the Statement of operations. Cash collateral is invested in Putnam Cash Collateral Pool, LLC, a limited liability company managed by an affiliate of Putnam Management. Investments in Putnam Cash Collateral Pool, LLC are valued at its closing net asset value each business day. There are no management fees charged to Putnam Cash Collateral Pool, LLC. At the close of the reporting period, the fund received cash collateral of $364,500and the value of securities loaned amounted to $357,780.
Interfund lending The fund, along with other Putnam funds, may participate in an interfund lending program pursuant to an exemptive order issued by the SEC. This program allows the fund to borrow from or lend to other Putnam funds that permit such transactions. Interfund lending transactions are subject to each fund’s investment policies and borrowing and lending limits. Interest earned or paid on the interfund lending transaction will be based on the average of certain current market rates. During the reporting period, the fund did not utilize the program.
Lines of credit The fund participates, along with other Putnam funds, in a $317.5 million unsecured committed line of credit and a $235.5 million unsecured uncommitted line of credit, both provided by State Street. Borrowings may be made for temporary or emergency purposes, including the funding of shareholder redemption requests and trade settlements. Interest is charged to the fund based on the fund’s borrowing at a rate equal to 1.25% plus the higher of (1) the Federal Funds rate and (2) the overnight LIBOR for the committed line of credit and the Federal Funds rate plus 1.30% for the uncommitted line of credit. A closing fee equal to 0.04% of the committed line of credit and 0.04% of the uncommitted line of credit has been paid by the participating funds. In addition, a commit-ment fee of 0.21% per annum on any unutilized portion of the committed line of credit is allocated to the participating funds based on their relative net assets and
paid quarterly. During the reporting period, the fund had no borrowings against these arrangements.
Federal taxes It is the policy of the fund to distribute all of its taxable income within the prescribed time period and otherwise comply with the provisions of the Internal Revenue Code of 1986, as amended (the Code), applicable to regulated investment companies. It is also the intention of the fund to distribute an amount sufficient to avoid imposition of any excise tax under Section 4982 of the Code.
The fund is subject to the provisions of Accounting Standards Codification 740 Income Taxes (ASC 740). ASC 740 sets forth a minimum threshold for financial statement recognition of the benefit of a tax position taken or expected to be taken in a tax return. The fund did not have a liability to record for any unrecog-nized tax benefits in the accompanying financial statements. No provision has been made for federal taxes on income, capital gains or unrealized appreciation on securities held nor for excise tax on income and capital gains. Each of the fund’s federal tax returns for the prior three fiscal years remains subject to examination by the Internal Revenue Service.
The fund may also be subject to taxes imposed by governments of countries in which it invests. Such taxes are generally based on either income or gains earned or repatriated. The fund accrues and applies such taxes to net investment income, net realized gains and net unrealized gains as income and/or capital gains are earned. In some cases, the fund may be entitled to reclaim all or a portion of such taxes, and such reclaim amounts, if any, are reflected as an asset on the fund’s books. In many cases, however, the fund may not receive such amounts for an extended period of time, depending on the country of investment.
Under the Regulated Investment Company Modernization Act of 2010, the fund will be permitted to carry forward capital losses incurred for an unlimited period and the carry forwards will retain their character as either short-term or long-term capital losses. At December 31, 2018, the fund had the following capital loss carry-overs available, to the extent allowed by the Code, to offset future net capital gain, if any:
Loss carryoverShort-term Long-term Total
$1,258,297 $— $1,258,297
Tax cost of investments includes adjustments to net unrealized appreciation (depreciation) which may not necessarily be final tax cost basis adjustments, but closely approximate the tax basis unrealized gains and losses that may be realized and distributed to shareholders. The aggregate identified cost on a tax basis is $31,120,774, resulting in gross unrealized appreciation and deprecia-tion of $46,123,338 and $45,957,146, respectively, or net unrealized appreciation of $166,192.
Distributions to shareholders Distributions to shareholders from net invest-ment income are recorded by the fund on the ex-dividend date. Distributions from capital gains, if any, are recorded on the ex-dividend date and paid at least annually. Effective with the December 2018 distributions, the fund established targeted distribution rates, whose principal source of the distribution is ordi-nary income. However, the balance of the distribution, if any, comes first from capital gain and then will constitute a return of capital. A return of capital is not taxable; rather it reduces a shareholder’s tax basis in their shares of the fund. The fund may make return of capital distributions to achieve the targeted distribution rates. The amount and character of income and gains to be distributed are deter-mined in accordance with income tax regulations, which may differ from generally accepted accounting principles. Dividend sources are estimated at the time of declaration. Actual results may vary. Any non-taxable return of capital cannot be determined until final tax calculations are completed after the end of the fund’s fiscal year. Reclassifications are made to the fund’s capital accounts to reflect income and gains available for distribution (or available capital loss carryovers) under income tax regulations.
Expenses of the Trust Expenses directly charged or attributable to any fund will be paid from the assets of that fund. Generally, expenses of the Trust will be allo-cated among and charged to the assets of each fund on a basis that the Trustees deem fair and equitable, which may be based on the relative assets of each fund or the nature of the services performed and relative applicability to each fund.
Beneficial interest At the close of the reporting period, insurance companies or their separate accounts were record owners of all but a de minimis number of the shares of the fund. Approximately 53.6% of the fund is owned by accounts of one insurance company.
36 Putnam VT Multi-Asset Absolute Return Fund
Note 2 — Management fee, administrative services and other transactionsThe fund pays Putnam Management a management fee (based on the fund’s average net assets and computed and paid monthly) at annual rates that may vary based on the average of the aggregate net assets of all open-end mutual funds sponsored by Putnam Management (excluding net assets of funds that are invested in, or that are invested in by, other Putnam funds to the extent necessary to avoid “double counting” of those assets). Such annual rates may vary as follows:
0.880% of the first $5 billion,0.830% of the next $5 billion,0.780% of the next $10 billion,0.730% of the next $10 billion,0.680% of the next $50 billion,0.660% of the next $50 billion,0.650% of the next $100 billion and0.645% of any excess thereafter.
For the reporting period, the management fee represented an effective rate (excluding the impact from any expense waivers in effect) of 0.358% of the fund’s average net assets.
Putnam Management has contractually agreed to waive fees (and, to the extent necessary, bear other expenses) of the fund through April 30, 2021, to the extent that total expenses of the fund (excluding brokerage, interest, taxes, invest-ment-related expenses, payments under distribution plans, extraordinary expenses and acquired fund fees and expenses) would exceed an annual rate of 0.90% of the fund’s average net assets. During the reporting period, the fund’s expenses were reduced by $12,610 as a result of this limit.
Putnam Management has also contractually agreed, through April 30, 2021, to waive fees and/or reimburse the fund’s expenses to the extent necessary to limit the cumulative expenses of the fund, exclusive of brokerage, interest, taxes, invest-ment-related expenses, extraordinary expenses, acquired fund fees and expenses and payments under the fund’s investor servicing contract, investment manage-ment contract and distribution plans, on a fiscal year-to-date basis to an annual rate of 0.20% of the fund’s average net assets over such fiscal year-to-date period. During the reporting period, the fund’s expenses were reduced by $50,588 as a result of this limit.
Putnam Investments Limited (PIL), an affiliate of Putnam Management, is autho-rized by the Trustees to manage a separate portion of the assets of the fund as determined by Putnam Management from time to time. PIL did not manage any portion of the assets of the fund during the reporting period. If Putnam Management were to engage the services of PIL, Putnam Management would pay a quarterly sub-management fee to PIL for its services at an annual rate of 0.35% of the average net assets of the portion of the fund managed by PIL.
The Putnam Advisory Company, LLC (PAC), an affiliate of Putnam Management, is authorized by the Trustees to manage a separate portion of the assets of the fund, as designated from time to time by Putnam Management or PIL. PAC did not manage any portion of the assets of the fund during the reporting period. If Putnam Management or PIL were to engage the services of PAC, Putnam Management or PIL, as applicable, would pay a quarterly sub-advisory fee to PAC for its services at the annual rate of 0.35% of the average net assets of the portion of the fund’s assets for which PAC is engaged as sub-adviser.
The fund reimburses Putnam Management an allocated amount for the compen-sation and related expenses of certain officers of the fund and their staff who provide administrative services to the fund. The aggregate amount of all such reimbursements is determined annually by the Trustees.
Custodial functions for the fund’s assets are provided by State Street. Custody fees are based on the fund’s asset level, the number of its security holdings and transaction volumes.
Putnam Investor Services, Inc., an affiliate of Putnam Management, provides investor servicing agent functions to the fund. Putnam Investor Services, Inc. was paid a monthly fee for investor servicing at an annual rate of 0.07% of the fund’s
average daily net assets. During the reporting period, the expenses for each class of shares related to investor servicing fees were as follows:
Class IA $4Class IB 9,686
Total $9,690
The fund has entered into expense offset arrangements with Putnam Investor Services, Inc. and State Street whereby Putnam Investor Services, Inc.’s and State Street’s fees are reduced by credits allowed on cash balances. The fund also reduced expenses through brokerage/service arrangements. For the reporting period, the fund’s expenses were reduced by $57 under the expense offset arrangements and by $868 under the brokerage/service arrangements.
Each Independent Trustee of the fund receives an annual Trustee fee, of which $20, as a quarterly retainer, has been allocated to the fund, and an additional fee for each Trustees meeting attended. Trustees also are reimbursed for expenses they incur relating to their services as Trustees.
The fund has adopted a Trustee Fee Deferral Plan (the Deferral Plan) which allows the Trustees to defer the receipt of all or a portion of Trustees fees payable on or after July 1, 1995. The deferred fees remain invested in certain Putnam funds until distribution in accordance with the Deferral Plan.
The fund has adopted an unfunded noncontributory defined benefit pension plan (the Pension Plan) covering all Trustees of the fund who have served as a Trustee for at least five years and were first elected prior to 2004. Benefits under the Pension Plan are equal to 50% of the Trustee’s average annual attendance and retainer fees for the three years ended December 31, 2005. The retirement benefit is payable during a Trustee’s lifetime, beginning the year following retirement, for the number of years of service through December 31, 2006. Pension expense for the fund is included in Trustee compensation and expenses in the Statement of operations. Accrued pension liability is included in Payable for Trustee compen-sation and expenses in the Statement of assets and liabilities. The Trustees have terminated the Pension Plan with respect to any Trustee first elected after 2003.
The fund has adopted a distribution plan (the Plan) with respect to its class IB shares pursuant to Rule 12b–1 under the Investment Company Act of 1940. The purpose of the Plan is to compensate Putnam Retail Management Limited Partnership, an indirect wholly-owned subsidiary of Putnam Investments, LLC, for services provided and expenses incurred in distributing shares of the fund. The Plan provides for payment by the fund to Putnam Retail Management Limited Partnership at an annual rate of up to 0.35% of the average net assets attributable to the fund’s class IB shares. The Trustees have approved payment by the fund at an annual rate of 0.25% of the average net assets attributable to the fund’s class IB shares. The expenses related to distribution fees during the reporting period are included in Distribution fees in the Statement of operations.
Note 3 — Purchases and sales of securitiesDuring the reporting period, the cost of purchases and the proceeds from sales, excluding short-term investments, were as follows:
Cost of purchases
Proceeds from sales
Investments in securities, including TBA commitments (Long-term) $36,087,971 $33,923,894U.S. government securities (Long-term) — —Total $36,087,971 $33,923,894
The fund may purchase or sell investments from or to other Putnam funds in the ordinary course of business, which can reduce the fund’s transaction costs, at prices determined in accordance with SEC requirements and policies approved by the Trustees. During the reporting period, purchases or sales of long-term secu-rities from or to other Putnam funds, if any, did not represent more than 5% of the fund’s total cost of purchases and/or total proceeds from sales.
Putnam VT Multi-Asset Absolute Return Fund 37
Note 4 — Capital sharesAt the close of the reporting period, there were an unlimited number of shares of beneficial interest authorized. Subscriptions and redemptions are presented at the omnibus level. Transactions in capital shares were as follows:
Class IA shares Class IB sharesSix months ended 6/30/19 Year ended 12/31/18 Six months ended 6/30/19 Year ended 12/31/18
Shares Amount Shares Amount Shares Amount Shares AmountShares sold — $— — $— 188,624 $1,891,617 349,480 $3,511,771Shares issued in connection with reinvestment of distributions — — 85 862 — — 133,025 1,328,925
— — 85 862 188,624 1,891,617 482,505 4,840,696Shares repurchased — — (654 ) (6,593 ) (300,945 ) (2,981,695 ) (689,651 ) (6,968,672 )Net decrease — $— (569 ) $(5,731 ) (112,321 ) $(1,090,078 ) (207,146 ) $(2,127,976 )
At the close of the reporting period, Putnam Investments, LLC owned the following shares of the fund:
Shares ownedPercentage
of ownership ValueClass IA 1,134 89.50% $11,782
Note 5 — Affiliated transactionsTransactions during the reporting period with any company which is under common ownership or control were as follows:
Name of affiliateFair value as of
12/31/18 Purchase cost Sale proceeds Investment income
Shares outstanding and fair value as of
6/30/19Short-term investmentsPutnam Cash Collateral Pool, LLC* $42,600 $13,466,810 $13,144,910 $14,868 $364,500Putnam Short Term Investment Fund** 6,110,990 598,190 403,956 113,132 6,305,224Total Short-term investments $6,153,590 $14,065,000 $13,548,866 $128,000 $6,669,724
* No management fees are charged to Putnam Cash Collateral Pool, LLC (Note 1). Investment income shown is included in securities lending income on the Statement of operations. There were no realized or unrealized gains or losses during the period.
** Management fees charged to Putnam Short Term Investment Fund have been waived by Putnam Management. There were no realized or unrealized gains or losses during the period.
Note 6 — Market, credit and other risksIn the normal course of business, the fund trades financial instruments and enters into financial transactions where risk of potential loss exists due to changes in the market (market risk) or failure of the contracting party to the transaction to perform (credit risk). The fund may be exposed to additional credit risk that an institution or other entity with which the fund has unsettled or open transactions will default. Investments in foreign securities involve certain risks, including those related to economic instability, unfavorable political developments, and currency fluctuations.
The fund may invest in higher-yielding, lower-rated bonds that may have a higher rate of default. The fund may invest a significant portion of its assets in securitized debt instruments, including mortgage-backed and asset-backed investments. The yields and values of these investments are sensitive to changes in interest rates, the rate of principal payments on the underlying assets and the market’s perception of the issuers. The market for these investments may be volatile and limited, which may make them difficult to buy or sell.
Note 7 — Summary of derivative activityThe volume of activity for the reporting period for any derivative type that was held during the period is listed below and was based on an average of the holdings at the end of each fiscal quarter:
Purchased equity option contracts (contract amount) $15,000Purchased currency option contracts (contract amount) $1,300,000Purchased swap option contracts (contract amount) $74,000Written equity option contracts (contract amount) $6,000Written currency option contracts (contract amount) $1,600,000Written swap option contracts (contract amount) $71,000Futures contracts (number of contracts) 100Forward currency contracts (contract amount) $14,400,000Centrally cleared interest rate swap contracts (notional) $26,400,000OTC total return swap contracts (notional) $91,000,000OTC credit default contracts (notional) $3,500,000Centrally cleared credit default contracts (notional) $6,200,000Warrants (number of warrants) 85,000
38 Putnam VT Multi-Asset Absolute Return Fund
The following is a summary of the fair value of derivative instruments as of the close of the reporting period:
Fair value of derivative instruments as of the close of the reporting period
Asset derivatives Liability derivativesDerivatives not accounted for as hedging instruments under ASC 815
Statement of assets and liabilities location Fair value
Statement of assets and liabilities location Fair value
Credit contractsReceivables, Net assets —
Unrealized appreciation $294,222 *Payables, Net assets —
Unrealized depreciation $443,636 *Foreign exchange contracts Investments, Receivables 44,623 Payables 99,022
Equity contracts
Investments, Receivables, Net assets — Unrealized
appreciation 1,279,499 *Payables, Net assets —
Unrealized depreciation 1,131,673 *
Interest rate contracts
Investments, Receivables, Net assets — Unrealized
appreciation 263,975 *Payables, Net assets —
Unrealized depreciation 39,735 *Total $1,882,319 $1,714,066
* Includes cumulative appreciation/depreciation of futures contracts and/or centrally cleared swaps as reported in the fund’s portfolio. Only current day’s variation margin is reported within the Statement of assets and liabilities.
The following is a summary of realized and change in unrealized gains or losses of derivative instruments in the Statement of operations for the reporting period (Note 1):
Amount of realized gain or (loss) on derivatives recognized in net gain or (loss) on investments
Derivatives not accounted for as hedging instruments under ASC 815 Warrants Options Futures
Forward currency
contracts Swaps TotalCredit contracts $— $— $— $— $89,094 $89,094Foreign exchange contracts — 3,053 — (1,301 ) — 1,752Equity contracts (7,540 ) (89,370 ) (112,906 ) — 686,125 476,309Interest rate contracts — 123 558,108 — 121,976 680,207Total $(7,540 ) $(86,194 ) $445,202 $(1,301 ) $897,195 $1,247,362
Change in unrealized appreciation or (depreciation) on derivatives recognized in net gain or (loss) on investments
Derivatives not accounted for as hedging instruments under ASC 815 Warrants Options Futures
Forward currency
contracts Swaps TotalCredit contracts $— $— $— $— $197,504 $197,504Foreign exchange contracts — (19 ) — 15,332 — $15,313Equity contracts 46,472 (133,219 ) 141,151 — (564,809 ) $(510,405 )Interest rate contracts — (690 ) (163,338 ) — 8,687 $(155,341 )Total $46,472 $(133,928 ) $(22,187 ) $15,332 $(358,618 ) $(452,929 )

Putnam VT Multi-Asset Absolute Return Fund 39
This page intentionally left blank.
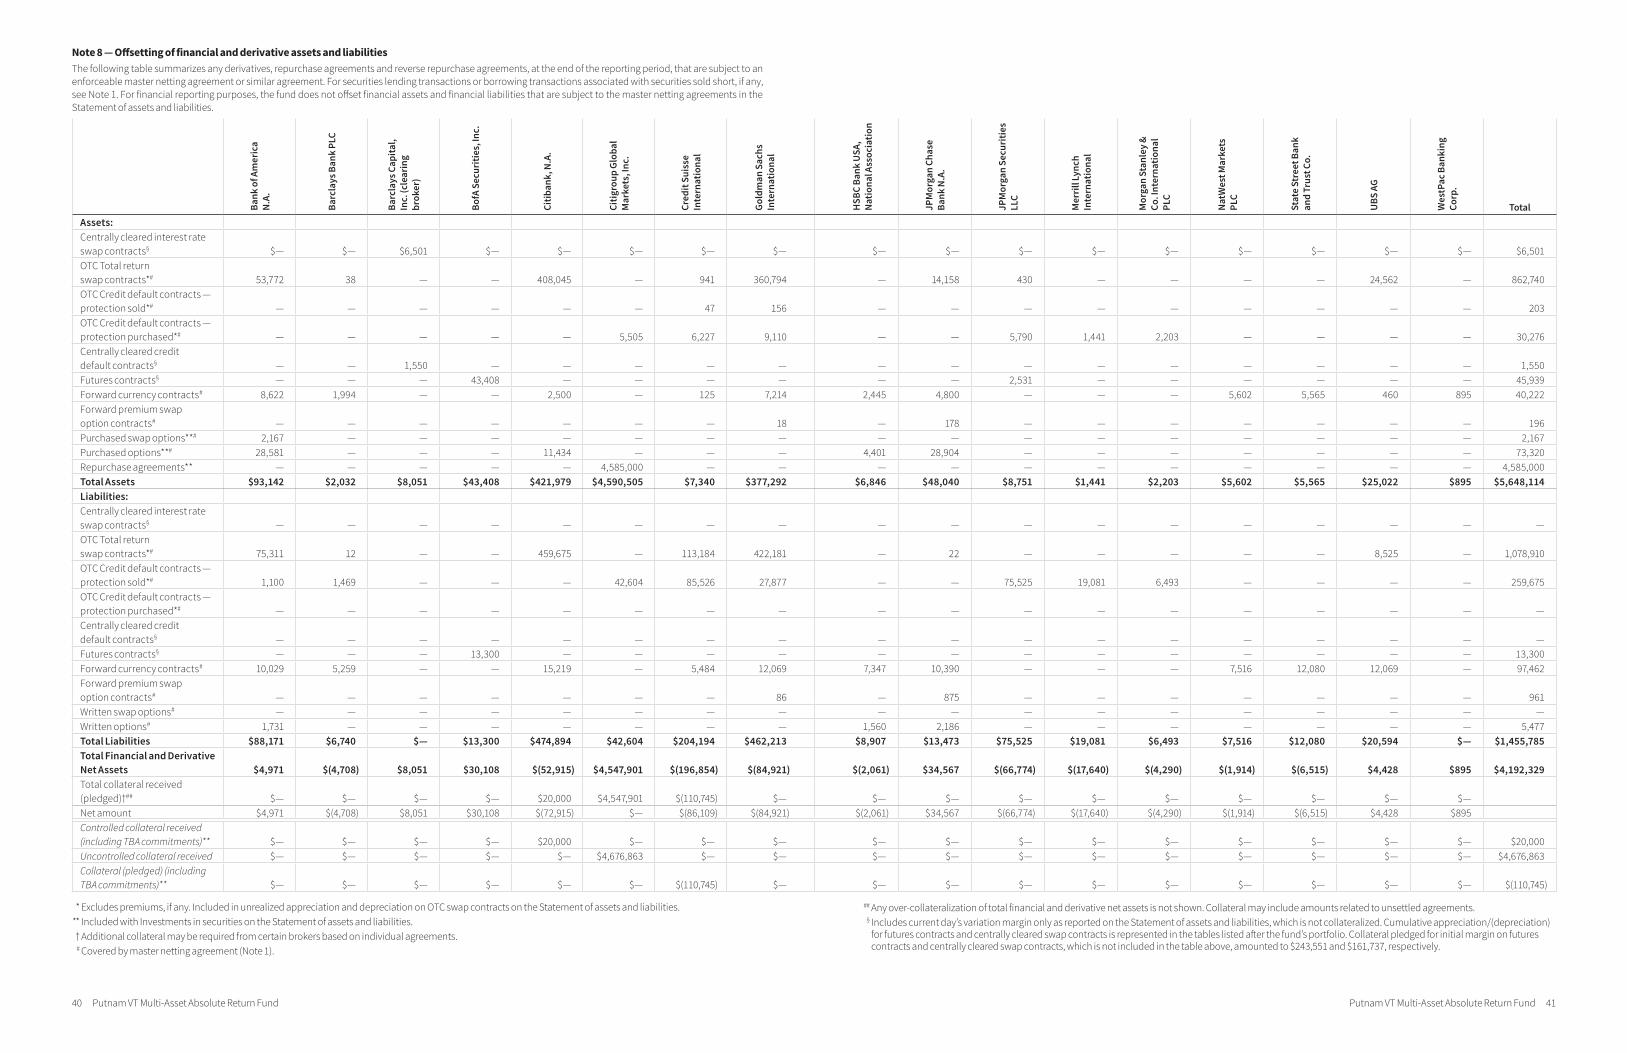
40 Putnam VT Multi-Asset Absolute Return Fund Putnam VT Multi-Asset Absolute Return Fund 41
Note 8 — Offsetting of financial and derivative assets and liabilitiesThe following table summarizes any derivatives, repurchase agreements and reverse repurchase agreements, at the end of the reporting period, that are subject to an enforceable master netting agreement or similar agreement. For securities lending transactions or borrowing transactions associated with securities sold short, if any, see Note 1. For financial reporting purposes, the fund does not offset financial assets and financial liabilities that are subject to the master netting agreements in the Statement of assets and liabilities.
Bank
of A
mer
ica
N.A
.
Barc
lays
Ban
k PL
C
Barc
lays
Cap
ital,
Inc.
(cle
arin
g br
oker
)
BofA
Sec
uriti
es, I
nc.
Citib
ank,
N.A
.
Citig
roup
Glo
bal
Mar
kets
, Inc
.
Cred
it Su
isse
In
tern
atio
nal
Gold
man
Sac
hs
Inte
rnat
iona
l
HSB
C Ba
nk U
SA,
Nat
iona
l Ass
ocia
tion
JPM
orga
n Ch
ase
Bank
N.A
.
JPM
orga
n Se
curit
ies
LLC
Mer
rill L
ynch
In
tern
atio
nal
Mor
gan
Stan
ley
& Co
. Int
erna
tiona
l PL
C
Nat
Wes
t Mar
kets
PL
C
Stat
e St
reet
Ban
k an
d Tr
ust C
o.
UBS
AG
Wes
tPac
Ban
king
Co
rp.
TotalAssets:Centrally cleared interest rate swap contracts§ $— $— $6,501 $— $— $— $— $— $— $— $— $— $— $— $— $— $— $6,501OTC Total return swap contracts*# 53,772 38 — — 408,045 — 941 360,794 — 14,158 430 — — — — 24,562 — 862,740OTC Credit default contracts — protection sold*# — — — — — — 47 156 — — — — — — — — — 203OTC Credit default contracts — protection purchased*# — — — — — 5,505 6,227 9,110 — — 5,790 1,441 2,203 — — — — 30,276Centrally cleared credit default contracts§ — — 1,550 — — — — — — — — — — — — — — 1,550Futures contracts§ — — — 43,408 — — — — — — 2,531 — — — — — — 45,939Forward currency contracts# 8,622 1,994 — — 2,500 — 125 7,214 2,445 4,800 — — — 5,602 5,565 460 895 40,222Forward premium swap option contracts# — — — — — — — 18 — 178 — — — — — — — 196Purchased swap options**# 2,167 — — — — — — — — — — — — — — — — 2,167Purchased options**# 28,581 — — — 11,434 — — — 4,401 28,904 — — — — — — — 73,320Repurchase agreements** — — — — — 4,585,000 — — — — — — — — — — — 4,585,000Total Assets $93,142 $2,032 $8,051 $43,408 $421,979 $4,590,505 $7,340 $377,292 $6,846 $48,040 $8,751 $1,441 $2,203 $5,602 $5,565 $25,022 $895 $5,648,114Liabilities:Centrally cleared interest rate swap contracts§ — — — — — — — — — — — — — — — — — —OTC Total return swap contracts*# 75,311 12 — — 459,675 — 113,184 422,181 — 22 — — — — — 8,525 — 1,078,910OTC Credit default contracts — protection sold*# 1,100 1,469 — — — 42,604 85,526 27,877 — — 75,525 19,081 6,493 — — — — 259,675OTC Credit default contracts — protection purchased*# — — — — — — — — — — — — — — — — — —Centrally cleared credit default contracts§ — — — — — — — — — — — — — — — — — —Futures contracts§ — — — 13,300 — — — — — — — — — — — — — 13,300Forward currency contracts# 10,029 5,259 — — 15,219 — 5,484 12,069 7,347 10,390 — — — 7,516 12,080 12,069 — 97,462Forward premium swap option contracts# — — — — — — — 86 — 875 — — — — — — — 961Written swap options# — — — — — — — — — — — — — — — — — —Written options# 1,731 — — — — — — — 1,560 2,186 — — — — — — — 5,477Total Liabilities $88,171 $6,740 $— $13,300 $474,894 $42,604 $204,194 $462,213 $8,907 $13,473 $75,525 $19,081 $6,493 $7,516 $12,080 $20,594 $— $1,455,785Total Financial and Derivative Net Assets $4,971 $(4,708) $8,051 $30,108 $(52,915) $4,547,901 $(196,854) $(84,921) $(2,061) $34,567 $(66,774) $(17,640) $(4,290) $(1,914) $(6,515) $4,428 $895 $4,192,329Total collateral received (pledged)†## $— $— $— $— $20,000 $4,547,901 $(110,745) $— $— $— $— $— $— $— $— $— $—Net amount $4,971 $(4,708) $8,051 $30,108 $(72,915) $— $(86,109) $(84,921) $(2,061) $34,567 $(66,774) $(17,640) $(4,290) $(1,914) $(6,515) $4,428 $895Controlled collateral received (including TBA commitments)** $— $— $— $— $20,000 $— $— $— $— $— $— $— $— $— $— $— $— $20,000Uncontrolled collateral received $— $— $— $— $— $4,676,863 $— $— $— $— $— $— $— $— $— $— $— $4,676,863Collateral (pledged) (including TBA commitments)** $— $— $— $— $— $— $(110,745) $— $— $— $— $— $— $— $— $— $— $(110,745)
* Excludes premiums, if any. Included in unrealized appreciation and depreciation on OTC swap contracts on the Statement of assets and liabilities.** Included with Investments in securities on the Statement of assets and liabilities.† Additional collateral may be required from certain brokers based on individual agreements.# Covered by master netting agreement (Note 1).
## Any over-collateralization of total financial and derivative net assets is not shown. Collateral may include amounts related to unsettled agreements.§ Includes current day’s variation margin only as reported on the Statement of assets and liabilities, which is not collateralized. Cumulative appreciation/(depreciation)
for futures contracts and centrally cleared swap contracts is represented in the tables listed after the fund’s portfolio. Collateral pledged for initial margin on futures contracts and centrally cleared swap contracts, which is not included in the table above, amounted to $243,551 and $161,737, respectively.

42 Putnam VT Multi-Asset Absolute Return Fund
Note 9 — New accounting pronouncementsIn March 2017, the Financial Accounting Standards Board issued Accounting Standards Update (ASU) No. 2017–08, Receivables—Nonrefundable Fees and Other Costs (Subtopic 310–20): Premium Amortization on Purchased Callable Debt Securities. The amendments in the ASU shorten the amortization period for certain callable debt securities held at a premium, to be amortized to the earliest call date. The ASU is effective for fiscal years and interim periods within those fiscal years beginning after December 15, 2018. The adoption of these amendments is not material to the financials statements.
Putnam VT Multi-Asset Absolute Return Fund 43
General conclusionsThe Board of Trustees of The Putnam Funds oversees the management of each fund and, as required by law, determines annually whether to approve the continuance of your fund’s management contract with Putnam Investment Management, LLC (“Putnam Management”), the sub-management contract with respect to your fund between Putnam Management and its affiliate, Putnam Investments Limited (“PIL”), and the sub-advisory contract among Putnam Management, PIL, and another affiliate, The Putnam Advisory Company (“PAC”). The Board, with the assistance of its Contract Committee, requests and evaluates all information it deems reasonably necessary under the circumstances in connection with its annual contract review. The Contract Committee consists solely of Trustees who are not “interested persons” (as this term is defined in the Investment Company Act of 1940, as amended (the “1940 Act”)) of The Putnam Funds (“Independent Trustees”).
At the outset of the review process, members of the Board’s independent staff and independent legal counsel discussed with representatives of Putnam Management the annual contract review materials furnished to the Contract Committee during the course of the previous year’s review, identifying possible changes in these materials that might be necessary or desirable for the coming year. Following these discussions and in consultation with the Contract Committee, the Independent Trustees’ independent legal counsel requested that Putnam Management and its affiliates furnish specified information, together with any additional infor-mation that Putnam Management considered relevant, to the Contract Committee. Over the course of several months ending in June 2019, the Contract Committee met on a number of occasions with representatives of Putnam Management, and separately in executive session, to consider the information that Putnam Management provided. Throughout this process, the Contract Committee was assisted by the members of the Board’s independent staff and by independent legal counsel for The Putnam Funds and the Independent Trustees.
In May 2019, the Contract Committee met in executive session to discuss and consider its recommendations with respect to the continuance of the contracts. At the Trustees’ June 2019 meeting, the Contract Committee met in executive session with the other Independent Trustees to review a summary of the key financial, performance and other data that the Contract Committee considered in the course of its review. The Contract Committee then presented its written report, which summarized the key factors that the Committee had considered and set forth its recommen-dations. The Contract Committee recommended, and the Independent Trustees approved, the continuance of your fund’s management, sub-management and sub-advisory contracts, effective July 1, 2019. (Because PIL and PAC are affiliates of Putnam Management and Putnam Manage-ment remains fully responsible for all services provided by PIL and PAC, the Trustees have not attempted to evaluate PIL or PAC as separate entities, and all subsequent references to Putnam Management below should be deemed to include reference to PIL and PAC as necessary or appropriate in the context.)
The Independent Trustees’ approval was based on the following conclusions:
• That the fee schedule in effect for your fund represented reasonable compensation in light of the nature and quality of the services being provided to the fund, the fees paid by competitive funds, the costs incurred by Putnam Management in providing services to the fund, and the application of certain reductions and waivers noted below; and
• That the fee schedule in effect for your fund represented an appropriate sharing between fund shareholders and Putnam Management of such economies of scale as may exist in the management of the fund at current asset levels.
These conclusions were based on a comprehensive consideration of all information provided to the Trustees and were not the result of any single factor. Some of the factors that figured particularly in the Trustees’ delib-erations and how the Trustees considered these factors are described below, although individual Trustees may have evaluated the informa-tion presented differently, giving different weights to various factors. It is also important to recognize that the management arrangements for your fund and the other Putnam funds are the result of many years of review and discussion between the Independent Trustees and Putnam Management, that some aspects of the arrangements may receive greater scrutiny in some years than others, and that the Trustees’ conclu-sions may be based, in part, on their consideration of fee arrangements in previous years. For example, with some minor exceptions, the funds’ current fee arrangements under the management contracts were first implemented at the beginning of 2010 following extensive review by the Contract Committee and discussions with representatives of Putnam Management, as well as approval by shareholders.
Management fee schedules and total expensesThe Trustees reviewed the management fee schedules in effect for all Putnam funds, including fee levels and breakpoints. The Trustees also reviewed the total expenses of each Putnam fund, recognizing that in most cases management fees represented the major, but not the sole, determinant of total costs to fund shareholders. (Two funds have imple-mented so-called “all-in” management fees covering substantially all routine fund operating costs.)
In reviewing fees and expenses, the Trustees generally focus their atten-tion on material changes in circumstances — for example, changes in assets under management, changes in a fund’s investment strategy, changes in Putnam Management’s operating costs or profitability, or changes in competitive practices in the mutual fund industry — that suggest that consideration of fee changes might be warranted. The Trustees concluded that the circumstances did not indicate that changes to the management fee structure for your fund would be appropriate at this time.
Under its management contract, your fund has the benefit of breakpoints in its management fee schedule that provide shareholders with economies of scale in the form of reduced fee rates as assets under management in the Putnam family of funds increase. The Trustees concluded that the fee schedule in effect for your fund represented an appropriate sharing of economies of scale between fund shareholders and Putnam Management.
As in the past, the Trustees also focused on the competitiveness of each fund’s total expense ratio. In order to support the effort to have fund expenses meet competitive standards, the Trustees and Putnam Management and the funds’ investor servicing agent, Putnam Investor Services, Inc. (“PSERV”), have implemented expense limitations that were in effect during your fund’s fiscal year ending in 2018. These expense limitations were: (i) a contractual expense limitation applicable to all open-end funds of 25 basis points on investor servicing fees and expenses and (ii) a contractual expense limitation applicable to specified open-end funds, including your fund, of 20 basis points on so-called “other expenses” (i.e., all expenses exclusive of management fees, distribution
Trustee approval of management contract
44 Putnam VT Multi-Asset Absolute Return Fund
fees, investor servicing fees, investment-related expenses, interest, taxes, brokerage commissions, acquired fund fees and expenses and extraordinary expenses). These expense limitations attempt to maintain competitive expense levels for the funds. Most funds had sufficiently low expenses that these expense limitations were not operative during their fiscal years ending in 2018. However, in the case of your fund, the second of the expense limitations applied during its fiscal year ending in 2018. Putnam Management and PSERV have agreed to maintain these expense limitations until at least April 30, 2021. In addition, Putnam Management contractually agreed to waive fees and/or reimburse expenses of your fund to the extent that expenses of the fund (excluding payments under the fund’s distribution plans, brokerage, interest, taxes, investment-related expenses, extraordinary expenses, and acquired fund fees and expenses) would exceed an annual rate of 0.90% of its average net assets through at least April 30, 2021. During its fiscal year ending in 2018, your fund’s expenses were reduced as a result of this expense limitation. The support of Putnam Management and PSERV for these expense limita-tion arrangements was an important factor in the Trustees’ decision to approve the continuance of your fund’s management, sub-management and sub-advisory contracts.
The Trustees reviewed comparative fee and expense information for a custom group of competitive funds selected by Broadridge Financial Solutions, Inc. (“Broadridge”). This comparative information included your fund’s percentile ranking for effective management fees and total expenses (excluding any applicable 12b-1 fees), which provides a general indication of your fund’s relative standing. In the custom peer group, your fund ranked in the first quintile in effective management fees (determined for your fund and the other funds in the custom peer group based on fund asset size and the applicable contractual management fee schedule) and in the first quintile in total expenses (excluding any applicable 12b-1 fees) as of December 31, 2018. The first quintile represents the least expen-sive funds and the fifth quintile the most expensive funds. The fee and expense data reported by Broadridge as of December 31, 2018 reflected the most recent fiscal year-end data available in Broadridge’s database at that time.
In connection with their review of fund management fees and total expenses, the Trustees also reviewed the costs of the services provided and the profits realized by Putnam Management and its affiliates from their contractual relationships with the funds. This information included trends in revenues, expenses and profitability of Putnam Manage-ment and its affiliates relating to the investment management, investor servicing and distribution services provided to the funds. In this regard, the Trustees also reviewed an analysis of Putnam Management’s reve-nues, expenses and profitability, allocated on a fund-by-fund basis, with respect to the funds’ management, distribution, and investor servicing contracts. For each fund, the analysis presented information about reve-nues, expenses and profitability for each of the agreements separately and for the agreements taken together on a combined basis. The Trustees concluded that, at current asset levels, the fee schedules in place repre-sented reasonable compensation for the services being provided and represented an appropriate sharing between fund shareholders and Putnam Management of such economies of scale as may exist in the management of the Putnam funds at that time.
The information examined by the Trustees in connection with their annual contract review for the Putnam funds included information regarding fees charged by Putnam Management and its affiliates to institutional clients, including defined benefit pension and profit-sharing plans and sub-advised mutual funds. This information included, in cases where
an institutional product’s investment strategy corresponds with a fund’s strategy, comparisons of those fees with fees charged to the Putnam funds, as well as an assessment of the differences in the services provided to these different types of clients as compared to the services provided to the Putnam funds. The Trustees observed that the differences in fee rates between these clients and the Putnam funds are by no means uniform when examined by individual asset sectors, suggesting that differences in the pricing of investment management services to these types of clients may reflect, among other things, historical competitive forces operating in separate markets. The Trustees considered the fact that in many cases fee rates across different asset classes are higher on average for mutual funds than for institutional clients, and the Trustees also considered the differences between the services that Putnam Management provides to the Putnam funds and those that it provides to its other clients. The Trustees did not rely on these comparisons to any significant extent in concluding that the management fees paid by your fund are reasonable.
Investment performanceThe quality of the investment process provided by Putnam Management represented a major factor in the Trustees’ evaluation of the quality of services provided by Putnam Management under your fund’s manage-ment contract. The Trustees were assisted in their review of the Putnam funds’ investment process and performance by the work of the invest-ment oversight committees of the Trustees and the full Board of Trustees, which meet on a regular basis with the funds’ portfolio teams and with the Chief Investment Officers and other senior members of Putnam Manage-ment’s Investment Division throughout the year. The Trustees concluded that Putnam Management generally provides a high-quality investment process — based on the experience and skills of the individuals assigned to the management of fund portfolios, the resources made available to them, and in general Putnam Management’s ability to attract and retain high-quality personnel — but also recognized that this does not guarantee favorable investment results for every fund in every time period.
The Trustees considered that, after a strong start to the year, 2018 was a mixed year for The Putnam Funds, with the Putnam open-end Funds’ performance, on an asset-weighted basis, ranking in the 54th percentile of their Lipper Inc. (“Lipper”) peers (excluding those Putnam funds that are evaluated based on their total returns versus selected investment benchmarks). The Trustees also noted that The Putnam Funds were ranked by the Barron’s/Lipper Fund Families survey as the 41st-best performing mutual fund complex out of 57 complexes for the one-year period ended December 31, 2018 and the 29th-best performing mutual fund complex out of 55 complexes for the five-year period ended December 31, 2018. The Trustees observed that The Putnam Funds’ performance over the longer-term continued to be strong, ranking 6th out of 49 mutual fund complexes in the survey over the ten-year period ended 2018. In addition, the Trustees noted that 22 of the funds were four- or five-star rated by Morningstar Inc. at the end of 2018. They also noted, however, the disappointing investment performance of some funds for periods ended December 31, 2018 and considered information provided by Putnam Management regarding the factors contributing to the under-performance and actions being taken to improve the performance of these particular funds. The Trustees indicated their intention to continue to monitor closely the performance of those funds, including the effec-tiveness of any efforts Putnam Management has undertaken to address underperformance and whether additional actions to address areas of underperformance are warranted.
For purposes of the Trustees’ evaluation of the Putnam Funds’ investment performance, the Trustees generally focus on a competitive industry
Putnam VT Multi-Asset Absolute Return Fund 45
ranking of each fund’s total net return over a one-year, three-year and five-year period. For a number of Putnam funds with relatively unique investment mandates for which Putnam Management informed the Trustees that meaningful competitive performance rankings are not considered to be available, the Trustees evaluated performance based on their total gross and net returns and comparisons of those returns with the returns of selected investment benchmarks. In the case of your fund, the Trustees considered information about your fund’s total return and its performance relative to its benchmark over the one-year, three-year and five-year periods ended December 31, 2018. Your fund’s class IA shares’ return, net of fees and expenses, was negative and trailed the return of its benchmark over the one-year period, was approximately zero and trailed the return of its benchmark over the three-year period, and was positive and slightly exceeded the return of its benchmark over the five-year period. (When considering performance information, shareholders should be mindful that past performance is not a guarantee of future results.)
The Trustees expressed concern about your fund’s underperformance relative to its benchmark over the one-year period ended December 31, 2018 and considered the circumstances that may have contributed to this disappointing performance. The Trustees considered Putnam Manage-ment’s observation that the fund’s underperformance relative to its benchmark over the one-year period resulted from both directional strategies (which generally depend upon the direction of the relevant markets for success) and non-directional strategies (which are generally designed not to depend upon market direction for success). The Trustees noted Putnam Management’s view that the fund’s quantitative equity security selection process performed less favorably in 2018’s volatile market. The Trustees additionally noted Putnam Management’s observa-tion that the fund’s overweight allocation to equities detracted from the fund’s performance, especially in the fourth quarter of 2018. The Trustees also considered Putnam Management’s view that the fund’s position in commodities detracted from the fund’s performance when oil prices fell in the fourth quarter, and that the fund’s term structure positioning detracted from the fund’s performance when interest rates increased in early 2018.
The Trustees noted that the fund had outperformed its benchmark, net of fees and expenses, for the five-year period ended December 31, 2018 in spite of the fund’s weak performance in 2018. In addition, the Trustees considered that the fund had outperformed its benchmark, net of fees and expenses, for the year-to-date period through February 28, 2019, noting Putnam Management’s observation that the market environment had been more favorable to the fund’s investment process during this recent period. The Trustees considered that Putnam Management remained confident in the fund’s portfolio managers. The Trustees also considered Putnam Management’s continued efforts to support fund performance through initiatives including structuring compensation for portfolio managers and research analysts to enhance accountability for fund perfor-mance, emphasizing accountability in the portfolio management process, and affirming its commitment to a fundamental-driven approach to investing. The Trustees noted further that Putnam Management had made selective hires in 2018 to strengthen its investment team.
As a general matter, the Trustees believe that cooperative efforts between the Trustees and Putnam Management represent the most effective way to address investment performance concerns that may arise from time to time. The Trustees noted that investors in the Putnam funds have, in effect, placed their trust in the Putnam organization, under the over-sight of the funds’ Trustees, to make appropriate decisions regarding the management of the funds. Based on Putnam Management’s willing-ness to take appropriate measures to address fund performance issues and Putnam Management’s responsiveness to Trustee concerns about investment performance, the Trustees concluded that it continues to be advisable to seek change within Putnam Management to address perfor-mance shortcomings. In the Trustees’ view, the alternative of engaging a new investment adviser for an underperforming fund, with all the atten-dant risks and disruptions, would not likely provide any greater assurance of improved investment performance.
Brokerage and soft-dollar allocations; investor servicingThe Trustees considered various potential benefits that Putnam Manage-ment may receive in connection with the services it provides under the management contract with your fund. These include benefits related to brokerage allocation and the use of soft dollars, whereby a portion of the commissions paid by a fund for brokerage may be used to acquire research services that are expected to be useful to Putnam Manage-ment in managing the assets of the fund and of other clients. Subject to policies established by the Trustees, soft dollars generated by these means are used predominantly to acquire brokerage and research services (including third-party research and market data) that enhance Putnam Management’s investment capabilities and supplement Putnam Management’s internal research efforts. However, the Trustees noted that a portion of available soft dollars continues to be used to pay fund exp enses. The Trustees indicated their continued intent to monitor regulatory and industry developments in this area with the assistance of their Brokerage Committee. The Trustees also indicated their continued intent to monitor the allocation of the Putnam funds’ brokerage in order to ensure that the principle of seeking best price and execution remains paramount in the portfolio trading process.
Putnam Management may also receive benefits from payments that the funds make to Putnam Management’s affiliates for investor or distri-bution services. In conjunction with the annual review of your fund’s management, sub-management and sub-advisory contracts, the Trustees reviewed your fund’s investor servicing agreement with PSERV and its distributor’s contracts and distribution plans with Putnam Retail Management Limited Partnership (“PRM”), both of which are affiliates of Putnam Management. The Trustees concluded that the fees payable by the funds to PSERV and PRM, as applicable, for such services are fair and reasonable in relation to the nature and quality of such services, the fees paid by competitive funds, and the costs incurred by PSERV and PRM, as applicable, in providing such services. Furthermore, the Trustees were of the view that the services provided were required for the operation of the funds, and that they were of a quality at least equal to those provided by other providers.
Investment ManagerPutnam Investment Management, LLC100 Federal StreetBoston, MA 02110
Investment Sub-AdvisorsPutnam Investments Limited16 St James’s StreetLondon, England SW1A 1ER
The Putnam Advisory Company, LLC100 Federal StreetBoston, MA 02110
Marketing ServicesPutnam Retail Management100 Federal StreetBoston, MA 02110
Investor Servicing AgentPutnam InvestmentsMailing address:P.O. Box 219697Kansas City, MO 64121-96971-800-225-1581
CustodianState Street Bank and Trust Company
Legal CounselRopes & Gray LLP
TrusteesKenneth R. Leibler, ChairLiaquat AhamedRavi AkhouryBarbara M. BaumannKatinka DomotorffyCatharine Bond HillPaul L. JoskowRobert E. PattersonGeorge Putnam, IIIRobert L. ReynoldsManoj P. Singh
Other important informationProxy votingPutnam is committed to managing our mutual funds in the best interests of our shareholders. The Putnam funds’ proxy voting guidelines and procedures, as well as information regarding how your fund voted proxies relating to portfolio securities during the 12-month period ended June 30, 2019, are available in the Individual Investors section of putnam.com and on the Securities and Exchange Commission’s (SEC) website at www.sec.gov. If you have questions about finding forms on the SEC’s website, you may call the SEC at 1-800-SEC-0330. You may also obtain the Putnam funds’ proxy voting guidelines and procedures at no charge by calling Putnam’s Shareholder Services at 1-800-225-1581.
Fund portfolio holdingsThe fund will file a complete schedule of its portfolio holdings with the SEC for the first and third quarters of each fiscal year on Form N-PORT within 60 days of the end of such fiscal quarter. Shareholders may obtain the fund’s Form N-PORT from the SEC’s website at www.sec.gov.
Prior to its use of Form N-PORT, the fund filed its complete schedule of its portfolio holdings with the SEC on Form N-Q, which is available online at www.sec.gov.
Fund information
The fund’s Statement of Additional Information contains additional information about the fund’s Trustees and is available without charge upon request by calling 1-800-225-1581.
This report has been prepared for the shareholders of Putnam VT Multi-Asset Absolute Return Fund.
VTSA110 317452 8/19
Recommended


![Putnam Variable Trust · The fund’s top contributor was German sportswear manufacturer adidas. Sales of the firm’s shoes and athleisure clothing [trendy workout apparel] rose,](https://img.dokumen.tips/doc/110x75/5ffd2875f9b0c644296a07b7/putnam-variable-trust-the-fundas-top-contributor-was-german-sportswear-manufacturer.jpg)