The Problem
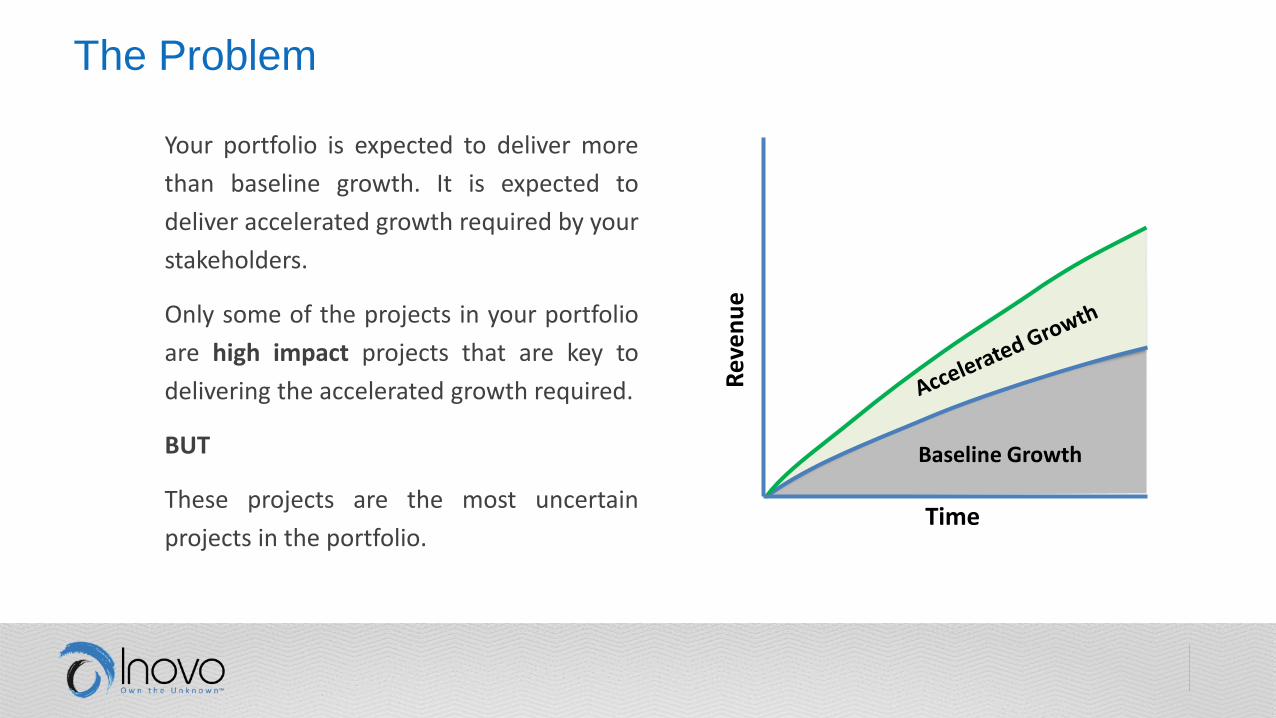
Your portfolio is expected to deliver more
than baseline growth. It is expected to
deliver accelerated growth required by your
stakeholders.
Only some of the projects in your portfolio
are high impact projects that are key to
delivering the accelerated growth required.
BUT
These projects are the most uncertain
projects in the portfolio.Time
Rev
en
ue
Baseline Growth
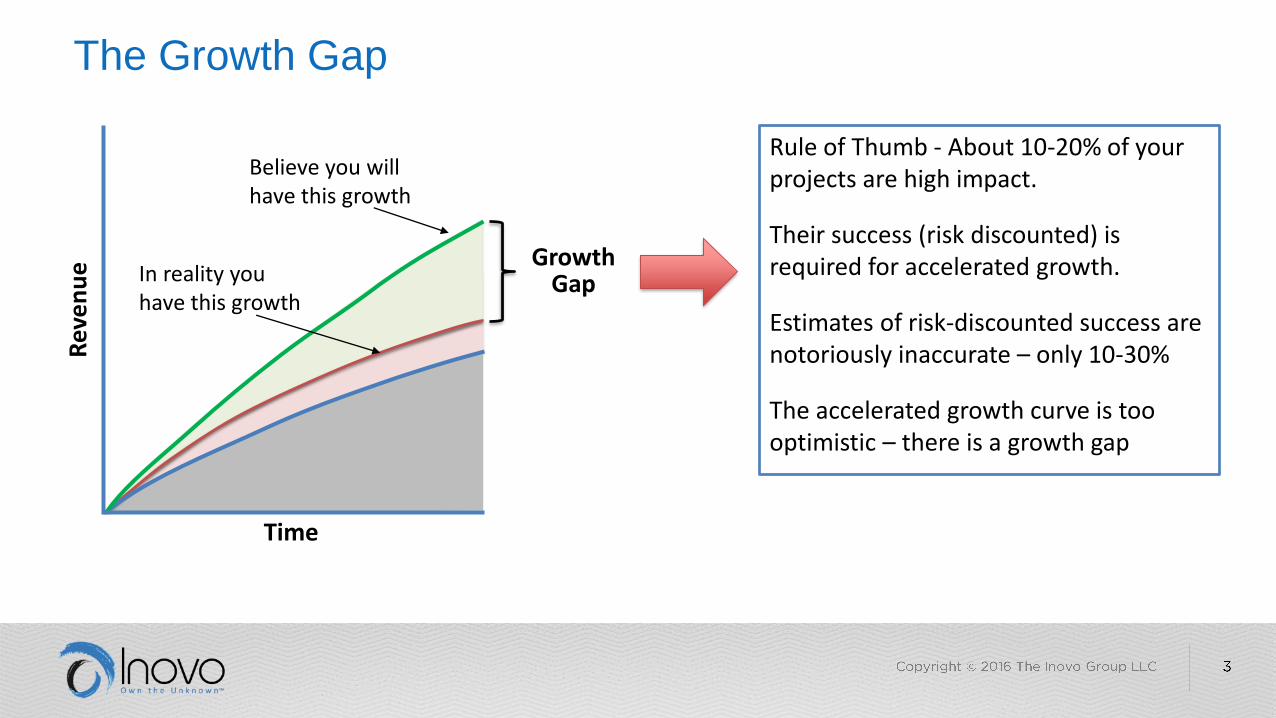
The Growth Gap
Rule of Thumb - About 10-20% of your projects are high impact.
Their success (risk discounted) is required for accelerated growth.
Estimates of risk-discounted success are notoriously inaccurate – only 10-30%
The accelerated growth curve is too optimistic – there is a growth gap
Growth Gap
Time
Rev
en
ue
Believe you will have this growth
In reality you have this growth
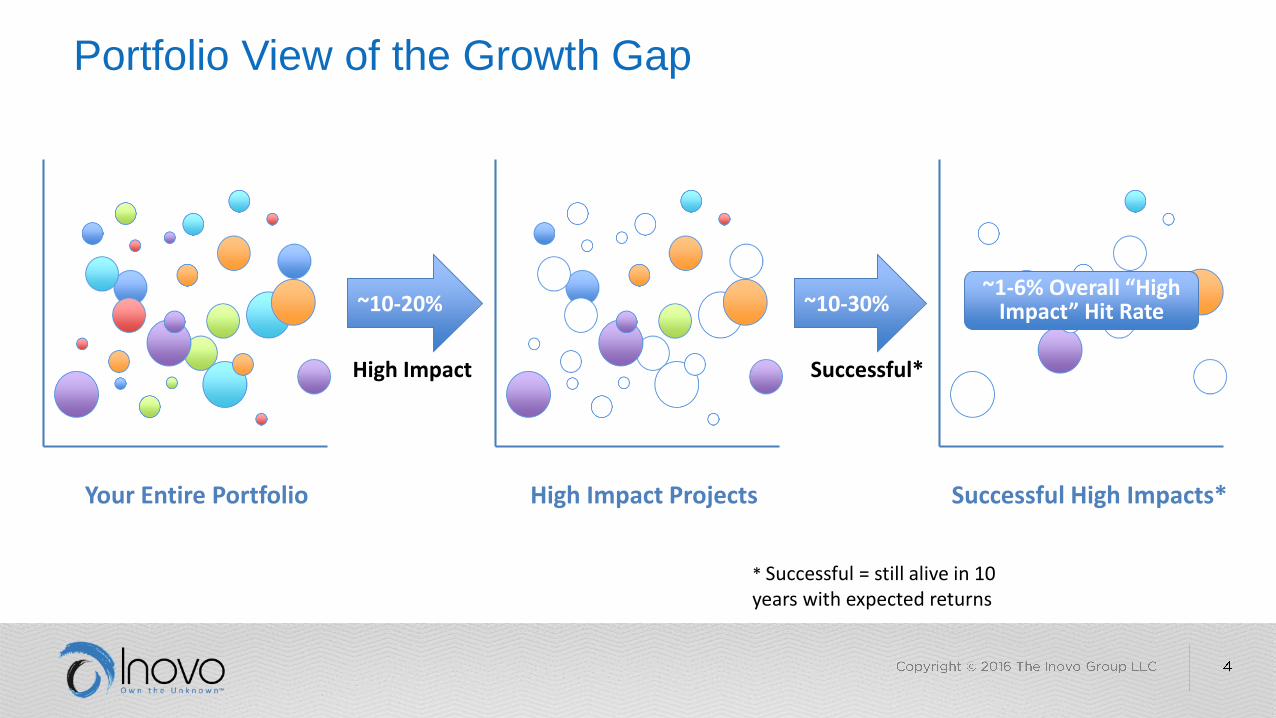
Portfolio View of the Growth Gap
Your Entire Portfolio High Impact Projects Successful High Impacts*
~10-20% ~10-30%
High Impact Successful*
* Successful = still alive in 10 years with expected returns
~1-6% Overall “High Impact” Hit Rate
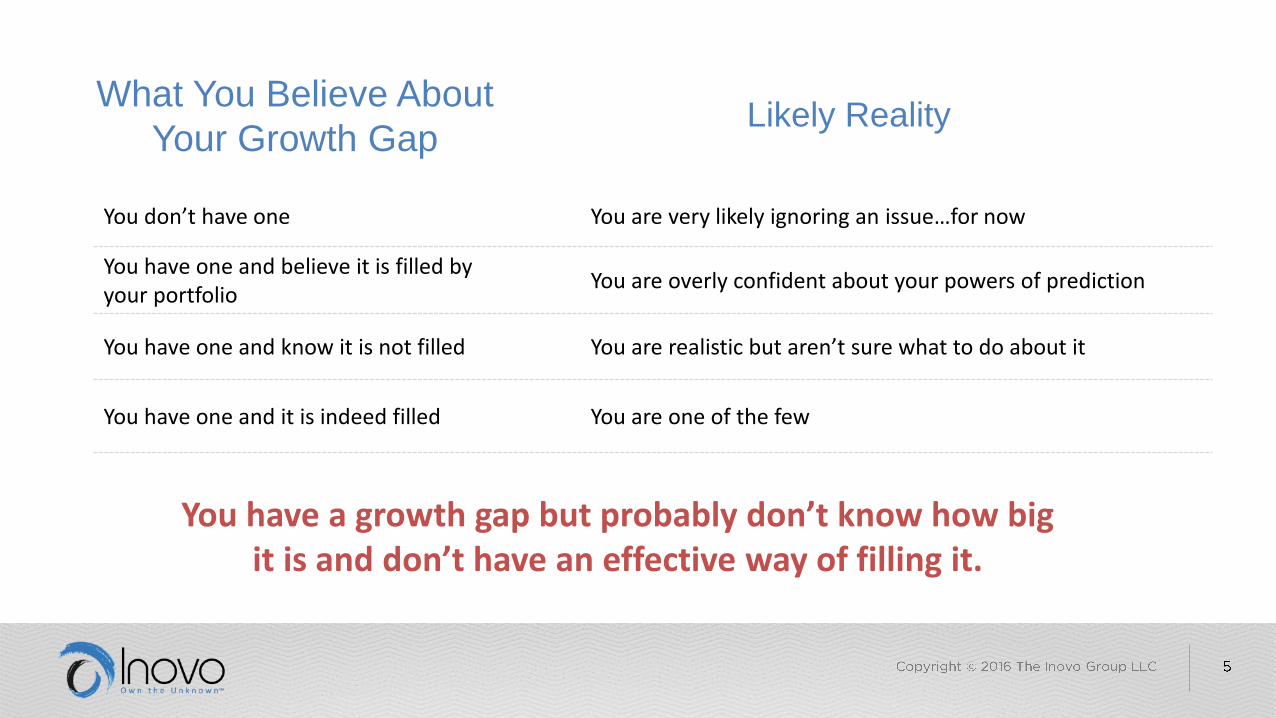
What You Believe About
Your Growth Gap
You have a growth gap but probably don’t know how big it is and don’t have an effective way of filling it.
Likely Reality
You don’t have one You are very likely ignoring an issue…for now
You have one and believe it is filled by your portfolio
You are overly confident about your powers of prediction
You have one and know it is not filled You are realistic but aren’t sure what to do about it
You have one and it is indeed filled You are one of the few
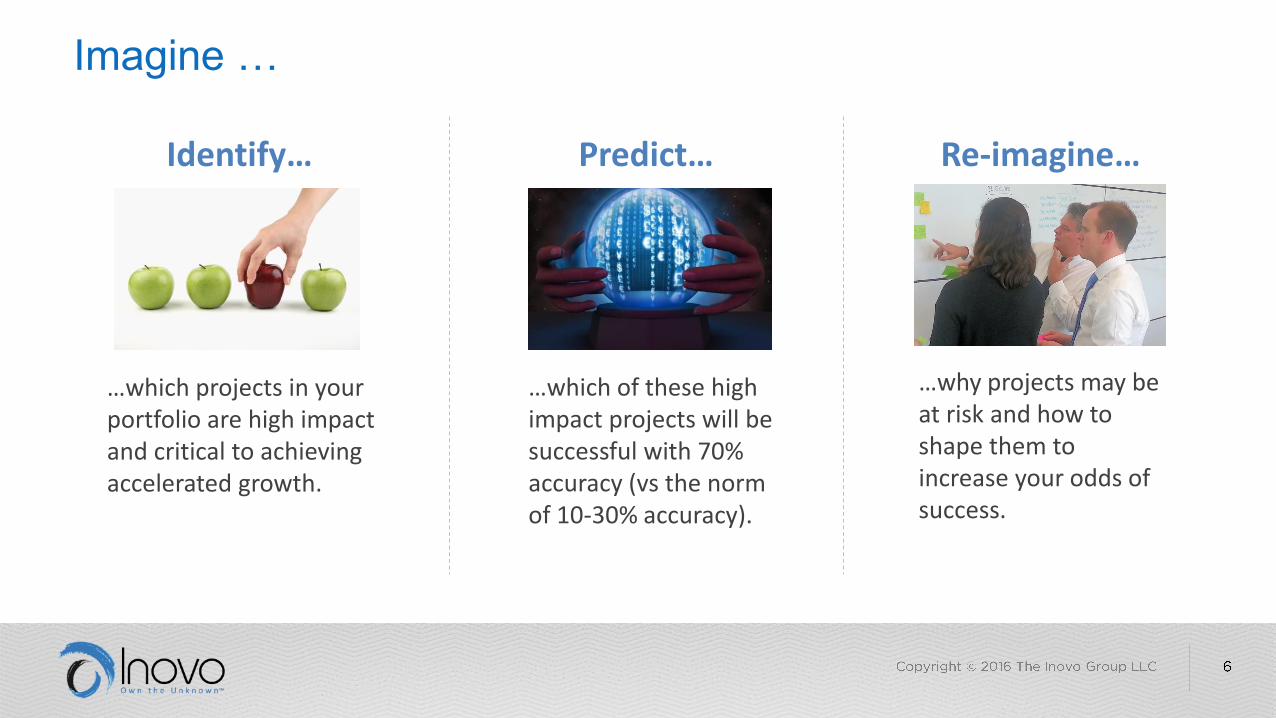
Imagine …
…which projects in your portfolio are high impact and critical to achieving accelerated growth.
…which of these high impact projects will be successful with 70% accuracy (vs the norm of 10-30% accuracy).
…why projects may be at risk and how to shape them to increase your odds of success.
Identify… Predict… Re-imagine…
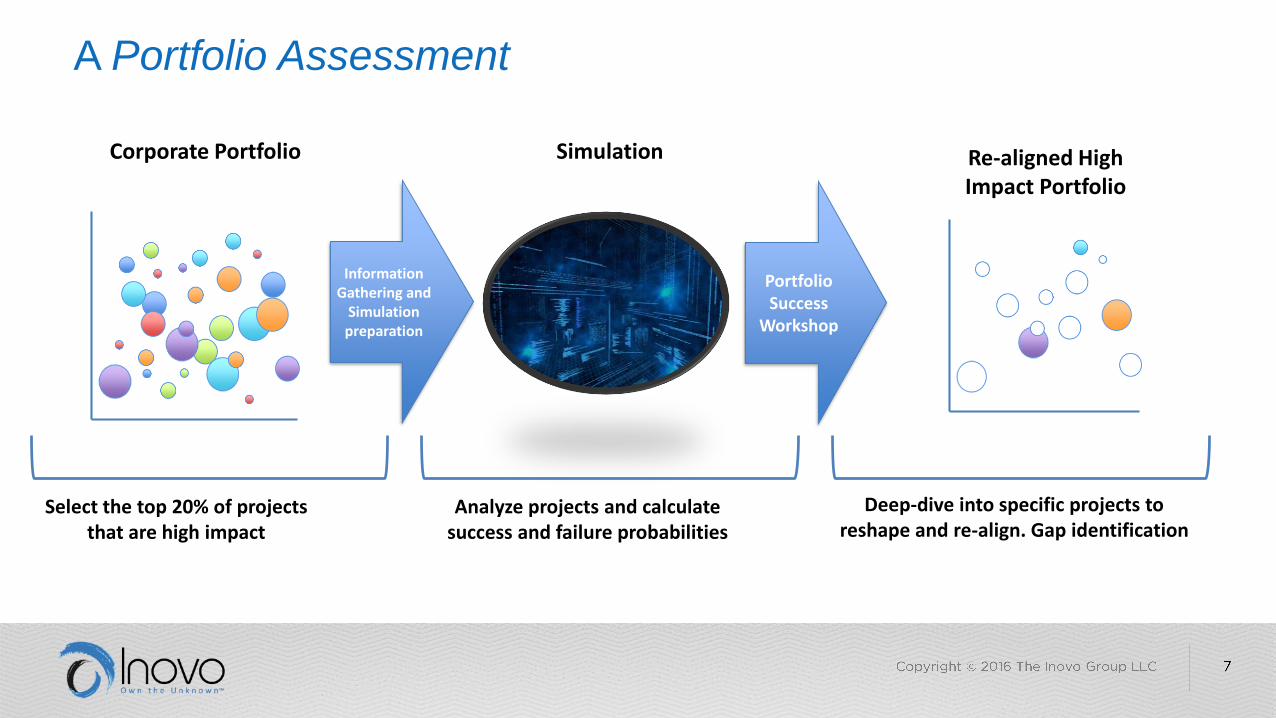
A Portfolio Assessment
Select the top 20% of projects that are high impact
Information Gathering and
Simulation preparation
Corporate Portfolio
Portfolio Success
Workshop
Analyze projects and calculate success and failure probabilities
Re-aligned High Impact Portfolio
Deep-dive into specific projects to reshape and re-align. Gap identification
Simulation
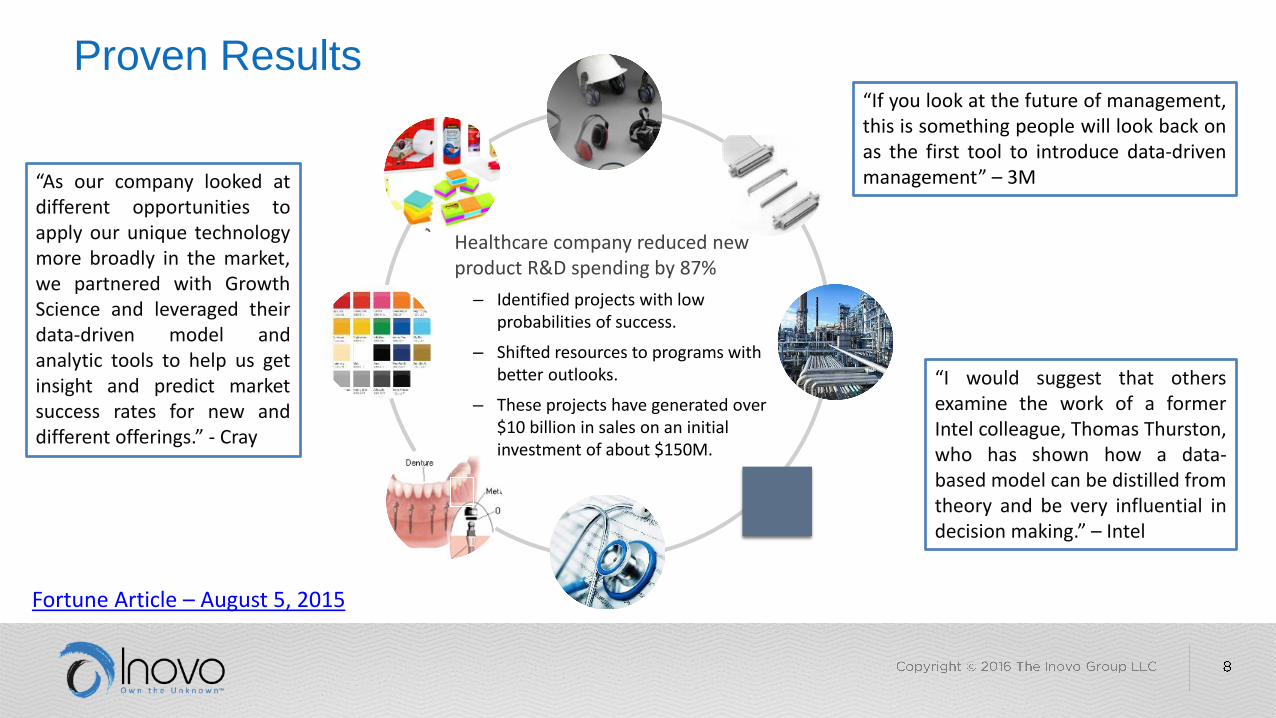
Proven Results
Healthcare company reduced new product R&D spending by 87%
– Identified projects with low probabilities of success.
– Shifted resources to programs with better outlooks.
– These projects have generated over $10 billion in sales on an initial investment of about $150M.
Fortune Article – August 5, 2015
“I would suggest that othersexamine the work of a formerIntel colleague, Thomas Thurston,who has shown how a data-based model can be distilled fromtheory and be very influential indecision making.” – Intel
“If you look at the future of management,this is something people will look back onas the first tool to introduce data-drivenmanagement” – 3M“As our company looked at
different opportunities toapply our unique technologymore broadly in the market,we partnered with GrowthScience and leveraged theirdata-driven model andanalytic tools to help us getinsight and predict marketsuccess rates for new anddifferent offerings.” - Cray
Time
Rev
en
ue
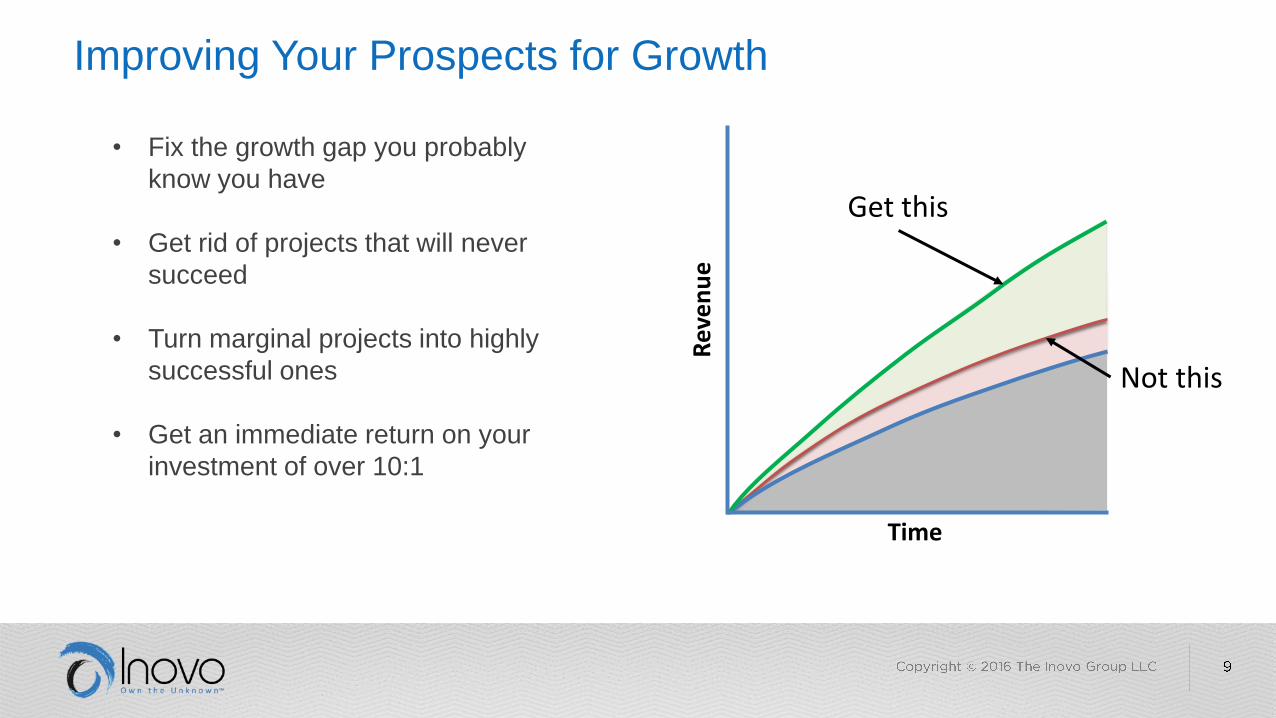
Improving Your Prospects for Growth
• Fix the growth gap you probably
know you have
• Get rid of projects that will never
succeed
• Turn marginal projects into highly
successful ones
• Get an immediate return on your
investment of over 10:1
Get this
Not this
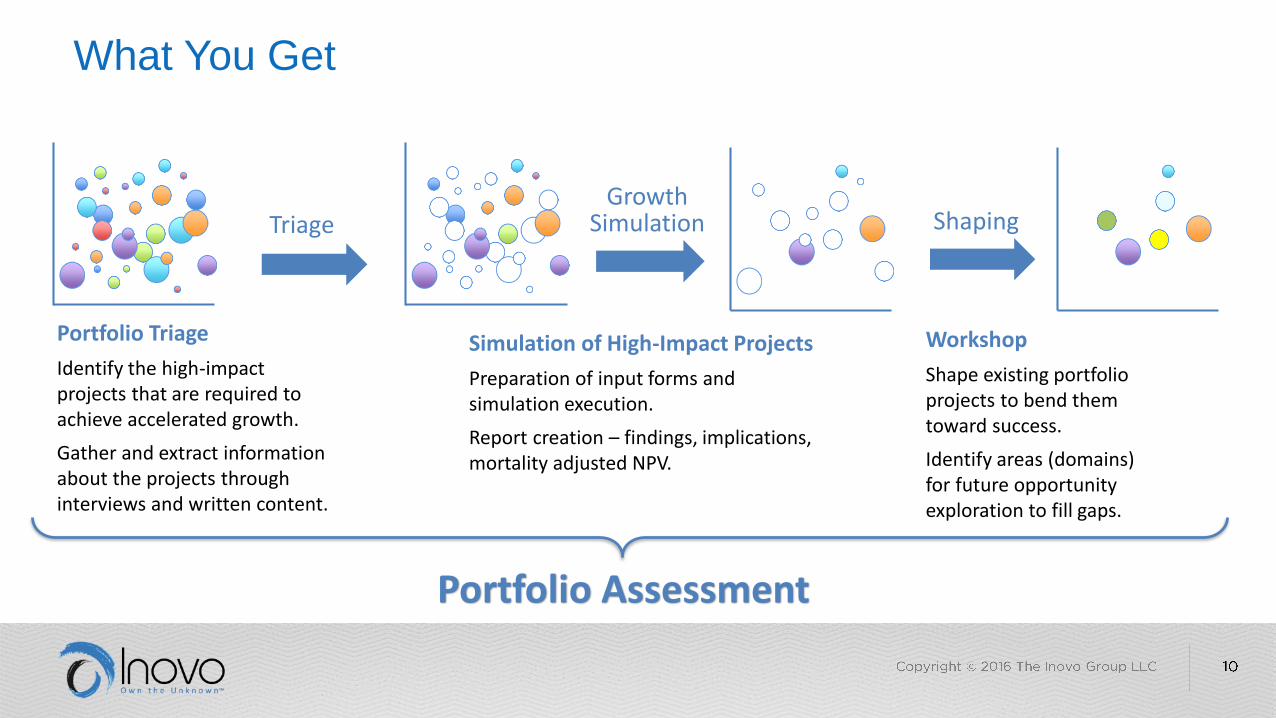
What You Get
Growth SimulationTriage Shaping
Portfolio Triage
Identify the high-impact projects that are required to achieve accelerated growth.
Gather and extract information about the projects through interviews and written content.
Simulation of High-Impact Projects
Preparation of input forms and simulation execution.
Report creation – findings, implications, mortality adjusted NPV.
Workshop
Shape existing portfolio projects to bend them toward success.
Identify areas (domains) for future opportunity exploration to fill gaps.
Portfolio Assessment
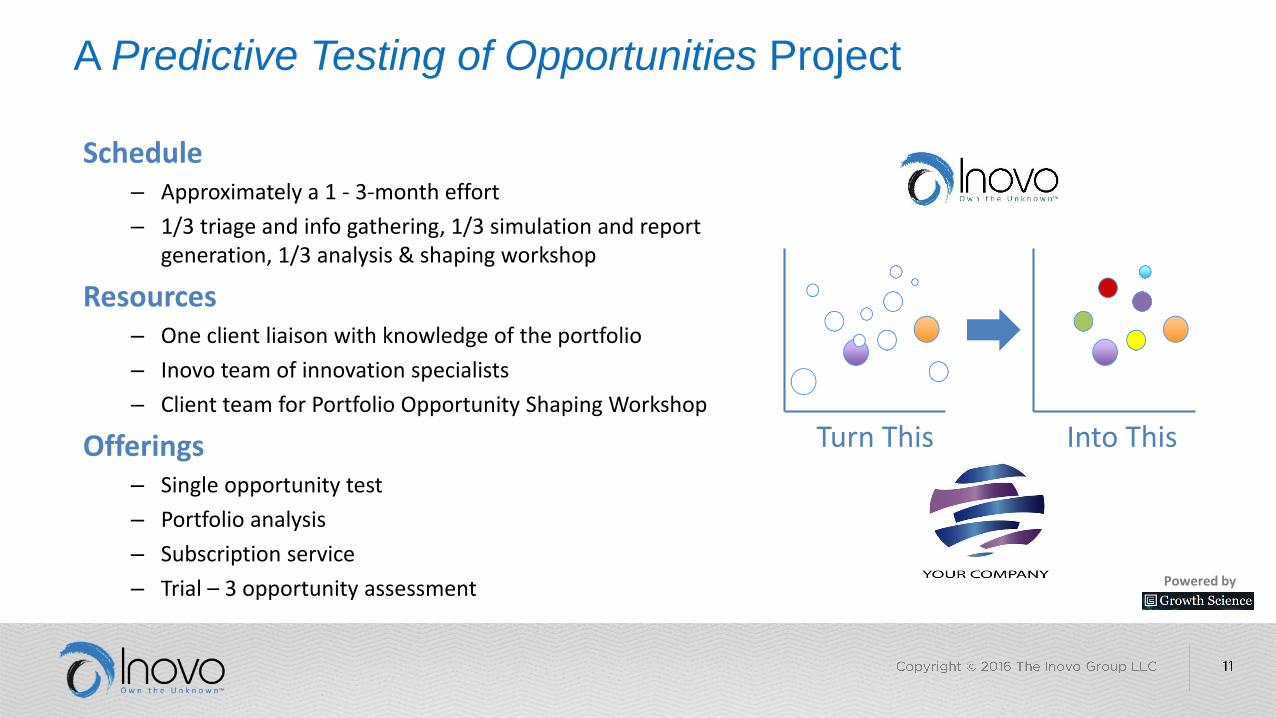
A Predictive Testing of Opportunities Project
Schedule– Approximately a 1 - 3-month effort
– 1/3 triage and info gathering, 1/3 simulation and report generation, 1/3 analysis & shaping workshop
Resources– One client liaison with knowledge of the portfolio
– Inovo team of innovation specialists
– Client team for Portfolio Opportunity Shaping Workshop
Offerings– Single opportunity test
– Portfolio analysis
– Subscription service
– Trial – 3 opportunity assessment Powered by
Turn This Into This
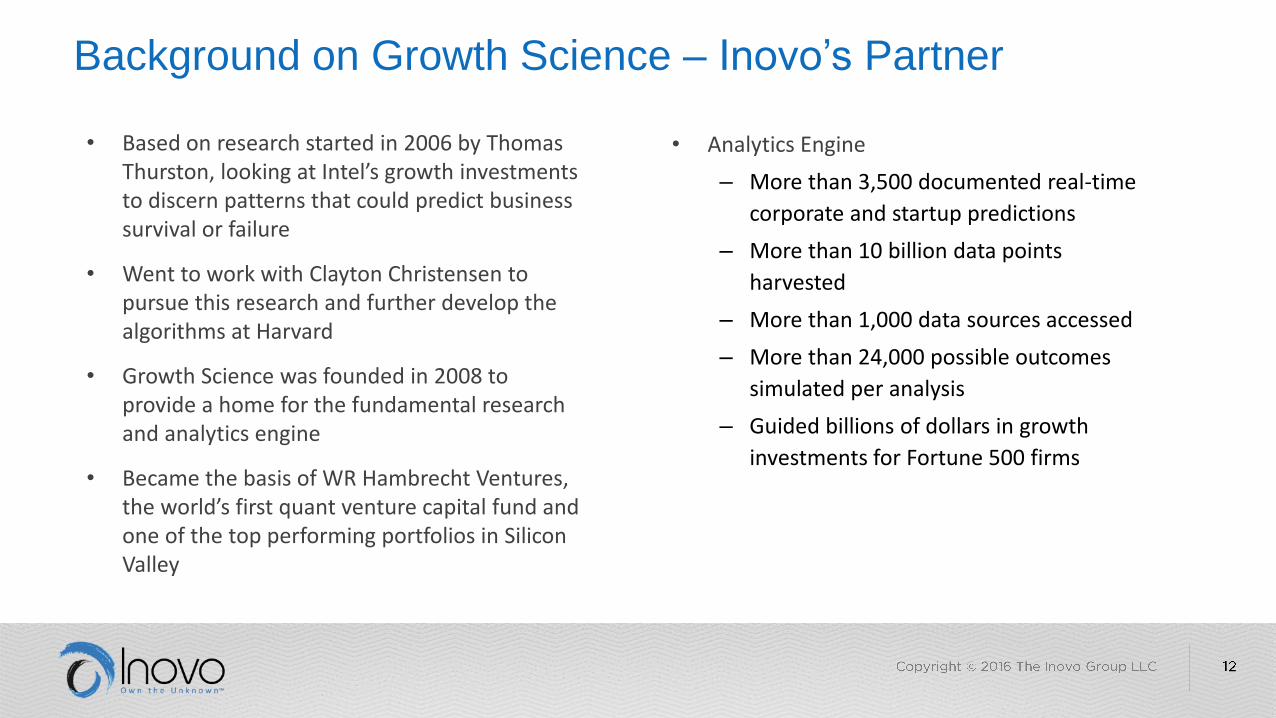
Background on Growth Science – Inovo’s Partner
• Based on research started in 2006 by Thomas Thurston, looking at Intel’s growth investments to discern patterns that could predict business survival or failure
• Went to work with Clayton Christensen to pursue this research and further develop the algorithms at Harvard
• Growth Science was founded in 2008 to provide a home for the fundamental research and analytics engine
• Became the basis of WR Hambrecht Ventures, the world’s first quant venture capital fund and one of the top performing portfolios in Silicon Valley
• Analytics Engine
– More than 3,500 documented real-time
corporate and startup predictions
– More than 10 billion data points
harvested
– More than 1,000 data sources accessed
– More than 24,000 possible outcomes
simulated per analysis
– Guided billions of dollars in growth
investments for Fortune 500 firms
Get in Touch with Us Today to Find out How to…
• Identify your high-impact projects
• Predict if they will succeed
• Shape certain low-success projects
into high-success ones
• Terminate the others
• Get 10:1 or more returns on your
investment in a Portfolio Growth
Gap Assessment
Powered by
www.theinovogroup.com
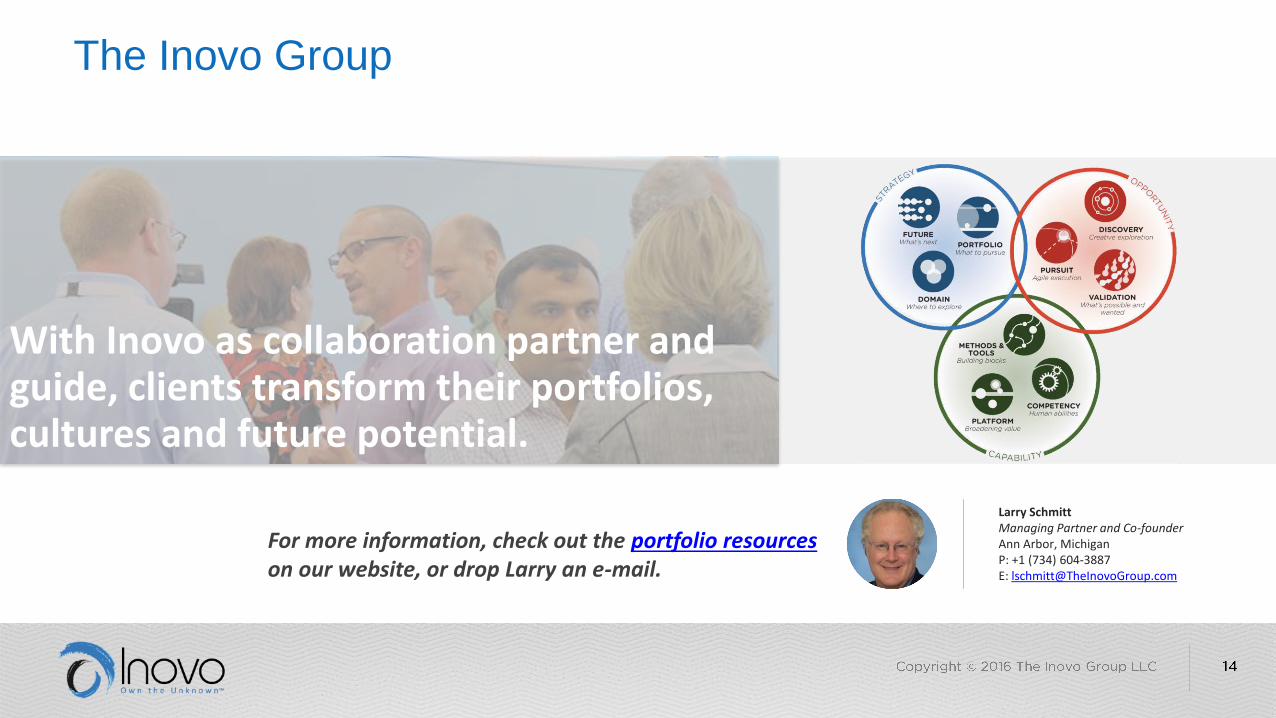
The Inovo Group
For more information, check out the portfolio resourceson our website, or drop Larry an e-mail.
With Inovo as collaboration partner and guide, clients transform their portfolios, cultures and future potential.
Larry SchmittManaging Partner and Co-founderAnn Arbor, MichiganP: +1 (734) 604-3887E: [email protected]
Predictive Testing of Opportunities
Behind the Scenes
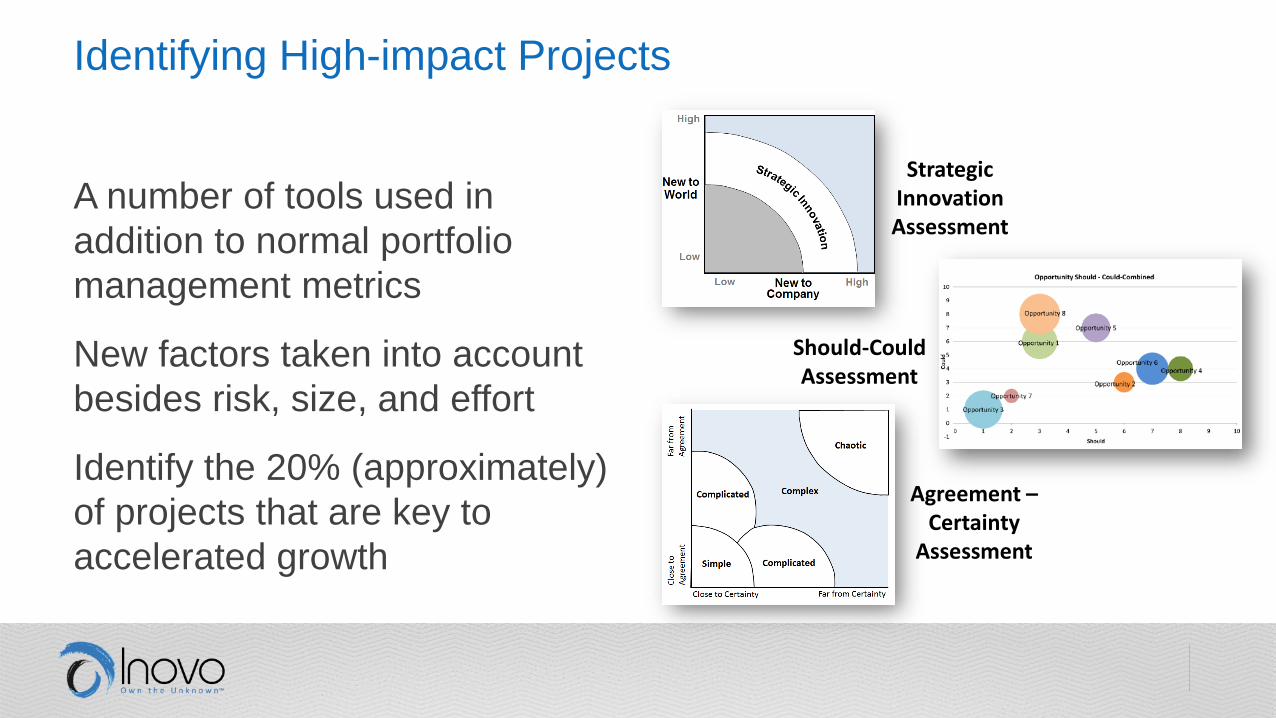
Identifying High-impact Projects
A number of tools used in
addition to normal portfolio
management metrics
New factors taken into account
besides risk, size, and effort
Identify the 20% (approximately)
of projects that are key to
accelerated growth
Strategic Innovation Assessment
Agreement –Certainty
Assessment
Should-Could Assessment
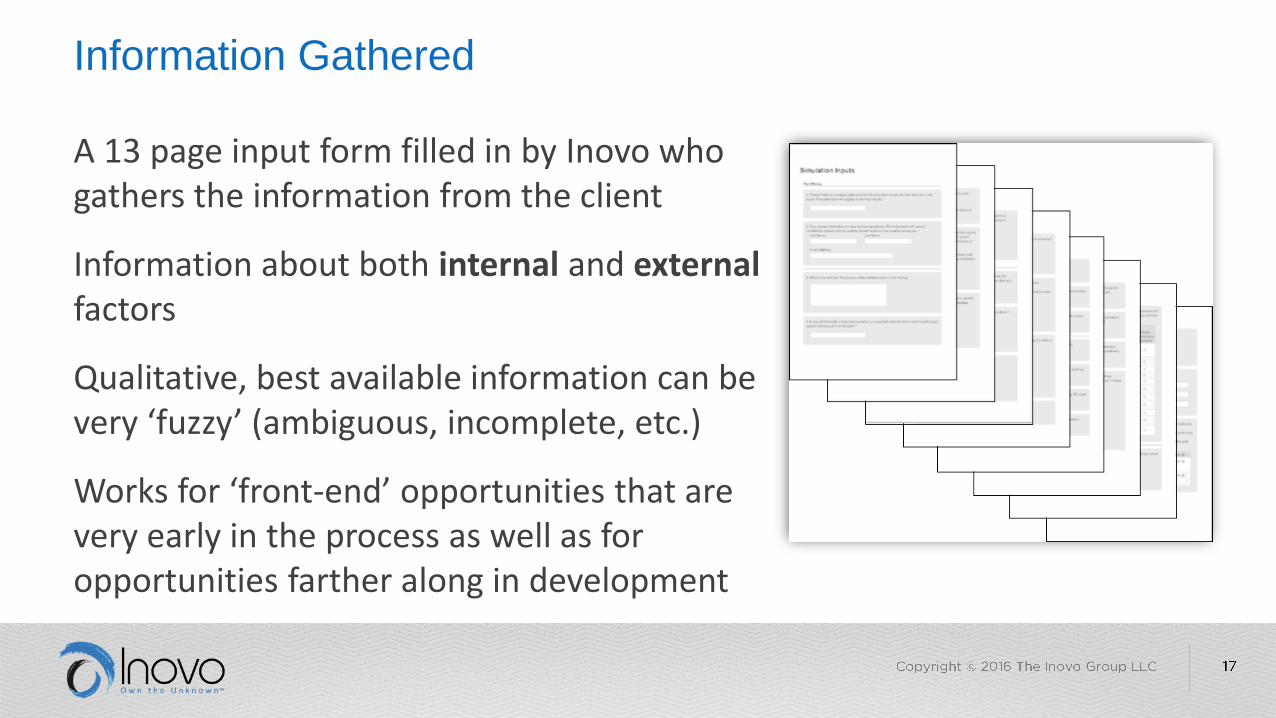
Information Gathered
A 13 page input form filled in by Inovo who gathers the information from the client
Information about both internal and external factors
Qualitative, best available information can be very ‘fuzzy’ (ambiguous, incomplete, etc.)
Works for ‘front-end’ opportunities that are very early in the process as well as for opportunities farther along in development

Predicting Success
Input is coded and fed into the simulation
Doesn’t rely on just what the company says – uses independent information gathered from public and private sources
Does not require precise quantitative data –works with the imprecise descriptions of new opportunities.
Proven predictive accuracy of 67%. Tested with double-blind studies. Proven cash returns.
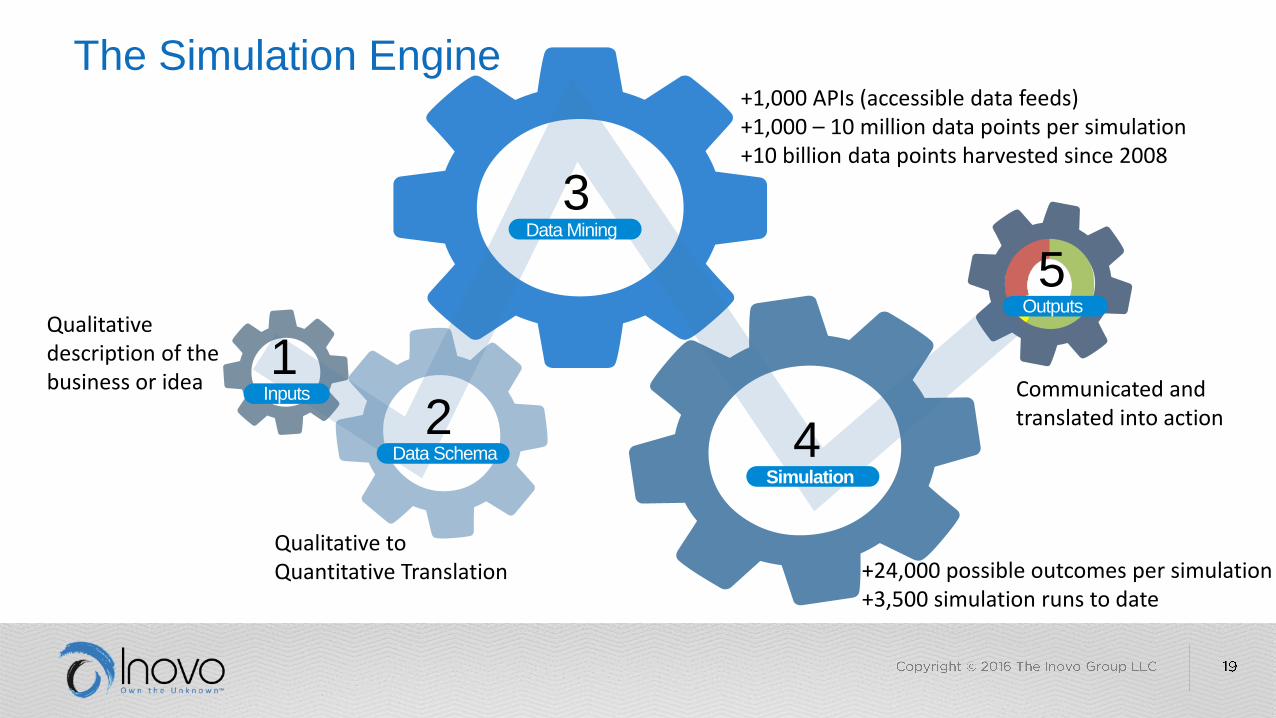
The Simulation Engine
Simulation
4
Data Mining
3
Data Schema
2Inputs
1Qualitative description of the business or idea
Qualitative to Quantitative Translation
+1,000 APIs (accessible data feeds)+1,000 – 10 million data points per simulation+10 billion data points harvested since 2008
Outputs
5
Communicated and translated into action
+24,000 possible outcomes per simulation+3,500 simulation runs to date
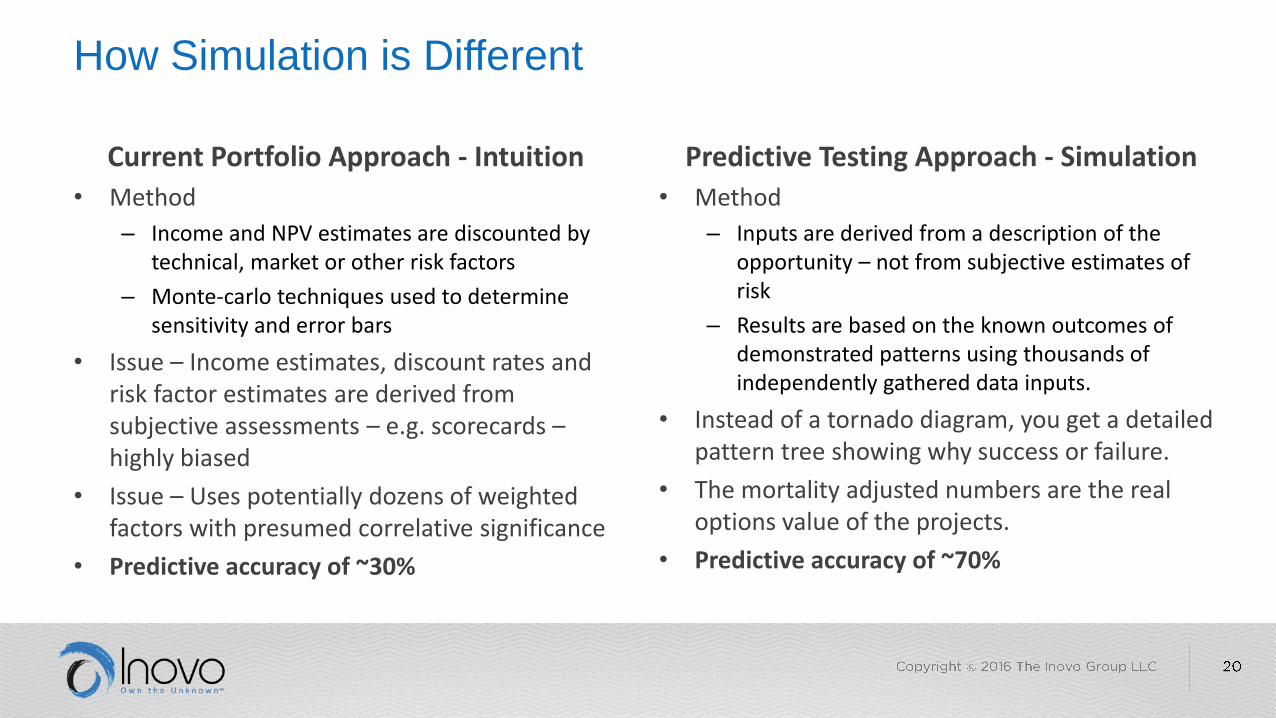
How Simulation is Different
Current Portfolio Approach - Intuition
• Method
– Income and NPV estimates are discounted by technical, market or other risk factors
– Monte-carlo techniques used to determine sensitivity and error bars
• Issue – Income estimates, discount rates and risk factor estimates are derived from subjective assessments – e.g. scorecards –highly biased
• Issue – Uses potentially dozens of weighted factors with presumed correlative significance
• Predictive accuracy of ~30%
Predictive Testing Approach - Simulation
• Method
– Inputs are derived from a description of the opportunity – not from subjective estimates of risk
– Results are based on the known outcomes of demonstrated patterns using thousands of independently gathered data inputs.
• Instead of a tornado diagram, you get a detailed pattern tree showing why success or failure.
• The mortality adjusted numbers are the real options value of the projects.
• Predictive accuracy of ~70%
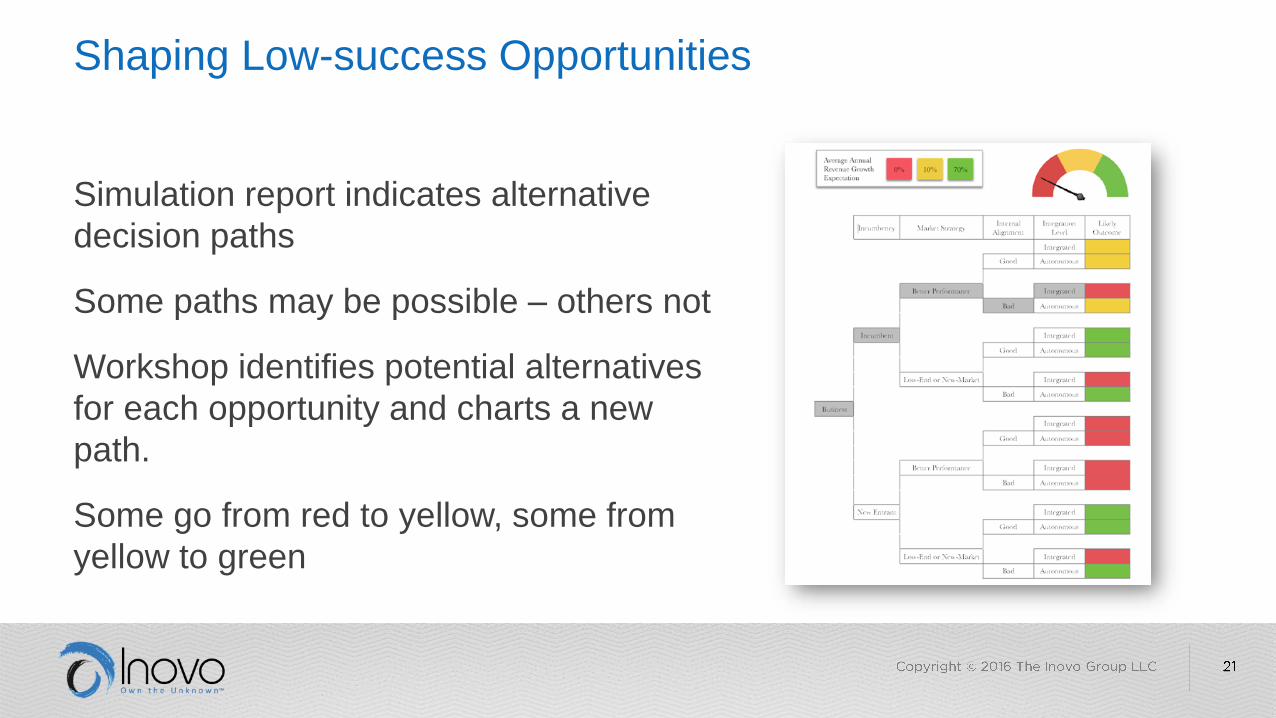
Shaping Low-success Opportunities
Simulation report indicates alternative
decision paths
Some paths may be possible – others not
Workshop identifies potential alternatives
for each opportunity and charts a new
path.
Some go from red to yellow, some from
yellow to green
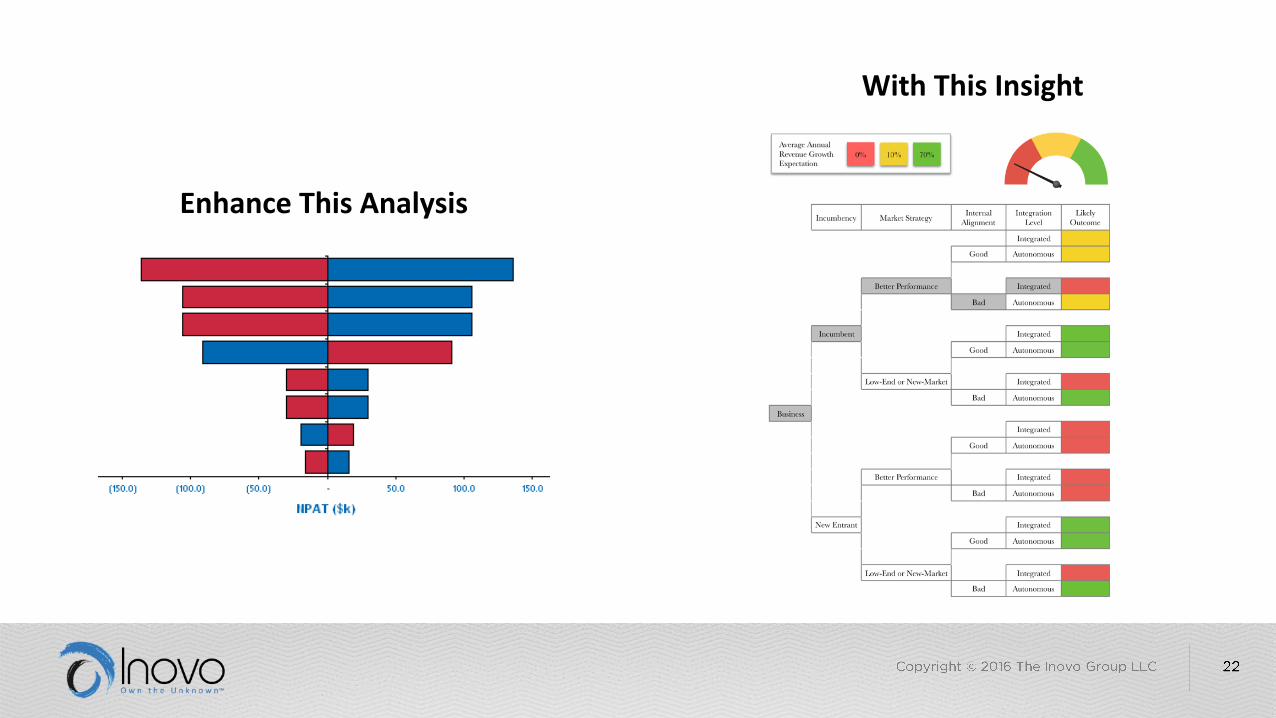
Enhance This Analysis
With This Insight
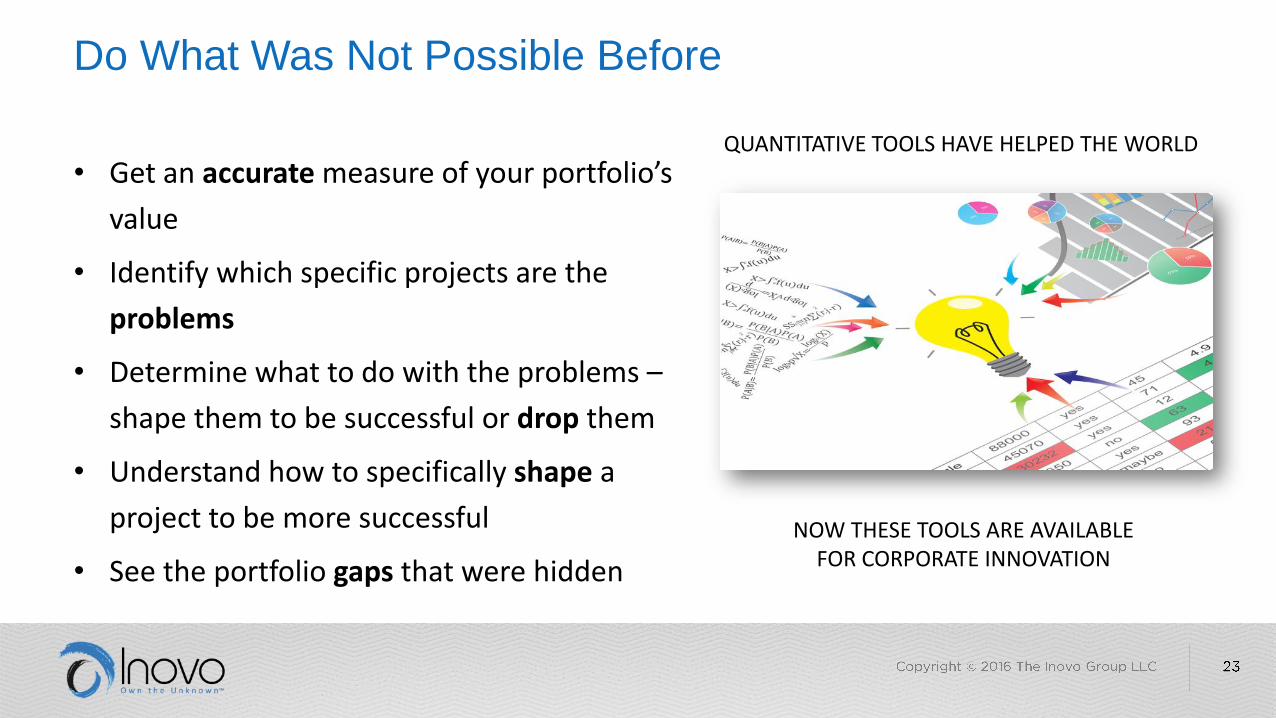
Do What Was Not Possible Before
• Get an accurate measure of your portfolio’s
value
• Identify which specific projects are the
problems
• Determine what to do with the problems –
shape them to be successful or drop them
• Understand how to specifically shape a
project to be more successful
• See the portfolio gaps that were hidden
QUANTITATIVE TOOLS HAVE HELPED THE WORLD
NOW THESE TOOLS ARE AVAILABLE FOR CORPORATE INNOVATION
Recommended