© 2016 International Monetary Fund
IMF Country Report No. 16/300
PORTUGAL 2016 ARTICLE IV CONSULTATION—PRESS RELEASE; STAFF REPORT; AND STATEMENT BY THE EXECUTIVE DIRECTOR FOR PORTUGAL
Under Article IV of the IMF’s Articles of Agreement, the IMF holds bilateral discussions
with members, usually every year. In the context of the 2016 Article IV consultation with
Portugal, the following documents have been released and are included in this package:
A Press Release summarizing the views of the Executive Board as expressed during its
September 19, 2016 consideration of the staff report that concluded the Article IV
consultation with Portugal.
The Staff Report prepared by a staff team of the IMF for the Executive Board’s
consideration on September 19, 2016, following discussions that ended on
June 30, 2016 with the officials of Portugal on economic developments and policies.
Based on information available at the time of these discussions, the staff report was
completed on August 5, 2016.
An Informational Annex prepared by the IMF staff.
The documents listed below have been or will be separately released.
Selected Issues
Ex-Post Evaluation of Exceptional Access Under the 2011 Extended Arrangement
The IMF’s transparency policy allows for the deletion of market-sensitive information and
premature disclosure of the authorities’ policy intentions in published staff reports and
other documents.
Copies of this report are available to the public from
International Monetary Fund Publication Services
PO Box 92780 Washington, D.C. 20090
Telephone: (202) 623-7430 Fax: (202) 623-7201
E-mail: [email protected] Web: http://www.imf.org
Price: $18.00 per printed copy
International Monetary Fund
Washington, D.C.
September 2016

Press Release No. 16/416
FOR IMMEDIATE RELEASE
September 22, 2016
IMF Executive Board Concludes 2016 Article IV Consultation with Portugal
On September 16, 2016, the Executive Board of the International Monetary Fund (IMF)
concluded the Article IV Consultation1 and Fourth Post-Program Monitoring2 with Portugal.
The economic recovery in Portugal is losing momentum. The slowdown in economic activity
that began in the second half of 2015 has persisted, despite still-favorable cyclical tailwinds and
supportive macroeconomic policy settings. The fiscal loosening in place since last year and the
ECB’s appropriately supportive monetary policy stance have translated into robust consumption
growth. However, overall GDP growth is being held back by weaker export growth and sluggish
investment, with the latter being weighed down by uncertainty, high levels of corporate debt, and
still-pronounced structural bottlenecks. Accordingly, output is expected to increase by only 1.0
percent in 2016.
Executive Board Assessment3
The Executive Directors welcomed that Portugal has achieved a major economic turnaround
since the onset of the sovereign debt crisis, as market access has been restored, fiscal and current
account balances have improved, and unemployment, though still high, has fallen substantially.
Directors noted, however, that notwithstanding the progress, the recovery is moderating and risks
are tilted to the downside. The slowdown in economic activity, together with banking sector
vulnerabilities and high public debt, poses challenges. Directors welcomed the authorities’
commitment to address these weaknesses and emphasized that a concerted policy effort,
including decisive fiscal adjustment, improvement in banks’ governance, and implementation of
key structural reforms, will be critical to strengthening Portugal’s macroeconomic position.
1 Under Article IV of the IMF's Articles of Agreement, the IMF holds bilateral discussions with members, usually every year. A
staff team visits the country, collects economic and financial information, and discusses with officials the country's economic
developments and policies. On return to headquarters, the staff prepares a report, which forms the basis for discussion by the
Executive Board.
2 The central objective of PPM is to provide for closer monitoring of the policies of members that have substantial Fund credit
outstanding following the expiration of their arrangements. Under PPM, members undertake more frequent formal consultation
with the Fund than is the case under surveillance, with a particular focus on macroeconomic and structural policies that have a
bearing on external viability.
3 At the conclusion of the discussion, the Managing Director, as Chairman of the Board, summarizes the views of Executive
Directors, and this summary is transmitted to the country's authorities. An explanation of any qualifiers used in summings up can
be found here: http://www.imf.org/external/np/sec/misc/qualifiers.htm.
International Monetary Fund
700 19th Street, NW
Washington, D. C. 20431 USA
2
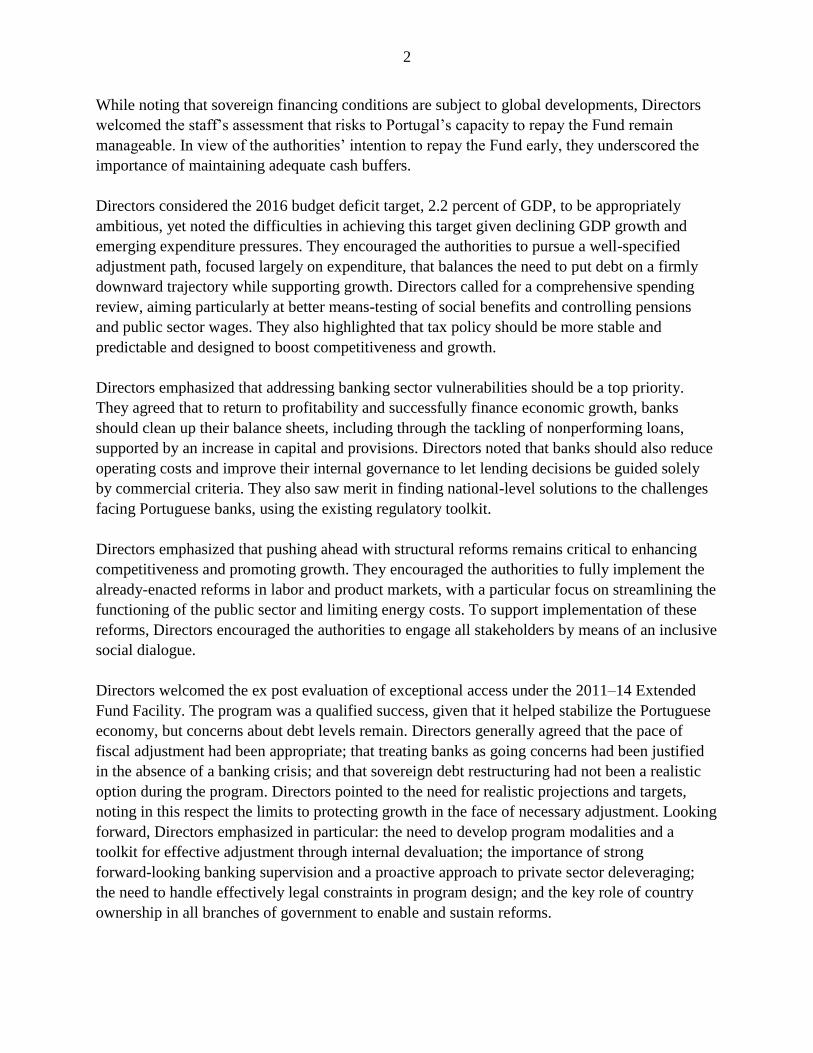
While noting that sovereign financing conditions are subject to global developments, Directors
welcomed the staff’s assessment that risks to Portugal’s capacity to repay the Fund remain
manageable. In view of the authorities’ intention to repay the Fund early, they underscored the
importance of maintaining adequate cash buffers.
Directors considered the 2016 budget deficit target, 2.2 percent of GDP, to be appropriately
ambitious, yet noted the difficulties in achieving this target given declining GDP growth and
emerging expenditure pressures. They encouraged the authorities to pursue a well-specified
adjustment path, focused largely on expenditure, that balances the need to put debt on a firmly
downward trajectory while supporting growth. Directors called for a comprehensive spending
review, aiming particularly at better means-testing of social benefits and controlling pensions
and public sector wages. They also highlighted that tax policy should be more stable and
predictable and designed to boost competitiveness and growth.
Directors emphasized that addressing banking sector vulnerabilities should be a top priority.
They agreed that to return to profitability and successfully finance economic growth, banks
should clean up their balance sheets, including through the tackling of nonperforming loans,
supported by an increase in capital and provisions. Directors noted that banks should also reduce
operating costs and improve their internal governance to let lending decisions be guided solely
by commercial criteria. They also saw merit in finding national-level solutions to the challenges
facing Portuguese banks, using the existing regulatory toolkit.
Directors emphasized that pushing ahead with structural reforms remains critical to enhancing
competitiveness and promoting growth. They encouraged the authorities to fully implement the
already-enacted reforms in labor and product markets, with a particular focus on streamlining the
functioning of the public sector and limiting energy costs. To support implementation of these
reforms, Directors encouraged the authorities to engage all stakeholders by means of an inclusive
social dialogue.
Directors welcomed the ex post evaluation of exceptional access under the 2011–14 Extended
Fund Facility. The program was a qualified success, given that it helped stabilize the Portuguese
economy, but concerns about debt levels remain. Directors generally agreed that the pace of
fiscal adjustment had been appropriate; that treating banks as going concerns had been justified
in the absence of a banking crisis; and that sovereign debt restructuring had not been a realistic
option during the program. Directors pointed to the need for realistic projections and targets,
noting in this respect the limits to protecting growth in the face of necessary adjustment. Looking
forward, Directors emphasized in particular: the need to develop program modalities and a
toolkit for effective adjustment through internal devaluation; the importance of strong
forward-looking banking supervision and a proactive approach to private sector deleveraging;
the need to handle effectively legal constraints in program design; and the key role of country
ownership in all branches of government to enable and sustain reforms.

3
Directors recognized the determinative role of EU support in Portugal’s recovery and current
stability. For the effective design of future Fund programs with members of currency unions,
most Directors considered that high priority should be put on clarifying options for union-level
conditionality, and for instruments to ensure that member countries’ program goals can be met in
the face of asymmetric shocks not easily resolved by union-wide monetary policy.
4
Portugal: Selected Economic Indicators
(Year-on-year percent change, unless otherwise indicated)
Projections
2014 2015 2016 2017
Real GDP 0.9 1.5 1.0 1.1
Private consumption 2.2 2.6 2.2 1.4
Public consumption -0.5 0.6 0.3 0.6
Gross fixed capital formation 2.8 4.1 -1.2 2.0
Exports 3.9 5.2 2.9 3.4
Imports 7.2 7.6 3.2 3.8
Contribution to growth (Percentage points)
Total domestic demand 2.2 2.5 1.3 1.4
Foreign balance -1.3 -1.1 -0.2 -0.3
Resource utilization
Employment 1.6 1.1 0.8 0.5
Unemployment rate (Percent) 13.9 12.4 11.8 11.3
Prices
GDP deflator 1.0 1.9 1.7 1.3
Consumer prices (Harmonized index) -0.2 0.5 0.7 1.1
Money and credit (End of period, percent change)
Private sector credit -8.0 -4.1 -2.2 -0.5
Broad money -0.9 4.1 2.3 2.0
Fiscal indicators (Percent of GDP)
General government balance -7.2 -4.4 -3.0 -3.0
Primary government balance -2.3 0.2 1.6 1.5
Structural primary balance (Percent of potential GDP) 3.7 3.3 2.8 2.4
General government debt 130.2 129.0 128.5 128.2
Current account balance (Percent of GDP) 0.1 0.5 0.0 -0.6
Nominal GDP (Billions of euros) 173.4 179.4 184.4 188.9
Sources: Bank of Portugal; Ministry of Finance; National Statistics Office (INE); Eurostat; and IMF staff projections.
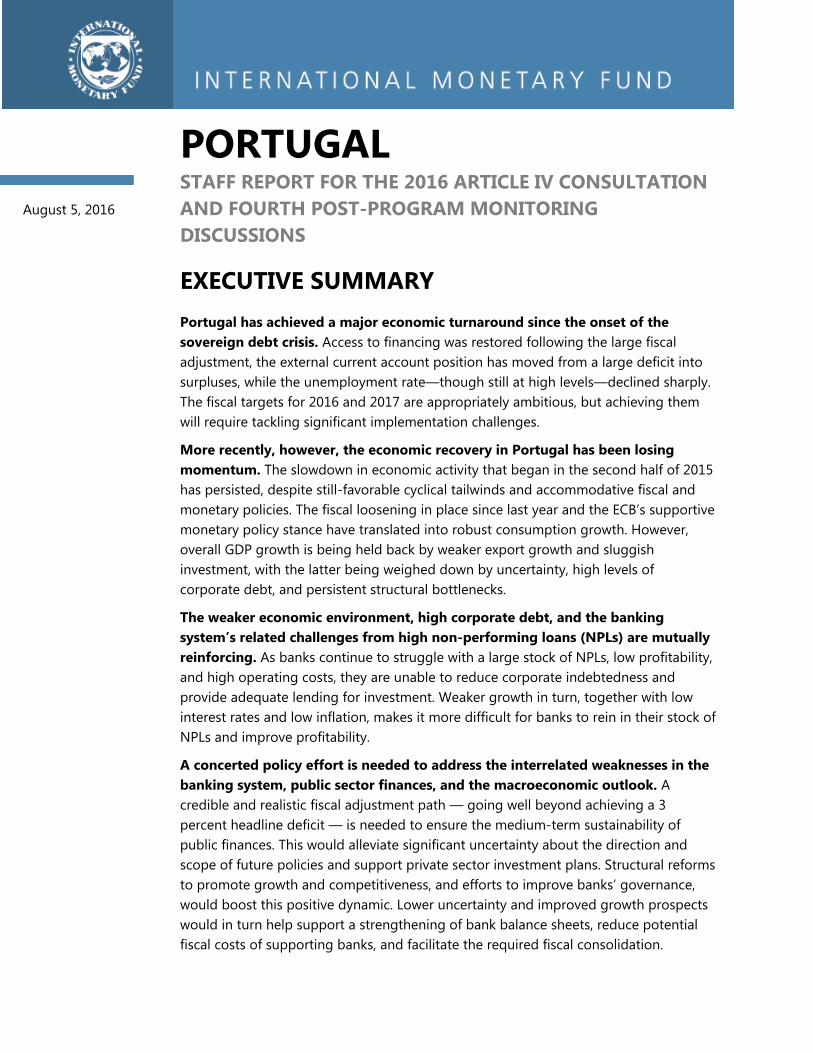
PORTUGAL STAFF REPORT FOR THE 2016 ARTICLE IV CONSULTATION AND FOURTH POST-PROGRAM MONITORING DISCUSSIONS
EXECUTIVE SUMMARY Portugal has achieved a major economic turnaround since the onset of the sovereign debt crisis. Access to financing was restored following the large fiscal adjustment, the external current account position has moved from a large deficit into surpluses, while the unemployment rate—though still at high levels—declined sharply. The fiscal targets for 2016 and 2017 are appropriately ambitious, but achieving them will require tackling significant implementation challenges.
More recently, however, the economic recovery in Portugal has been losing momentum. The slowdown in economic activity that began in the second half of 2015 has persisted, despite still-favorable cyclical tailwinds and accommodative fiscal and monetary policies. The fiscal loosening in place since last year and the ECB’s supportive monetary policy stance have translated into robust consumption growth. However, overall GDP growth is being held back by weaker export growth and sluggish investment, with the latter being weighed down by uncertainty, high levels of corporate debt, and persistent structural bottlenecks.
The weaker economic environment, high corporate debt, and the banking system’s related challenges from high non-performing loans (NPLs) are mutually reinforcing. As banks continue to struggle with a large stock of NPLs, low profitability, and high operating costs, they are unable to reduce corporate indebtedness and provide adequate lending for investment. Weaker growth in turn, together with low interest rates and low inflation, makes it more difficult for banks to rein in their stock of NPLs and improve profitability.
A concerted policy effort is needed to address the interrelated weaknesses in the banking system, public sector finances, and the macroeconomic outlook. A credible and realistic fiscal adjustment path — going well beyond achieving a 3 percent headline deficit — is needed to ensure the medium-term sustainability of public finances. This would alleviate significant uncertainty about the direction and scope of future policies and support private sector investment plans. Structural reforms to promote growth and competitiveness, and efforts to improve banks’ governance, would boost this positive dynamic. Lower uncertainty and improved growth prospects would in turn help support a strengthening of bank balance sheets, reduce potential fiscal costs of supporting banks, and facilitate the required fiscal consolidation.
August 5, 2016
PORTUGAL
2 INTERNATIONAL MONETARY FUND
Approved By Mahmood Pradhan and Vikram Haksar
Discussions took place in Lisbon during June 15 – 29, 2016. The staff team comprised S. Lall (head), M. Gaertner, D. Gershenson, I. Yackovlev (all EUR); K. Wiseman (SPR); M. Queyranne (FAD); A. Bouveret (MCM); A. Adriano (COM); and H. Schoelermann (EUO). Mr. Thomsen participated in the concluding meetings with Minister of Finance Centeno and central bank Vice Governor Neves, and C. Cottarelli and I. Lopes (both OED) participated in key meetings. Y. Cai and V. Bezerra de Menezes (both EUR) provided assistance from headquarters.
CONTENTS
ECONOMIC CONTEXT ____________________________________________________________________________ 4
POLICY DISCUSSIONS __________________________________________________________________________ 12
A.Financial Sector ________________________________________________________________________________ 12
B.Fiscal adjustment _______________________________________________________________________________ 14
C.Structural reforms ______________________________________________________________________________ 17
POST-PROGRAM MONITORING _______________________________________________________________ 20
STAFF APPRAISAL ______________________________________________________________________________ 21 BOXES 1. Banking System Challenges and Their Implications for Growth and Stability __________________ 23 2. The Demographic Challenge __________________________________________________________________ 24 FIGURES 1. Banking System __________________________________________________________________________________7 2. Risks and Policy Responses ____________________________________________________________________ 11 3. Selected Macroeconomic Developments ______________________________________________________ 25 4. Real Sector Indicators __________________________________________________________________________ 26 5. Balance of Payments Developments ___________________________________________________________ 27 6. Financial Sector Developments ________________________________________________________________ 28 TABLES 1. Selected Economic Indicators, 2013–2021 _____________________________________________________ 29 2a. General Government Accounts, 2013–2021 (Billions of euros) _______________________________ 30 2b. General Government Accounts, 2013–2021 (Percent of GDP) ________________________________ 31 3. Monetary Survey, 2013–2021 __________________________________________________________________ 32 4. Balance of Payments, 2013–2021 ______________________________________________________________ 33 5.Financial Soundness Indicators, 2012:Q1–2016:Q1 _____________________________________________ 34

PORTUGAL
INTERNATIONAL MONETARY FUND 3
6. External Debt Sustainability Framework, 2013–2021 ___________________________________________ 35 7. Indicators of Fund Credit, 2011–2021 __________________________________________________________ 36 8. General Government Financing Requirements and Sources, 2016–2021 ______________________ 37 9. External Financing Requirements and Sources, 2016–2021 ____________________________________ 38 ANNEXES I. Main Recommendations of the 2015 Article IV Consultation and Authorities’ Response ______ 39 II. External Stability Report _______________________________________________________________________ 41 IV. Public Debt Sustainability Analysis (DSA) _____________________________________________________ 45 V. No Extension Without Representation? New Evidence on the Role of Extending Collective Bargaining Agreements in Portugal ______________________________________________________________ 54
PORTUGAL
INTERNATIONAL MONETARY FUND 4
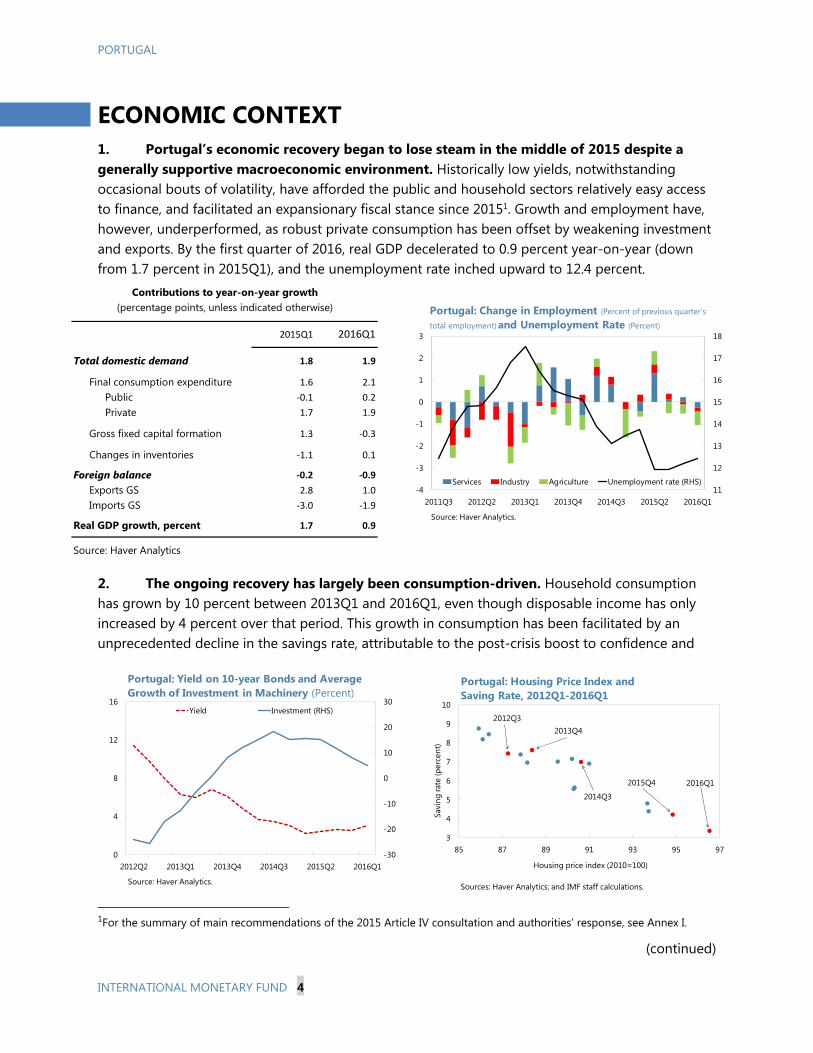
ECONOMIC CONTEXT 1. Portugal’s economic recovery began to lose steam in the middle of 2015 despite a generally supportive macroeconomic environment. Historically low yields, notwithstanding occasional bouts of volatility, have afforded the public and household sectors relatively easy access to finance, and facilitated an expansionary fiscal stance since 20151. Growth and employment have, however, underperformed, as robust private consumption has been offset by weakening investment and exports. By the first quarter of 2016, real GDP decelerated to 0.9 percent year-on-year (down from 1.7 percent in 2015Q1), and the unemployment rate inched upward to 12.4 percent.
2. The ongoing recovery has largely been consumption-driven. Household consumption has grown by 10 percent between 2013Q1 and 2016Q1, even though disposable income has only increased by 4 percent over that period. This growth in consumption has been facilitated by an unprecedented decline in the savings rate, attributable to the post-crisis boost to confidence and
1For the summary of main recommendations of the 2015 Article IV consultation and authorities’ response, see Annex I.
(continued)
-30
-20
-10
0
10
20
30
0
4
8
12
16
2012Q2 2013Q1 2013Q4 2014Q3 2015Q2 2016Q1
Yield Investment (RHS)
Portugal: Yield on 10-year Bonds and Average Growth of Investment in Machinery (Percent)
Source: Haver Analytics.
2015Q1 2016Q1
Total domestic demand 1.8 1.9
Final consumption expenditure 1.6 2.1
Public -0.1 0.2
Private 1.7 1.9
Gross fixed capital formation 1.3 -0.3
Changes in inventories -1.1 0.1
Foreign balance -0.2 -0.9
Exports GS 2.8 1.0
Imports GS -3.0 -1.9
Real GDP growth, percent 1.7 0.9
Source: Haver Analytics
Contributions to year-on-year growth(percentage points, unless indicated otherwise)
3
4
5
6
7
8
9
10
85 87 89 91 93 95 97
Savi
ng ra
te (p
erce
nt)
Housing price index (2010=100)
Portugal: Housing Price Index and Saving Rate, 2012Q1-2016Q1
Sources: Haver Analytics; and IMF staff calculations.
2015Q4 2016Q1
2014Q3
2013Q42012Q3
11
12
13
14
15
16
17
18
-4
-3
-2
-1
0
1
2
3
2011Q3 2012Q2 2013Q1 2013Q4 2014Q3 2015Q2 2016Q1
Services Industry Agriculture Unemployment rate (RHS)
Portugal: Change in Employment (Percent of previous quarter's
total employment) and Unemployment Rate (Percent)
Source: Haver Analytics.
PORTUGAL
INTERNATIONAL MONETARY FUND 5
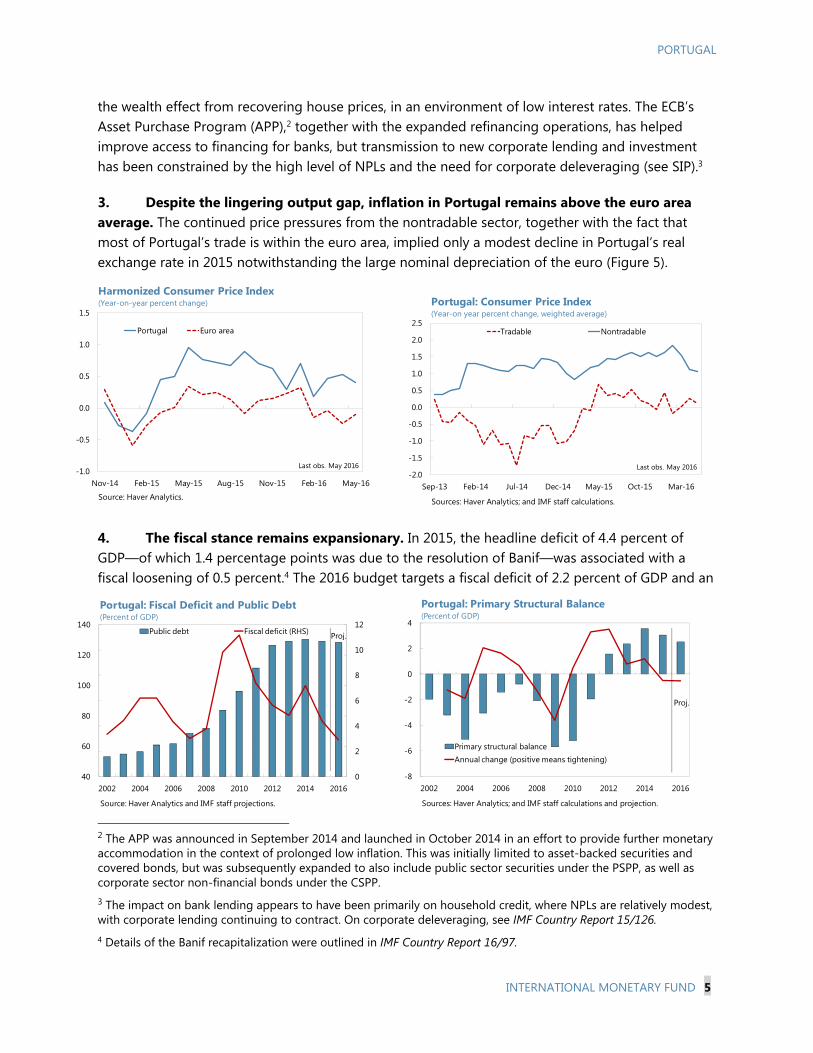
the wealth effect from recovering house prices, in an environment of low interest rates. The ECB’s Asset Purchase Program (APP),2 together with the expanded refinancing operations, has helped improve access to financing for banks, but transmission to new corporate lending and investment has been constrained by the high level of NPLs and the need for corporate deleveraging (see SIP).3
3. Despite the lingering output gap, inflation in Portugal remains above the euro area average. The continued price pressures from the nontradable sector, together with the fact that most of Portugal’s trade is within the euro area, implied only a modest decline in Portugal’s real exchange rate in 2015 notwithstanding the large nominal depreciation of the euro (Figure 5).
4. The fiscal stance remains expansionary. In 2015, the headline deficit of 4.4 percent of GDP—of which 1.4 percentage points was due to the resolution of Banif—was associated with a fiscal loosening of 0.5 percent.4 The 2016 budget targets a fiscal deficit of 2.2 percent of GDP and an
2 The APP was announced in September 2014 and launched in October 2014 in an effort to provide further monetary accommodation in the context of prolonged low inflation. This was initially limited to asset-backed securities and covered bonds, but was subsequently expanded to also include public sector securities under the PSPP, as well as corporate sector non-financial bonds under the CSPP. 3 The impact on bank lending appears to have been primarily on household credit, where NPLs are relatively modest, with corporate lending continuing to contract. On corporate deleveraging, see IMF Country Report 15/126. 4 Details of the Banif recapitalization were outlined in IMF Country Report 16/97.
0
2
4
6
8
10
12
2002 2004 2006 2008 2010 2012 2014 201640
60
80
100
120
140
Portugal: Fiscal Deficit and Public Debt (Percent of GDP)
Public debt Fiscal deficit (RHS)
Source: Haver Analytics and IMF staff projections.
Proj.
-8
-6
-4
-2
0
2
4
2002 2004 2006 2008 2010 2012 2014 2016
Portugal: Primary Structural Balance (Percent of GDP)
Primary structural balanceAnnual change (positive means tightening)
Sources: Haver Analytics; and IMF staff calculations and projection.
Proj.
-1.0
-0.5
0.0
0.5
1.0
1.5
Nov-14 Feb-15 May-15 Aug-15 Nov-15 Feb-16 May-16
Portugal Euro area
Harmonized Consumer Price Index (Year-on-year percent change)
Last obs. May 2016
Source: Haver Analytics.
-2.0
-1.5
-1.0
-0.5
0.0
0.5
1.0
1.5
2.0
2.5
Sep-13 Feb-14 Jul-14 Dec-14 May-15 Oct-15 Mar-16
Tradable Nontradable
Portugal: Consumer Price Index(Year-on year percent change, weighted average)
Last obs. May 2016
Sources: Haver Analytics; and IMF staff calculations.
PORTUGAL
6 INTERNATIONAL MONETARY FUND
implied primary structural tightening of 0.1 percent. Staff projects a deficit of 3.0 percent, however, on the basis of more conservative macroeconomic and fiscal projections. This is consistent with a further 0.5 percent of GDP loosening in the fiscal stance.
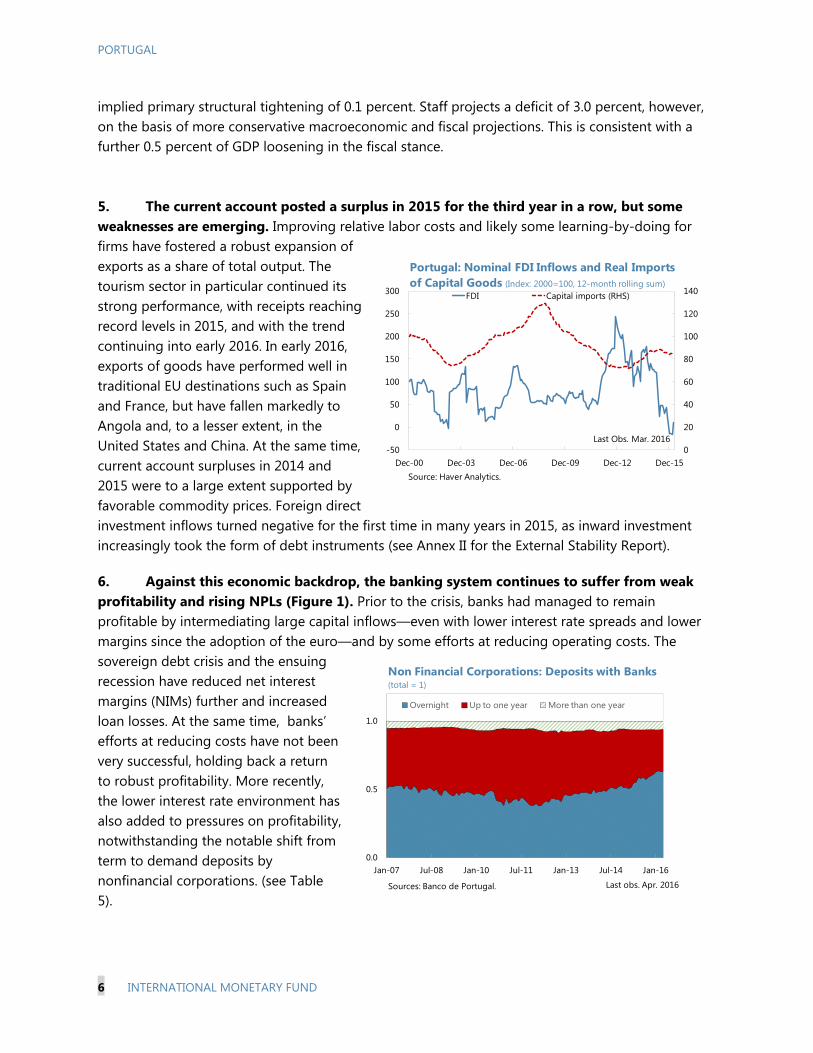
5. The current account posted a surplus in 2015 for the third year in a row, but some weaknesses are emerging. Improving relative labor costs and likely some learning-by-doing for firms have fostered a robust expansion of exports as a share of total output. The tourism sector in particular continued its strong performance, with receipts reaching record levels in 2015, and with the trend continuing into early 2016. In early 2016, exports of goods have performed well in traditional EU destinations such as Spain and France, but have fallen markedly to Angola and, to a lesser extent, in the United States and China. At the same time, current account surpluses in 2014 and 2015 were to a large extent supported by favorable commodity prices. Foreign direct investment inflows turned negative for the first time in many years in 2015, as inward investment increasingly took the form of debt instruments (see Annex II for the External Stability Report).
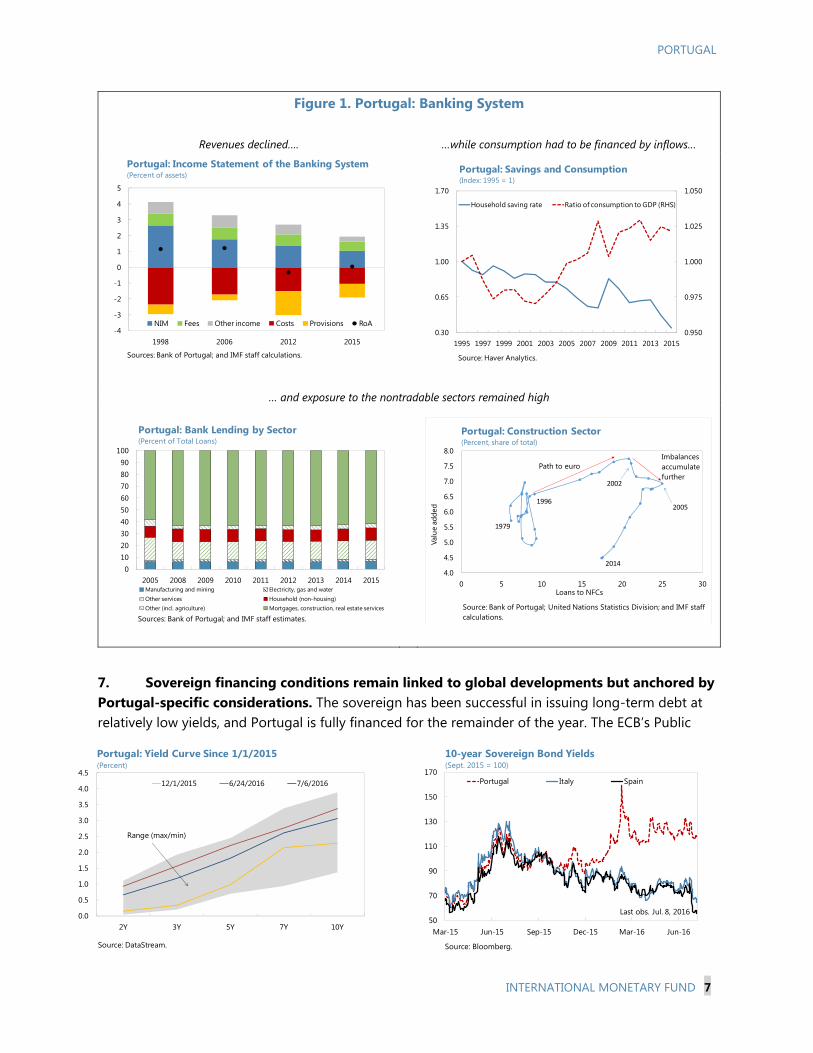
6. Against this economic backdrop, the banking system continues to suffer from weak profitability and rising NPLs (Figure 1). Prior to the crisis, banks had managed to remain profitable by intermediating large capital inflows—even with lower interest rate spreads and lower margins since the adoption of the euro—and by some efforts at reducing operating costs. The sovereign debt crisis and the ensuing recession have reduced net interest margins (NIMs) further and increased loan losses. At the same time, banks’ efforts at reducing costs have not been very successful, holding back a return to robust profitability. More recently, the lower interest rate environment has also added to pressures on profitability, notwithstanding the notable shift from term to demand deposits by nonfinancial corporations. (see Table 5).
0
20
40
60
80
100
120
140
-50
0
50
100
150
200
250
300
Dec-00 Dec-03 Dec-06 Dec-09 Dec-12 Dec-15
FDI Capital imports (RHS)
Portugal: Nominal FDI Inflows and Real Imports of Capital Goods (Index: 2000=100, 12-month rolling sum)
Source: Haver Analytics.
Last Obs. Mar. 2016
0.0
0.5
1.0
Jan-07 Jul-08 Jan-10 Jul-11 Jan-13 Jul-14 Jan-16
Overnight Up to one year More than one year
Non Financial Corporations: Deposits with Banks(total = 1)
Sources: Banco de Portugal. Last obs. Apr. 2016
PORTUGAL
INTERNATIONAL MONETARY FUND 7
7. Sovereign financing conditions remain linked to global developments but anchored by Portugal-specific considerations. The sovereign has been successful in issuing long-term debt at relatively low yields, and Portugal is fully financed for the remainder of the year. The ECB’s Public
Figure 1. Portugal: Banking System
Revenues declined…. …while consumption had to be financed by inflows…
… and exposure to the nontradable sectors remained high
50
70
90
110
130
150
170
Mar-15 Jun-15 Sep-15 Dec-15 Mar-16 Jun-16
Portugal Italy Spain
10-year Sovereign Bond Yields(Sept. 2015 = 100)
Source: Bloomberg.
Last obs. Jul. 8, 20160.0
0.5
1.0
1.5
2.0
2.5
3.0
3.5
4.0
4.5
2Y 3Y 5Y 7Y 10Y
Portugal: Yield Curve Since 1/1/2015(Percent)
12/1/2015 6/24/2016 7/6/2016
Range (max/min)
Source: DataStream.
-4
-3
-2
-1
0
1
2
3
4
5
1998 2006 2012 2015
NIM Fees Other income Costs Provisions RoA
Sources: Bank of Portugal; and IMF staff calculations.
Portugal: Income Statement of the Banking System(Percent of assets)
0.950
0.975
1.000
1.025
1.050
0.30
0.65
1.00
1.35
1.70
1995 1997 1999 2001 2003 2005 2007 2009 2011 2013 2015
Household saving rate Ratio of consumption to GDP (RHS)
Portugal: Savings and Consumption (Index: 1995 = 1)
Source: Haver Analytics.
4.0
4.5
5.0
5.5
6.0
6.5
7.0
7.5
8.0
0 5 10 15 20 25 30
Valu
e ad
ded
Loans to NFCs
Portugal: Construction Sector(Percent, share of total)
1979
2002
2014
19962005
Path to euroImbalances accumulatefurther
Source: Bank of Portugal; United Nations Statistics Division; and IMF staffcalculations.
0102030405060708090
100
2005 2008 2009 2010 2011 2012 2013 2014 2015Manufacturing and mining Electricity, gas and waterOther services Household (non-housing)Other (incl. agriculture) Mortgages, construction, real estate services
Portugal: Bank Lending by Sector(Percent of Total Loans)
Sources: Bank of Portugal; and IMF staff estimates.

PORTUGAL
8 INTERNATIONAL MONETARY FUND
Sector Purchase Program (PSPP) purchases have been equivalent to a large share of the government’s gross financing needs and helped minimize volatility. Nevertheless, yields have diverged distinctly from those for Spain and Italy since last October and remain elevated, suggesting that markets are pricing in some Portugal-specific considerations. Staff’s views 8. The growth outlook has weakened. As in the pre-crisis years, consumption is once again growing strongly, and the government is able to finance itself comfortably in bond markets. However, private and public debt levels are much higher than in 2011, and the prospects for further gains in competitiveness appear limited. As a result, the ongoing weakness in investment and the slowdown in export growth are likely to remain in place for some time. Accordingly, the 2016 growth forecast has been revised down, from 1.4 to 1.0 percent for this year. The impact of the U.K. referendum on Portugal’s baseline growth outlook is expected to be marginal as of now, but has increased downside risks.5
9. The banking system faces vulnerabilities from weak asset quality, thin capital buffers, and low profitability. The banking system has required a series of taxpayer-financed interventions over the years, including most recently at the end of 2015 for Banif. Recapitalization needs of the largest bank Caixa Geral de Depósitos (CGD) and possible losses from the sale of Novo Banco may
5 Based on the limited scenario presented in IMF Country Report 16/169. That scenario has been consistent with the post-referendum behavior of the financial markets.
(continued)
-5
0
5
10
15
240
255
270
285
300
315
330
1995 1997 1999 2001 2003 2005 2007 2009 2011 2013 2015
Net capital stock
Net investment (RHS)
Portugal: Capital Stock and Investment(Percent of GDP)
Sources: Haver Analytics.
95
100
105
110
115
62
63
64
65
66
67
68
1998Q1 2002Q3 2007Q1 2011Q3 2016Q1
Private Consumption Domestic Demand (RHS)
Portugal: Private Consumption and Domestic Demand (Percent of GDP, 4-quarters moving averages)
Source: Haver Analytics.
Pre-QE Actual Differenceprojections 1/
Total domestic demand 0.5 4.6 4.1
Final consumption expenditure -0.3 3.2 3.5
Gross capital formation 0.8 1.4 0.6
Foreign balance 1.7 -2.3 -4.0
Real GDP growth (percent) 2.3 2.4 0.1
Sources: Haver Analytics; and IMF staff projections.1/ Projections made at the time of the 8th-9th Review EFF, November 2013, IMF Country Report 13/324.
Portugal: Contributions to Cumulative Growth, 2014-15(Percentage points, unless indicated otherwise)

PORTUGAL
INTERNATIONAL MONETARY FUND 9
necessitate further injections of public money, consistent with the application of EU state aid rules and the Bank Recovery and Resolution Directive (BRRD).6 In addition, financial markets’ view of publicly traded banks has deteriorated, as reflected in rising CDS spreads. Furthermore, with a large fraction of banks’ loan book tied up in financially weak and unproductive enterprises, banks are not in a position to spur economic growth by financing the investment needs of newly-created high-productivity firms.
10. Portugal’s external position remains weaker than implied by medium-term fundamentals and desirable policy settings. The EBA estimates are mixed but have deteriorated since the last Article IV consultation. The real effective exchange rate measures indicate moderate to substantial overvaluation in 2015, even though the current-account measures suggest the external position is broadly in balance relative to medium-term fundamentals. Though somewhat lower than in 2014, the net international investment position remains highly elevated at around 106 percent of projected 2016 GDP. While the ES approach compares the current account balance with the balance required to stabilize external debt, a larger surplus is needed to put external liabilities on a path to more sustainable levels. Similarly, favorable oil price developments have masked the effect of rising consumption-based imports, which are projected to turn the current account into deficit over the forecast horizon.
11. Risks to the outlook are on the downside. The recent economic deceleration together with the all-time low savings rate suggest that the consumption-driven recovery may run out of steam in the near future. Additional recapitalization needs in the banking sector also cannot be ruled out. Moreover, the 2016 budgetary targets are unlikely to be achieved without additional measures. With an investment-grade rating—necessary for Portugal’s participation in PSPP—provided by only one of the four rating agencies, the country is exposed to a low-probability but high-impact risk of a ratings downgrade. More broadly, Portugal remains dependent on external financing and exposed to financial turbulence arising from global risks including the aftermath of the U.K. referendum and lower-than-anticipated growth in Europe (see Annex III).
6 On recent Banif and Novo Banco operations, see IMF Country Report 16/97. Any losses from the sale of Novo Banco will be recorded on the books of the Resolution Fund, an entity within the general government perimeter.
20153 2016 20153 2016
Current account approach 1.9 0.0 -5 0ES approach 1.2 0.5 -3 -1Index REER approach … … 2.9 4.5Level REER approach … … 8.5 8.5
Source: IMF staff projections.1Estimates based on data available in January 2016.2A positive REER gap indicates overvaluation.3EBA estimates at the time of the 2015 Article IV Consultation.
Current account gap(Percent of GDP)
REER gap2
(Percent)
Portugal: External Balance Assessment Results1
PORTUGAL
10 INTERNATIONAL MONETARY FUND
12. The currently comfortable access to market financing is being supported by the ECB’s monetary policy stance. Sovereign yields have been contained due to market perceptions that the ECB’s PSPP will be extended beyond the current end date. In view of this, the macroeconomic policy framework needs to be strengthened to ensure durable access to financing once the monetary policy stance normalizes, even if the latter is a sufficiently distant prospect.
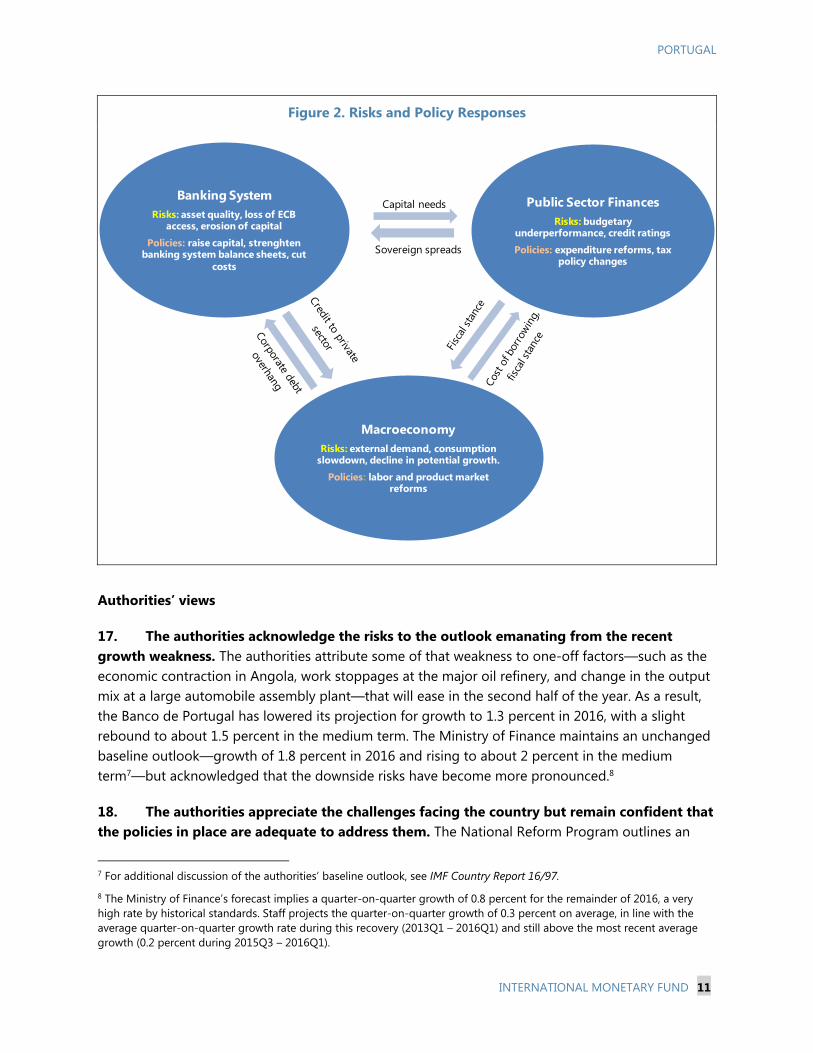
13. Even as QE provides a cushion, Portugal faces a multiplicity of self-reinforcing vulnerabilities. There are three major areas of weakness: the banking system (facing a high level of NPLs), public sector finances, and the macroeconomic outlook. Problems arising in any single area could impact all others, potentially leading to a spiraling effect (see Figure 2).
14. Any development that worsens the dynamics of public debt could trigger a sudden change in market sentiment. It could be fiscal slippages resulting from either policy reversals or a macro shock, or materialization of large contingent liabilities, including from the banking system. A sharp rise in borrowing costs would further worsen debt dynamics and could force a large fiscal adjustment, aggravating the impact on growth. In addition, an increase in yields would lower the value of banks’ holdings of sovereign debt and weaken their capital position. Even if the fiscal consequences of higher yields were to materialize slowly due to the high average debt maturity, persistently high yields could dampen the general macroeconomic outlook and the prospects for the banking sector.
15. A negative reassessment of the country’s macroeconomic prospects could similarly lead to a negative spiral. A poor macroeconomic outlook (due to, for instance, a global economic slowdown or an abrupt normalization of the domestic saving rate that is not offset by higher investment) would worsen the dynamics of public and private debt and negatively affect the fiscal outlook. Already-indebted corporations and households would struggle to pay their debts, further undermining banks’ asset quality, while the government would find it difficult to access financing at favorable rates.
16. Even in the absence of an immediate challenge, failure to address the above-mentioned weaknesses could put Portugal on an unsustainable medium-term trajectory and leave it vulnerable to shocks. Without meaningful policy action, Portugal will be unable to adjust to the constraints of the monetary union or exploit the benefits of integration fully. Low growth, unreformed fiscal spending, and weak banks will preclude much-needed (and still possible) convergence and could lead to a loss of market access even under small shocks.
PORTUGAL
INTERNATIONAL MONETARY FUND 11
Figure 2. Risks and Policy Responses
Authorities’ views
17. The authorities acknowledge the risks to the outlook emanating from the recent growth weakness. The authorities attribute some of that weakness to one-off factors—such as the economic contraction in Angola, work stoppages at the major oil refinery, and change in the output mix at a large automobile assembly plant—that will ease in the second half of the year. As a result, the Banco de Portugal has lowered its projection for growth to 1.3 percent in 2016, with a slight rebound to about 1.5 percent in the medium term. The Ministry of Finance maintains an unchanged baseline outlook—growth of 1.8 percent in 2016 and rising to about 2 percent in the medium term7—but acknowledged that the downside risks have become more pronounced.8
18. The authorities appreciate the challenges facing the country but remain confident that the policies in place are adequate to address them. The National Reform Program outlines an
7 For additional discussion of the authorities’ baseline outlook, see IMF Country Report 16/97.
8 The Ministry of Finance’s forecast implies a quarter-on-quarter growth of 0.8 percent for the remainder of 2016, a very high rate by historical standards. Staff projects the quarter-on-quarter growth of 0.3 percent on average, in line with the average quarter-on-quarter growth rate during this recovery (2013Q1 – 2016Q1) and still above the most recent average growth (0.2 percent during 2015Q3 – 2016Q1).
MacroeconomyRisks: external demand, consumption
slowdown, decline in potential growth.
Policies: labor and product market reforms
Public Sector FinancesRisks: budgetary
underperformance, credit ratings
Policies: expenditure reforms, tax policy changes
Banking SystemRisks: asset quality, loss of ECB
access, erosion of capital
Policies: raise capital, strenghten banking system balance sheets, cut
costs
Capital needs
Sovereign spreads
PORTUGAL
12 INTERNATIONAL MONETARY FUND
appropriate way forward on the structural front; the weaknesses in banks should be addressed at the European level; and the envisaged fiscal path strikes a right balance between the demands of fiscal sustainability and the need to support domestic consumption and investment.
POLICY DISCUSSIONS A. Financial Sector
19. Concerns over two large banks weigh on the outlook for the sector. Market participants are wary of the significant capital needs of the country’s largest bank CGD (with publicly available estimates approaching 3 percent of GDP), taking them as possibly indicative of larger NPL problems in other banks as well. Another source of uncertainty is the size of losses other banks would sustain if the ongoing bidding for Novo Banco—which received a €3.9 billion injection of public money (2.2 percent of GDP) that will eventually need to be recouped from the banks—were to disappoint. Bank stocks have been under continuous downward pressure in recent months.
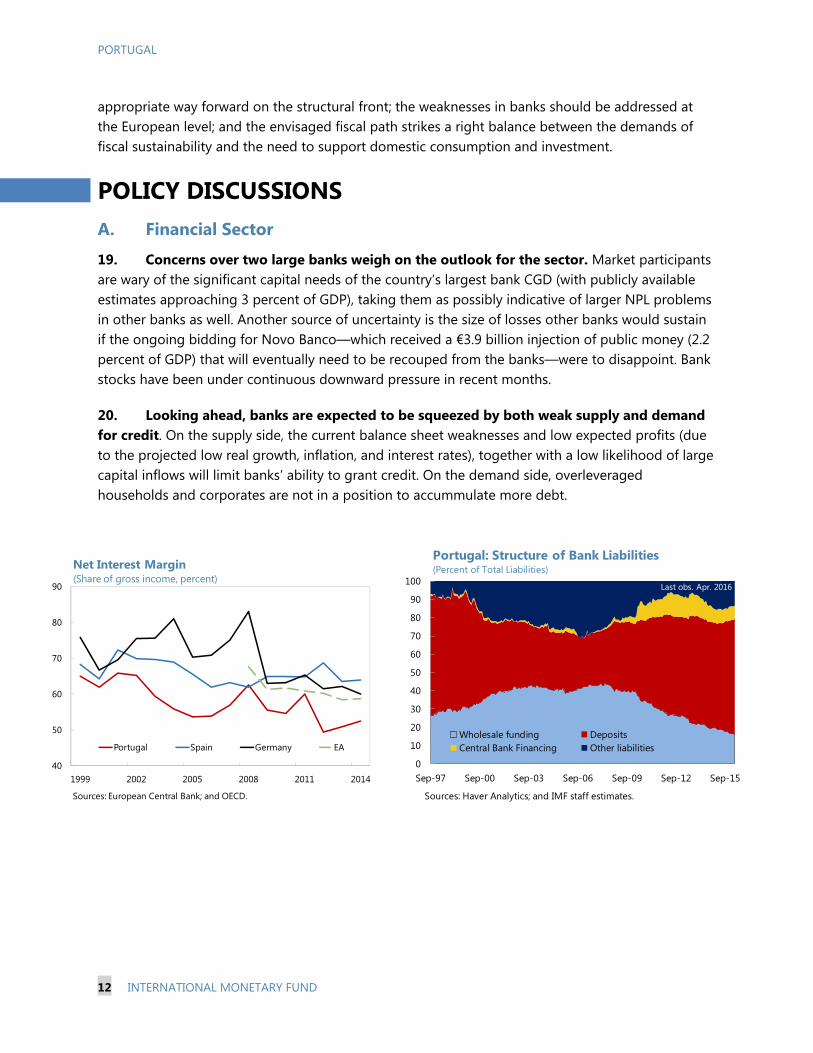
20. Looking ahead, banks are expected to be squeezed by both weak supply and demand for credit. On the supply side, the current balance sheet weaknesses and low expected profits (due to the projected low real growth, inflation, and interest rates), together with a low likelihood of large capital inflows will limit banks’ ability to grant credit. On the demand side, overleveraged households and corporates are not in a position to accummulate more debt.
40
50
60
70
80
90
1999 2002 2005 2008 2011 2014
Portugal Spain Germany EA
Sources: European Central Bank; and OECD.
Net Interest Margin(Share of gross income, percent)
0
10
20
30
40
50
60
70
80
90
100
Sep-97 Sep-00 Sep-03 Sep-06 Sep-09 Sep-12 Sep-15
Wholesale funding DepositsCentral Bank Financing Other liabilities
Portugal: Structure of Bank Liabilities(Percent of Total Liabilities)
Sources: Haver Analytics; and IMF staff estimates.
Last obs. Apr. 2016

PORTUGAL
INTERNATIONAL MONETARY FUND 13
Staff views
21. Addressing the challenges facing the banking system should be an urgent priority. A comprehensive approach is needed for banks need to clean up their balance sheets.9 This should include restructuring problem loans supported by an increase in banks’ capital buffers, provisions, and impairments.10 This would also require appropriately pricing and selling poor quality legacy assets and raising capital, albeit under challenging circumstances. Moreover, a governance structure that more fully reflects the interests of the shareholders will make increasing profitability banks’ primary objective (see SIP). Banks need to diversify exposures—in particular by shifting their attention from nontradable to tradable sectors—in order to better manage risks and to be well-positioned to finance new engines of growth. Since banks’ interest income will be constrained by the projected low-interest environment,11 and since banks already derive a relatively high proportion of their income from fees, cutting costs is necessary to achieve higher profitability. This would likely require further consolidation in the banking system, and cutting the extensive branch network and staffing costs. Focused bank supervision—already enhanced to pay more attention to capital weaknesses—will be an important driver of these policies.12 The European framework provides flexibility to address specific issues currently under consideration (CGD and Novo Banco). Access to bank-level data would permit a more granular assessment of challenges facing the banking system than is currently feasible for staff. Broader issues facing the banking system are outlined in Box 1.
9 See IMF Staff Discussion Note 15/19. In Portugal, debt restructuring will unavoidably lead to the closure of many unproductive firms, but that would be an important step toward reallocating resources to more productive activities. According to firm-level data, Portugal’s highly-indebted low-productivity firms account for 25 percent of employment and 20 percent of debt, but only for 5 percent of value added.
10 There is evidence that higher capital ratios lead to lower bank funding costs and higher credit growth in the economy. See L. Gambacorta and H. S. Shin. 2016. “Why Bank Capital Matters for Monetary Policy.” BIS Working Paper 558.
11 See C. Borio, L. Gambacorta, and B. Hofmann. 2015. “The Influence of Monetary Policy on Bank Profitability.” BIS Working Paper 514.
12 For more on recent supervisory developments, see IMF Country Report 15/21.
(continued)
0.15
0.20
0.25
0.30
0.35
0.40
1999 2002 2005 2008 2011 2014
Portugal Spain Germany
Sources: European Central Bank; and OECD.
Bank Income from Fees and Commissions(Share of Gross Income)
25
30
35
40
45
50
55
2011 2012 2013 2014 2015
Portugal Spain Germany Italy
Sources: SNL Financial; and IMF staff estimates.
Bank Compensation(Share of Total Revenue, percent)

PORTUGAL
14 INTERNATIONAL MONETARY FUND
22. Dealing with corporate debt overhang is a matter of particular importance. Successful deleveraging would allow banks to reallocate resources away from less productive sectors of the economy and toward viable firms, which will in turn contribute to higher economic growth. To achieve this, a standardized bank-led, time-bound framework for restructuring—which would ideally entail an accelerated pace of SME restructuring and large-scale write-offs for the banks—is needed.13
Authorities’ views
23. The authorities concurred that additional steps should be taken, both at national and European levels, to strengthen bank balance sheets and restore profitability to the banking sector. They underscored that high levels of non-performing loans are present in several euro area banking systems and therefore a systemic European solution for this issue—such as a pan-European asset management corporation—is required. The current low interest rate environment and the economic cycle are not favorable for Portuguese banks, despite the easing of financing conditions afforded by ECB’s accommodative monetary policy. Banks also face additional hurdles in cleaning up their balance sheets because the current framework (BRRD) restricts the use of public money outside the resolution process, while allowing it only under exceptional circumstances during resolution.
B. Fiscal adjustment
24. The authorities’ 2016 fiscal target appears at risk in the absence of additional measures to support spending restraint. The cash outturn for January-May shows a sizable under-execution of spending relative to the budget, reflecting significant efforts to contain discretionary expenditure. Revenue is expected to fall short of the full-year target as specified in the 2016 budget by 0.6 percent of GDP, however, with growth projected to decline well below the budget assumption of 1.8 percent, while maintaining expenditure restraint in the second half of the year is likely to be difficult. Spending pressures are likely to emerge from the move to the 35-hour work week for the majority of civil servants at the beginning of July, the continued rollback of public sector wage cuts and some catch-up in capital spending. The increase in arrears and non-financial debt during January-May, particularly from hospitals, already suggests that spending pressures may be building from the containment of intermediate consumption. In the absence of additional measures, staff projects a deficit of 3 percent of GDP, compared with the official target of 2.2 percent.
Staff views
25. Portugal remains uniquely vulnerable to shifts in market sentiment. The high stock of public debt, large refinancing needs, potential liabilities stemming from the financial sector, and low growth and inflation projected for the foreseeable future all point to the fact that fiscal policy should
13 For more on corporate debt restructuring, see IMF Country Report 15/126 and IMF Country Report 16/97.

PORTUGAL
INTERNATIONAL MONETARY FUND 15
be guided by debt sustainability considerations. At current levels, debt dynamics remain vulnerable to even relatively small shocks.
26. A credible fiscal adjustment is therefore needed to put public debt on a firmly downward trajectory and ensure the medium-term sustainability of public finances. Even though the objective of fiscal policy is often perceived as trying to meet a three-percent headline deficit target annually—viewed by many commentators as Portugal’s European fiscal commitment— the public debate should internalize the need for realistic and appropriately paced fiscal consolidation. The authorities’ Stability Program (SP) targets a 2.6-percent-of-GDP adjustment in the nominal fiscal deficit from 2016-2020, to be achieved through a decrease in the public sector wage bill, rationalization of intermediate consumption, reduction in fraudulent claims for social transfers, and interest savings from further prepayments to the Fund. The spending containment strategy in these areas is not supported by specific reforms, however, and relies heavily on assumed improvements in spending efficiency. In addition, the SP relies on optimistic growth and revenue assumptions to underpin the projected decline in expenditure-to-GDP and public debt ratios, with the latter falling to 110 percent of GDP by 2020.14 For staff’s debt sustainability assessment, see Annex IV.
27. A structural primary adjustment of 0.5 percent of GDP in 2017 and 2018 would be an appropriate fiscal path, but that should be underpinned by credible measures. The focus of fiscal adjustment should be on spending reform, in particular in public wages and pensions, given Portugal’s already-high tax burden. The authorities have recently launched a bottom-up exercise to identify scope for efficiency gains in the areas of health, education, public administration, and state-owned enterprises. Due to its non-systematic nature and lack of clear savings objective, however, such an exercise falls short of a comprehensive spending review needed to generate a lasting impact on the government's outlays. Going forward, the spending review should adopt a more top-down approach to fix the overall spending envelope of the general government, and take a medium-term perspective to achieve more ambitious savings, anchored on the SP’s fiscal targets and locked in the annual budgets. Priority should be given to the most promising areas for generating savings, as follows:
14 The projected decline in public debt also assumes substantial revenues from the sale of government-owned financial sector assets, which would be used to reduce new debt issuance.
Overall balance
Structural primary
adjustment
Baseline -3.0 -0.5Staff recommendation -2.0 0.5Stability program1 -1.4 1.0
(Percent of GDP)Fiscal Projections, 2017
1 Overall balance as given in the SP; implied adjustment calculated based on staff's macroeconomic scenario.

PORTUGAL
16 INTERNATIONAL MONETARY FUND
a. There is a significant scope to improve the impact of public spending on poverty and inequality and to reduce growth of healthcare cost. Stronger means-testing of social benefits would reduce fiscal costs, as Portugal has one of the highest shares of social benefits going to the high-income households. To partially offset the pressures from population aging, policies to reduce healthcare costs should be expanded and pursued forcefully (see Box 2 and SIP).
b. A clear strategy is needed to underpin the authorities’ plan to reduce the public sector
wage bill. The targets presented in the SP rely heavily on natural attrition and could prove difficult to achieve given the full reversal of the program-era nominal wage cuts and the partial reinstatement of 35-hour work week in 2016. The authorities should adopt a well-specified strategy, including (i) exempting the health sector from the implementation of the 35-hour week, and pursuing school network consolidation given the declining school-age population; (ii) increasing the rate of natural attrition to gradually reduce public employment; (iii) reducing the wage premium relative to the private sector, by rationalizing allowances and supplements; and (iv) limiting the wage drift, by streamlining career path and maintaining the freeze in career progression beyond 2018.
c. While recent pension reforms will generate large savings in the long term and should be preserved, more action is needed to reduce the high level of pension spending in the short term. Reforms introduced to date will generate savings only over the long term due to extensive grandfathering rules that protect current retirees, while placing a substantial adjustment burden on future generations of retirees (see Box 2). Revisiting recent pension reforms should address inequities across generations and pension schemes including by accelerating the convergence between the public and private sector schemes and avoiding an increase in pensions’ contribution that would finance higher benefits.
28. The tax policy reforms outlined in the 2016 Stability Program have not been fully articulated, but appear to fall short of what is needed to boost competitiveness and growth. Tax policy is primarily geared toward supporting household income to increase domestic
DEN
FRA
NDL
SWEFIN
AUT
DEU
ITABEL
IRL
GRC
GBR
PRT
ESP
LUX
CYPMLT
SRBLTU
BGRCZE
EST
HRV
LVA
SVLSVK HUNPOLROU
0
5
10
15
20
25
30
10 15 20 25 30 35 40Sh
are
of M
eans
test
ed s
pend
ing
(per
cent
)
Total social protection spending (percent of GDP)
Source: Eurostat.Note: Dashed lines represent medians.
Social Protection Spending and Means-Tested Spending (Excluding pensions)
0.0000.0010.0020.0030.0040.0050.0060.0070.0080.0090.0100.0110.012
IRL
EST
LTU
LVA UK
MLT
POL
SWE
CZE
SVK
FIN
DEN LU
XSV
NES
PD
EUEU
-27
AUT
CYP
GRC PR
TIT
ABG
RFR
AN
LD
The Redistributive Power of Public Spending(Reduction of the GINI coefficient due to 1 percent of GDP of social benefits)
Sources: Eurostat; and IMF staff estimates.
PORTUGAL
INTERNATIONAL MONETARY FUND 17
consumption through the complete elimination of the PIT surcharge by 2017, a reduction in the VAT rate for restaurants from July 2016, and a fiscally-neutral increase in income tax progressivity. More marginally, the government also intends to support corporate investment by expanding the targeted tax incentives for investment and SMEs. The government’s other priorities include reducing compliance costs and the bias towards debt by corporates, which are in line with staff’s earlier recommendations.15 Overall, a more stable and predictable tax system is needed to stimulate corporate investment.
Authorities’ views
29. The authorities were confident that their 2016 fiscal target as articulated in the budget (a 2.2-percent-of-GDP deficit) is within reach. They were encouraged by the January-May outturn, and optimistic that strong private consumption would help support revenue collection despite the slower headline growth. The authorities also noted that the frozen appropriation for purchases of goods and services has been increased in the 2016 budget, and believed that this should provide sufficient buffer to withstand any additional spending needs that might emerge in the second half of the year. They also cited scope for increased efficiency in the health sector that could help minimize any increase in overtime costs resulting from the shift to the 35-hour work week for some health professionals.
30. The authorities remain committed to the fiscal plans laid out in the SP, including a deficit target of 1.4 percent of GDP for 2017. They re-affirmed their commitment to the downsizing of the public sector through natural attrition, and hiring caps in line with replacement rules and were confident that the recently-launched spending review would effectively underpin the planned rationalization of intermediate consumption. In particular, they favored a deep bottom-up spending review in the areas they have identified for the ongoing exercise, with a subsequent broadening to other areas. The authorities also emphasized that any changes to the pension system would be mindful of both the long-term financial sustainability of the system and the existing rights of current beneficiaries.
C. Structural reforms
31. There has been little forward movement on structural reforms since the end of the adjustment program. Proposals to link future increases in minimum wages to productivity were set aside after the expiration of the program, and the minimum wage was raised in October 2014 by 4 percent. The minimum wage was raised once more in January 2016 by 5 percent, and accompanied by the reinstatement of four public holidays eliminated during the 2011-14 EFF, and a reopening of the TAP privatization and the public transport concessions, by renegotiating the former and suspending the Carris, STCP, and Metro de Lisboa subconcessions.16 The structural
15 See IMF Country Report No. 15/127.
16 See IMF Country Report 16/97.
(continued)

PORTUGAL
18 INTERNATIONAL MONETARY FUND
reform agenda centers on developing human capital, reducing labor market segmentation17, raising the minimum wage, and reforming state-owned enterprises18 and public administration19, although the details have yet to be specified fully.20 Even though the interim objectives for eliminating the energy sector’s tariff debt were met in 2015, the full tariff debt is now projected to be eliminated only in 2024 (four years after the target date under the program) to a large extent due to an increase in tariff subsidies.21 Finally, the authorities announced a partial reversal of the 2014 judicial road map intended to consolidate locations and resources of court services to permit judicial specialization and enhance the efficiency of the courts.22 In the absence of consolidated data, anecdotal evidence suggests that further efficiency gains are needed in the fiscal/administrative, and insolvency courts.
Staff views
32. Raising Portugal’s growth potential is essential to accelerate income convergence and spur job creation. This takes on increased urgency in light of Portugal’s demographic challenges, with an aging population and a declining labor force (Box 2). Raising Portugal’s growth potential will require fully implementing the already-enacted reforms in labor and product markets to ensure that statutory changes are translated into tangible outcomes. Fresh labor market reforms are also needed, particularly with regard to re-integration of the longer-term unemployed and lower-skilled workers. There is little scope to reverse the policies that have made hiring and collective bargaining more flexible, since doing so could have adverse consequences for Portugal’s growth outlook and prospects.
33. Uncertainty over the direction over structural reforms appears to be a significant factor in the slowdown in investment. While the authorities have not introduced any further
17 In this area, the particular focus is on limiting temporary contracts, self-employment, and the scope for individual firms to deviate from sectoral collective bargaining agreements.
18 The improvement in consolidated operational results of the state-owned enterprises has fallen short of government’s targets. At end-September 2015, negative net income was about 6 times higher than projected, driven by the transport and health sectors, and the consolidated positive EBITDA is 44 percent lower than anticipated, mainly due to hospitals’ underperformance.
19 Efforts in this area are geared toward reducing red tape, simplifying the legal framework, and increasing decentralization.
20 The National Reform Program (NRP) for 2016 puts forward initiatives to improve the skills of the labor force through reforms to the national education system, and additional funding for research in science and technology and IT training programs. In addition, the NRP seeks to foster innovation through investment in start-ups and SMEs. Financing for these various initiatives would primarily come from EU structural funds.
21 Since 2006, the payments to electricity producers have been independent from demand, determined through contracts that hedged against oil price fluctuations, whereas end-user prices were set below cost. This resulted in multi-year tariff deficits, which generated a stock of tariff debt of €5 billion at end-2015.
22 The implementation of a new judicial road map was intended to better align Portugal with European judiciary standards, and entailed closing 20 courts and converting 27 more to proximity sections. Prior to the implementation of the road map in 2014, Portugal had 3.18 courts and 19.2 judges per 100,000 inhabitants – significantly above the EU average of 2.37 courts per 100,000 inhabitants. The authorities have announced that all judicial units will be designated as courts and that five of the previous proximity sections will have permanent judges y.
PORTUGAL
INTERNATIONAL MONETARY FUND 19
changes in the labor market beyond the increase in the minimum wage, measures to protect sectoral collective bargaining—restraining the use of temporary contracts and limiting the flexibility for firm-level negotiations—remain under discussion. A change in the direction of reforms would add to the uncertainty already weighing on investment and diminish medium-term growth prospects. In particular, any unwinding of past policies that have succeeded in making hiring and collective bargaining more flexible would have adverse consequences for employment and the competitiveness of Portuguese firms (see Annex V).
34. An ambitious program of structural reforms is also needed to support the consolidation efforts, and promote growth and competitiveness. An efficient and effective public sector is essential for unlocking Portugal’s growth potential through its positive effects on investor confidence, private employment and competitiveness. Priority should be given to streamlining the functioning of the public sector and limiting the energy costs. In particular:
Public administration reforms envisaged in the 2016 SP are limited and unlikely to generate savings. A more ambitious reform agenda is needed to reduce duplication in public service provision and improve efficiency at all levels of government. The authorities should also put more emphasis on the implementation of the new Budget Framework Law, which has suffered delays. Priority should be given to reinforcing the medium-term budget framework, reducing budget fragmentation, strengthening the financial management function in line ministries, and reinforcing transparency.
In the judicial sector, the authorities should put on hold the reinstatement of courts and expansion of services pending a full consideration of a detailed cost-benefit analysis with the overall objective to bring the number of courts more closely in line with the European average. Efforts to improve the processing efficiency and reduce the disposition time in fiscal/administrative and insolvency courts should continue.
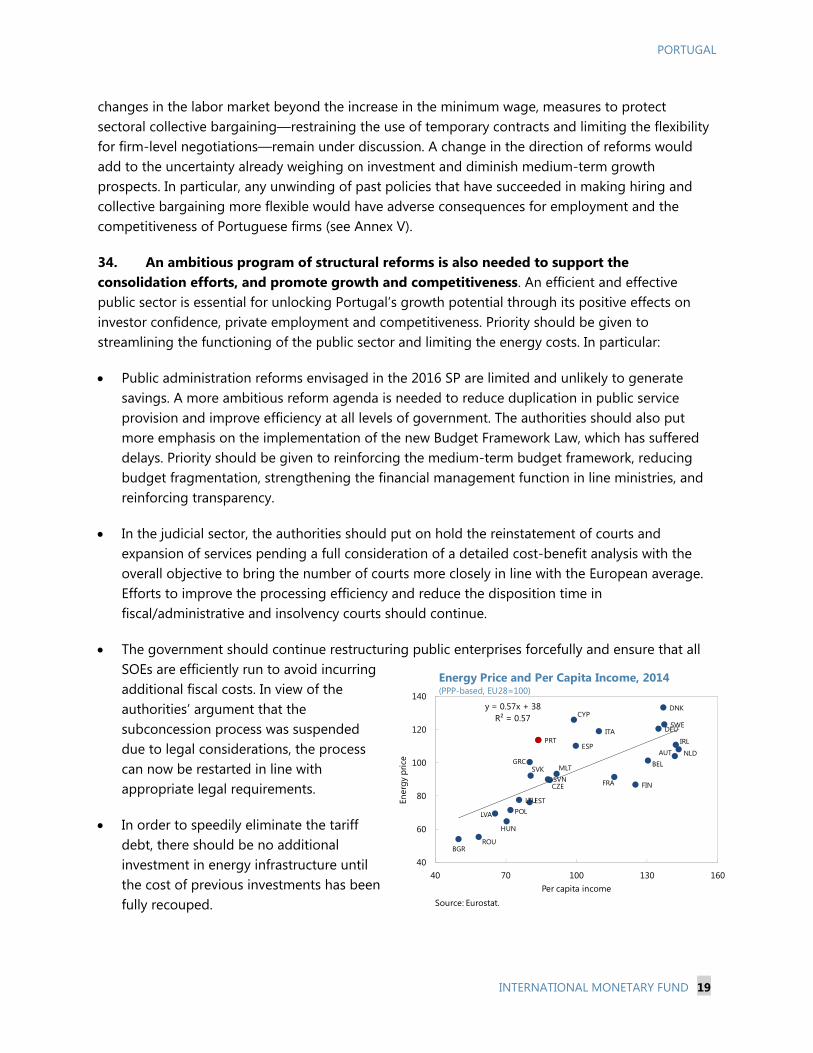
The government should continue restructuring public enterprises forcefully and ensure that all SOEs are efficiently run to avoid incurring additional fiscal costs. In view of the authorities’ argument that the subconcession process was suspended due to legal considerations, the process can now be restarted in line with appropriate legal requirements.
In order to speedily eliminate the tariff debt, there should be no additional investment in energy infrastructure until the cost of previous investments has been fully recouped.
AUTBEL
BGR
CYP
CZE
DNK
EST
FINFRA
DEU
GRC
HUN
IRLITA
LVA
LTU
MLT
NLD
POL
PRT
ROU
SVKSVN
ESP
SWE
y = 0.57x + 38R² = 0.57
40
60
80
100
120
140
40 70 100 130 160
Ener
gy p
rice
Per capita income
Energy Price and Per Capita Income, 2014(PPP-based, EU28=100)
Source: Eurostat.
PORTUGAL
20 INTERNATIONAL MONETARY FUND
35. As outlined in earlier reports, an appropriately inclusive social dialogue is key to success of structural reforms. Engaging all stakeholders—including the unemployed, the broader labor force, and a wider cross-section of employers—in an open and transparent debate about the relative merits of reforms versus inaction will be crucial to creating and sustaining a pro-reform coalition in civil society.23
Authorities’ views
36. The authorities emphasized their commitment to carry forward the structural reforms implemented during the program. On the labor market, they noted that any changes would not constitute a change in the direction of reforms, but were intended to address social inequities that had emerged from growing labor market segmentation and the erosion of labor protection following the financial crisis.
POST-PROGRAM MONITORING 37. The risks to Portugal’s capacity to repay are rising, but are expected to be manageable under the baseline. DBRS has maintained its investment-grade rating with a stable outlook, but most other outstanding risks—the sovereign’s excessive reliance on external financing being principal among them—remain in place, and sovereign spreads and yields remain elevated.
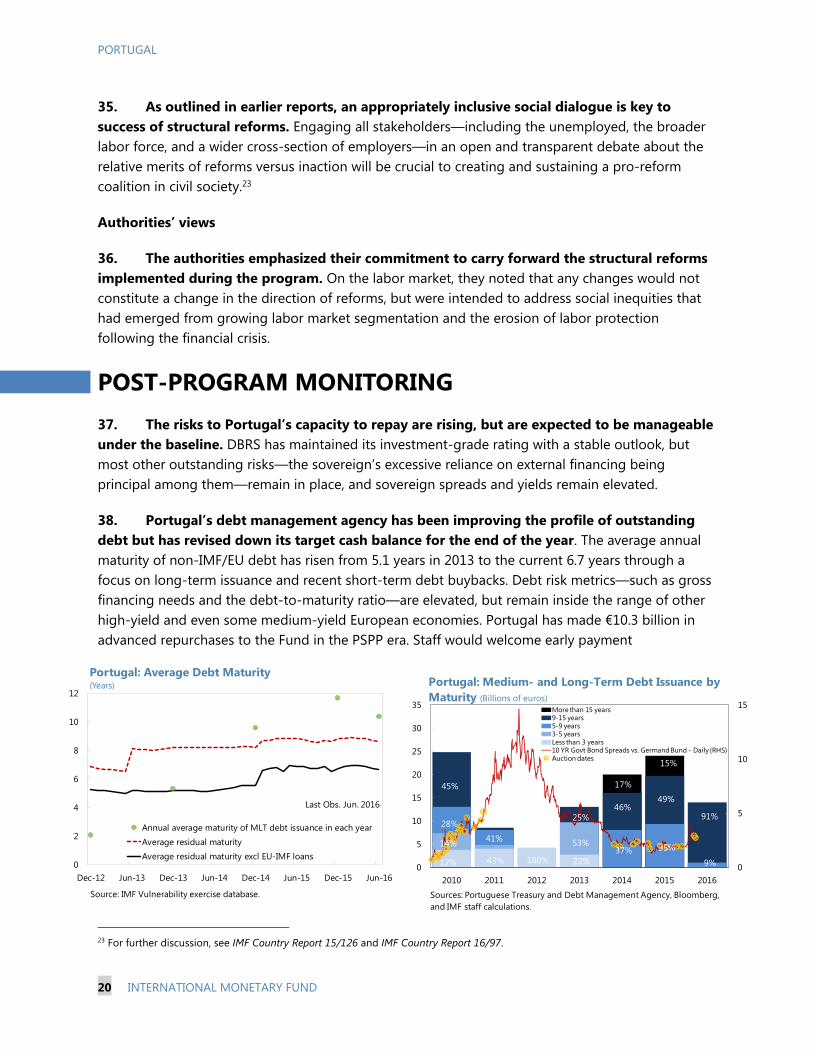
38. Portugal’s debt management agency has been improving the profile of outstanding debt but has revised down its target cash balance for the end of the year. The average annual maturity of non-IMF/EU debt has risen from 5.1 years in 2013 to the current 6.7 years through a focus on long-term issuance and recent short-term debt buybacks. Debt risk metrics—such as gross financing needs and the debt-to-maturity ratio—are elevated, but remain inside the range of other high-yield and even some medium-yield European economies. Portugal has made €10.3 billion in advanced repurchases to the Fund in the PSPP era. Staff would welcome early payment
23 For further discussion, see IMF Country Report 15/126 and IMF Country Report 16/97.
0
5
10
15
0
5
10
15
20
25
30
35
2010 2011 2012 2013 2014 2015 2016
More than 15 years9-15 years5-9 years3-5 yearsLess than 3 years10 YR Govt Bond Spreads vs. Germand Bund - Daily (RHS)Auction dates
Portugal: Medium- and Long-Term Debt Issuance by Maturity (Billions of euros)
Sources: Portuguese Treasury and Debt Management Agency, Bloomberg, and IMF staff calculations.
45%
28%
14%
12% 100%
41%
43%
25%
53%
22%
17%
46%
37% 35%
49%
15%
91%
9%0
2
4
6
8
10
12
Dec-12 Jun-13 Dec-13 Jun-14 Dec-14 Jun-15 Dec-15 Jun-16
Portugal: Average Debt Maturity(Years)
Annual average maturity of MLT debt issuance in each yearAverage residual maturityAverage residual maturity excl EU-IMF loans
Source: IMF Vulnerability exercise database.
Last Obs. Jun. 2016
PORTUGAL
INTERNATIONAL MONETARY FUND 21
commitments provided that adequate cash buffers can be maintained in the face of possibly volatile market conditions.
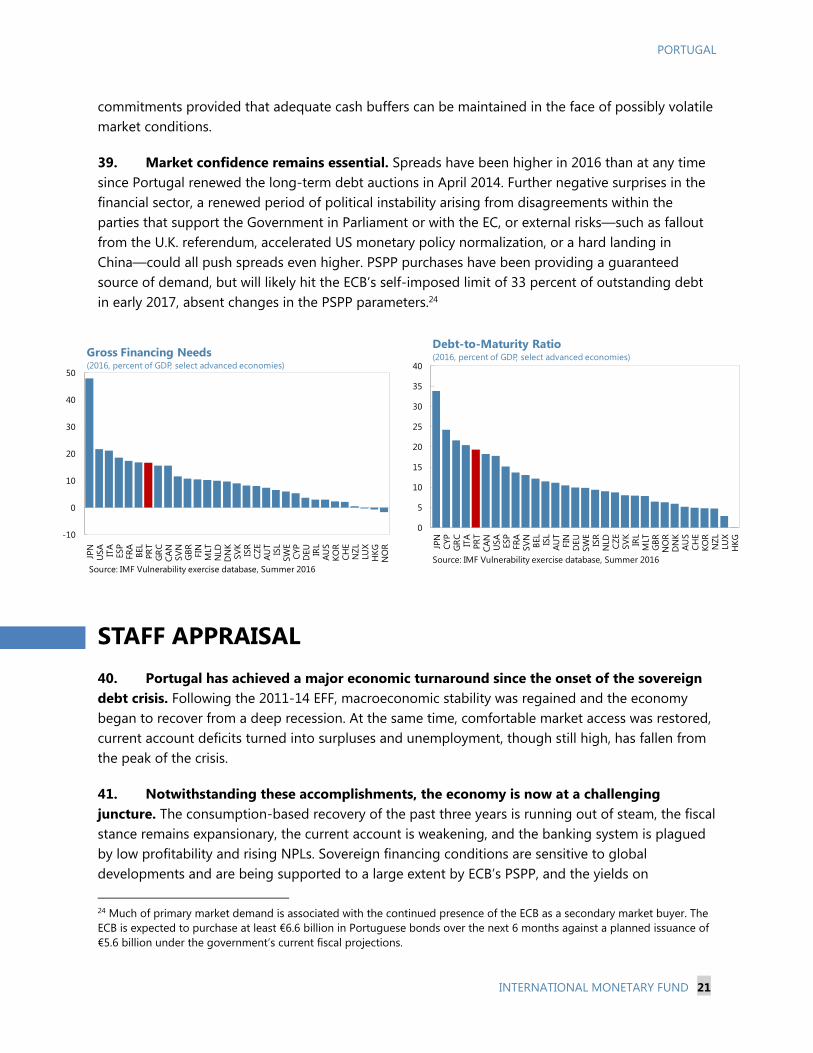
39. Market confidence remains essential. Spreads have been higher in 2016 than at any time since Portugal renewed the long-term debt auctions in April 2014. Further negative surprises in the financial sector, a renewed period of political instability arising from disagreements within the parties that support the Government in Parliament or with the EC, or external risks—such as fallout from the U.K. referendum, accelerated US monetary policy normalization, or a hard landing in China—could all push spreads even higher. PSPP purchases have been providing a guaranteed source of demand, but will likely hit the ECB’s self-imposed limit of 33 percent of outstanding debt in early 2017, absent changes in the PSPP parameters.24
STAFF APPRAISAL 40. Portugal has achieved a major economic turnaround since the onset of the sovereign debt crisis. Following the 2011-14 EFF, macroeconomic stability was regained and the economy began to recover from a deep recession. At the same time, comfortable market access was restored, current account deficits turned into surpluses and unemployment, though still high, has fallen from the peak of the crisis.
41. Notwithstanding these accomplishments, the economy is now at a challenging juncture. The consumption-based recovery of the past three years is running out of steam, the fiscal stance remains expansionary, the current account is weakening, and the banking system is plagued by low profitability and rising NPLs. Sovereign financing conditions are sensitive to global developments and are being supported to a large extent by ECB’s PSPP, and the yields on
24 Much of primary market demand is associated with the continued presence of the ECB as a secondary market buyer. The ECB is expected to purchase at least €6.6 billion in Portuguese bonds over the next 6 months against a planned issuance of €5.6 billion under the government’s current fiscal projections.
-10
0
10
20
30
40
50
JPN
USA IT
AES
PFR
ABE
LPR
TG
RCCA
NSV
NG
BR FIN
MLT
NLD
DN
KSV
KIS
RCZ
EAU
TIS
LSW
ECY
PD
EU IRL
AUS
KOR
CHE
NZL
LUX
HKG
NO
R
Gross Financing Needs(2016, percent of GDP, select advanced economies)
Source: IMF Vulnerability exercise database, Summer 2016
0
5
10
15
20
25
30
35
40
JPN
CYP
GRC IT
APR
TCA
NU
SA ESP
FRA
SVN
BEL
ISL
AUT
FIN
DEU
SWE
ISR
NLD CZ
ESV
KIR
LM
LTG
BRN
OR
DN
KAU
SCH
EKO
RN
ZLLU
XH
KG
Debt-to-Maturity Ratio(2016, percent of GDP, select advanced economies)
Source: IMF Vulnerability exercise database, Summer 2016

PORTUGAL
22 INTERNATIONAL MONETARY FUND
Portuguese bonds, albeit low by historical standards, have diverged from those for Spain and Italy. The vulnerabilities in the banking system, public sector finances, and the macroeconomic outlook can potentially be self-reinforcing, with risks firmly on the downside.
42. A comprehensive approach is needed to address vulnerabilities in the banking system. To return to profitability and successfully finance economic growth, banks should clean up their balance sheets through a comprehensive approach to debt restructuring supported by an increase in capital, provisions, and impairments and by appropriately pricing and selling bad loans. In addition, banks should also reduce operating costs and improve their internal governance to let lending decisions be guided solely by commercial criteria. Solutions to the challenges facing Portuguese banks will ultimately need to be found at the national level, using the existing regulatory toolkit.
43. The 2016 budget target—a deficit of 2.2 percent of GDP—is appropriately ambitious but faces risks to execution. Even though the January-May outturn was broadly in line with the authorities’ projections, declining GDP growth and emerging expenditure pressures—due to the move to the 35-hour work week for civil servants, the continued rollback of public sector wage cuts, and rising arrears—point to a deficit of close to 3 percent of GDP.
44. In view of vulnerabilities due to the high stock of public debt, the authorities need a credible fiscal strategy. With little room for corrective measures in 2016, policies need to look ahead. Well-specified measures, largely on the expenditure side and resulting in a structural primary adjustment of 0.5 percent of GDP in 2017 and 2018, would be an appropriate way forward. The authorities may wish to consider undertaking a top-down spending review, focusing in particular on better means-testing of social benefits, reducing healthcare costs, and controlling pensions and public sector wages. Tax policy should be more stable and predictable and aim at boosting competitiveness and growth rather than consumption.
45. The authorities should address uncertainty over the direction of structural reforms. Structural reforms are essential for raising Portugal’s growth potential, but the recent reversals—among others, an increase in the minimum wage, reinstatement of public holidays, and revisiting of transport concessions—have generated uncertainty that appears to be a significant factor behind the slowdown in investment. Full implementation of the already-enacted reforms in labor and product markets must be complemented by additional steps to promote growth and competitiveness, with a particular focus on streamlining the functioning of the public sector and limiting the energy costs. Engaging all stakeholders by way of an appropriately inclusive social dialogue will be key to success of structural reforms.
46. Maintaining an adequate cash buffer becomes a priority. The authorities’ commitment to repay Fund early is welcome, provided that adequate cash buffers can be maintained, in view of elevated spreads and pronounced risks.
47. Staff recommends the next Article IV consultation be held on the standard 12-month cycle.

PORTUGAL
INTERNATIONAL MONETARY FUND 23
Box 1. Banking System Challenges and Their Implications for Growth and Stability
The Portuguese banking system continues to suffer from high and rising non-performing loans. The majority of weak assets are loans to low-productivity firms in the nontradable sector. This legacy impedes the reallocation of credit to new higher-productivity sectors of the economy, while leaving the banking system vulnerable to negative shocks. A comprehensive solution to the banking system’s challenges is therefore necessary to elevate Portugal’s growth prospects and to safeguard financial stability. Notwithstanding the macro-criticality of this issue, the prospects for progress are challenging: with inflation, growth, and interest rates all expected to remain low for long, Portuguese banks will not be able to generate sufficient profits in the foreseeable future to bolster capital cushions. With state ownership of CGD and Resolution Fund ownership of Novo Banco, two of the four major (and SSM-supervised) banks, and majority shareholders firmly in control of the other two, there is little impetus to aggressively cut costs and/or undertake measures that dilute ownership. The true extent of a complete and decisive cleaning up bank NPLs is difficult to estimate. At the low end, the cost of raising the major banks’ provisioning to 80 percent of recorded NPLs would entail around €3.5 billion (2 percent of GDP) in additional capital needs. This level of provisioning has been seen as the minimum needed by some of the healthier banks to dispose of NPLs without additional charges and can serve as a useful conservative benchmark. However, recent experience with Banif suggests that recorded NPLs may understate the true extent of the problem and overstate the residual value of assets. Applying more conservative assumptions would imply potentially larger system-wide costs of cleaning up legacy assets but would require access to detailed bank-level data to estimate with any degree of confidence. Given the potential size of the problem and the incentives among banks in favor of the status quo, banks need to be more aggressive in addressing both legacy issues and improving their internal governance framework. While addressing legacy problems is an essential step to freeing up economic resources for new investment and job creation, there needs to be a fundamental change in the banking culture. In part, this means moving away from a bias towards lending to traditional corporates with whom banks have long-standing relationships. Moreover, banks’ management should have the flexibility to restructure their operations and aggressively rein in costs, including through a reduction in branch network and staffing. Unless banks are focused on profitability and continuous reinforcement of capital buffers from their own resources, there is a high risk of onset of chronic banking system stress and calls for injection of public funds at repeated intervals. This would reinforce unhelpful bank-sovereign links and could lead to the build-up of problems in the future.
PORTUGAL
24 INTERNATIONAL MONETARY FUND
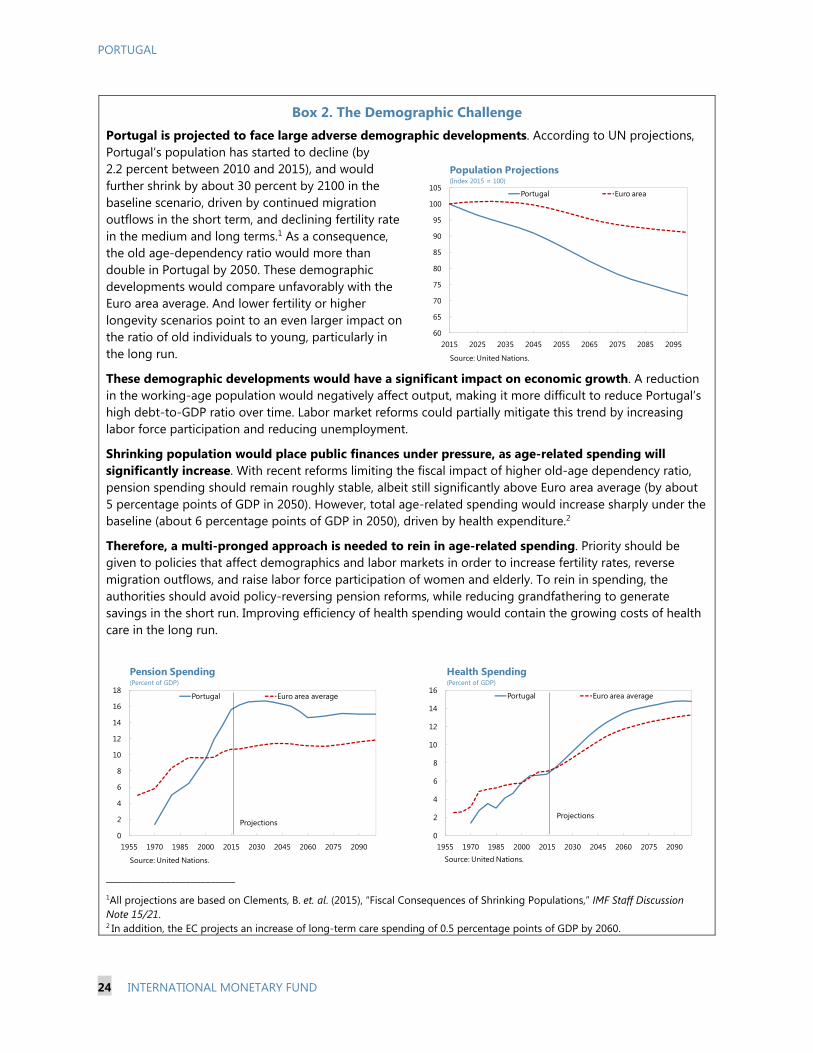
Box 2. The Demographic Challenge Portugal is projected to face large adverse demographic developments. According to UN projections, Portugal’s population has started to decline (by 2.2 percent between 2010 and 2015), and would further shrink by about 30 percent by 2100 in the baseline scenario, driven by continued migration outflows in the short term, and declining fertility rate in the medium and long terms.1 As a consequence, the old age-dependency ratio would more than double in Portugal by 2050. These demographic developments would compare unfavorably with the Euro area average. And lower fertility or higher longevity scenarios point to an even larger impact on the ratio of old individuals to young, particularly in the long run.
These demographic developments would have a significant impact on economic growth. A reduction in the working-age population would negatively affect output, making it more difficult to reduce Portugal’s high debt-to-GDP ratio over time. Labor market reforms could partially mitigate this trend by increasing labor force participation and reducing unemployment.
Shrinking population would place public finances under pressure, as age-related spending will significantly increase. With recent reforms limiting the fiscal impact of higher old-age dependency ratio, pension spending should remain roughly stable, albeit still significantly above Euro area average (by about 5 percentage points of GDP in 2050). However, total age-related spending would increase sharply under the baseline (about 6 percentage points of GDP in 2050), driven by health expenditure.2
Therefore, a multi-pronged approach is needed to rein in age-related spending. Priority should be given to policies that affect demographics and labor markets in order to increase fertility rates, reverse migration outflows, and raise labor force participation of women and elderly. To rein in spending, the authorities should avoid policy-reversing pension reforms, while reducing grandfathering to generate savings in the short run. Improving efficiency of health spending would contain the growing costs of health care in the long run.
__________________________ 1All projections are based on Clements, B. et. al. (2015), “Fiscal Consequences of Shrinking Populations,” IMF Staff Discussion Note 15/21. 2 In addition, the EC projects an increase of long-term care spending of 0.5 percentage points of GDP by 2060.
60
65
70
75
80
85
90
95
100
105
2015 2025 2035 2045 2055 2065 2075 2085 2095
Population Projections(Index 2015 = 100)
Portugal Euro area
Source: United Nations.
0
2
4
6
8
10
12
14
16
18
1955 1970 1985 2000 2015 2030 2045 2060 2075 2090
Pension Spending (Percent of GDP)
Portugal Euro area average
Source: United Nations.
Projections
0
2
4
6
8
10
12
14
16
1955 1970 1985 2000 2015 2030 2045 2060 2075 2090
Health Spending(Percent of GDP)
Portugal Euro area average
Source: United Nations.
Projections

PORTUGAL
INTERNATIONAL MONETARY FUND 25
Figure 3. Portugal: Selected Macroeconomic Developments
Falling unemployment is supporting consumption… …as are low interest rates.
Still-high debt constrains disposable income growth… …and the savings rate has fallen to a historically low level.
Inflation is back in positive territory… ...driven by positive core inflation.
Sources: Haver Analytics; INE; and IMF staff calculations. 1Non-consolidated basis.
end-2007 end-2015
Total non-financial sector debt 314.4 388.7
Public 85.9 163.8General government (GG) 78.7 160.3
Of which: corporations inside GG 9.8 20.6Corporations outside GG 7.2 3.5
Private 228.5 224.9Corporations 138.1 144.8Households and non-profit institutions serving households 90.4 80.1
Memorandum items:Consolidated GG debt 70.8 130.3Public corporations inside and outside GG 17.0 24.1Public and private corporations 155.1 168.9Nominal GDP (Billions of euros) 175.5 179.4
Composition of Non-Financial Sector Debt1
(Percent of GDP, unless otherwise indicated)
2
4
6
8
10
12
14
16
80
90
100
110
120
130
140
150
2000Q2 2002Q4 2005Q2 2007Q4 2010Q2 2012Q4 2015Q2
Disposable income (Billions of euros, 4-quarter sum)
Savings rate (Percent, 4-quarter average, RHS)
Disposable Income and Savings Rate
Last obs. 2016Q1
-1.25
-1.00
-0.75
-0.50
-0.25
0.00
0.25
0.50
0.75
1.00
1.25
-1.5
-1.0
-0.5
0.0
0.5
1.0
1.5
Mar-14 Sep-14 Mar-15 Sep-15 Mar-16
PortugalEuro areaDifference (Percentage points, RHS)
Harmonized Consumer Price Index (Year-on-year percent change)
Last obs. May 2016-1
0
1
2
May-15 Jul-15 Sep-15 Nov-15 Jan-16 Mar-16
Core Energy Food Total
Last obs. Apr. 2016
Contributions to Year-on-year Change in Harmonized CPI, by Category (Percentage points)
-3
-2
-1
0
1
2
3
-2 -1 0 1 2
Real
priv
ate
cons
umpt
ion
(Q-o
n-Q
per
cent
cha
nge)
Unemployment rate (Q-on-Q percent change)
Consumption and Unemployment,1995:Q2 ̶̶ 2016:Q1
2015Q22015Q1
2015Q42015Q3
2016Q1
-2.5
-2.0
-1.5
-1.0
-0.5
0.0
0.5
1.0
1.5
2.0
2.0 2.5 3.0 3.5 4.0 4.5 5.0
Real
priv
ate
cons
umpt
ion
(Q-o
n-Q
per
cent
cha
nge)
Interest rate on new mortgages (Percent)
Consumption and Interest Rates,2009:Q1 ̶ 2016:Q1
2015Q2
2015Q1
2015Q42015Q3
2016Q1
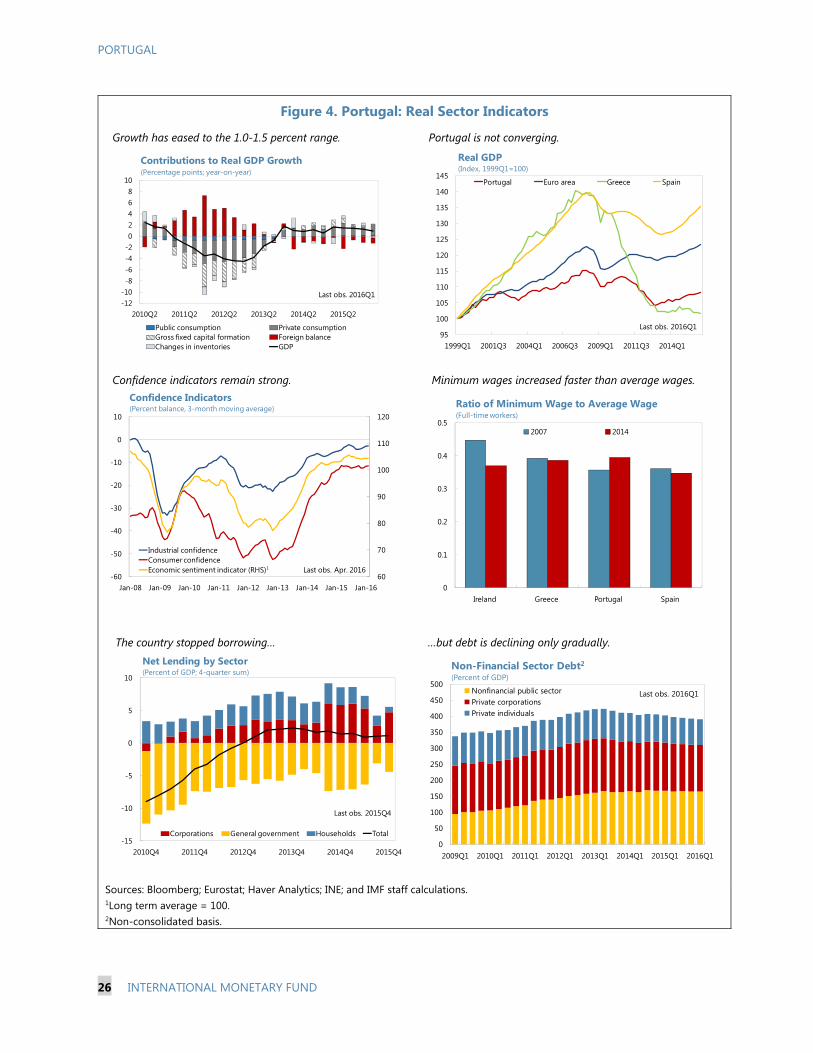
PORTUGAL
26 INTERNATIONAL MONETARY FUND
Figure 4. Portugal: Real Sector Indicators
Growth has eased to the 1.0-1.5 percent range. Portugal is not converging.
Confidence indicators remain strong. Minimum wages increased faster than average wages.
The country stopped borrowing… …but debt is declining only gradually.
Sources: Bloomberg; Eurostat; Haver Analytics; INE; and IMF staff calculations. 1Long term average = 100. 2Non-consolidated basis.
95
100
105
110
115
120
125
130
135
140
145
1999Q1 2001Q3 2004Q1 2006Q3 2009Q1 2011Q3 2014Q1
Portugal Euro area Greece Spain
Real GDP(Index, 1999Q1=100)
Last obs. 2016Q1
0
0.1
0.2
0.3
0.4
0.5
Ireland Greece Portugal Spain
2007 2014
Ratio of Minimum Wage to Average Wage(Full-time workers)
60
70
80
90
100
110
120
-60
-50
-40
-30
-20
-10
0
10
Jan-08 Jan-09 Jan-10 Jan-11 Jan-12 Jan-13 Jan-14 Jan-15 Jan-16
Industrial confidenceConsumer confidenceEconomic sentiment indicator (RHS)
Confidence Indicators(Percent balance, 3-month moving average)
Last obs. Apr. 20161
-15
-10
-5
0
5
10
2010Q4 2011Q4 2012Q4 2013Q4 2014Q4 2015Q4
Corporations General government Households Total
Net Lending by Sector(Percent of GDP; 4-quarter sum)
Last obs. 2015Q4
0
50
100
150
200
250
300
350
400
450
500
2009Q1 2010Q1 2011Q1 2012Q1 2013Q1 2014Q1 2015Q1 2016Q1
Nonfinancial public sectorPrivate corporationsPrivate individuals
Non-Financial Sector Debt2
(Percent of GDP)
Last obs. 2016Q1
-12-10-8-6-4-202468
10
2010Q2 2011Q2 2012Q2 2013Q2 2014Q2 2015Q2
Public consumption Private consumptionGross fixed capital formation Foreign balanceChanges in inventories GDP
Last obs. 2016Q1
Contributions to Real GDP Growth(Percentage points; year-on-year)
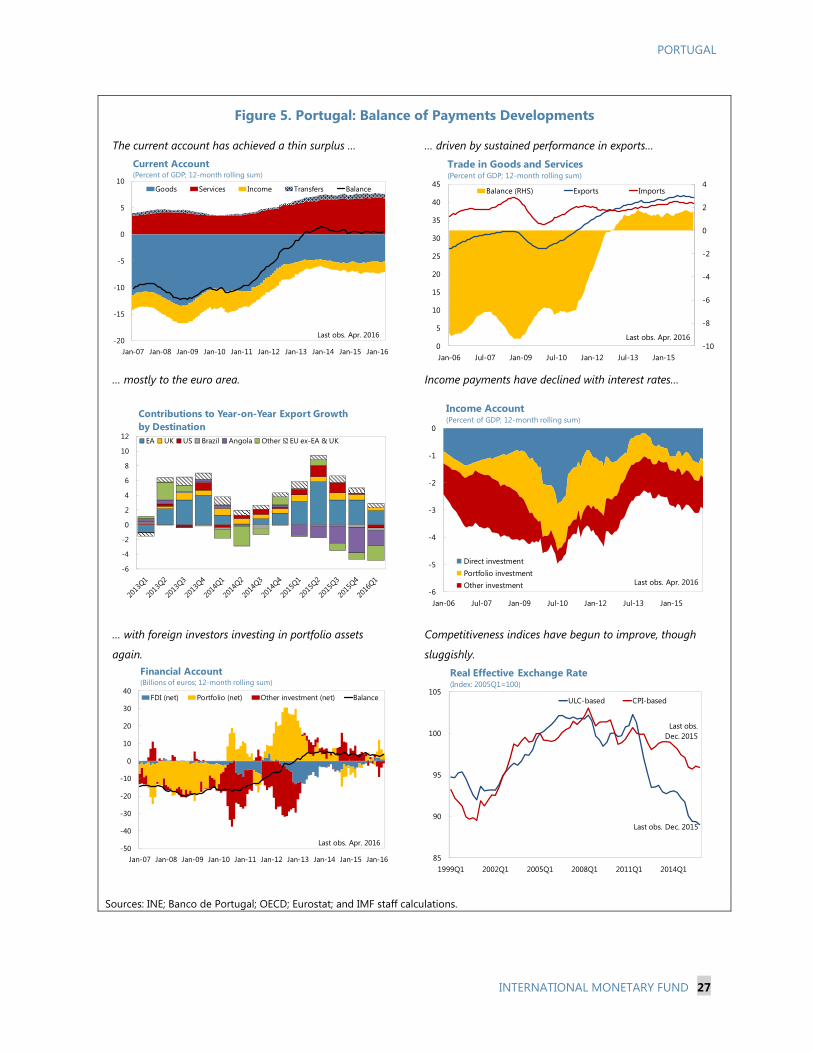
PORTUGAL
INTERNATIONAL MONETARY FUND 27
Figure 5. Portugal: Balance of Payments Developments
The current account has achieved a thin surplus … … driven by sustained performance in exports…
… mostly to the euro area. Income payments have declined with interest rates…
… with foreign investors investing in portfolio assets
again.
Competitiveness indices have begun to improve, though
sluggishly.
Sources: INE; Banco de Portugal; OECD; Eurostat; and IMF staff calculations.
-20
-15
-10
-5
0
5
10
Jan-07 Jan-08 Jan-09 Jan-10 Jan-11 Jan-12 Jan-13 Jan-14 Jan-15 Jan-16
Goods Services Income Transfers Balance
Current Account(Percent of GDP; 12-month rolling sum)
Last obs. Apr. 2016-10
-8
-6
-4
-2
0
2
4
0
5
10
15
20
25
30
35
40
45
Jan-06 Jul-07 Jan-09 Jul-10 Jan-12 Jul-13 Jan-15
Balance (RHS) Exports Imports
Trade in Goods and Services(Percent of GDP; 12-month rolling sum)
Last obs. Apr. 2016
-6
-4
-2
0
2
4
6
8
10
12
Contributions to Year-on-Year Export Growth by Destination
EA UK US Brazil Angola Other EU ex-EA & UK
-6
-5
-4
-3
-2
-1
0
Jan-06 Jul-07 Jan-09 Jul-10 Jan-12 Jul-13 Jan-15
Direct investmentPortfolio investmentOther investment
Income Account(Percent of GDP; 12-month rolling sum)
Last obs. Apr. 2016
-50
-40
-30
-20
-10
0
10
20
30
40
Jan-07 Jan-08 Jan-09 Jan-10 Jan-11 Jan-12 Jan-13 Jan-14 Jan-15 Jan-16
FDI (net) Portfolio (net) Other investment (net) Balance
Financial Account(Billions of euros; 12-month rolling sum)
Last obs. Apr. 2016
85
90
95
100
105
1999Q1 2002Q1 2005Q1 2008Q1 2011Q1 2014Q1
ULC-based CPI-based
Real Effective Exchange Rate(Index: 2005Q1=100)
Last obs. Dec. 2015
Last obs. Dec. 2015
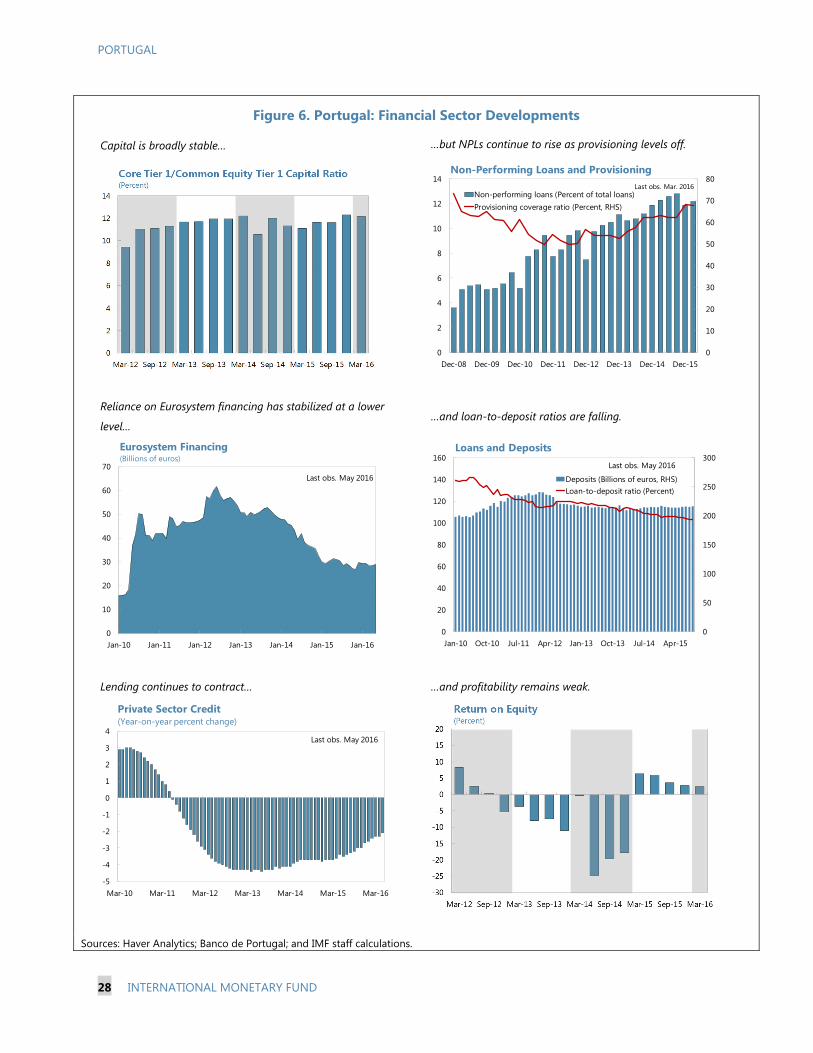
PORTUGAL
28 INTERNATIONAL MONETARY FUND
Figure 6. Portugal: Financial Sector Developments
Capital is broadly stable… …but NPLs continue to rise as provisioning levels off.
Reliance on Eurosystem financing has stabilized at a lower
level… …and loan-to-deposit ratios are falling.
Lending continues to contract… …and profitability remains weak.
Sources: Haver Analytics; Banco de Portugal; and IMF staff calculations.
0
50
100
150
200
250
300
0
20
40
60
80
100
120
140
160
Jan-10 Oct-10 Jul-11 Apr-12 Jan-13 Oct-13 Jul-14 Apr-15
Deposits (Billions of euros, RHS)Loan-to-deposit ratio (Percent)
Loans and DepositsLast obs. May 2016
0
10
20
30
40
50
60
70
80
0
2
4
6
8
10
12
14
Dec-08 Dec-09 Dec-10 Dec-11 Dec-12 Dec-13 Dec-14 Dec-15
Non-Performing Loans and Provisioning
Non-performing loans (Percent of total loans)Provisioning coverage ratio (Percent, RHS)
Last obs. Mar. 2016
-5
-4
-3
-2
-1
0
1
2
3
4
Mar-10 Mar-11 Mar-12 Mar-13 Mar-14 Mar-15 Mar-16
Last obs. May 2016
Private Sector Credit(Year-on-year percent change)
0
10
20
30
40
50
60
70
Jan-10 Jan-11 Jan-12 Jan-13 Jan-14 Jan-15 Jan-16
Eurosystem Financing(Billions of euros)
Last obs. May 2016

PORTUGAL
INTERNATIONAL MONETARY FUND 29
Table 1. Portugal: Selected Economic Indicators, 2013–2021 (Year-on-year percent change, unless otherwise indicated)
Sources: Banco de Portugal; Ministry of Finance; INE; Eurostat; and IMF staff projections.
2015 2020 20213rd PPM 4th PPM
Real GDP -1.1 0.9 1.5 1.4 1.0 1.1 1.2 1.2 1.2 1.2Total domestic demand -2.0 2.2 2.5 1.4 1.2 1.3 1.3 1.3 1.3 1.3
Private consumption -1.2 2.2 2.6 1.5 2.2 1.4 1.2 1.1 1.1 1.1Public consumption -2.0 -0.5 0.6 0.0 0.3 0.6 0.4 0.6 0.6 0.6Gross fixed investment -5.1 2.8 4.1 3.0 -1.2 2.0 2.4 2.4 2.4 2.4
Private -3.3 3.0 3.2 3.3 -0.6 2.1 2.6 2.6 2.6 2.6Government -14.3 1.5 10.0 1.0 -4.4 1.1 1.1 1.2 1.2 1.2
Exports 7.0 3.9 5.2 4.2 2.9 3.4 4.2 4.0 4.1 4.2Imports 4.7 7.2 7.6 4.0 3.2 3.8 4.3 4.1 4.2 4.2
Contribution to GrowthTotal domestic demand -2.0 2.2 2.5 1.5 1.3 1.4 1.3 1.3 1.3 1.3
Private consumption -0.8 1.5 1.7 1.0 1.4 0.9 0.8 0.8 0.8 0.8Public consumption -0.4 -0.1 0.1 0.0 0.1 0.1 0.1 0.1 0.1 0.1Gross fixed investment -0.8 0.4 0.6 0.5 -0.2 0.3 0.4 0.4 0.4 0.4
Foreign balance 0.8 -1.3 -1.1 0.0 -0.2 -0.3 -0.2 -0.1 -0.2 -0.2
Savings-investment balance (Percent of GDP)Gross national savings 15.2 15.3 15.7 15.4 14.8 14.6 14.7 14.9 15.1 15.5
Private 18.1 20.4 17.9 16.4 15.7 15.6 15.6 15.8 16.1 16.5Public -2.8 -5.1 -2.2 -0.9 -1.0 -1.0 -0.9 -0.9 -0.9 -0.9
Gross domestic investment 14.6 15.1 15.2 14.5 14.7 15.1 15.4 15.8 16.3 16.9Private 12.6 13.0 13.0 12.5 12.7 13.1 13.3 13.7 14.2 14.8Public 2.1 2.1 2.2 2.0 2.0 2.0 2.0 2.1 2.1 2.1
Resource utilizationPotential GDP -0.3 -0.3 0.0 0.2 0.2 0.2 0.4 0.5 0.7 1.0Output Gap (Percent of potential) -6.2 -5.0 -3.7 -2.0 -2.9 -2.0 -1.2 -0.6 -0.2 0.0Employment -2.6 1.6 1.1 1.0 0.8 0.5 0.5 0.5 0.5 0.5Unemployment rate (Percent) 16.2 13.9 12.4 11.6 11.8 11.3 10.9 10.4 10.0 9.5
Prices GDP deflator 2.3 1.0 1.9 1.5 1.7 1.3 1.4 1.5 1.7 1.7Consumer prices (Harmonized index) 0.4 -0.2 0.5 0.7 0.7 1.1 1.4 1.5 1.6 1.8Compensation per worker (Whole economy) 1.3 0.4 1.8 1.5 1.5 1.5 1.5 1.5 1.5 1.5Labor productivity 1.6 -1.5 0.4 0.4 0.2 0.6 0.7 0.7 0.6 0.6Unit labor costs (Whole economy) 1.8 0.6 1.4 1.1 1.3 0.8 0.8 0.8 0.8 0.8
Money and credit (End of period, percent change)Private sector credit -5.3 -8.0 -4.1 0.3 -2.2 -0.5 0.1 0.8 1.6 1.6Broad money 0.2 -0.9 4.1 2.4 2.3 2.0 2.1 2.2 2.3 2.4
Interest rates (Percent)Short-term deposit rate 2.1 1.6 0.8 … … … … … … …Government bond rate, 10-year 6.3 3.8 2.3 … … … … … … …
Fiscal indicators (Percent of GDP)General government balance -4.8 -7.2 -4.4 -2.9 -3.0 -3.0 -2.9 -2.9 -2.9 -2.9
Revenues 45.1 44.5 43.9 43.6 43.7 43.5 43.4 43.2 43.1 42.9Expenditures 49.9 51.7 48.3 46.5 46.6 46.4 46.2 46.1 46.0 45.8
Primary government balance 0.0 -2.3 0.2 1.7 1.6 1.5 1.5 1.5 1.4 1.4General government debt 129.0 130.2 129.0 127.9 128.5 128.2 127.8 127.0 126.6 126.0
External sector (Percent of GDP)Trade balance (Goods) -4.7 -5.5 -5.1 -4.5 -5.3 -6.0 -6.5 -6.9 -7.5 -7.9Trade balance (Goods and Services) 1.8 1.1 1.7 2.7 1.8 1.1 0.8 0.6 0.2 -0.1Current account balance 1.5 0.1 0.5 0.9 0.0 -0.6 -0.8 -1.0 -1.3 -1.6Net international investment position -116.5 -114.4 -109.4 -104.1 -105.2 -102.1 -99.1 -96.4 -94.0 -91.8REER based on ULC (1999=100) 102.9 102.7 101.0 103.9 102.8 102.8 102.7 102.7 102.8 102.7
(Rate of growth) 1.7 -0.2 -1.7 2.7 1.8 0.0 -0.1 0.0 0.2 -0.1REER based on CPI (1999=100) 107.4 106.9 106.4 108.9 107.1 107.2 107.4 107.5 107.6 107.8
(Rate of growth) 0.1 -0.5 -0.4 2.4 0.7 0.1 0.1 0.1 0.1 0.2
Nominal GDP (Billions of euros) 170.3 173.4 179.4 184.6 184.4 188.9 193.8 199.1 204.7 210.6
2017 2018 201920142013 2016
Projections
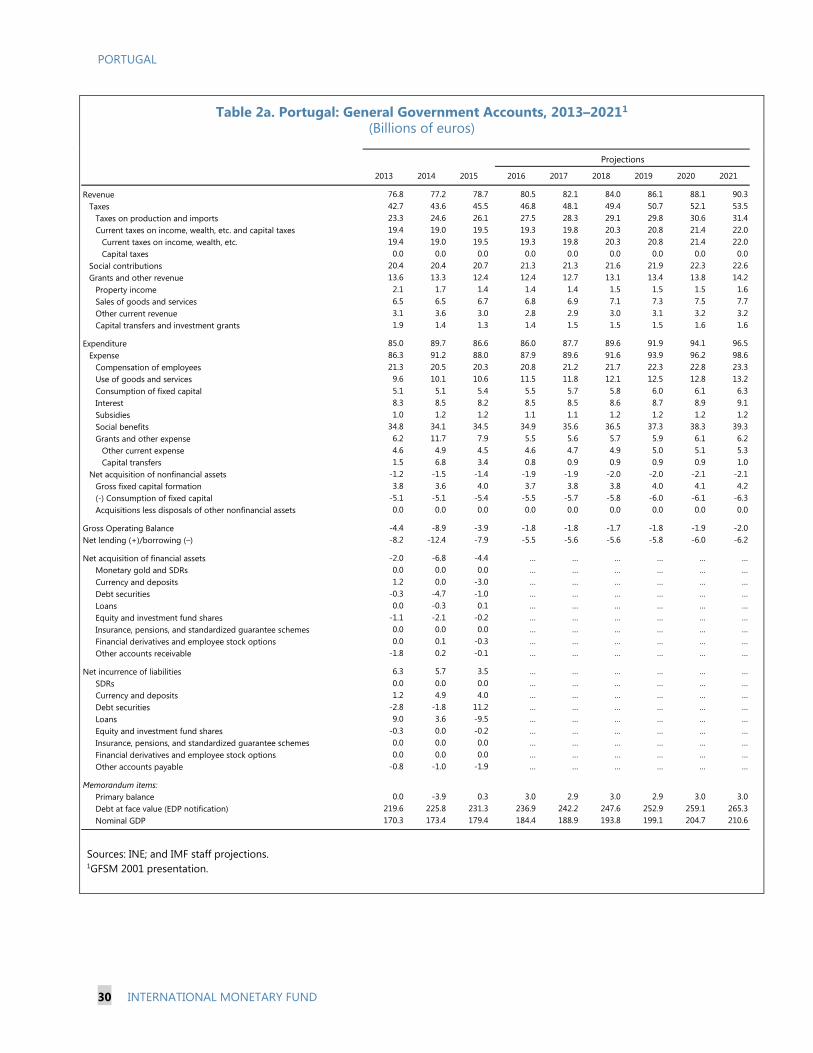
PORTUGAL
30 INTERNATIONAL MONETARY FUND
Table 2a. Portugal: General Government Accounts, 2013–20211 (Billions of euros)
Sources: INE; and IMF staff projections. 1GFSM 2001 presentation.
2013 2014 2015 2016 2017 2018 2019 2020 2021
Revenue 76.8 77.2 78.7 80.5 82.1 84.0 86.1 88.1 90.3Taxes 42.7 43.6 45.5 46.8 48.1 49.4 50.7 52.1 53.5
Taxes on production and imports 23.3 24.6 26.1 27.5 28.3 29.1 29.8 30.6 31.4Current taxes on income, wealth, etc. and capital taxes 19.4 19.0 19.5 19.3 19.8 20.3 20.8 21.4 22.0
Current taxes on income, wealth, etc. 19.4 19.0 19.5 19.3 19.8 20.3 20.8 21.4 22.0Capital taxes 0.0 0.0 0.0 0.0 0.0 0.0 0.0 0.0 0.0
Social contributions 20.4 20.4 20.7 21.3 21.3 21.6 21.9 22.3 22.6Grants and other revenue 13.6 13.3 12.4 12.4 12.7 13.1 13.4 13.8 14.2
Property income 2.1 1.7 1.4 1.4 1.4 1.5 1.5 1.5 1.6Sales of goods and services 6.5 6.5 6.7 6.8 6.9 7.1 7.3 7.5 7.7Other current revenue 3.1 3.6 3.0 2.8 2.9 3.0 3.1 3.2 3.2Capital transfers and investment grants 1.9 1.4 1.3 1.4 1.5 1.5 1.5 1.6 1.6
Expenditure 85.0 89.7 86.6 86.0 87.7 89.6 91.9 94.1 96.5Expense 86.3 91.2 88.0 87.9 89.6 91.6 93.9 96.2 98.6
Compensation of employees 21.3 20.5 20.3 20.8 21.2 21.7 22.3 22.8 23.3Use of goods and services 9.6 10.1 10.6 11.5 11.8 12.1 12.5 12.8 13.2Consumption of fixed capital 5.1 5.1 5.4 5.5 5.7 5.8 6.0 6.1 6.3Interest 8.3 8.5 8.2 8.5 8.5 8.6 8.7 8.9 9.1Subsidies 1.0 1.2 1.2 1.1 1.1 1.2 1.2 1.2 1.2Social benefits 34.8 34.1 34.5 34.9 35.6 36.5 37.3 38.3 39.3Grants and other expense 6.2 11.7 7.9 5.5 5.6 5.7 5.9 6.1 6.2
Other current expense 4.6 4.9 4.5 4.6 4.7 4.9 5.0 5.1 5.3Capital transfers 1.5 6.8 3.4 0.8 0.9 0.9 0.9 0.9 1.0
Net acquisition of nonfinancial assets -1.2 -1.5 -1.4 -1.9 -1.9 -2.0 -2.0 -2.1 -2.1Gross fixed capital formation 3.8 3.6 4.0 3.7 3.8 3.8 4.0 4.1 4.2(-) Consumption of fixed capital -5.1 -5.1 -5.4 -5.5 -5.7 -5.8 -6.0 -6.1 -6.3Acquisitions less disposals of other nonfinancial assets 0.0 0.0 0.0 0.0 0.0 0.0 0.0 0.0 0.0
Gross Operating Balance -4.4 -8.9 -3.9 -1.8 -1.8 -1.7 -1.8 -1.9 -2.0Net lending (+)/borrowing (–) -8.2 -12.4 -7.9 -5.5 -5.6 -5.6 -5.8 -6.0 -6.2
Net acquisition of financial assets -2.0 -6.8 -4.4 … … … … … …Monetary gold and SDRs 0.0 0.0 0.0 … … … … … …Currency and deposits 1.2 0.0 -3.0 … … … … … …Debt securities -0.3 -4.7 -1.0 … … … … … …Loans 0.0 -0.3 0.1 … … … … … …Equity and investment fund shares -1.1 -2.1 -0.2 … … … … … …Insurance, pensions, and standardized guarantee schemes 0.0 0.0 0.0 … … … … … …Financial derivatives and employee stock options 0.0 0.1 -0.3 … … … … … …Other accounts receivable -1.8 0.2 -0.1 … … … … … …
Net incurrence of liabilities 6.3 5.7 3.5 … … … … … …SDRs 0.0 0.0 0.0 … … … … … …Currency and deposits 1.2 4.9 4.0 … … … … … …Debt securities -2.8 -1.8 11.2 … … … … … …Loans 9.0 3.6 -9.5 … … … … … …Equity and investment fund shares -0.3 0.0 -0.2 … … … … … …Insurance, pensions, and standardized guarantee schemes 0.0 0.0 0.0 … … … … … …Financial derivatives and employee stock options 0.0 0.0 0.0 … … … … … …Other accounts payable -0.8 -1.0 -1.9 … … … … … …
Memorandum items:Primary balance 0.0 -3.9 0.3 3.0 2.9 3.0 2.9 3.0 3.0Debt at face value (EDP notification) 219.6 225.8 231.3 236.9 242.2 247.6 252.9 259.1 265.3Nominal GDP 170.3 173.4 179.4 184.4 188.9 193.8 199.1 204.7 210.6
Projections
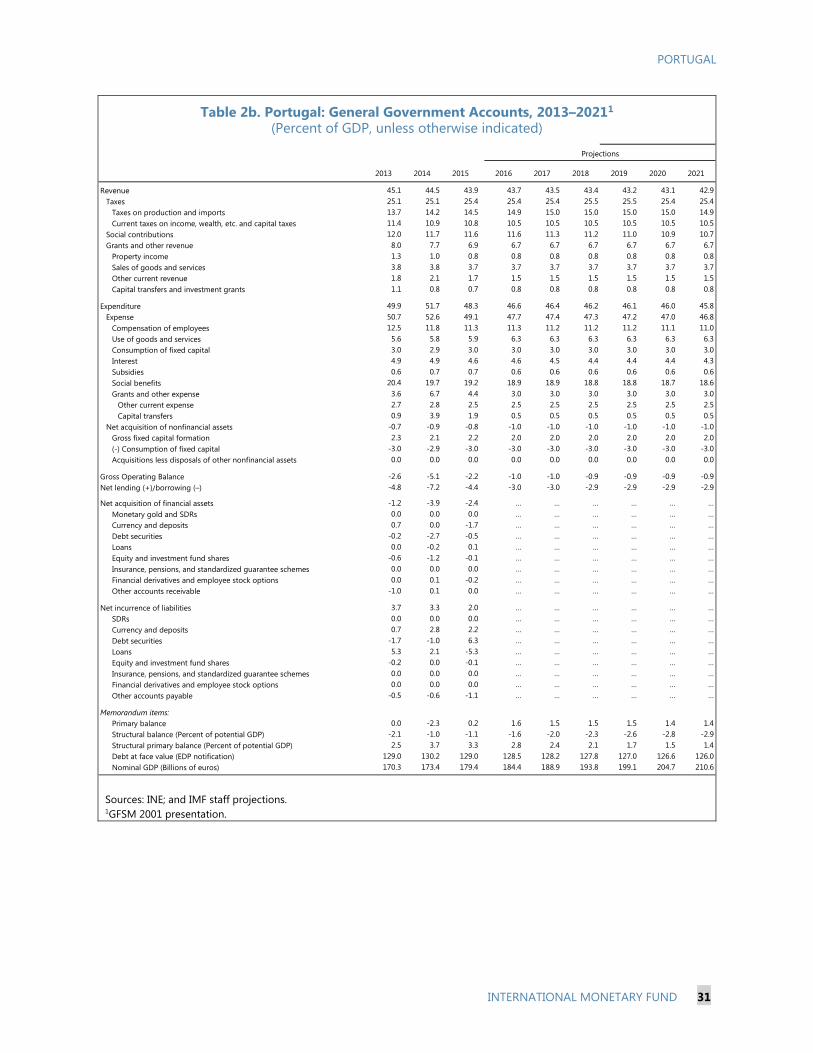
PORTUGAL
INTERNATIONAL MONETARY FUND 31
Table 2b. Portugal: General Government Accounts, 2013–20211 (Percent of GDP, unless otherwise indicated)
Sources: INE; and IMF staff projections. 1GFSM 2001 presentation.
2013 2014 2015 2016 2017 2018 2019 2020 2021
Revenue 45.1 44.5 43.9 43.7 43.5 43.4 43.2 43.1 42.9Taxes 25.1 25.1 25.4 25.4 25.4 25.5 25.5 25.4 25.4
Taxes on production and imports 13.7 14.2 14.5 14.9 15.0 15.0 15.0 15.0 14.9Current taxes on income, wealth, etc. and capital taxes 11.4 10.9 10.8 10.5 10.5 10.5 10.5 10.5 10.5
Social contributions 12.0 11.7 11.6 11.6 11.3 11.2 11.0 10.9 10.7Grants and other revenue 8.0 7.7 6.9 6.7 6.7 6.7 6.7 6.7 6.7
Property income 1.3 1.0 0.8 0.8 0.8 0.8 0.8 0.8 0.8Sales of goods and services 3.8 3.8 3.7 3.7 3.7 3.7 3.7 3.7 3.7Other current revenue 1.8 2.1 1.7 1.5 1.5 1.5 1.5 1.5 1.5Capital transfers and investment grants 1.1 0.8 0.7 0.8 0.8 0.8 0.8 0.8 0.8
Expenditure 49.9 51.7 48.3 46.6 46.4 46.2 46.1 46.0 45.8Expense 50.7 52.6 49.1 47.7 47.4 47.3 47.2 47.0 46.8
Compensation of employees 12.5 11.8 11.3 11.3 11.2 11.2 11.2 11.1 11.0Use of goods and services 5.6 5.8 5.9 6.3 6.3 6.3 6.3 6.3 6.3Consumption of fixed capital 3.0 2.9 3.0 3.0 3.0 3.0 3.0 3.0 3.0Interest 4.9 4.9 4.6 4.6 4.5 4.4 4.4 4.4 4.3Subsidies 0.6 0.7 0.7 0.6 0.6 0.6 0.6 0.6 0.6Social benefits 20.4 19.7 19.2 18.9 18.9 18.8 18.8 18.7 18.6Grants and other expense 3.6 6.7 4.4 3.0 3.0 3.0 3.0 3.0 3.0
Other current expense 2.7 2.8 2.5 2.5 2.5 2.5 2.5 2.5 2.5Capital transfers 0.9 3.9 1.9 0.5 0.5 0.5 0.5 0.5 0.5
Net acquisition of nonfinancial assets -0.7 -0.9 -0.8 -1.0 -1.0 -1.0 -1.0 -1.0 -1.0Gross fixed capital formation 2.3 2.1 2.2 2.0 2.0 2.0 2.0 2.0 2.0(-) Consumption of fixed capital -3.0 -2.9 -3.0 -3.0 -3.0 -3.0 -3.0 -3.0 -3.0Acquisitions less disposals of other nonfinancial assets 0.0 0.0 0.0 0.0 0.0 0.0 0.0 0.0 0.0
Gross Operating Balance -2.6 -5.1 -2.2 -1.0 -1.0 -0.9 -0.9 -0.9 -0.9Net lending (+)/borrowing (–) -4.8 -7.2 -4.4 -3.0 -3.0 -2.9 -2.9 -2.9 -2.9
Net acquisition of financial assets -1.2 -3.9 -2.4 … … … … … …Monetary gold and SDRs 0.0 0.0 0.0 … … … … … …Currency and deposits 0.7 0.0 -1.7 … … … … … …Debt securities -0.2 -2.7 -0.5 … … … … … …Loans 0.0 -0.2 0.1 … … … … … …Equity and investment fund shares -0.6 -1.2 -0.1 … … … … … …Insurance, pensions, and standardized guarantee schemes 0.0 0.0 0.0 … … … … … …Financial derivatives and employee stock options 0.0 0.1 -0.2 … … … … … …Other accounts receivable -1.0 0.1 0.0 … … … … … …
Net incurrence of liabilities 3.7 3.3 2.0 … … … … … …SDRs 0.0 0.0 0.0 … … … … … …Currency and deposits 0.7 2.8 2.2 … … … … … …Debt securities -1.7 -1.0 6.3 … … … … … …Loans 5.3 2.1 -5.3 … … … … … …Equity and investment fund shares -0.2 0.0 -0.1 … … … … … …Insurance, pensions, and standardized guarantee schemes 0.0 0.0 0.0 … … … … … …Financial derivatives and employee stock options 0.0 0.0 0.0 … … … … … …Other accounts payable -0.5 -0.6 -1.1 … … … … … …
Memorandum items:Primary balance 0.0 -2.3 0.2 1.6 1.5 1.5 1.5 1.4 1.4Structural balance (Percent of potential GDP) -2.1 -1.0 -1.1 -1.6 -2.0 -2.3 -2.6 -2.8 -2.9Structural primary balance (Percent of potential GDP) 2.5 3.7 3.3 2.8 2.4 2.1 1.7 1.5 1.4Debt at face value (EDP notification) 129.0 130.2 129.0 128.5 128.2 127.8 127.0 126.6 126.0Nominal GDP (Billions of euros) 170.3 173.4 179.4 184.4 188.9 193.8 199.1 204.7 210.6
Projections
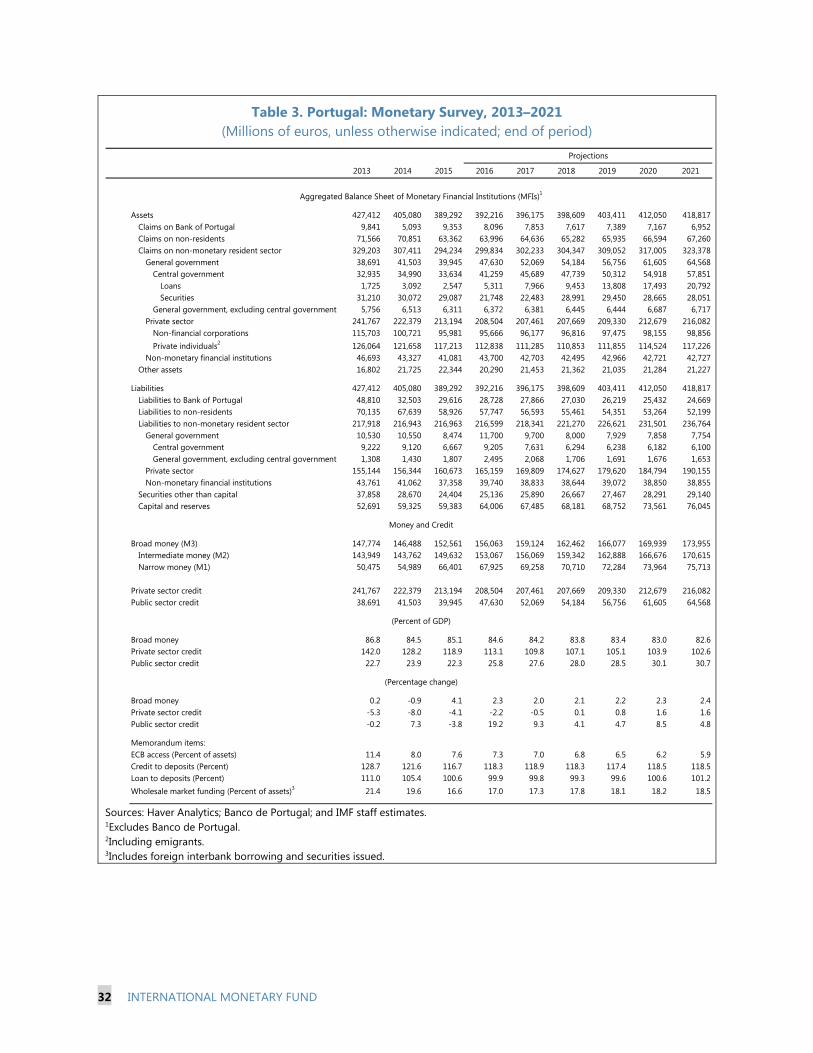
32 INTERNATIONAL MONETARY FUND
Table 3. Portugal: Monetary Survey, 2013–2021 (Millions of euros, unless otherwise indicated; end of period)
Sources: Haver Analytics; Banco de Portugal; and IMF staff estimates. 1Excludes Banco de Portugal. 2Including emigrants. 3Includes foreign interbank borrowing and securities issued.
2013 2014 2015 2016 2017 2018 2019 2020 2021
Assets 427,412 405,080 389,292 392,216 396,175 398,609 403,411 412,050 418,817Claims on Bank of Portugal 9,841 5,093 9,353 8,096 7,853 7,617 7,389 7,167 6,952Claims on non-residents 71,566 70,851 63,362 63,996 64,636 65,282 65,935 66,594 67,260Claims on non-monetary resident sector 329,203 307,411 294,234 299,834 302,233 304,347 309,052 317,005 323,378
General government 38,691 41,503 39,945 47,630 52,069 54,184 56,756 61,605 64,568Central government 32,935 34,990 33,634 41,259 45,689 47,739 50,312 54,918 57,851
Loans 1,725 3,092 2,547 5,311 7,966 9,453 13,808 17,493 20,792Securities 31,210 30,072 29,087 21,748 22,483 28,991 29,450 28,665 28,051
General government, excluding central government 5,756 6,513 6,311 6,372 6,381 6,445 6,444 6,687 6,717Private sector 241,767 222,379 213,194 208,504 207,461 207,669 209,330 212,679 216,082
Non-financial corporations 115,703 100,721 95,981 95,666 96,177 96,816 97,475 98,155 98,856Private individuals2 126,064 121,658 117,213 112,838 111,285 110,853 111,855 114,524 117,226
Non-monetary financial institutions 46,693 43,327 41,081 43,700 42,703 42,495 42,966 42,721 42,727Other assets 16,802 21,725 22,344 20,290 21,453 21,362 21,035 21,284 21,227
Liabilities 427,412 405,080 389,292 392,216 396,175 398,609 403,411 412,050 418,817Liabilities to Bank of Portugal 48,810 32,503 29,616 28,728 27,866 27,030 26,219 25,432 24,669Liabilities to non-residents 70,135 67,639 58,926 57,747 56,593 55,461 54,351 53,264 52,199Liabilities to non-monetary resident sector 217,918 216,943 216,963 216,599 218,341 221,270 226,621 231,501 236,764
General government 10,530 10,550 8,474 11,700 9,700 8,000 7,929 7,858 7,754Central government 9,222 9,120 6,667 9,205 7,631 6,294 6,238 6,182 6,100General government, excluding central government 1,308 1,430 1,807 2,495 2,068 1,706 1,691 1,676 1,653
Private sector 155,144 156,344 160,673 165,159 169,809 174,627 179,620 184,794 190,155Non-monetary financial institutions 43,761 41,062 37,358 39,740 38,833 38,644 39,072 38,850 38,855
Securities other than capital 37,858 28,670 24,404 25,136 25,890 26,667 27,467 28,291 29,140Capital and reserves 52,691 59,325 59,383 64,006 67,485 68,181 68,752 73,561 76,045
Broad money (M3) 147,774 146,488 152,561 156,063 159,124 162,462 166,077 169,939 173,955Intermediate money (M2) 143,949 143,762 149,632 153,067 156,069 159,342 162,888 166,676 170,615Narrow money (M1) 50,475 54,989 66,401 67,925 69,258 70,710 72,284 73,964 75,713
Private sector credit 241,767 222,379 213,194 208,504 207,461 207,669 209,330 212,679 216,082Public sector credit 38,691 41,503 39,945 47,630 52,069 54,184 56,756 61,605 64,568
Broad money 86.8 84.5 85.1 84.6 84.2 83.8 83.4 83.0 82.6Private sector credit 142.0 128.2 118.9 113.1 109.8 107.1 105.1 103.9 102.6Public sector credit 22.7 23.9 22.3 25.8 27.6 28.0 28.5 30.1 30.7
Broad money 0.2 -0.9 4.1 2.3 2.0 2.1 2.2 2.3 2.4Private sector credit -5.3 -8.0 -4.1 -2.2 -0.5 0.1 0.8 1.6 1.6Public sector credit -0.2 7.3 -3.8 19.2 9.3 4.1 4.7 8.5 4.8
Memorandum items:ECB access (Percent of assets) 11.4 8.0 7.6 7.3 7.0 6.8 6.5 6.2 5.9Credit to deposits (Percent) 128.7 121.6 116.7 118.3 118.9 118.3 117.4 118.5 118.5Loan to deposits (Percent) 111.0 105.4 100.6 99.9 99.8 99.3 99.6 100.6 101.2Wholesale market funding (Percent of assets)3 21.4 19.6 16.6 17.0 17.3 17.8 18.1 18.2 18.5
(Percent of GDP)
(Percentage change)
Aggregated Balance Sheet of Monetary Financial Institutions (MFIs)1
Money and Credit
Projections

INTERNATIONAL MONETARY FUND 33
Table 4. Portugal: Balance of Payments, 2013–2021 (Billions of euros, unless otherwise indicated; end of period)
Sources: Banco de Portugal; and IMF staff estimates. 1End-of-period data.
Est.2013 2014 2015 2016 2017 2018 2019 2020 2021
Current account 2.5 0.2 0.8 0.0 -1.2 -1.6 -2.1 -2.7 -3.3Balance of goods and services 3.1 2.0 3.1 3.3 2.0 1.6 1.1 0.5 -0.3
Trade balance -8.1 -9.5 -9.2 -9.7 -11.4 -12.6 -13.8 -15.3 -16.7Exports fob 46.5 47.2 49.0 47.9 51.2 54.0 56.6 59.3 62.4Imports fob 54.5 56.7 58.2 57.6 62.6 66.6 70.4 74.6 79.1
Services, net 11.2 11.5 12.3 13.0 13.4 14.1 14.9 15.8 16.4Exports 22.1 23.5 25.1 26.0 27.1 28.6 30.2 31.9 33.2Imports 10.9 12.1 12.8 13.0 13.7 14.4 15.3 16.2 16.8
Of which:Tourism 6.1 7.1 7.8 8.1 8.4 8.9 9.4 9.9 10.3
Exports 9.2 10.4 11.4 11.8 12.3 12.9 13.7 14.5 15.1Imports 3.1 3.3 3.6 3.7 3.9 4.1 4.3 4.6 4.8
Primary income, net -2.2 -3.0 -3.8 -4.6 -4.5 -4.5 -4.5 -4.6 -4.5Secondary income, net 1.5 1.3 1.6 1.3 1.3 1.3 1.3 1.4 1.5
Private remittances, net 3.1 3.0 3.2 3.0 3.0 3.1 3.1 3.2 3.3Official transfers, net -1.6 -1.7 -1.6 -1.7 -1.7 -1.7 -1.8 -1.8 -1.9
Capital account 2.8 2.6 2.3 2.3 2.3 2.3 2.3 2.3 2.3
Financial account 17.2 8.4 3.3 2.3 1.1 0.7 0.2 -0.4 -1.0Direct investment -3.6 -2.6 1.9 2.0 2.0 2.0 2.1 2.1 2.2
Direct investment assets 5.1 7.2 0.7 0.7 0.8 0.8 0.8 0.8 0.9Direct investment liabilities 8.7 9.8 -1.2 -1.2 -1.2 -1.2 -1.3 -1.3 -1.3
Portfolio investment, net 3.8 -1.3 -2.4 -2.4 -2.5 -2.6 -2.6 -2.7 -2.9Financial derivatives 1.0 1.9 0.3 0.3 0.3 0.3 0.3 0.3 0.3Other investment, net 15.6 8.7 1.9 1.7 0.9 0.7 0.4 -0.2 -0.6Reserve assets 0.4 1.7 1.5 0.7 0.4 0.2 0.1 0.0 0.0
Errors and omissions 0.3 0.4 0.2 0.0 0.0 0.0 0.0 0.0 0.0
Program financing 11.7 5.2 … … … … … … …European Union 8.2 3.5 … … … … … … …IMF 3.4 1.8 … … … … … … …
Memorandum items:Net international investment position1 -198.3 -198.4 -196.2 -193.9 -192.8 -192.2 -192.0 -192.4 -193.4
Direct investment, net -46.8 -47.9 -46.5 -44.6 -42.6 -40.6 -38.5 -36.4 -34.2Portfolio investment, net -18.4 -20.6 -23.4 -25.8 -28.3 -30.9 -33.5 -36.3 -39.1Financial derivatives -3.1 -1.8 0.1 0.4 0.7 1.0 1.3 1.6 1.9Other investment, net -142.7 -144.2 -144.2 -142.5 -141.5 -140.8 -140.5 -140.7 -141.3Reserve assets 12.7 16.2 17.8 18.6 18.9 19.1 19.2 19.2 19.3
Nominal GDP 170.3 173.4 179.4 184.4 188.9 193.8 199.1 204.7 210.6
Current account 1.5 0.1 0.5 0.0 -0.6 -0.8 -1.0 -1.3 -1.6Current account (Including capital transfers) 3.1 1.6 1.7 1.2 0.6 0.3 0.1 -0.2 -0.5
Of which: Balance of goods and services 1.8 1.1 1.7 1.8 1.1 0.8 0.6 0.2 -0.1Net international investment position1 -116.5 -114.4 -109.4 -105.2 -102.1 -99.1 -96.4 -94.0 -91.8
Direct investment, net -27.5 -27.6 -25.9 -24.2 -22.5 -20.9 -19.3 -17.8 -16.2Portfolio investment, net -10.8 -11.9 -13.0 -14.0 -15.0 -15.9 -16.8 -17.7 -18.6Financial derivatives -1.8 -1.0 0.1 0.2 0.4 0.5 0.7 0.8 0.9Other investment, net -83.8 -83.2 -80.4 -77.3 -74.9 -72.7 -70.5 -68.7 -67.1Reserve assets 7.5 9.3 9.9 10.1 10.0 9.9 9.6 9.4 9.2
Projections
(Billions of euros)
(Percent of GDP)

Table 5. Portugal: Financial Soundness Indicators, 2012:Q1–2015:Q41 (Percent)
Source: Banco de Portugal. 1The banking system data present a break in time series in 2014:Q3 due to the resolution measure applied to Banco Espírito Santo (BES). The break in time series stems, in particular, from the fact that the assets/liabilities not transferred to the balance sheet of Novo Banco are not considered in the aggregate of the banking system from August 2014 onwards. In the absence of accounting information for BES on a consolidated basis for the period from June 30, 2014 to the day of implementation of the resolution measure (closing balance sheet and statement of profit or loss), the reporting of BES on an individual basis, with reference to July 31, 2014, was considered when determining the aggregate results of the banking system for 2014:Q3. However, the adjustments stemming from the resolution measure applied to BES were also not considered. 2On accounting basis; consolidated. 3New NPL ratio in line with international practices. On a consolidated basis. 4Three-month residual maturity. 5Loans to customers (net of impairments) and securitized non-derecognized credit to customers divided by resources from customers and other loans.
PORTU
GAL
34 INTERN
ATION
AL MO
NETARY FU
ND
Mar. Jun. Sep. Dec. Mar. Jun. Sep. Dec. Mar. Jun. Sep. Dec. Mar. Jun. Sep. Dec.
Capital adequacyRegulatory capital to risk-weighted assets 10.7 12.3 12.3 12.6 13.0 13.1 13.4 13.3 12.3 12.0 13.0 12.3 12.0 12.5 12.6 13.3Common Equity Tier 1 capital to risk-weighted assets 12.2 10.6 12.0 11.3 11.1 11.6 11.6 12.4Regulatory tier 1 capital to risk-weighted assets 9.5 11.0 11.1 11.3 11.7 11.7 12.0 11.9 11.1 10.7 12.1 11.4 11.2 11.7 11.7 12.6Capital to assets2 5.8 6.2 6.6 6.7 6.9 6.7 6.9 6.9 7.4 7.2 8.1 7.7 8.0 7.8 8.1 8.5
Asset composition and qualityNon-performing loans to total gross loans3 8.0 9.2 9.8 9.8 10.4 10.6 11.2 10.6 10.8 11.2 12.0 12.0 12.3 12.6 12.8 11.9Sectoral distribution of loans
Residents 83.2 82.4 82.5 83.3 83.2 83.9 86.7 86.8 86.1 85.8 84.8 85.6 85.7 86.0 87.7 88.0Nonresidents 16.8 17.6 17.5 16.7 16.8 16.1 13.3 13.2 13.9 14.2 15.2 14.4 14.3 14.0 12.3 12.0
Earnings and profitabilityReturn on assets 0.5 0.1 0.0 -0.3 -0.3 -0.5 -0.5 -0.7 0.0 -1.8 -1.5 -1.3 0.5 0.5 0.3 0.2Return on equity 8.2 2.5 0.3 -5.4 -3.7 -8.0 -7.5 -11.0 -0.4 -24.8 -19.8 -17.9 6.4 6.0 3.6 2.7Interest margin to gross income 51.3 47.9 46.6 46.7 41.7 43.4 46.0 47.7 46.3 47.9 49.1 50.1 44.7 46.2 49.4 49.0Noninterest expenses to gross income 58.2 55.0 57.0 59.6 66.2 66.6 68.5 70.4 59.5 66.9 67.0 67.4 53.3 55.0 59.6 59.3
LiquidityLiquid assets to total assets4 11.2 12.7 13.7 14.8 15.4 16.0 15.7 16.9 16.7 16.2 17.2 22.0 19.4 19.4 18.7 20.5
Liquid assets to short-term liabilities4 90.5 101.5 123.2 140.0 145.9 150.7 155.1 170.3 155.6 157.3 146.8 154.2 154.7 169.4 178.5 207.4
Loans to deposits5 136.9 136.3 133.3 127.9 124.0 122.6 120.7 116.9 117.2 113.9 111.9 107.2 106.9 106.0 104.6 102.6
Foreign-currency-denominated liabilities to total liabilities6 3.9 3.9 4.0 4.2 4.5 4.4 4.4 4.3 4.3 4.7 4.8 4.5 4.6 4.5 4.4 4.1
Source: Bank of Portugal.
2On accounting basis; consolidated.
1The banking system data present a break in time series in 2014Q3 due to the resolution measure applied to Banco Espírito Santo (BES). The break in time series stems, in particular, from the fact that the assets/liabilities not transferred to the balance sheet of Novo Banco (NB) are not considered in the aggregate of the banking system from August 2014 onwards. In the absence of accounting information for BES on a consolidated basis for the period from 30 June 2014 to the day of implementation of the resolution measure (closing balance sheet and statement of profit or loss), the reporting of BES on an individual basis, with reference to 31 July 2014, was considered when determining the aggregate results of the banking system for 2014Q3. However, the adjustments stemming from the resolution measure applied to BES were also not considered.
20152012 2013 2014
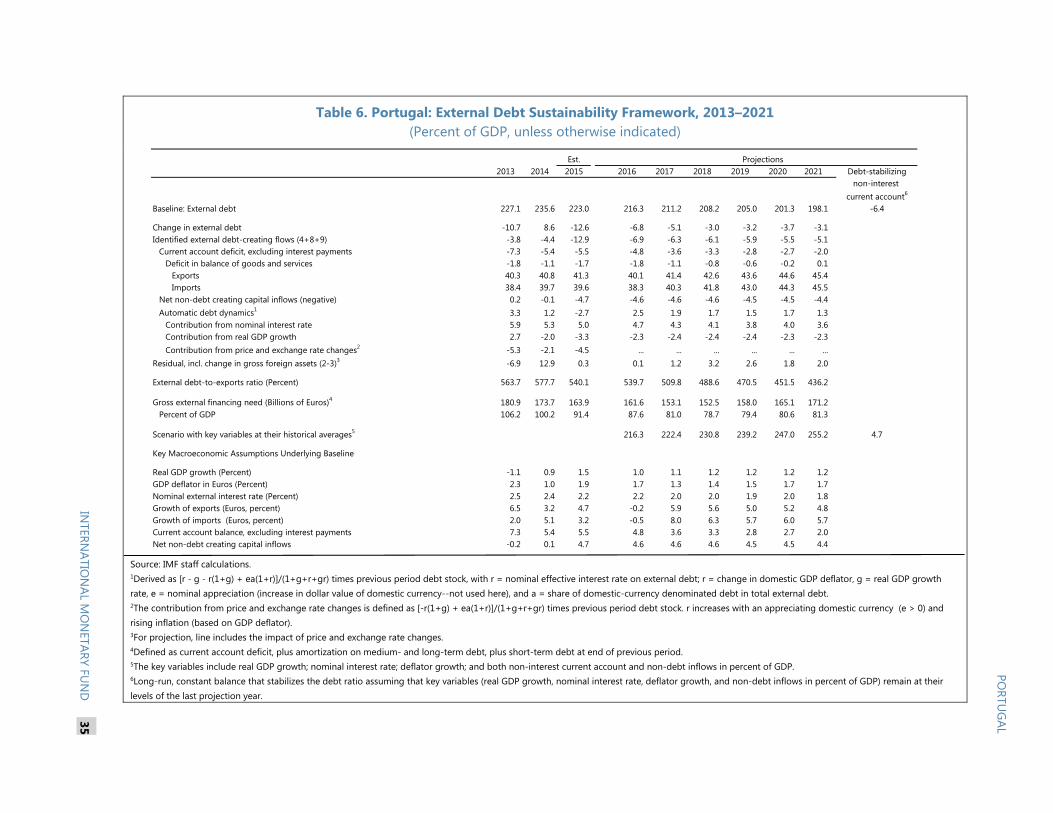
Table 6. Portugal: External Debt Sustainability Framework, 2013–2021 (Percent of GDP, unless otherwise indicated)
Source: IMF staff calculations. 1Derived as [r - g - r(1+g) + ea(1+r)]/(1+g+r+gr) times previous period debt stock, with r = nominal effective interest rate on external debt; r = change in domestic GDP deflator, g = real GDP growth rate, e = nominal appreciation (increase in dollar value of domestic currency--not used here), and a = share of domestic-currency denominated debt in total external debt. 2The contribution from price and exchange rate changes is defined as [-r(1+g) + ea(1+r)]/(1+g+r+gr) times previous period debt stock. r increases with an appreciating domestic currency (e > 0) and rising inflation (based on GDP deflator). 3For projection, line includes the impact of price and exchange rate changes. 4Defined as current account deficit, plus amortization on medium- and long-term debt, plus short-term debt at end of previous period. 5The key variables include real GDP growth; nominal interest rate; deflator growth; and both non-interest current account and non-debt inflows in percent of GDP. 6Long-run, constant balance that stabilizes the debt ratio assuming that key variables (real GDP growth, nominal interest rate, deflator growth, and non-debt inflows in percent of GDP) remain at their levels of the last projection year.
PORTU
GAL
INTERN
ATION
AL MO
NETARY FU
ND
35
Est.2013 2014 2015 2016 2017 2018 2019 2020 2021 Debt-stabilizing
non-interest current account6
Baseline: External debt 227.1 235.6 223.0 216.3 211.2 208.2 205.0 201.3 198.1 -6.4
Change in external debt -10.7 8.6 -12.6 -6.8 -5.1 -3.0 -3.2 -3.7 -3.1Identified external debt-creating flows (4+8+9) -3.8 -4.4 -12.9 -6.9 -6.3 -6.1 -5.9 -5.5 -5.1
Current account deficit, excluding interest payments -7.3 -5.4 -5.5 -4.8 -3.6 -3.3 -2.8 -2.7 -2.0Deficit in balance of goods and services -1.8 -1.1 -1.7 -1.8 -1.1 -0.8 -0.6 -0.2 0.1
Exports 40.3 40.8 41.3 40.1 41.4 42.6 43.6 44.6 45.4Imports 38.4 39.7 39.6 38.3 40.3 41.8 43.0 44.3 45.5
Net non-debt creating capital inflows (negative) 0.2 -0.1 -4.7 -4.6 -4.6 -4.6 -4.5 -4.5 -4.4Automatic debt dynamics1 3.3 1.2 -2.7 2.5 1.9 1.7 1.5 1.7 1.3
Contribution from nominal interest rate 5.9 5.3 5.0 4.7 4.3 4.1 3.8 4.0 3.6Contribution from real GDP growth 2.7 -2.0 -3.3 -2.3 -2.4 -2.4 -2.4 -2.3 -2.3Contribution from price and exchange rate changes2 -5.3 -2.1 -4.5 ... ... ... ... ... ...
Residual, incl. change in gross foreign assets (2-3)3 -6.9 12.9 0.3 0.1 1.2 3.2 2.6 1.8 2.0
External debt-to-exports ratio (Percent) 563.7 577.7 540.1 539.7 509.8 488.6 470.5 451.5 436.2
Gross external financing need (Billions of Euros)4 180.9 173.7 163.9 161.6 153.1 152.5 158.0 165.1 171.2Percent of GDP 106.2 100.2 91.4 87.6 81.0 78.7 79.4 80.6 81.3
Scenario with key variables at their historical averages5 216.3 222.4 230.8 239.2 247.0 255.2 4.7
Key Macroeconomic Assumptions Underlying Baseline
Real GDP growth (Percent) -1.1 0.9 1.5 1.0 1.1 1.2 1.2 1.2 1.2GDP deflator in Euros (Percent) 2.3 1.0 1.9 1.7 1.3 1.4 1.5 1.7 1.7Nominal external interest rate (Percent) 2.5 2.4 2.2 2.2 2.0 2.0 1.9 2.0 1.8Growth of exports (Euros, percent) 6.5 3.2 4.7 -0.2 5.9 5.6 5.0 5.2 4.8Growth of imports (Euros, percent) 2.0 5.1 3.2 -0.5 8.0 6.3 5.7 6.0 5.7Current account balance, excluding interest payments 7.3 5.4 5.5 4.8 3.6 3.3 2.8 2.7 2.0Net non-debt creating capital inflows -0.2 0.1 4.7 4.6 4.6 4.6 4.5 4.5 4.4
Projections
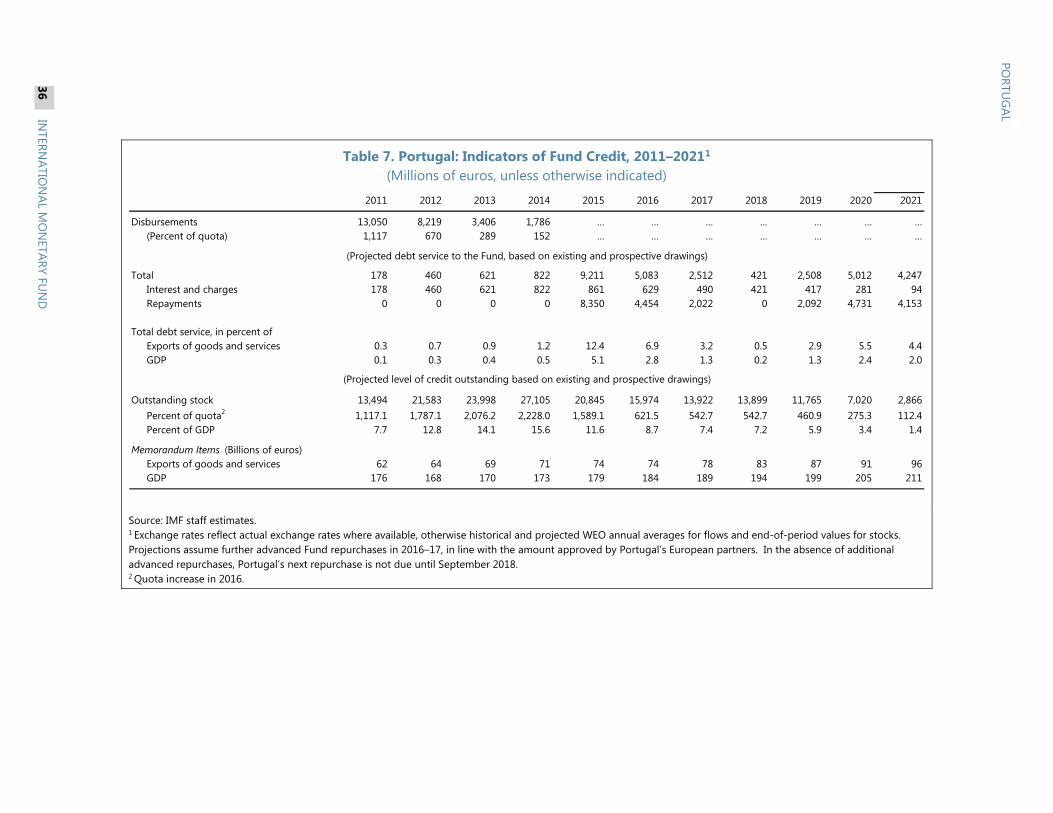
Table 7. Portugal: Indicators of Fund Credit, 2011–20211 (Millions of euros, unless otherwise indicated)
Source: IMF staff estimates. 1 Exchange rates reflect actual exchange rates where available, otherwise historical and projected WEO annual averages for flows and end-of-period values for stocks. Projections assume further advanced Fund repurchases in 2016–17, in line with the amount approved by Portugal’s European partners. In the absence of additional advanced repurchases, Portugal’s next repurchase is not due until September 2018. 2 Quota increase in 2016.
PORTU
GAL
36 INTERN
ATION
AL MO
NETARY FU
ND
2011 2012 2013 2014 2015 2016 2017 2018 2019 2020 2021
Disbursements 13,050 8,219 3,406 1,786 … … … … … … …(Percent of quota) 1,117 670 289 152 … … … … … … …
Total 178 460 621 822 9,211 5,083 2,512 421 2,508 5,012 4,247Interest and charges 178 460 621 822 861 629 490 421 417 281 94Repayments 0 0 0 0 8,350 4,454 2,022 0 2,092 4,731 4,153
Total debt service, in percent ofExports of goods and services 0.3 0.7 0.9 1.2 12.4 6.9 3.2 0.5 2.9 5.5 4.4GDP 0.1 0.3 0.4 0.5 5.1 2.8 1.3 0.2 1.3 2.4 2.0
Outstanding stock 13,494 21,583 23,998 27,105 20,845 15,974 13,922 13,899 11,765 7,020 2,866Percent of quota2 1,117.1 1,787.1 2,076.2 2,228.0 1,589.1 621.5 542.7 542.7 460.9 275.3 112.4Percent of GDP 7.7 12.8 14.1 15.6 11.6 8.7 7.4 7.2 5.9 3.4 1.4
Memorandum Items (Billions of euros)Exports of goods and services 62 64 69 71 74 74 78 83 87 91 96GDP 176 168 170 173 179 184 189 194 199 205 211
(Projected debt service to the Fund, based on existing and prospective drawings)
(Projected level of credit outstanding based on existing and prospective drawings)
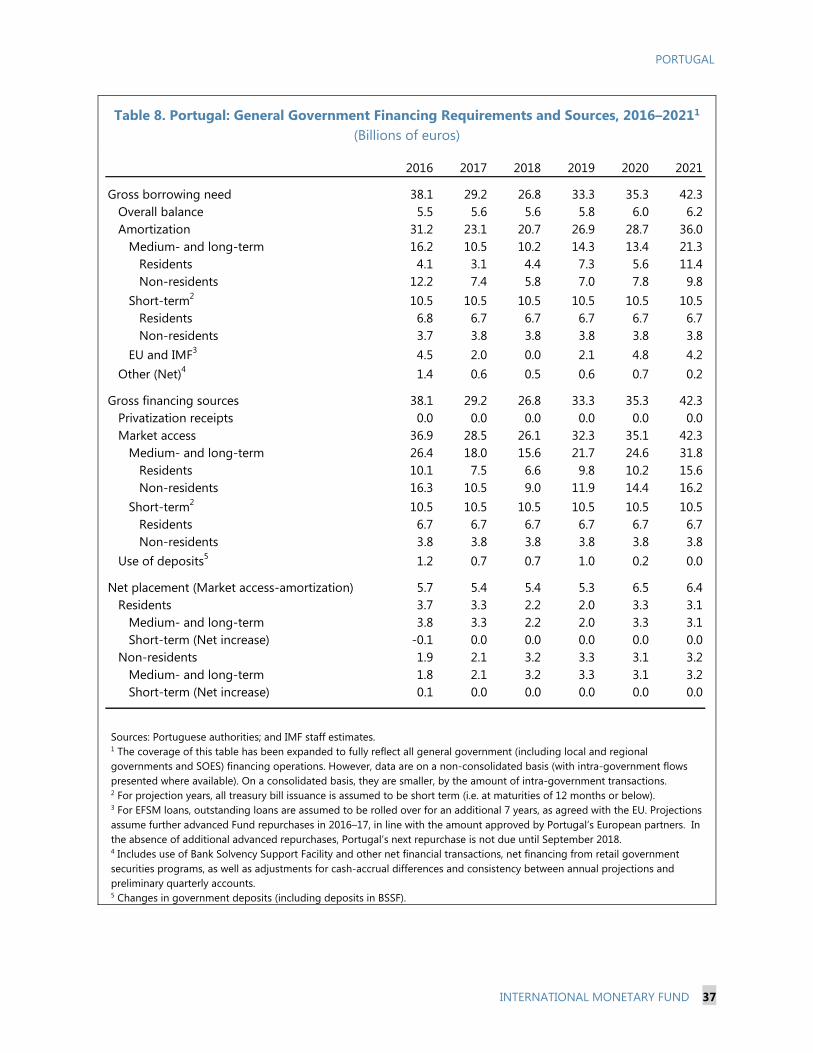
PORTUGAL
INTERNATIONAL MONETARY FUND 37
Table 8. Portugal: General Government Financing Requirements and Sources, 2016–20211 (Billions of euros)
Sources: Portuguese authorities; and IMF staff estimates. 1 The coverage of this table has been expanded to fully reflect all general government (including local and regional governments and SOES) financing operations. However, data are on a non-consolidated basis (with intra-government flows presented where available). On a consolidated basis, they are smaller, by the amount of intra-government transactions. 2 For projection years, all treasury bill issuance is assumed to be short term (i.e. at maturities of 12 months or below). 3 For EFSM loans, outstanding loans are assumed to be rolled over for an additional 7 years, as agreed with the EU. Projections assume further advanced Fund repurchases in 2016–17, in line with the amount approved by Portugal’s European partners. In the absence of additional advanced repurchases, Portugal’s next repurchase is not due until September 2018. 4 Includes use of Bank Solvency Support Facility and other net financial transactions, net financing from retail government securities programs, as well as adjustments for cash-accrual differences and consistency between annual projections and preliminary quarterly accounts. 5 Changes in government deposits (including deposits in BSSF).
2016 2017 2018 2019 2020 2021
Gross borrowing need 38.1 29.2 26.8 33.3 35.3 42.3Overall balance 5.5 5.6 5.6 5.8 6.0 6.2Amortization 31.2 23.1 20.7 26.9 28.7 36.0
Medium- and long-term 16.2 10.5 10.2 14.3 13.4 21.3Residents 4.1 3.1 4.4 7.3 5.6 11.4Non-residents 12.2 7.4 5.8 7.0 7.8 9.8
Short-term2 10.5 10.5 10.5 10.5 10.5 10.5Residents 6.8 6.7 6.7 6.7 6.7 6.7Non-residents 3.7 3.8 3.8 3.8 3.8 3.8
EU and IMF3 4.5 2.0 0.0 2.1 4.8 4.2Other (Net)4 1.4 0.6 0.5 0.6 0.7 0.2
Gross financing sources 38.1 29.2 26.8 33.3 35.3 42.3Privatization receipts 0.0 0.0 0.0 0.0 0.0 0.0Market access 36.9 28.5 26.1 32.3 35.1 42.3
Medium- and long-term 26.4 18.0 15.6 21.7 24.6 31.8Residents 10.1 7.5 6.6 9.8 10.2 15.6Non-residents 16.3 10.5 9.0 11.9 14.4 16.2
Short-term2 10.5 10.5 10.5 10.5 10.5 10.5Residents 6.7 6.7 6.7 6.7 6.7 6.7Non-residents 3.8 3.8 3.8 3.8 3.8 3.8
Use of deposits5 1.2 0.7 0.7 1.0 0.2 0.0
Net placement (Market access-amortization) 5.7 5.4 5.4 5.3 6.5 6.4Residents 3.7 3.3 2.2 2.0 3.3 3.1
Medium- and long-term 3.8 3.3 2.2 2.0 3.3 3.1Short-term (Net increase) -0.1 0.0 0.0 0.0 0.0 0.0
Non-residents 1.9 2.1 3.2 3.3 3.1 3.2Medium- and long-term 1.8 2.1 3.2 3.3 3.1 3.2
Short-term (Net increase) 0.1 0.0 0.0 0.0 0.0 0.0
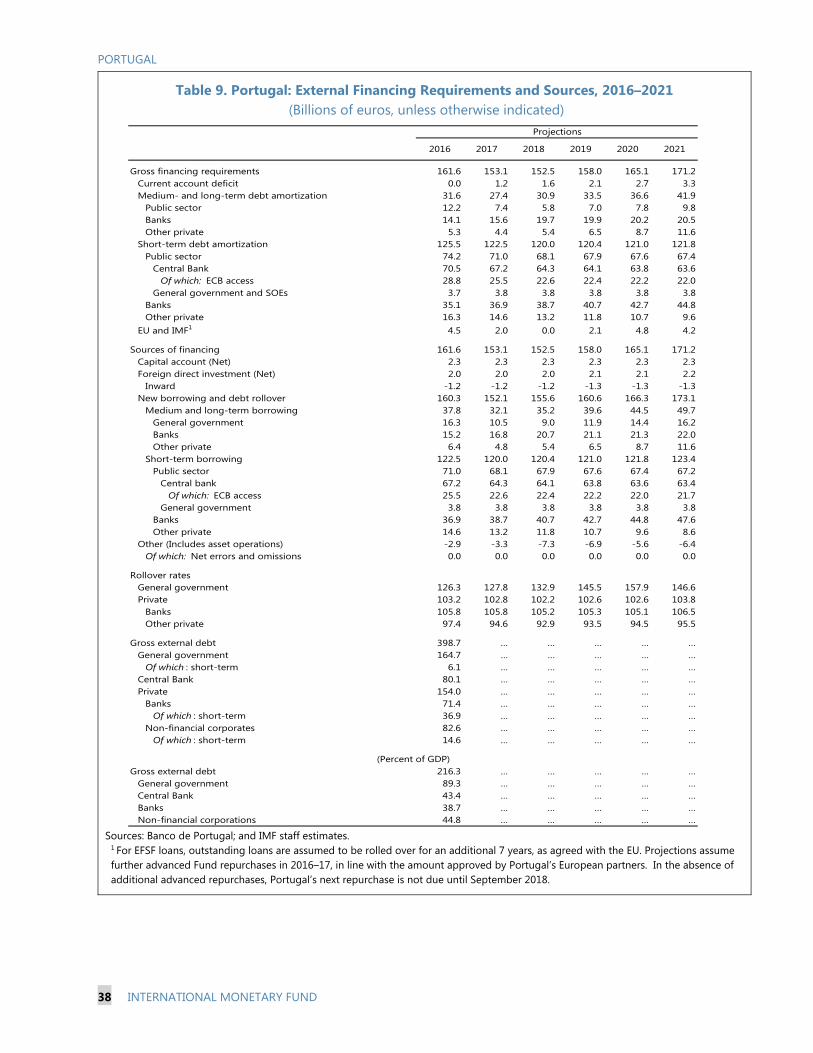
PORTUGAL
38 INTERNATIONAL MONETARY FUND
Table 9. Portugal: External Financing Requirements and Sources, 2016–2021 (Billions of euros, unless otherwise indicated)
Sources: Banco de Portugal; and IMF staff estimates. 1 For EFSF loans, outstanding loans are assumed to be rolled over for an additional 7 years, as agreed with the EU. Projections assume further advanced Fund repurchases in 2016–17, in line with the amount approved by Portugal’s European partners. In the absence of additional advanced repurchases, Portugal’s next repurchase is not due until September 2018.
2016 2017 2018 2019 2020 2021
Gross financing requirements 161.6 153.1 152.5 158.0 165.1 171.2Current account deficit 0.0 1.2 1.6 2.1 2.7 3.3Medium- and long-term debt amortization 31.6 27.4 30.9 33.5 36.6 41.9
Public sector 12.2 7.4 5.8 7.0 7.8 9.8Banks 14.1 15.6 19.7 19.9 20.2 20.5Other private 5.3 4.4 5.4 6.5 8.7 11.6
Short-term debt amortization 125.5 122.5 120.0 120.4 121.0 121.8Public sector 74.2 71.0 68.1 67.9 67.6 67.4
Central Bank 70.5 67.2 64.3 64.1 63.8 63.6Of which: ECB access 28.8 25.5 22.6 22.4 22.2 22.0
General government and SOEs 3.7 3.8 3.8 3.8 3.8 3.8Banks 35.1 36.9 38.7 40.7 42.7 44.8Other private 16.3 14.6 13.2 11.8 10.7 9.6
EU and IMF1 4.5 2.0 0.0 2.1 4.8 4.2
Sources of financing 161.6 153.1 152.5 158.0 165.1 171.2Capital account (Net) 2.3 2.3 2.3 2.3 2.3 2.3Foreign direct investment (Net) 2.0 2.0 2.0 2.1 2.1 2.2
Inward -1.2 -1.2 -1.2 -1.3 -1.3 -1.3New borrowing and debt rollover 160.3 152.1 155.6 160.6 166.3 173.1
Medium and long-term borrowing 37.8 32.1 35.2 39.6 44.5 49.7General government 16.3 10.5 9.0 11.9 14.4 16.2Banks 15.2 16.8 20.7 21.1 21.3 22.0Other private 6.4 4.8 5.4 6.5 8.7 11.6
Short-term borrowing 122.5 120.0 120.4 121.0 121.8 123.4Public sector 71.0 68.1 67.9 67.6 67.4 67.2
Central bank 67.2 64.3 64.1 63.8 63.6 63.4Of which: ECB access 25.5 22.6 22.4 22.2 22.0 21.7
General government 3.8 3.8 3.8 3.8 3.8 3.8Banks 36.9 38.7 40.7 42.7 44.8 47.6Other private 14.6 13.2 11.8 10.7 9.6 8.6
Other (Includes asset operations) -2.9 -3.3 -7.3 -6.9 -5.6 -6.4Of which: Net errors and omissions 0.0 0.0 0.0 0.0 0.0 0.0
Rollover ratesGeneral government 126.3 127.8 132.9 145.5 157.9 146.6Private 103.2 102.8 102.2 102.6 102.6 103.8
Banks 105.8 105.8 105.2 105.3 105.1 106.5Other private 97.4 94.6 92.9 93.5 94.5 95.5
Gross external debt 398.7 … … … … …General government 164.7 … … … … …
Of which : short-term 6.1 … … … … …Central Bank 80.1 … … … … …Private 154.0 … … … … …
Banks 71.4 … … … … …Of which : short-term 36.9 … … … … …
Non-financial corporates 82.6 … … … … …Of which : short-term 14.6 … … … … …
Gross external debt 216.3 … … … … …General government 89.3 … … … … …Central Bank 43.4 … … … … …Banks 38.7 … … … … …Non-financial corporations 44.8 … … … … …
Projections
(Percent of GDP)

PORTUGAL
INTERNATIONAL MONETARY FUND 39
Annex I. Main Recommendations of the 2015 Article IV Consultation and Authorities’ Response
Fund policy recommendations Policy actions 1. Fiscal adjustment (a) Fiscal policy should be anchored around
an annual structural primary adjustment of 0.5 percent of GDP.
The authorities’ 2016 budget targets a primary structural adjustment of 0.2 percent of GDP, although there are significant risks to execution. The medium-term fiscal strategy targets an annual primary structural adjustment of 0.3 percent of GDP, although this depends in part on optimistic macroeconomic assumptions.
(a.1) Multi-year expenditure targets should be introduced to underpin a fiscal adjustment based on spending rationalization.
The 2016 budget frontloaded the unwinding of public sector wage cuts, to be offset by hikes in a range of indirect taxes. The authorities’ medium-term fiscal strategy envisages a fiscal adjustment based on expenditure savings from a reduction of the public sector wage bill and rationalization of intermediate consumption, but contains little specificity on the required reforms. There are no immediate plans for introduction of multi-year expenditure ceilings.
(a.2) Specific policy measures to contain spending should be identified to enforce the expenditure targets, with a focus on public sector wages and pensions.
(a.3) Priority should be given to the finalization and adoption of a new Budget Framework Law to improve budget preparation and execution.
The Budget Framework Law was approved in July 2015, but implementation has moved slowly.
2. Corporate deleveraging (b) Eliminating the corporate debt overhang
is essential for Portugal’s recovery . Corporate deleveraging has moved slowly and high corporate indebtedness continues to constrain the pace of recovery. The large share of banks’ assets tied up in unviable enterprises limits their space for new lending, while overleveraged households and corporates are not in a position to accumulate more debt.
(b.1) Banks should raise more capital and accelerate the pace of write-offs.
Banks have struggled to raise capital, reflecting weak profitability and concerns about asset quality. This in turn has limited their scope to deal more aggressively with NPLs and accelerate write-offs.
(b.2) The authorities should advance corporate governance reform to encourage firms to increase equity and reduce the tax debt bias.
The authorities’ National Reform Program aims to increase investment in start-ups and SMEs by accessing EU structural funds.
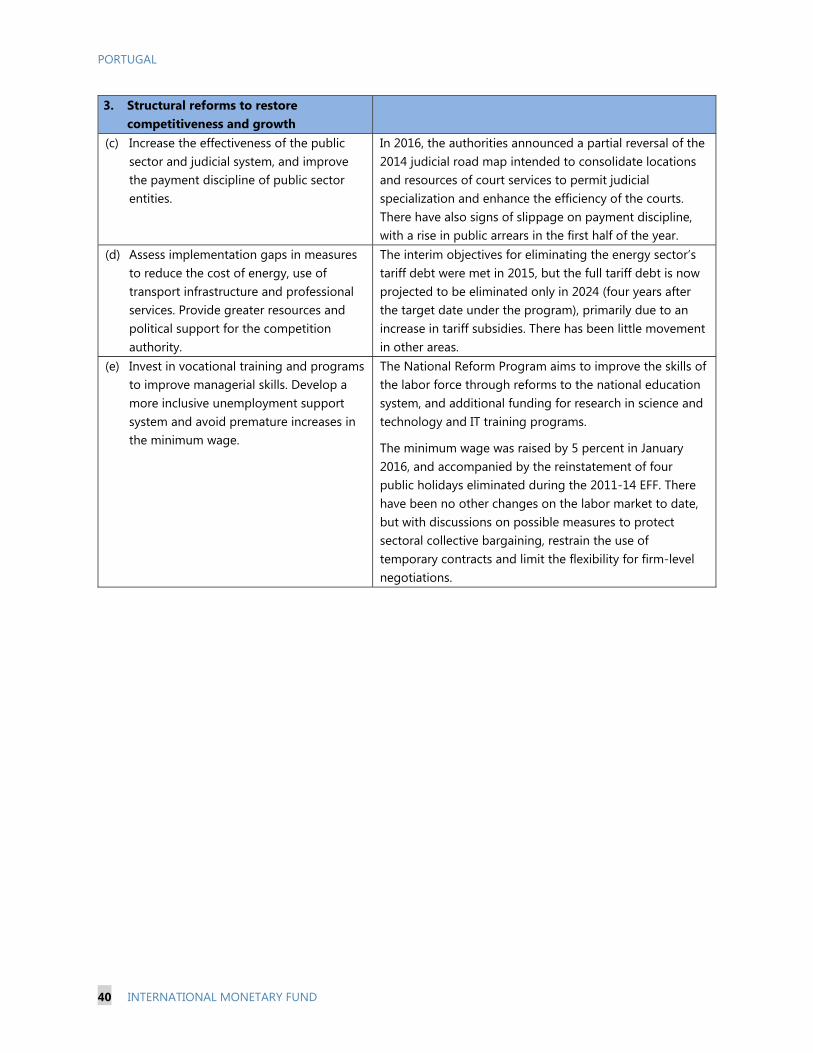
PORTUGAL
40 INTERNATIONAL MONETARY FUND
3. Structural reforms to restore competitiveness and growth
(c) Increase the effectiveness of the public sector and judicial system, and improve the payment discipline of public sector entities.
In 2016, the authorities announced a partial reversal of the 2014 judicial road map intended to consolidate locations and resources of court services to permit judicial specialization and enhance the efficiency of the courts. There have also signs of slippage on payment discipline, with a rise in public arrears in the first half of the year.
(d) Assess implementation gaps in measures to reduce the cost of energy, use of transport infrastructure and professional services. Provide greater resources and political support for the competition authority.
The interim objectives for eliminating the energy sector’s tariff debt were met in 2015, but the full tariff debt is now projected to be eliminated only in 2024 (four years after the target date under the program), primarily due to an increase in tariff subsidies. There has been little movement in other areas.
(e) Invest in vocational training and programs to improve managerial skills. Develop a more inclusive unemployment support system and avoid premature increases in the minimum wage.
The National Reform Program aims to improve the skills of the labor force through reforms to the national education system, and additional funding for research in science and technology and IT training programs.
The minimum wage was raised by 5 percent in January 2016, and accompanied by the reinstatement of four public holidays eliminated during the 2011-14 EFF. There have been no other changes on the labor market to date, but with discussions on possible measures to protect sectoral collective bargaining, restrain the use of temporary contracts and limit the flexibility for firm-level negotiations.
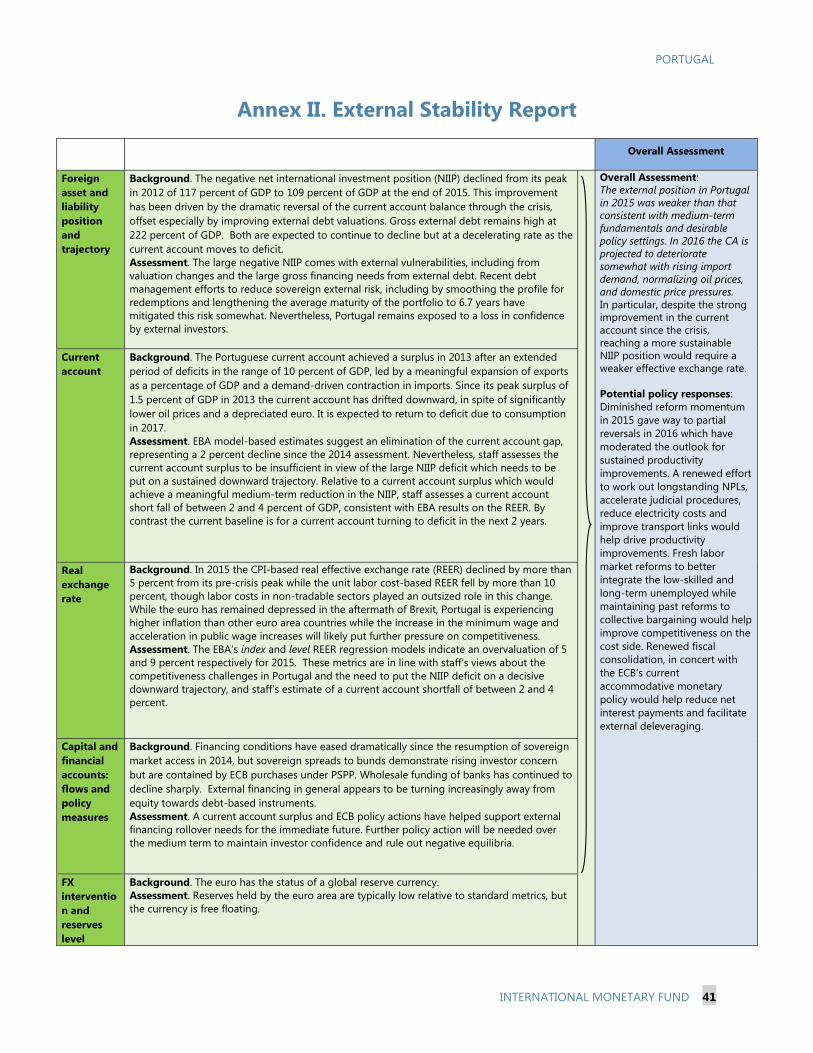
PORTUGAL
INTERNATIONAL MONETARY FUND 41
Annex II. External Stability Report
Overall Assessment
Foreign asset and liability position and trajectory
Background. The negative net international investment position (NIIP) declined from its peak in 2012 of 117 percent of GDP to 109 percent of GDP at the end of 2015. This improvement has been driven by the dramatic reversal of the current account balance through the crisis, offset especially by improving external debt valuations. Gross external debt remains high at 222 percent of GDP. Both are expected to continue to decline but at a decelerating rate as the current account moves to deficit. Assessment. The large negative NIIP comes with external vulnerabilities, including from valuation changes and the large gross financing needs from external debt. Recent debt management efforts to reduce sovereign external risk, including by smoothing the profile for redemptions and lengthening the average maturity of the portfolio to 6.7 years have mitigated this risk somewhat. Nevertheless, Portugal remains exposed to a loss in confidence by external investors.
Overall Assessment: The external position in Portugal in 2015 was weaker than that consistent with medium-term fundamentals and desirable policy settings. In 2016 the CA is projected to deteriorate somewhat with rising import demand, normalizing oil prices, and domestic price pressures. In particular, despite the strong improvement in the current account since the crisis, reaching a more sustainable NIIP position would require a weaker effective exchange rate. Potential policy responses: Diminished reform momentum in 2015 gave way to partial reversals in 2016 which have moderated the outlook for sustained productivity improvements. A renewed effort to work out longstanding NPLs, accelerate judicial procedures, reduce electricity costs and improve transport links would help drive productivity improvements. Fresh labor market reforms to better integrate the low-skilled and long-term unemployed while maintaining past reforms to collective bargaining would help improve competitiveness on the cost side. Renewed fiscal consolidation, in concert with the ECB’s current accommodative monetary policy would help reduce net interest payments and facilitate external deleveraging.
Current account
Background. The Portuguese current account achieved a surplus in 2013 after an extended period of deficits in the range of 10 percent of GDP, led by a meaningful expansion of exports as a percentage of GDP and a demand-driven contraction in imports. Since its peak surplus of 1.5 percent of GDP in 2013 the current account has drifted downward, in spite of significantly lower oil prices and a depreciated euro. It is expected to return to deficit due to consumption in 2017. Assessment. EBA model-based estimates suggest an elimination of the current account gap, representing a 2 percent decline since the 2014 assessment. Nevertheless, staff assesses the current account surplus to be insufficient in view of the large NIIP deficit which needs to be put on a sustained downward trajectory. Relative to a current account surplus which would achieve a meaningful medium-term reduction in the NIIP, staff assesses a current account short fall of between 2 and 4 percent of GDP, consistent with EBA results on the REER. By contrast the current baseline is for a current account turning to deficit in the next 2 years.
Real exchange rate
Background. In 2015 the CPI-based real effective exchange rate (REER) declined by more than 5 percent from its pre-crisis peak while the unit labor cost-based REER fell by more than 10 percent, though labor costs in non-tradable sectors played an outsized role in this change. While the euro has remained depressed in the aftermath of Brexit, Portugal is experiencing higher inflation than other euro area countries while the increase in the minimum wage and acceleration in public wage increases will likely put further pressure on competitiveness. Assessment. The EBA’s index and level REER regression models indicate an overvaluation of 5 and 9 percent respectively for 2015. These metrics are in line with staff’s views about the competitiveness challenges in Portugal and the need to put the NIIP deficit on a decisive downward trajectory, and staff’s estimate of a current account shortfall of between 2 and 4 percent.
Capital and financial accounts: flows and policy measures
Background. Financing conditions have eased dramatically since the resumption of sovereign market access in 2014, but sovereign spreads to bunds demonstrate rising investor concern but are contained by ECB purchases under PSPP. Wholesale funding of banks has continued to decline sharply. External financing in general appears to be turning increasingly away from equity towards debt-based instruments. Assessment. A current account surplus and ECB policy actions have helped support external financing rollover needs for the immediate future. Further policy action will be needed over the medium term to maintain investor confidence and rule out negative equilibria.
FX intervention and reserves level
Background. The euro has the status of a global reserve currency. Assessment. Reserves held by the euro area are typically low relative to standard metrics, but the currency is free floating.

PORTUGAL
INTERNATIONAL MONETARY FUND 42
Annex III. Risk Assessment Matrix1
Source of Risks Relative Likelihood
Impact Policy response
Loss of investor confidence due to reform reversals or other negative surprises potentially including difficulties in the banking sector or loss of sole investment-grade rating: • Increase in sovereign bonds yields and
reduction in foreign direct investment.
High
High
Significant funding distress higher public and private borrowing costs.
To minimize exposure: Strengthen policy buffers and avoid backtracking on reforms. If risk materializes: Take steps to restore market access at favorable terms and ensure banks’ access to liquidity is maintained. Take fiscal measures to ensure fiscal targets are being met.
Tighter or more volatile global financial conditions: Sharp rise in risk premia with flight
to safety: Investors withdraw from specific risk asset classes as they reassess underlying economic and financial risks in large economies, or respond to unanticipated Fed tightening, and increases in U.S. term premia, with poor market liquidity amplifying volatility. Safe haven currencies—especially the US dollar—surge creates balance sheet strains for FX debtors.
Medium
High
Given its high corporate and private debt levels, Portugal would be highly susceptible to financial contagion. The result would be a heightened financial stress in the Portuguese banking system, as balance sheet fragilities in both banking and corporate sectors are still significant.
To minimize exposure: Shore up liquidity and capital buffers; encourage private savings, and shrink private sector balance sheets. If risk materializes: ECB policy actions to ensure market liquidity, encourage lending to productive investment opportunities, and ensure orderly monetary transmission mechanisms, including expansion of asset purchase programs.
1 The Risk Assessment Matrix (RAM) shows events that could materially alter the baseline path (the scenario most likely to materialize in the view of IMF staff). The relative likelihood is the staff’s subjective assessment of the risks surrounding the baseline (“low” is meant to indicate a probability below 10 percent, “medium” a probability between 10 and 30 percent, and “high” a probability between 30 and 50 percent). The RAM reflects staff views on the source of risks and overall level of concern as of the time of discussions with the authorities. Non-mutually exclusive risks may interact and materialize jointly. “Short term” and “medium term” are meant to indicate that the risk could materialize within 1 year and 3 years, respectively.
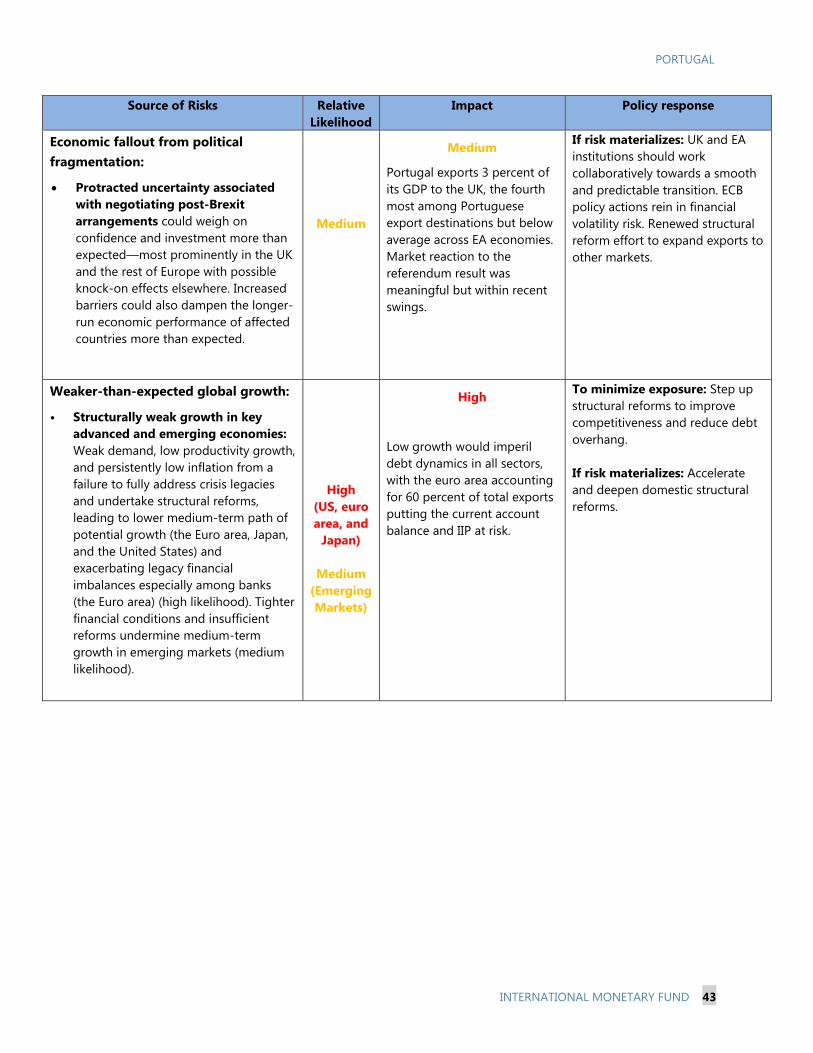
PORTUGAL
INTERNATIONAL MONETARY FUND 43
Source of Risks Relative Likelihood
Impact Policy response
Economic fallout from political fragmentation:
Protracted uncertainty associated with negotiating post-Brexit arrangements could weigh on confidence and investment more than expected—most prominently in the UK and the rest of Europe with possible knock-on effects elsewhere. Increased barriers could also dampen the longer-run economic performance of affected countries more than expected.
Medium
Medium
Portugal exports 3 percent of its GDP to the UK, the fourth most among Portuguese export destinations but below average across EA economies. Market reaction to the referendum result was meaningful but within recent swings.
If risk materializes: UK and EA institutions should work collaboratively towards a smooth and predictable transition. ECB policy actions rein in financial volatility risk. Renewed structural reform effort to expand exports to other markets.
Weaker-than-expected global growth:
• Structurally weak growth in key advanced and emerging economies: Weak demand, low productivity growth, and persistently low inflation from a failure to fully address crisis legacies and undertake structural reforms, leading to lower medium-term path of potential growth (the Euro area, Japan, and the United States) and exacerbating legacy financial imbalances especially among banks (the Euro area) (high likelihood). Tighter financial conditions and insufficient reforms undermine medium-term growth in emerging markets (medium likelihood).
High
(US, euro area, and
Japan)
Medium (Emerging Markets)
High
Low growth would imperil debt dynamics in all sectors, with the euro area accounting for 60 percent of total exports putting the current account balance and IIP at risk.
To minimize exposure: Step up structural reforms to improve competitiveness and reduce debt overhang. If risk materializes: Accelerate and deepen domestic structural reforms.

PORTUGAL
44 INTERNATIONAL MONETARY FUND
Source of Risks Relative Likelihood
Impact Policy response
Persistently lower energy prices, triggered by supply factors reversing more gradually than expected.
High
Medium
A low fuel import bill is potentially offset by greater difficulties in Angola, a key economic and financial partner.
To minimize exposure: Step up efforts to clean up corporate balance sheets, including the reduction of exposures to Angola. If risk materializes: Shore up the banks using the existing toolkit, while ensuring public debt dynamics are not compromised. Renewed structural reform effort to expand exports to other markets.
Financial distress in one or more banks, requiring intervention.
Medium
High
Loss of confidence in the banking system, resulting in potentially high fiscal costs.
To minimize exposure: Proactive bank supervision to ensure balance sheet clean-up, a build-up of capital buffers in banks and of fiscal buffers. Strengthen oversight of banks’ risk management practices. If risk materializes: Shore up the banks using the existing toolkit, while ensuring public debt dynamics are not compromised.

PORTUGAL
INTERNATIONAL MONETARY FUND 45
Annex IV. Public Debt Sustainability Analysis (DSA)
Staff’s analysis, applying the Public DSA framework for Market-Access Countries, suggests that
Portugal’s gross debt trajectory is subject to significant risks, in the context of a sizable debt burden
and gross financing needs. Debt dynamics remain highly vulnerable to adverse yet plausible macro-
fiscal and contingent liabilities shocks, including the possible need for further fiscal support for the
financial sector. The risk of a contingent liabilities shock materializing remains elevated, in light of
financial sector vulnerabilities. Staff’s baseline projections reflect the authorities’ current fiscal policies;
additional fiscal consolidation remains critical to anchor debt safely on a downward-sloping path,
boosting policy credibility and strengthening the country’s resilience to reversals in market sentiment.
I. Baseline Scenario
1. There was a modest decline in public debt in 2015 despite large fiscal costs related to
financial sector operations. Public debt fell from 130.2 to 129.0 percent of GDP at end-2015,
primarily reflecting a large drawdown of deposits, as the authorities used large cash reserves to help
finance early Fund repurchases. Portugal’s debt net of central government deposits rose further to
121.6 percent of GDP from 120 percent of GDP at end–2014. A modest decline in public debt is
projected to continue through 2021 as the headline fiscal deficit stabilizes just below 3 percent of
GDP, but public debt would still remain elevated at 126.0 percent of GDP in 2021. The further
drawdown of cash deposits from 2016–21 is projected to be modest, reflecting the authorities’
intention to maintain cover for 6 months’ refinancing needs. Potential proceeds from the sale of
financial sector assets (including Novo Banco) have not been included in the baseline, reflecting
considerable uncertainty over prospects for the sale of these assets.
II. Risk Assessment
2. Portugal’s sizable debt burden and gross financing needs continue to pose significant
risks to debt sustainability and leave debt dynamics very sensitive to macro shocks. As shown
in Figure 1, Portugal’s debt ratio already exceeds the debt burden benchmark for advanced
economies of 85 percent of GDP under the baseline scenario. While the authorities have made
progress over the past year in borrowing at longer maturities in order to smooth the repayment
profile of public debt, Portugal’s public financing needs also exceed the relevant benchmark
of 20 percent of GDP during the projection period. However, the debt profile is subject to medium
to low risks in terms of market perception, projected change in short-term debt, and the share of
PORTUGAL
46 INTERNATIONAL MONETARY FUND
public debt held by nonresident.1 Moreover, in the case of Portugal, since bank vulnerabilities are
below the relevant thresholds identified by the MAC DSA template, the standardized contingent
liabilities shock does not apply. Nevertheless, this is replaced by a customized shock given the risks
posed by the materialization of contingent liabilities from SOEs and PPPs (please refer to the stress
test customized scenario).
III. Realism of Baseline Assumptions and Alternative Scenarios
3. Realizing the potential growth rate assumed in the current projection has important
implications for the debt adjustment path. Portugal’s growth forecast track record shows a
relatively large median error compared with other countries with Fund-supported programs,
especially during the pre-crisis period (Figure 2). The achievement of a growth rate of 1.2 percent
over the medium term, as per staff’s updated projection, is consistent with moderate growth
convergence. If growth were to turn out lower than currently projected—for instance as a result of
reversal of structural reforms—the rate of debt decline would significantly slow down, as also shown
in Figures 4 and 5. Similarly, risks from a protracted period of negative inflation in Portugal could
further impede the repair of already-weak private and public balance sheets, as highlighted by the
customized deflation scenario in Figure 5.
4. Given Portugal’s sizable debt burden and financing needs, the primary balance is
expected to exceed its debt-stabilizing threshold over the projection period. Under staff’s
baseline scenario,2 the fiscal primary balance is expected to stabilize at around 1.5 percent of GDP
over the medium term. Nevertheless, Portugal’s debt profile remains highly vulnerable to a primary
balance shock (Figures 4 and 5), as also highlighted by the asymmetric fan chart analysis in Figure 1,
which shows the risks to the debt outlook if only negative shocks to the primary balance were to
materialize. The authorities’ medium-term fiscal strategy under the Stability Program for 2016–20
envisages a reduction in public debt to 110.3 percent of GDP by 2020. However, this projection is
based on a very ambitious timetable for fiscal adjustment and incorporates optimistic assumptions
on both receipts from the sale of financial sector assets and medium-term growth. The Stability
Program assumes annual real GDP growth of 2.0 percent in 2017–20, as opposed to staff’s baseline
projection of average annual growth of 1.2 percent over the same period.
1 The total (public and private) external financing requirements exceed significantly the relevant benchmark under the baseline. However, in the case of Portugal, the figure includes, among others, non-residents bank deposits, accounting for about 45 percent of GDP. 2 In line with the WEO guidelines, medium-term assumptions that are not backed up by well-defined fiscal measures are not incorporated by the team under the baseline scenario.
PORTUGAL
INTERNATIONAL MONETARY FUND 47
IV. Stress Test
5. The baseline remains highly sensitive to macro-fiscal and contingent liabilities shocks
(Figure 5):
Under a growth shock that lowers output by nearly 4.5 percentage points in 2016–17 (and in turn
inflation by a cumulative 1 percentage point), debt would peak at about 139 percent of GDP
in 2018, 11 percentage points higher than under the 2016 baseline. However, debt dynamics
would be severely compromised under a deflation scenario where a sharper growth shock (that
lowers output by 5½ percentage points in 2016–17) is associated with deflationary pressures
(with inflation lower by cumulative 4 percentage points), in the context of a widening output gap
and high unemployment. Under this scenario, debt would rise to 148 percent of GDP by 2018
and remain close to this level over the medium-term.
A sustained interest rate shock of 200 basis points throughout the projection period is not
expected to have a large immediate effect, but it would slow down the rate of debt decline in
the medium term, so that by 2020 the debt-to-GDP ratio is about 3 points higher compared
with the baseline.
Further materialization of contingent liabilities would also have implications for Portugal’s debt
dynamics. While the recent debt management operation for SOEs has significantly addressed
fiscal risks from the transport and infrastructure sectors, staff’s assessment suggests that, under
a severe scenario, further contingent liabilities could potentially materialize of about 10 percent
of GDP, due to financial sector risks, SOEs, PPPs, and State guarantees.3 A contingent liabilities
shock of this magnitude would push the 2017 debt ratio to 138 percent of GDP.
A severe combined shock that incorporates the macro-fiscal and contingent liabilities adverse
scenarios mentioned above would significantly affect the country’s debt dynamics, with debt
rising to 147 percent of GDP in 2018 and then remaining at this level over the medium term.
6. The authorities took note of the risks highlighted by staff, but also stressed the
divergence of their medium-term outlook from staff’s baseline scenario. The authorities were
optimistic that reforms in recent years have laid the foundation for stronger export-oriented growth,
3 Staff’s assumptions for the adverse contingent liabilities scenario include (i) the hypothetical cost of further financial sector operations; (ii) staff’s estimate of potential contingent liabilities from PPPs based on financial rebalancing requests by concessionaires; (iii) the hypothetical settlement of the outstanding stock of arrears; (iv) staff’s estimate of potential contingent liabilities from other non-bank debt directly guaranteed by the State and/or classified outside the general government perimeter.

PORTUGAL
48 INTERNATIONAL MONETARY FUND
which would underpin a larger improvement in medium-term debt dynamics than projected by staff.
In addition, they remained confident that the 2016 fiscal deficit target will be achieved, resulting in a
larger reduction of the debt-to-GDP ratio by the end of the year, and putting debt dynamics on a
trajectory to improve at a faster pace than envisaged under staff’s baseline scenario. Over the
medium-term, the authorities reiterated their commitment to medium-term fiscal consolidation as
outlined in their 2016 Stability Program. In the near-term, they were optimistic that Portugal’s record
of fiscal adjustment and reform implementation under the adjustment program had strengthened
their credibility with investors, and would enable them to avoid any prolonged deterioration in
market access.
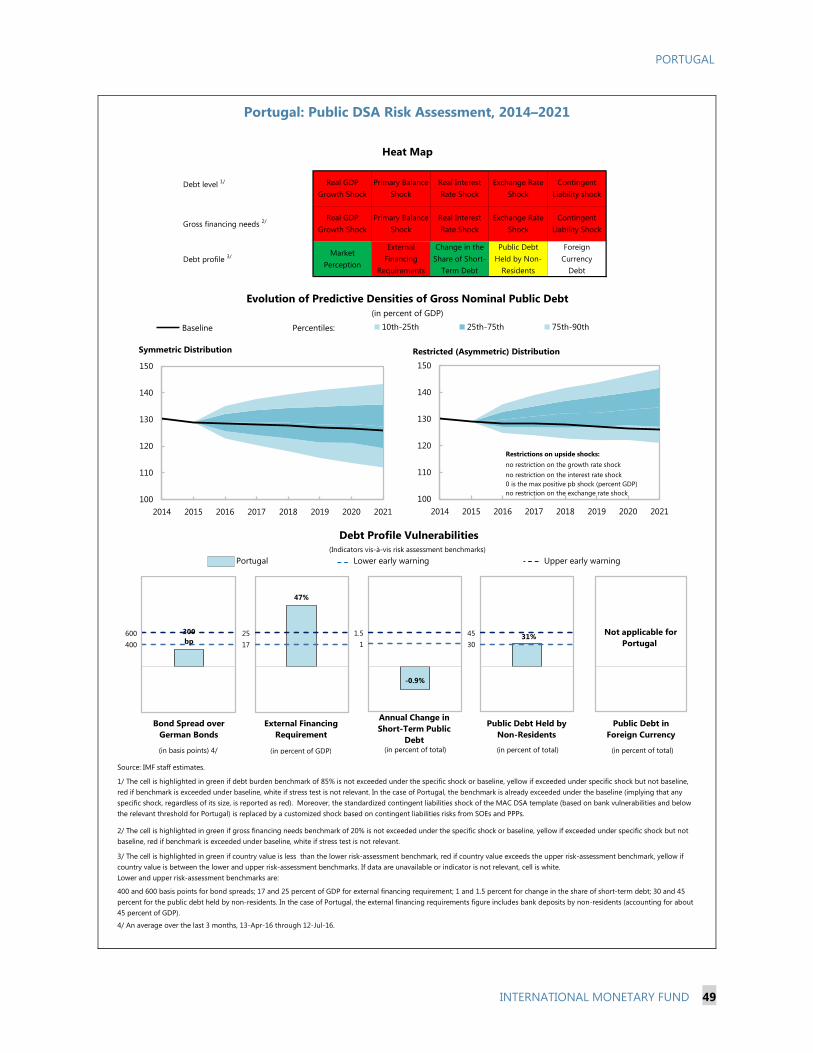
PORTUGAL
INTERNATIONAL MONETARY FUND 49
Portugal: Public DSA Risk Assessment, 2014–2021
Portugal
Source: IMF staff estimates.
Primary Balance Shock
Debt Profile Vulnerabilities
3/ The cell is highlighted in green if country value is less than the lower risk-assessment benchmark, red if country value exceeds the upper risk-assessment benchmark, yellow if country value is between the lower and upper risk-assessment benchmarks. If data are unavailable or indicator is not relevant, cell is white. Lower and upper risk-assessment benchmarks are:
Change in the Share of Short-
Term Debt
Exchange Rate Shock
Contingent Liability shock
Debt level 1/
400 and 600 basis points for bond spreads; 17 and 25 percent of GDP for external financing requirement; 1 and 1.5 percent for change in the share of short-term debt; 30 and 45 percent for the public debt held by non-residents. In the case of Portugal, the external financing requirements figure includes bank deposits by non-residents (accounting for about 45 percent of GDP).
Foreign Currency
Debt
Public Debt Held by Non-
Residents
(Indicators vis-à-vis risk assessment benchmarks)
Market Perception
Gross financing needs 2/ Primary Balance Shock
Real Interest Rate Shock
Exchange Rate Shock
Contingent Liability Shock
4/ An average over the last 3 months, 13-Apr-16 through 12-Jul-16.
Real GDP Growth Shock
2/ The cell is highlighted in green if gross financing needs benchmark of 20% is not exceeded under the specific shock or baseline, yellow if exceeded under specific shock but not baseline, red if benchmark is exceeded under baseline, white if stress test is not relevant.
1/ The cell is highlighted in green if debt burden benchmark of 85% is not exceeded under the specific shock or baseline, yellow if exceeded under specific shock but not baseline, red if benchmark is exceeded under baseline, white if stress test is not relevant. In the case of Portugal, the benchmark is already exceeded under the baseline (implying that any specific shock, regardless of its size, is reported as red). Moreover, the standardized contingent liabilities shock of the MAC DSA template (based on bank vulnerabilities and below the relevant threshold for Portugal) is replaced by a customized shock based on contingent liabilities risks from SOEs and PPPs.
Real Interest Rate Shock
External Financing
Requirements
Real GDP Growth Shock
Heat Map
Upper early warning
Evolution of Predictive Densities of Gross Nominal Public Debt(in percent of GDP)
Debt profile 3/
Lower early warning
1 2
Not applicable for Portugal400
600 300 bp
1 2
1725
47%
1 2
11.5
-0.9%1 2
Bond Spread over German Bonds
External Financing Requirement
Annual Change in Short-Term Public
Debt
Public Debt in Foreign Currency
(in basis points) 4/ (in percent of GDP) (in percent of total) (in percent of total)
100
110
120
130
140
150
2014 2015 2016 2017 2018 2019 2020 2021
10th-25th 25th-75th 75th-90thPercentiles:Baseline
Symmetric Distribution
100
110
120
130
140
150
2014 2015 2016 2017 2018 2019 2020 2021
Restricted (Asymmetric) Distribution
no restriction on the growth rate shockno restriction on the interest rate shock0 is the max positive pb shock (percent GDP)no restriction on the exchange rate shock
Restrictions on upside shocks:
3045 31%
1 2
Public Debt Held by Non-Residents
(in percent of total)
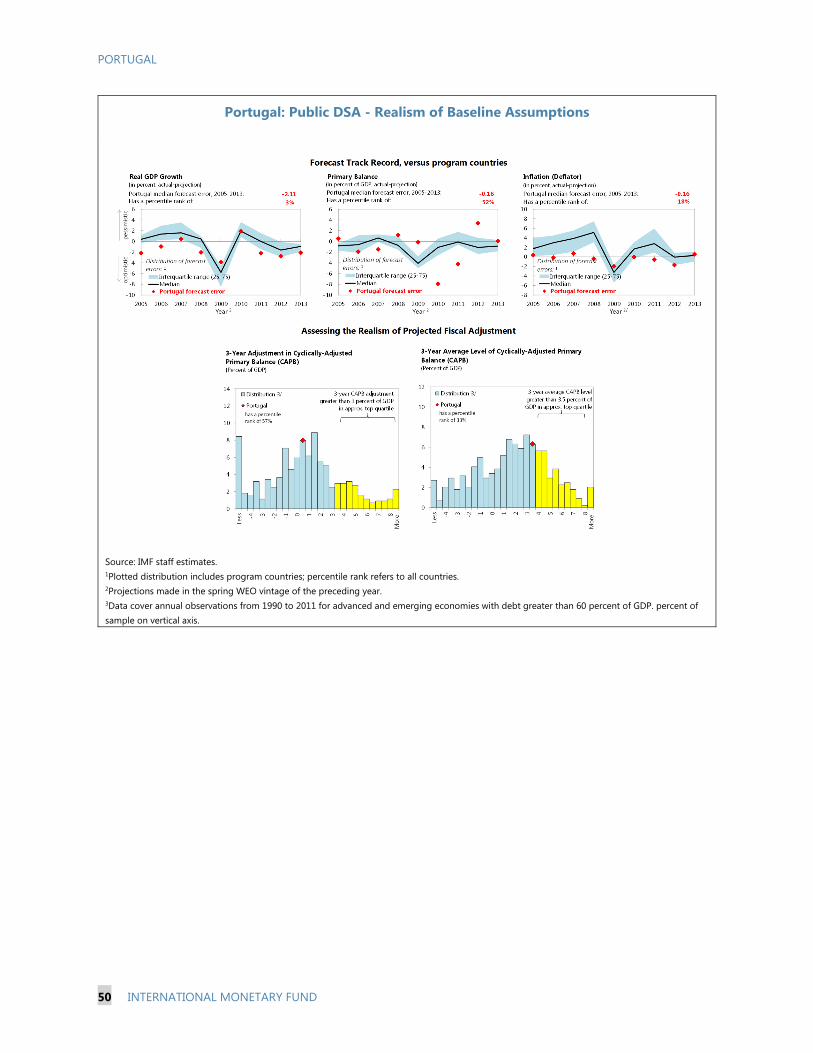
PORTUGAL
50 INTERNATIONAL MONETARY FUND
Portugal: Public DSA - Realism of Baseline Assumptions
Source: IMF staff estimates. 1Plotted distribution includes program countries; percentile rank refers to all countries. 2Projections made in the spring WEO vintage of the preceding year. 3Data cover annual observations from 1990 to 2011 for advanced and emerging economies with debt greater than 60 percent of GDP. percent of sample on vertical axis.
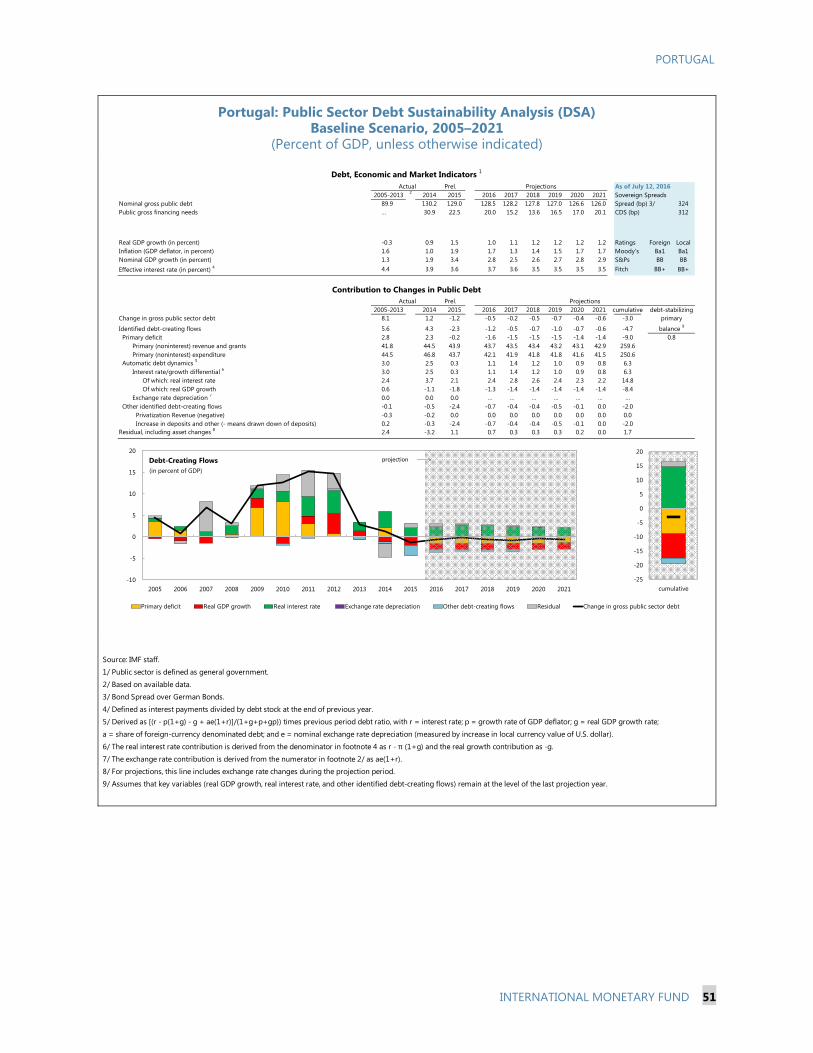
PORTUGAL
INTERNATIONAL MONETARY FUND 51
Portugal: Public Sector Debt Sustainability Analysis (DSA) Baseline Scenario, 2005–2021
(Percent of GDP, unless otherwise indicated)
Source: IMF staff.
1/ Public sector is defined as general government.
2/ Based on available data.3/ Bond Spread over German Bonds.
4/ Defined as interest payments divided by debt stock at the end of previous year.
5/ Derived as [(r - p(1+g) - g + ae(1+r)]/(1+g+p+gp)) times previous period debt ratio, with r = interest rate; p = growth rate of GDP deflator; g = real GDP growth rate;
a = share of foreign-currency denominated debt; and e = nominal exchange rate depreciation (measured by increase in local currency value of U.S. dollar).
6/ The real interest rate contribution is derived from the denominator in footnote 4 as r - π (1+g) and the real growth contribution as -g.
7/ The exchange rate contribution is derived from the numerator in footnote 2/ as ae(1+r). 8/ For projections, this line includes exchange rate changes during the projection period.
9/ Assumes that key variables (real GDP growth, real interest rate, and other identified debt-creating flows) remain at the level of the last projection year.
Prel. As of July 12, 20162 2014 2015 2016 2017 2018 2019 2020 2021 Sovereign Spreads
Nominal gross public debt 89.9 130.2 129.0 128.5 128.2 127.8 127.0 126.6 126.0 Spread (bp) 3/ 324Public gross financing needs … 30.9 22.5 20.0 15.2 13.6 16.5 17.0 20.1 CDS (bp) 312
Real GDP growth (in percent) -0.3 0.9 1.5 1.0 1.1 1.2 1.2 1.2 1.2 Ratings Foreign LocalInflation (GDP deflator, in percent) 1.6 1.0 1.9 1.7 1.3 1.4 1.5 1.7 1.7 Moody's Ba1 Ba1Nominal GDP growth (in percent) 1.3 1.9 3.4 2.8 2.5 2.6 2.7 2.8 2.9 S&Ps BB BBEffective interest rate (in percent) 4 4.4 3.9 3.6 3.7 3.6 3.5 3.5 3.5 3.5 Fitch BB+ BB+
Prel.2014 2015 2016 2017 2018 2019 2020 2021 cumulative
Change in gross public sector debt 8.1 1.2 -1.2 -0.5 -0.2 -0.5 -0.7 -0.4 -0.6 -3.0
Identified debt-creating flows 5.6 4.3 -2.3 -1.2 -0.5 -0.7 -1.0 -0.7 -0.6 -4.7Primary deficit 2.8 2.3 -0.2 -1.6 -1.5 -1.5 -1.5 -1.4 -1.4 -9.0
Primary (noninterest) revenue and grants 41.8 44.5 43.9 43.7 43.5 43.4 43.2 43.1 42.9 259.6Primary (noninterest) expenditure 44.5 46.8 43.7 42.1 41.9 41.8 41.8 41.6 41.5 250.6
Automatic debt dynamics 5 3.0 2.5 0.3 1.1 1.4 1.2 1.0 0.9 0.8 6.3Interest rate/growth differential 6 3.0 2.5 0.3 1.1 1.4 1.2 1.0 0.9 0.8 6.3
Of which: real interest rate 2.4 3.7 2.1 2.4 2.8 2.6 2.4 2.3 2.2 14.8Of which: real GDP growth 0.6 -1.1 -1.8 -1.3 -1.4 -1.4 -1.4 -1.4 -1.4 -8.4
Exchange rate depreciation 7 0.0 0.0 0.0 … … … … … … …Other identified debt-creating flows -0.1 -0.5 -2.4 -0.7 -0.4 -0.4 -0.5 -0.1 0.0 -2.0
Privatization Revenue (negative) -0.3 -0.2 0.0 0.0 0.0 0.0 0.0 0.0 0.0 0.0Increase in deposits and other (- means drawn down of deposits) 0.2 -0.3 -2.4 -0.7 -0.4 -0.4 -0.5 -0.1 0.0 -2.0
Residual, including asset changes 8 2.4 -3.2 1.1 0.7 0.3 0.3 0.3 0.2 0.0 1.7
0.8balance 9primary
Debt, Economic and Market Indicators 1
2005-2013
Projections
Contribution to Changes in Public DebtProjections
2005-2013
debt-stabilizing
Actual
Actual
-25
-20
-15
-10
-5
0
5
10
15
20
cumulative-10
-5
0
5
10
15
20
2005 2006 2007 2008 2009 2010 2011 2012 2013 2014 2015 2016 2017 2018 2019 2020 2021
Debt-Creating Flows
Primary deficit Real GDP growth Real interest rate Exchange rate depreciation Other debt-creating flows Residual Change in gross public sector debt
projection
(in percent of GDP)
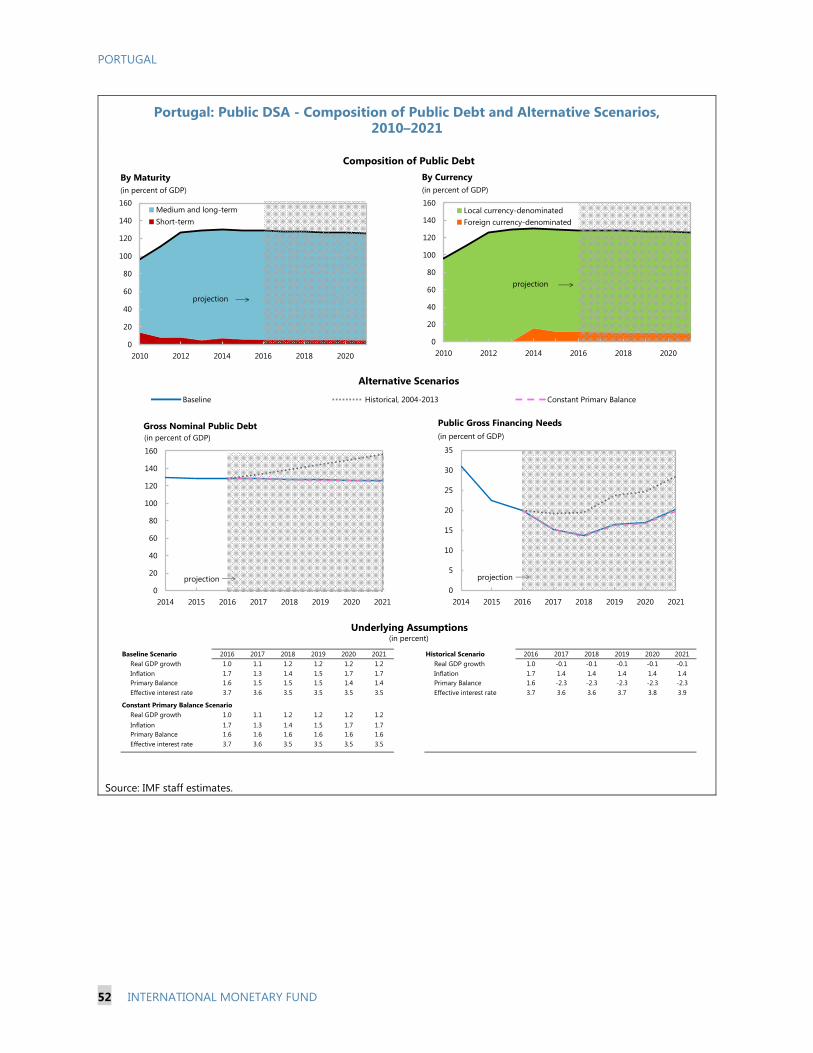
PORTUGAL
52 INTERNATIONAL MONETARY FUND
Portugal: Public DSA - Composition of Public Debt and Alternative Scenarios, 2010–2021
Source: IMF staff estimates.
Baseline Scenario 2016 2017 2018 2019 2020 2021 Historical Scenario 2016 2017 2018 2019 2020 2021Real GDP growth 1.0 1.1 1.2 1.2 1.2 1.2 Real GDP growth 1.0 -0.1 -0.1 -0.1 -0.1 -0.1Inflation 1.7 1.3 1.4 1.5 1.7 1.7 Inflation 1.7 1.4 1.4 1.4 1.4 1.4Primary Balance 1.6 1.5 1.5 1.5 1.4 1.4 Primary Balance 1.6 -2.3 -2.3 -2.3 -2.3 -2.3Effective interest rate 3.7 3.6 3.5 3.5 3.5 3.5 Effective interest rate 3.7 3.6 3.6 3.7 3.8 3.9
Constant Primary Balance ScenarioReal GDP growth 1.0 1.1 1.2 1.2 1.2 1.2Inflation 1.7 1.3 1.4 1.5 1.7 1.7Primary Balance 1.6 1.6 1.6 1.6 1.6 1.6Effective interest rate 3.7 3.6 3.5 3.5 3.5 3.5
Underlying Assumptions(in percent)
Alternative Scenarios
Composition of Public Debt
Baseline Historical, 2004-2013 Constant Primary Balance
0
20
40
60
80
100
120
140
160
2014 2015 2016 2017 2018 2019 2020 2021
Gross Nominal Public Debt(in percent of GDP)
projection0
5
10
15
20
25
30
35
2014 2015 2016 2017 2018 2019 2020 2021
Public Gross Financing Needs(in percent of GDP)
projection
0
20
40
60
80
100
120
140
160
2010 2012 2014 2016 2018 2020
By Maturity
Medium and long-termShort-term
projection
(in percent of GDP)
0
20
40
60
80
100
120
140
160
2010 2012 2014 2016 2018 2020
By Currency
Local currency-denominatedForeign currency-denominated
projection
(in percent of GDP)
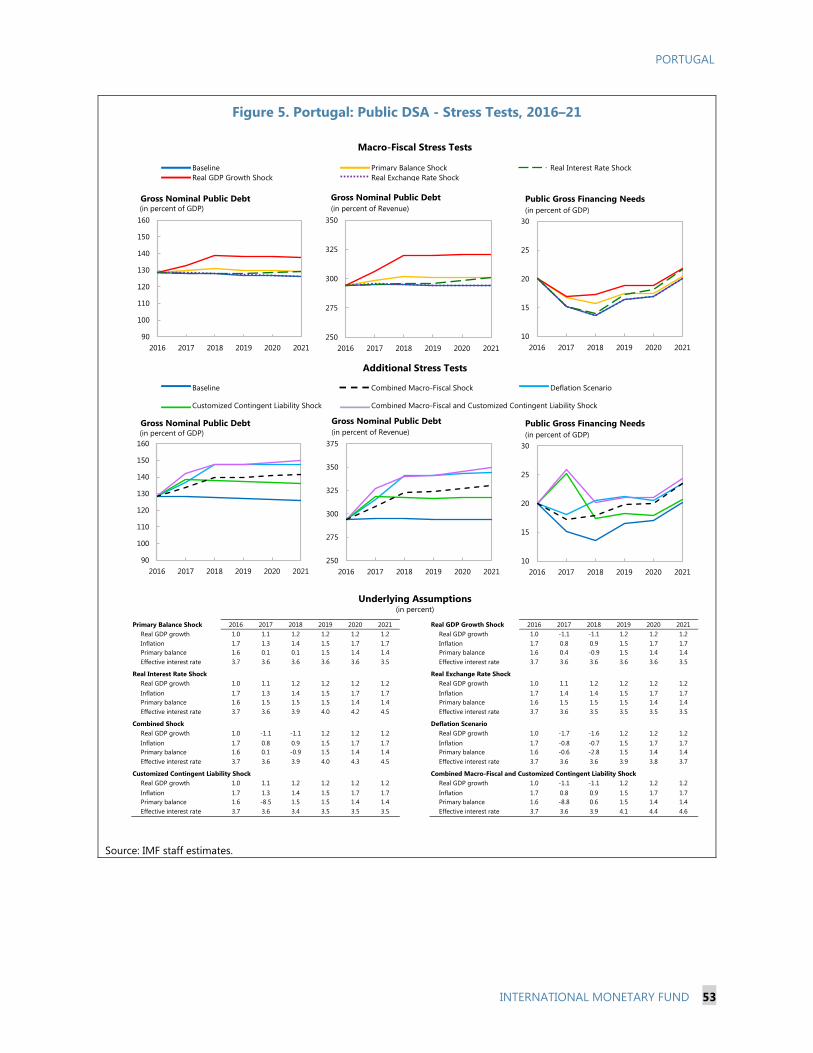
PORTUGAL
INTERNATIONAL MONETARY FUND 53
Figure 5. Portugal: Public DSA - Stress Tests, 2016–21
Source: IMF staff estimates.
Primary Balance Shock 2016 2017 2018 2019 2020 2021 Real GDP Growth Shock 2016 2017 2018 2019 2020 2021Real GDP growth 1.0 1.1 1.2 1.2 1.2 1.2 Real GDP growth 1.0 -1.1 -1.1 1.2 1.2 1.2Inflation 1.7 1.3 1.4 1.5 1.7 1.7 Inflation 1.7 0.8 0.9 1.5 1.7 1.7Primary balance 1.6 0.1 0.1 1.5 1.4 1.4 Primary balance 1.6 0.4 -0.9 1.5 1.4 1.4Effective interest rate 3.7 3.6 3.6 3.6 3.6 3.5 Effective interest rate 3.7 3.6 3.6 3.6 3.6 3.5
Real Interest Rate Shock Real Exchange Rate ShockReal GDP growth 1.0 1.1 1.2 1.2 1.2 1.2 Real GDP growth 1.0 1.1 1.2 1.2 1.2 1.2Inflation 1.7 1.3 1.4 1.5 1.7 1.7 Inflation 1.7 1.4 1.4 1.5 1.7 1.7Primary balance 1.6 1.5 1.5 1.5 1.4 1.4 Primary balance 1.6 1.5 1.5 1.5 1.4 1.4Effective interest rate 3.7 3.6 3.9 4.0 4.2 4.5 Effective interest rate 3.7 3.6 3.5 3.5 3.5 3.5
Combined Shock Deflation ScenarioReal GDP growth 1.0 -1.1 -1.1 1.2 1.2 1.2 Real GDP growth 1.0 -1.7 -1.6 1.2 1.2 1.2Inflation 1.7 0.8 0.9 1.5 1.7 1.7 Inflation 1.7 -0.8 -0.7 1.5 1.7 1.7Primary balance 1.6 0.1 -0.9 1.5 1.4 1.4 Primary balance 1.6 -0.6 -2.8 1.5 1.4 1.4Effective interest rate 3.7 3.6 3.9 4.0 4.3 4.5 Effective interest rate 3.7 3.6 3.6 3.9 3.8 3.7
Customized Contingent Liability Shock Combined Macro-Fiscal and Customized Contingent Liability ShockReal GDP growth 1.0 1.1 1.2 1.2 1.2 1.2 Real GDP growth 1.0 -1.1 -1.1 1.2 1.2 1.2Inflation 1.7 1.3 1.4 1.5 1.7 1.7 Inflation 1.7 0.8 0.9 1.5 1.7 1.7Primary balance 1.6 -8.5 1.5 1.5 1.4 1.4 Primary balance 1.6 -8.8 0.6 1.5 1.4 1.4Effective interest rate 3.7 3.6 3.4 3.5 3.5 3.5 Effective interest rate 3.7 3.6 3.9 4.1 4.4 4.6
Macro-Fiscal Stress Tests
Baseline Primary Balance ShockReal GDP Growth Shock
Real Interest Rate Shock
(in percent)
Real Exchange Rate Shock
Additional Stress Tests
Baseline
Underlying Assumptions
Deflation Scenario
Customized Contingent Liability Shock
Combined Macro-Fiscal Shock
Combined Macro-Fiscal and Customized Contingent Liability Shock
90
100
110
120
130
140
150
160
2016 2017 2018 2019 2020 2021
Gross Nominal Public Debt(in percent of GDP)
250
275
300
325
350
2016 2017 2018 2019 2020 2021
Gross Nominal Public Debt(in percent of Revenue)
10
15
20
25
30
2016 2017 2018 2019 2020 2021
Public Gross Financing Needs(in percent of GDP)
90
100
110
120
130
140
150
160
2016 2017 2018 2019 2020 2021
Gross Nominal Public Debt(in percent of GDP)
250
275
300
325
350
375
2016 2017 2018 2019 2020 2021
Gross Nominal Public Debt(in percent of Revenue)
10
15
20
25
30
2016 2017 2018 2019 2020 2021
Public Gross Financing Needs(in percent of GDP)

PORTUAL
INTERNATIONAL MONETARY FUND 54
Annex V. No Extension Without Representation? New Evidence on the Role of Extending Collective Bargaining
Agreements in Portugal1
In Portugal, administrative extensions of collective agreements had a negative impact on employment growth in 2010-2011. Moreover, these effects tend to be concentrated among those firms that are not directly involved in the bargaining process. The lack of representativeness of employer associations is a potentially important factor behind the adverse effect of extensions. Another is the role of retro-activity (backdating) in combination with the administrative time lags in processing extensions.
In many countries, including Portugal, collective bargaining coverage is supported by administrative extensions that widen the reach of collective agreements beyond their signatory parties to all firms and workers in the same sector. Because of their potential role in reinforcing downward wage rigidity and exacerbating the negative impact of recessions on employment, extensions have become the focus of an increasingly intense policy debate in recent years. A new study2 of collective bargaining in Portugal provides the following insights into this subject:
First, extensions tended to reduce employment growth and, therefore, were likely to have amplified the unemployment response to the sovereign debt crisis. The effect was large, with employment growth at the firms that were subject to the subsequently-extended agreements lower by about 5 percentage points compared with that at the firms that were subject to the agreements that were not extended (Figure 1).
Second, the adverse impact of extensions on employment growth tends to be concentrated among the firms that are not affiliated with an employer association, i.e. those that are not directly involved in the bargaining process. The concentration of adverse employment effects among the non-affiliated firms suggests that extensions suit the interests of affiliated firms rather than those of non-affiliated firms. In other words, the lack of representativeness of employer associations is a potentially important factor behind the adverse effects of extensions.
Third, the degree of representativeness of employer associations does not appear to matter significantly for the impact of extensions on employment growth. This may reflect the difficulty of identifying the role of representativeness in a context when it is very low. Alternatively, it may reflect
1 Prepared by Alexander Hijzen (OECD). 2 Hijzen, A. and P. Martins (2016), “No Extension without Representation? Evidence from a Natural Experiment in Collective Bargaining”, IMF Working Paper 16/143. This paper uses a regression discontinuity design that exploits the sharp and unanticipated decline in the extension probability for the collective agreements signed in the months just after March 1, 2011. That decline resulted from the immediate suspension of extensions by the government that took office several months later, on June 21, 2011, in combination with the time needed for processing the extension applications.
PORTUGAL
INTERNATIONAL MONETARY FUND 55
the possibility that representativeness criteria (such as those implemented in Portugal in 2012, based on affiliated firms representing at least 50 percent of the workforce of the sector) do not ensure that agreements are in the public interest. This suggests that representativeness criteria may need to be fine-tuned further or be complemented with a meaningful test of public interest. However, the introduction of the strict representativeness criteria in 2012 is likely to have had a major impact on wage adjustment and therefore employment by greatly reducing the number of extensions issued. Representativeness criteria also may help to promote employer organization, particularly if introduced gradually, and thereby contribute to the quality of industrial relations as well as the degree of trust between the social partners.
Fourth, the retro-activity in combination with the often substantial administrative time lags associated with extension decisions implied that non-affiliated firms had to back pay wage increases over the period from the time that the original agreement was signed until the time that a decision on its extension was made. This significantly increased the adverse impact of extensions on employment growth. This may suggest that the present results are to some extent specific to the weak economic conditions during the period of analysis. If there is no uncertainty about the extension of agreements and firms are not liquidity-constrained, then retro-activity should not be expected to slow down employment growth. It also suggests that the 2012 labor market reform may have helped to reduce the adverse effect of extensions by removing their retro-activity. Concerns that this undermines the spirit of sectoral bargaining and extensions can partly be addressed by shortening the administrative delay associated with issuing extensions.
To conclude, the positive effects of extensions in terms of higher wages for low-wage workers and greater wage compression should be weighed against their adverse effects on employment growth.
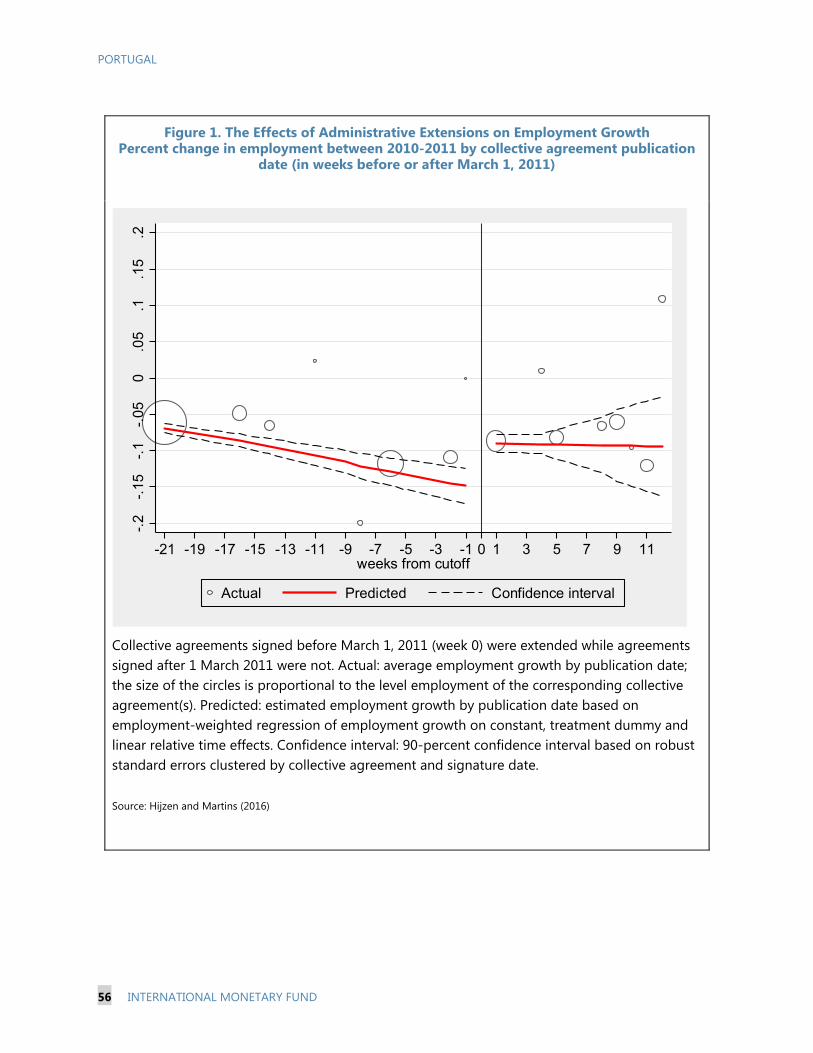
PORTUGAL
56 INTERNATIONAL MONETARY FUND
Figure 1. The Effects of Administrative Extensions on Employment Growth Percent change in employment between 2010-2011 by collective agreement publication
date (in weeks before or after March 1, 2011)
Collective agreements signed before March 1, 2011 (week 0) were extended while agreements signed after 1 March 2011 were not. Actual: average employment growth by publication date; the size of the circles is proportional to the level employment of the corresponding collective agreement(s). Predicted: estimated employment growth by publication date based on employment-weighted regression of employment growth on constant, treatment dummy and linear relative time effects. Confidence interval: 90-percent confidence interval based on robust standard errors clustered by collective agreement and signature date.
Source: Hijzen and Martins (2016)
-.2
-.15
-.1
-.05
0.0
5.1
.15
.2
-21 -19 -17 -15 -13 -11 -9 -7 -5 -3 -1 1 3 5 7 9 110weeks from cutoff
Actual Predicted Confidence interval
PORTUGAL
STAFF REPORT FOR THE 2016 ARTICLE IV
CONSULTATION AND FOURTH POST-PROGRAM
MONITORING DISCUSSIONS—INFORMATIONAL
ANNEX
Prepared By
European Department
(In Consultation with Other Departments)
FUND RELATIONS ____________________________________________________________________ 2
STATISTICAL ISSUES _________________________________________________________________ 4
CONTENTS
August 5, 2016
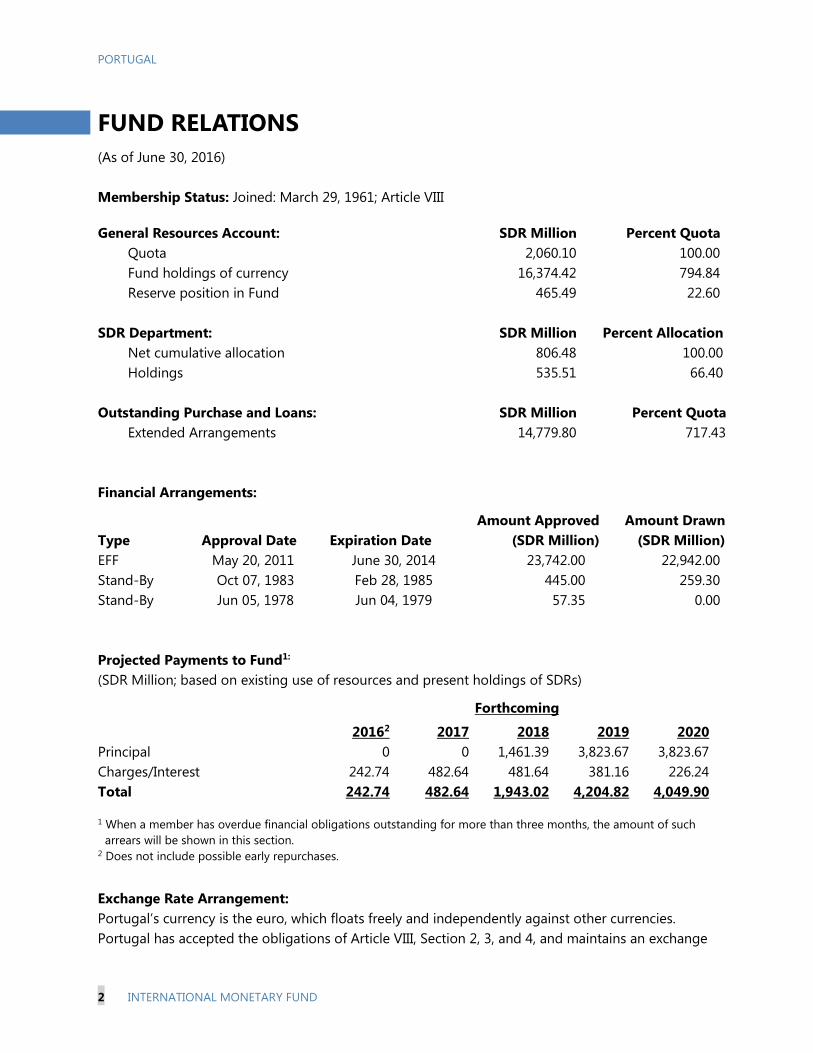
PORTUGAL
2 INTERNATIONAL MONETARY FUND
FUND RELATIONS
(As of June 30, 2016)
Membership Status: Joined: March 29, 1961; Article VIII
General Resources Account: SDR Million Percent Quota
Quota 2,060.10 100.00
Fund holdings of currency 16,374.42 794.84
Reserve position in Fund 465.49 22.60
SDR Department: SDR Million Percent Allocation
Net cumulative allocation 806.48 100.00
Holdings 535.51 66.40
Outstanding Purchase and Loans: SDR Million Percent Quota
Extended Arrangements 14,779.80 717.43
Financial Arrangements:
Type Approval Date Expiration Date
Amount Approved
(SDR Million)
Amount Drawn
(SDR Million)
EFF May 20, 2011 June 30, 2014 23,742.00 22,942.00
Stand-By Oct 07, 1983 Feb 28, 1985 445.00 259.30
Stand-By Jun 05, 1978 Jun 04, 1979 57.35 0.00
Projected Payments to Fund1:
(SDR Million; based on existing use of resources and present holdings of SDRs)
Forthcoming
20162 2017 2018 2019 2020
Principal 0 0 1,461.39 3,823.67 3,823.67
Charges/Interest 242.74 482.64 481.64 381.16 226.24
Total 242.74 482.64 1,943.02 4,204.82 4,049.90
1 When a member has overdue financial obligations outstanding for more than three months, the amount of such
arrears will be shown in this section. 2 Does not include possible early repurchases.
Exchange Rate Arrangement:
Portugal’s currency is the euro, which floats freely and independently against other currencies.
Portugal has accepted the obligations of Article VIII, Section 2, 3, and 4, and maintains an exchange
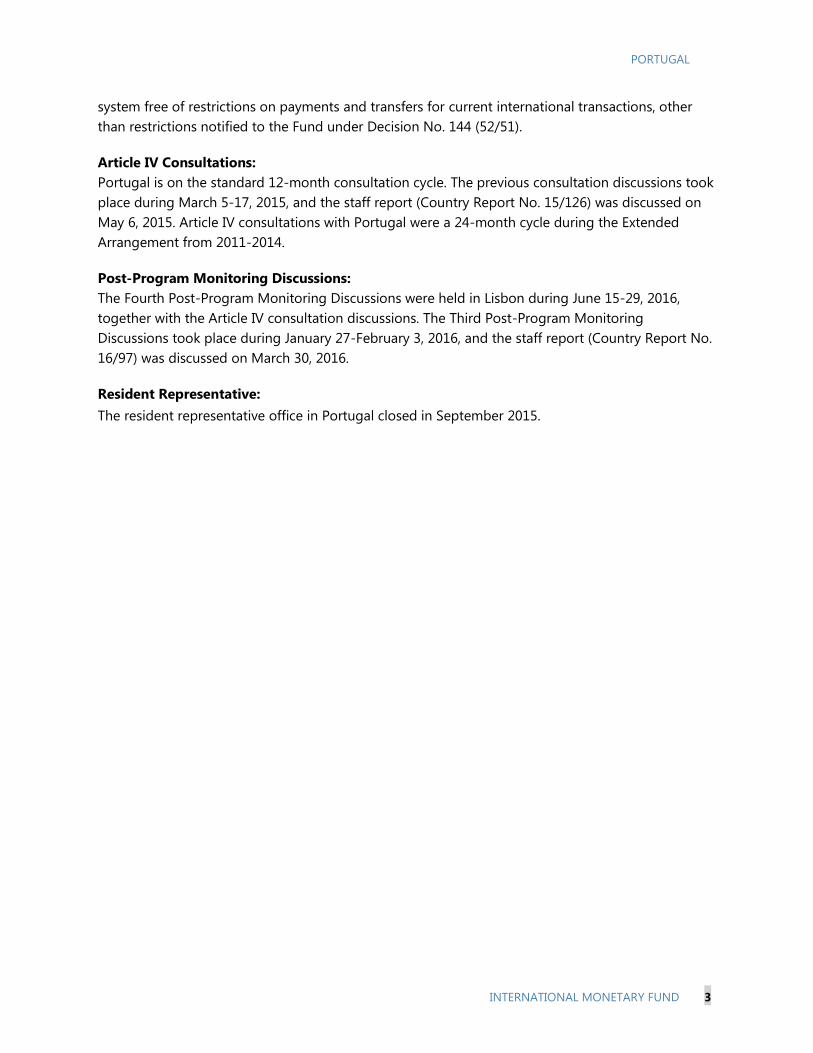
PORTUGAL
INTERNATIONAL MONETARY FUND 3
system free of restrictions on payments and transfers for current international transactions, other
than restrictions notified to the Fund under Decision No. 144 (52/51).
Article IV Consultations:
Portugal is on the standard 12-month consultation cycle. The previous consultation discussions took
place during March 5-17, 2015, and the staff report (Country Report No. 15/126) was discussed on
May 6, 2015. Article IV consultations with Portugal were a 24-month cycle during the Extended
Arrangement from 2011-2014.
Post-Program Monitoring Discussions:
The Fourth Post-Program Monitoring Discussions were held in Lisbon during June 15-29, 2016,
together with the Article IV consultation discussions. The Third Post-Program Monitoring
Discussions took place during January 27-February 3, 2016, and the staff report (Country Report No.
16/97) was discussed on March 30, 2016.
Resident Representative:
The resident representative office in Portugal closed in September 2015.
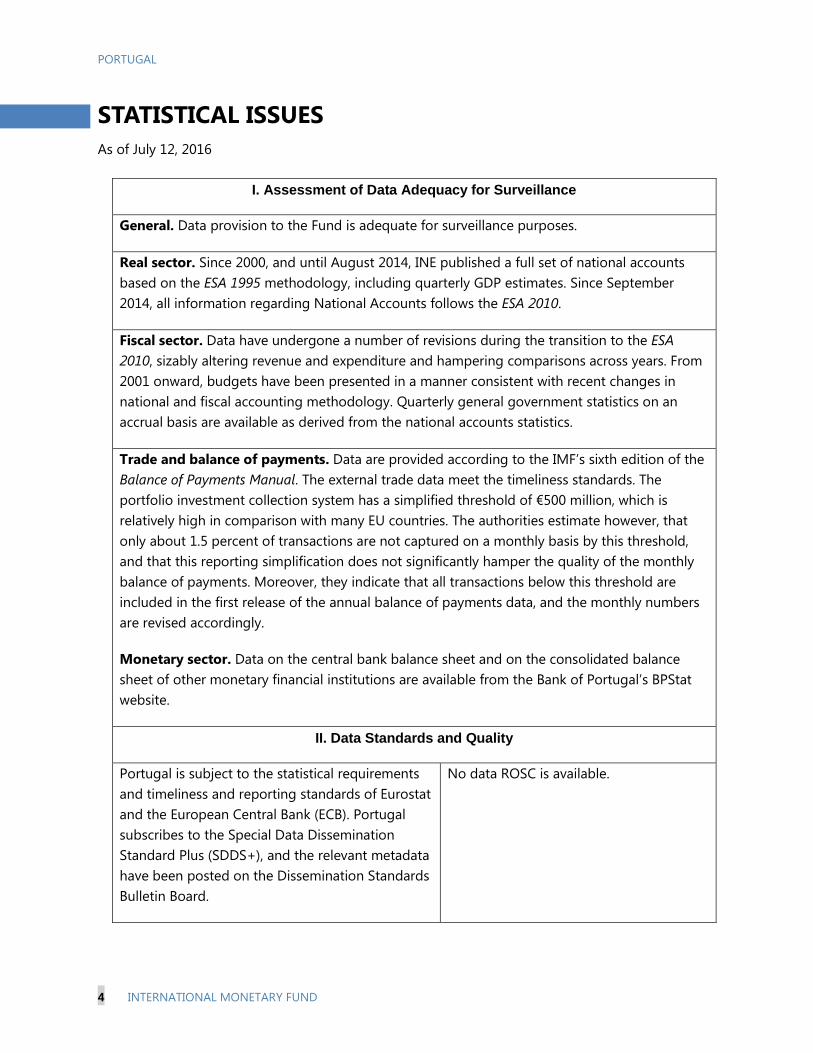
PORTUGAL
4 INTERNATIONAL MONETARY FUND
STATISTICAL ISSUES
As of July 12, 2016
I. Assessment of Data Adequacy for Surveillance
General. Data provision to the Fund is adequate for surveillance purposes.
Real sector. Since 2000, and until August 2014, INE published a full set of national accounts
based on the ESA 1995 methodology, including quarterly GDP estimates. Since September
2014, all information regarding National Accounts follows the ESA 2010.
Fiscal sector. Data have undergone a number of revisions during the transition to the ESA
2010, sizably altering revenue and expenditure and hampering comparisons across years. From
2001 onward, budgets have been presented in a manner consistent with recent changes in
national and fiscal accounting methodology. Quarterly general government statistics on an
accrual basis are available as derived from the national accounts statistics.
Trade and balance of payments. Data are provided according to the IMF’s sixth edition of the
Balance of Payments Manual. The external trade data meet the timeliness standards. The
portfolio investment collection system has a simplified threshold of €500 million, which is
relatively high in comparison with many EU countries. The authorities estimate however, that
only about 1.5 percent of transactions are not captured on a monthly basis by this threshold,
and that this reporting simplification does not significantly hamper the quality of the monthly
balance of payments. Moreover, they indicate that all transactions below this threshold are
included in the first release of the annual balance of payments data, and the monthly numbers
are revised accordingly.
Monetary sector. Data on the central bank balance sheet and on the consolidated balance
sheet of other monetary financial institutions are available from the Bank of Portugal’s BPStat
website.
II. Data Standards and Quality
Portugal is subject to the statistical requirements
and timeliness and reporting standards of Eurostat
and the European Central Bank (ECB). Portugal
subscribes to the Special Data Dissemination
Standard Plus (SDDS+), and the relevant metadata
have been posted on the Dissemination Standards
Bulletin Board.
No data ROSC is available.

PORTUGAL
INTERNATIONAL MONETARY FUND 5
Portugal: Table of Common Indicators Required for Surveillance
(As of July 12, 2016)
Date of
Latest
Observation
Date
Received
Frequency
of Data6
Frequency
of
Reporting6
Frequency
of
Publication6
Exchange Rates 07/12/16 07/12/16 D D D
International Reserve Assets and Reserve
Liabilities of the Monetary Authorities1
6/16 7/16 M M M
Reserve/Base Money 5/16 7/16 M M M
Broad Money 5/16 7/16 M M M
Central Bank Balance Sheet 6/16 7/16 M M M
Consolidated Balance Sheet of the Banking
System
5/16 7/16 M M M
Interest Rates2 5/16 7/16 M M M
Consumer Price Index 6/16 7/16 M M M
Revenue, Expenditure, Balance and Composition
of Financing3 – General Government4
3/16 6/16 M M M
Revenue, Expenditure, Balance and Composition
of Financing3– Central Government
3/16 6/16 M M M
Stocks of Central Government and Central
Government-Guaranteed Debt5
3/16 6/16 M M M
External Current Account Balance 4/16 6/16 M M M
Exports and Imports of Goods and Services 4/16 6/16 M M M
GDP/GNP 2016:Q1 6/16 Q Q Q
Gross External Debt 2016:Q1 5/16 Q Q Q
International Investment Position 2016:Q1 5/16 Q Q Q
1Any reserve assets that are pledged or otherwise encumbered should be specified separately. Also, data should comprise short-term
liabilities linked to a foreign currency but settled by other means as well as the notional values of financial derivatives to pay and to
receive foreign currency, including those linked to a foreign currency but settled by other means. 2 Both market-based and officially determined, including discount rates, money market rates, rates on treasury bills, notes and bonds. 3 Foreign, domestic bank, and domestic nonbank financing. 4 The general government consists of the central government (budgetary funds, extra budgetary funds, and social security funds) and state
and local governments. 5 Including currency and maturity composition. 6 Daily (D), weekly (W), monthly (M), quarterly (Q), annually (A), irregular (I); and not available (NA).
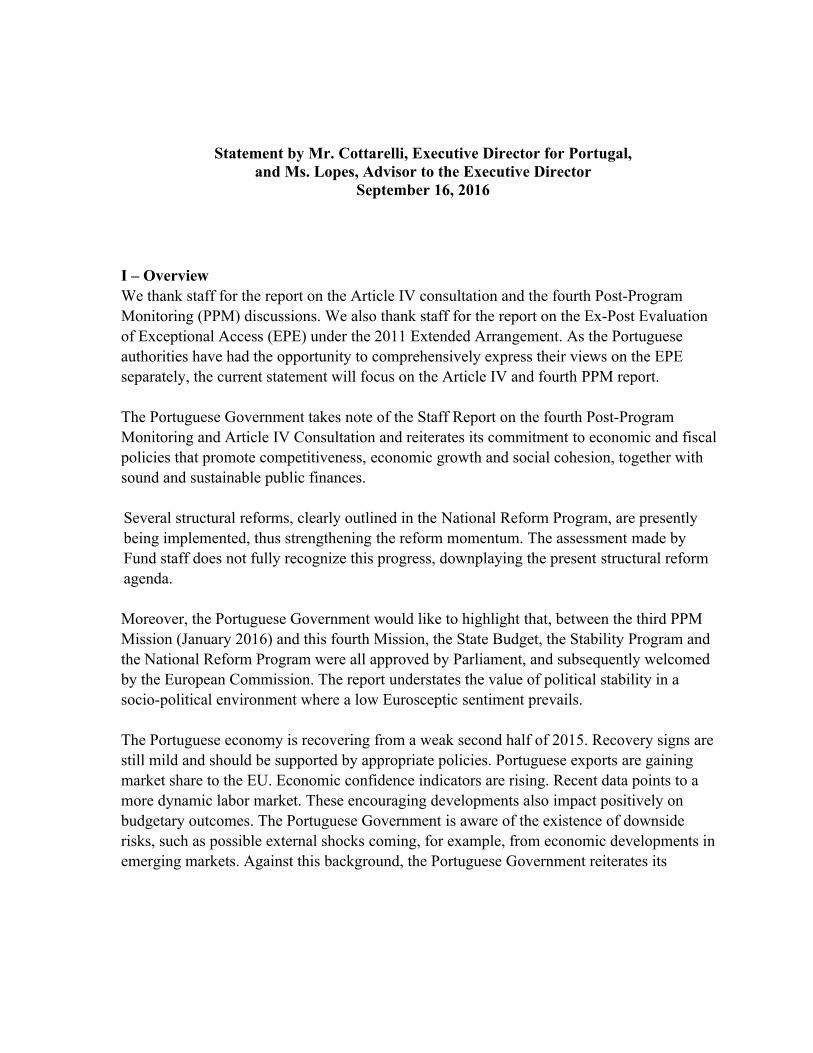
Statement by Mr. Cottarelli, Executive Director for Portugal,and Ms. Lopes, Advisor to the Executive Director
September 16, 2016
I – OverviewWe thank staff for the report on the Article IV consultation and the fourth Post-Program Monitoring (PPM) discussions. We also thank staff for the report on the Ex-Post Evaluation of Exceptional Access (EPE) under the 2011 Extended Arrangement. As the Portuguese authorities have had the opportunity to comprehensively express their views on the EPE separately, the current statement will focus on the Article IV and fourth PPM report.
The Portuguese Government takes note of the Staff Report on the fourth Post-Program Monitoring and Article IV Consultation and reiterates its commitment to economic and fiscal policies that promote competitiveness, economic growth and social cohesion, together with sound and sustainable public finances.
Several structural reforms, clearly outlined in the National Reform Program, are presently being implemented, thus strengthening the reform momentum. The assessment made by Fund staff does not fully recognize this progress, downplaying the present structural reform agenda.
Moreover, the Portuguese Government would like to highlight that, between the third PPM Mission (January 2016) and this fourth Mission, the State Budget, the Stability Program and the National Reform Program were all approved by Parliament, and subsequently welcomed by the European Commission. The report understates the value of political stability in a socio-political environment where a low Eurosceptic sentiment prevails.
The Portuguese economy is recovering from a weak second half of 2015. Recovery signs are still mild and should be supported by appropriate policies. Portuguese exports are gaining market share to the EU. Economic confidence indicators are rising. Recent data points to a more dynamic labor market. These encouraging developments also impact positively on budgetary outcomes. The Portuguese Government is aware of the existence of downside risks, such as possible external shocks coming, for example, from economic developments in emerging markets. Against this background, the Portuguese Government reiterates its

commitment to a rigorous implementation of the 2016 State Budget as agreed in the National Assembly and with the European partners. Additionally, the Portuguese Government continues to be engaged in working constructively with international institutions.
II – Economic ActivityIn 2015, economic activity in Portugal decelerated gradually, mostly due to a slowdown in investment and less favorable external demand from some of Portugal’s main trading partners (mainly Angola). These factors spilled-over into the first half of 2016, although with different magnitudes. Additionally, export performance was hindered by the temporary closure of an oil refinery unit and the phasing-out of a major carmaker’s old car model. The refinery is now fully operational and the production of a new car model will start in 2017.
Nonetheless, exports to EU markets – which represent over 70 percent of Portugal’s sales – rose by 3.6 percent in June y-o-y and by 0.8 in July y-o-y. Importantly, labor market data offer some positive indicators on the outlook for the rest of the year. The unemployment rate stood at 10.8 percent in the second quarter of 2016 (11.9 percent in the same quarter of 2015), and the number of employees grew by 2.2 percent since the beginning of the year, according to Social Security contributions’ data.
Private consumption grew at a rate close to the one envisaged in both the State Budget and the Stability Program. Moreover, the economic climate indicator started accelerating at the end of the first quarter, after a slowdown that started in the third quarter of 2015. Confidence indicators in services, retail and construction are on the rise. The balance of payments adjustment continues, with the trade balance surplus increasing by 242 million euro compared to the first six months of 2015.
The Stability Program and the National Reform Program, approved by the National Assembly and welcomed by the European Commission, laid down the Government’s multiyear budgetary strategy as well as its reform agenda. Both are important to build confidence and stability, benefiting investment decisions. These developments clearly bode well for economic predictability and political stability, making staff’s emphasis on instability uncalled for.
Additionally, the financial sector outlook has improved. Banif was resolved in December 2015 and CGD's recapitalization has been agreed with European institutions. Progress is also being made by other private financial institutions. The authorities are committed to preserve financial sector stability, which should also promote both an efficient transmission of monetary policy measures and the financing of productive activities.
Likewise, in 2015, the real effective exchange rate depreciated by 2.7 percent (-0.5 percent in 2014), which points to gains in price competitiveness. The persistent gains of market share
2

and terms of trade point also towards an enhanced non-price competitiveness of Portuguese exports.
III – Fiscal PolicyThe Portuguese Government reiterates its commitment to a rigorous implementation of the 2016 State Budget. Portugal will achieve a result compatible with European rules and, therefore, exit the Excessive Deficit Procedure this year.
Given a less favorable international financial environment, the 2016 State Budget introduced new expenditure cuts that are curbing expenditure commitments by 0.2 percent of GDP since March 31st.
In the first seven months of 2016, the general government budget deficit on a cash basis improved by 0.4 percentage point of annual GDP vis-à-vis the same period of 2015. Intermediate consumption is decreasing (-0.6 percent). The primary surplus stood at 316 million euro (901 million euro more than in 2015). This development is explained by a higher increase in revenue (2.8 percent) than in expenditure (1.3 percent): Net tax revenue increased by 1.9 percent. This performance is highly influenced by
an increase of 549 million euro in tax refunds decided in 2015. In gross terms, tax revenue is increasing steadily, notably thanks to increases from taxes on oil and energy products (44.9 percent), tobacco taxes (41.6 percent), and taxes on vehicles (14.4 percent). CIT payments in July increased by 2.1 percent relatively to 2015.
Social contributions rose by 4.3 percent, largely due to the 4.5 percent increase of Social Security contributions.
The Portuguese Government is committed to implement a spending review that goes beyond the one launched during the Adjustment Program, with the objective of producing long-term efficiency gains. The spending review is focused on the health and education sectors, major SOEs, public procurement and the management of state-owned real estate assets. In the following three years, the spending review will be expanded to other areas. The efficiency of revenue collection will also be addressed.
IV – Structural ReformsThe Portuguese Government remains committed to the full implementation of structural reforms, whose ambition, recognized by the European Commission, is reflected in the Portuguese National Reform Program. This program builds on reforms implemented in previous years and benefitted from their assessment by the European Commission, as presented in the recent Country Report. The National Reform Program is translated into concrete quantifiable measures and each of them has a chronogram of implementation. Some of the measures involve support from EU Structural Funds, the Junker Plan or the European Investment Bank.
3

Several structural reforms are currently being implemented. These are broadly framed in programs to foster the skills of the labor force, the recapitalization of firms and the modernization of Public Administration, making the latter closer to citizens and to business, thus reducing costs for both.
This translated into the launching of: i) Programa Qualifica to develop human capital, namely the qualification of the workforce through better formal education and lifelong learning, as well as improvements in managerial skills in internationalization; ii) Programa Capitalizar for firms, with more than 100 measures to change tax incentives for equity usage, simplification of procedures, corporate restructuring, leverage productive investment and improve the access to equity markets; iii) a revamped Simplex + to modernize Public Administration, containing a large number of changes that will significantly improve the business environment for firms, thereby facilitating productivity and competitiveness gains; iv) Programa Capacitar, aiming to improve applied R&D and innovation by strengthening the role of interface entities (e.g. technological centers) between universities, laboratories and companies, facilitating the diffusion of technology; v) Startup Portugal, the national strategy for entrepreneurship, aimed at facilitating the birth and development of new enterprises, as well as promoting international investment and a focus on international markets.
Concerning the energy sector, the new measures under consideration by the Government to further reduce the tariff debt should be noted.
Finally, in late 2015, the Portuguese Government established a dedicated unit to evaluate structural reforms. This effort has been acknowledged by the OECD.
V – Financial Sector PoliciesThe Portuguese banking system has gone through a significant adjustment process in recent years. However, at the end of the Adjustment Program several challenges remained. The sector still faces important challenges that need to be addressed in the near future, taking into account the European context. Currently, the most important challenges faced are the resolution of high levels of non-performing loans (NPLs) in banks’ balance sheets and the compliance with stringent capital requirements in a context of weak growth and compressed profitability. The Portuguese authorities have been working to overcome the difficult environment, while safeguarding the taxpayer and a normal flow of credit to the economy.
The turnaround in the liquidity profile of Portuguese banks since 2010, with the very significant reduction in the loan to deposit ratio (from levels as high as 165 percent to just below 105 percent in late 2015), is one of the most prominent features of the adjustment of Portuguese banks. That trend continued during the first quarter of 2016, despite the concerns raised at the beginning of the year related to two resolution measures applied to Portuguese banks, which, however, did not have any impact on the retail deposit base of the banking system. That resilience reveals the confidence of the public in the system as a whole. The
4

reliance on Eurosystem financing continued to decline in 2015, even though the ECB pursued and intensified its quantitative easing measures. Finally, capital ratios have also improved, when compared to 2014, mainly driven by the resolution measure applied to Banco Espírito Santo, in December 2015, and by the decrease in risk weighted assets. In the first quarter of 2016, the phase-in of CRDIV/CRR measures contributed to a slight reduction of the Core Tier 1 ratio when compared to end-2015 figures.
Despite the progress, adjustment efforts should continue, as the Portuguese banking system still faces significant challenges in several areas, most notably in reducing the high level of NPLs and in regaining sustained and sufficient levels of profitability. The current low economic growth (observed and projected), the very low nominal interest rates and low inflation do not provide a favorable background to address these challenges. In 2015, even though most banks returned to profits after several years of losses, the level of profits was still feeble, although, in part, as a result of non-recurring factors. In the first quarter of 2016, (annualized) profits remained at a level similar to 2015 and net interest income continued to recover, on account of lower deposit interest rates, while income from financial operations, by nature less recurring, declined. The restructuring efforts that led to the reduction in administrative costs in 2015 continued to yield lower operating costs in the first quarter of 2016. Despite that, further efforts are needed, as banks continue to adjust to the current macroeconomic scenario characterized by low levels of demand for financial services. Restructuring should involve further downsizing and reallocation of human resources.
As mentioned before, the high stock of legacy assets on banks’ balance sheets, such as NPLs and real estate, persists as a major micro and macroprudential concern given the impact on banks’ capital and, potentially, on their ability and willingness to finance the economy. The flow of NPLs has declined as a result not only of the timid cyclical upturn underway, but also of the improvements in credit risk management processes that Portuguese banks have put in place. Nevertheless, the NPL stock remains very high and the efforts to resolve this problem will continue. In particular, given the multipronged nature of the problem, with intertwined constraints at several levels, a holistic strategy, comprising measures on supervision, legal, judicial and fiscal levels, must be continued and, in some cases, reinforced. Additionally, as the high NPL stock is a problem common to various major banks in several European countries, and considering their potential underlying impact on financial stability, a European solution aimed at the removal of NPLs from banks’ balance sheets should be pursued.
Deleveraging at the non-financial corporations’ level continues, although at a slower pace. The path of credit growth is very heterogeneous across firms: credit to those economic activity sectors more affected by the macroeconomic adjustment and contraction in demand, such as the construction and real estate sectors, continued to decline, while credit to manufacturing and exporting companies is recovering. In addition, credit is being channeled to those companies that rank better in the credit quality spectrum, while there is evidence of a clear price discrimination according to the risk profile of the debtor. In the second quarter of
5

2016, the stock of credit to households for house purchase continued the declining path initiated in 2011, while credit for consumption has been accelerating and showing positive growth rates since the second half of 2015. The implementation of the above-mentioned Programa Capitalizar should also support companies’ efforts to diversify their financing sources and, simultaneously, to strengthen their capitalization with the contribution of financial, fiscal and legal instruments. The uncertainty underlying the global economic outlook, in conjunction with some geographic concentration of banks’ activity, represents an additional risk for the banking sector. In particular, the direct and indirect exposures of Portuguese banks to emerging market economies (i.e. loans to corporations with significant commercial and investment relations with those economies), as Angola, are significant and may lead, in the current juncture, to additional losses for Portuguese banks.
Regarding Caixa Geral de Depositos, the state owned bank and the largest bank in Portugal, an agreement on its recapitalization was reached between the Government and the European institutions. The chosen approach is a market-based operation that allows for the bank to be adequately capitalized and able to fulfill its mission, while complying with EU rules.
To sum up, despite some positive signals observed more recently (in terms, for instance, of the banks’ financing structure and of firms’ deleveraging), the adjustment of the banking sector is still ongoing and some significant challenges persist, notably regarding their profitability and the high stock of NPLs.
VI – ConclusionThe Portuguese authorities are certain that their obligations towards the Fund will be timely met, as has been the case so far.
Economic growth, social cohesion, sound public finances and financial stability are the goals to be met, whilst the unintended effects of the adjustment process, i.e. rising inequality and emigration, must, and will, be adequately tackled.
Structural reforms will continue to be implemented, based on the lessons learned from previous efforts, with fine-tuning as needed, and with the launching of new initiatives in order to achieve a competitive and balanced economy. Time and stability are required in order for the reforms – implemented before, under and after the Economic and Financial Adjustment Program − to produce the desired effects.
The Portuguese authorities look forward to the fifth PPM mission, which will constitute a good opportunity to closely work with the IMF, deepening our dialogue and promoting a closer mutual understanding.
6
Recommended