38
PHARMACOKINETICS,PHARMACODYNAMICS, AND DRUG
DISPOSITION
DAVID J. GREENBLATTLISA L. VON MOLTKEJEROLD S. HARMATZRICHARD I. SHADER
During the last decade, the application of pharmacokineticand pharmacodynamic modeling techniques has become anincreasingly important aspect of contemporary clinical psy-chopharmacology (1–5). These techniques have been ap-plied during the process of development of new drug entitiesas well as for the improved understanding of the clinicalactions of drugs that are already marketed. Techniques forthe study of drug metabolism in vitro have advanced sub-stantially during the last decade, and now are an integralcomponent of preclinical drug development and the linkto subsequent clinical studies of drug metabolism and dispo-sition. Kinetic-dynamic modeling techniques have beencombined with in vitro metabolism procedures and in vi-tro–in vivo mathematical scaling models to provide insightinto the general problem of pharmacokinetic drug interac-tions in clinical psychopharmacology (6–9).
This chapter reviews some advances in pharmacokinetics,pharmacodynamics, and drug metabolism, along withmethodologic applications to selected problems in clinicalpsychopharmacology.
POPULATION PHARMACOKINETICS
Principles
Pharmacokinetic studies based on a traditional intensive-design model are usually conducted using carefully selectedvolunteer subjects, a controlled experimental design, andcollection of multiple blood samples. After measurement ofdrug and metabolite concentrations in all samples, pharma-
D. J. Greenblatt, L. L. von Moltke, J. S. Harmatz, and R. I. Shader:Department of Pharmacology and Experimental Therapeutics, Tufts Univer-sity School of Medicine, and Division of Clinical Pharmacology, New EnglandMedical Center, Boston, Massachusetts.
cokinetic models are applied to determine parameters suchas elimination half-life, volume of distribution, and clear-ance. During the new drug development process, a seriesof pharmacokinetic studies are conducted to determine theinfluence of major disease states or experimental conditionshypothesized to affect drug disposition. Such factors mightinclude age, gender, body weight, ethnicity, hepatic andrenal disease, coadministration of food, and various druginteractions. Classical pharmacokinetic studies can quanti-tate the effects of anticipated influences on drug dispositionunder controlled circumstances, but cannot identify the un-expected factors affecting pharmacokinetics. A number ofexamples of altered drug pharmacokinetics became apparentin the patient care setting only in the postmarketing phaseof extensive clinical use. Examples include the digoxin-quin-idine interaction, altered drug metabolism due to cimeti-dine, and the ketoconazole-terfenadine interaction.
Population pharmacokinetic methodology has developedas an approach to detect and quantify unexpected influenceson drug pharmacokinetics (10–18). Population pharmaco-kinetic studies, in contrast to classical or traditional pharma-cokinetic studies, focus on the central tendency of a phar-macokinetic parameter across an entire population, andidentify deviations from that central tendency in a subgroupof individual patients. One software program widely appliedto population pharmacokinetic problems is the nonlinearmixed-effects model (NONMEM). Analysis of clinical datausing a population approach allows pharmacokinetic pa-rameters to be determined directly in patient populationsof interest and allows evaluation of the influence of variouspatient characteristics on pharmacokinetics. Because thenumber of blood samples that need to be collected per sub-ject is small, this approach is often suitable for patientgroups unable to participate in traditional pharmacokineticstudies requiring multiple blood samples (e.g., neonates,
Neuropsychopharmacology: The Fifth Generation of Progress508
children, critically ill patients, or individuals who are notable to provide informed consent) (19). In many cases thepopulation approach has yielded pharmacokinetic parame-ter estimates similar to those delineated in classical pharma-cokinetic studies of the same drug.
Application: MethylphenidatePharmacokinetics
The population approach is illustrated in a study of methyl-phenidate (MP) pharmacokinetics in children (20). This isa patient group for whom the multiple-sample pharmacoki-netic study design may not be appropriate for ethical andpractical reasons. Participating subjects were 273 childrenaged 5 to 18 years having a primary diagnosis of attention-deficit/hyperactivity disorder (ADHD). They had been re-ceiving MP at a fixed dosage level for at least 4 weeks, andwere under treatment for at least 3 months. The treatingphysician for each patient judged MP to be clinically effec-tive.
Children meeting the eligibility criteria had an initialscreening visit, at which one parent or a legal guardian pro-vided written informed consent, and the child provided as-sent. Demographic characteristics were recorded, includingthe dosage of MP, the usual times for individual doses, andthe duration of treatment.
The second visit, which followed shortly, was a blood-sampling day. Each child, accompanied by parent or guard-ian, arrived at the investigator’s office 30 to 60 minutesprior to blood sampling. The time and size of the last MPdose, and of any other medication received that day or dur-ing the prior 2 weeks, were recorded. A 5-mL whole bloodsample was obtained by venipuncture. This sample was im-mediately centrifuged, and a 2-mL aliquot of plasma wasremoved for subsequent determination of MP concentra-tions by a liquid chromatography/mass spectroscopy/massspectroscopy (LC/MS/MS) assay.
Analysis of Data
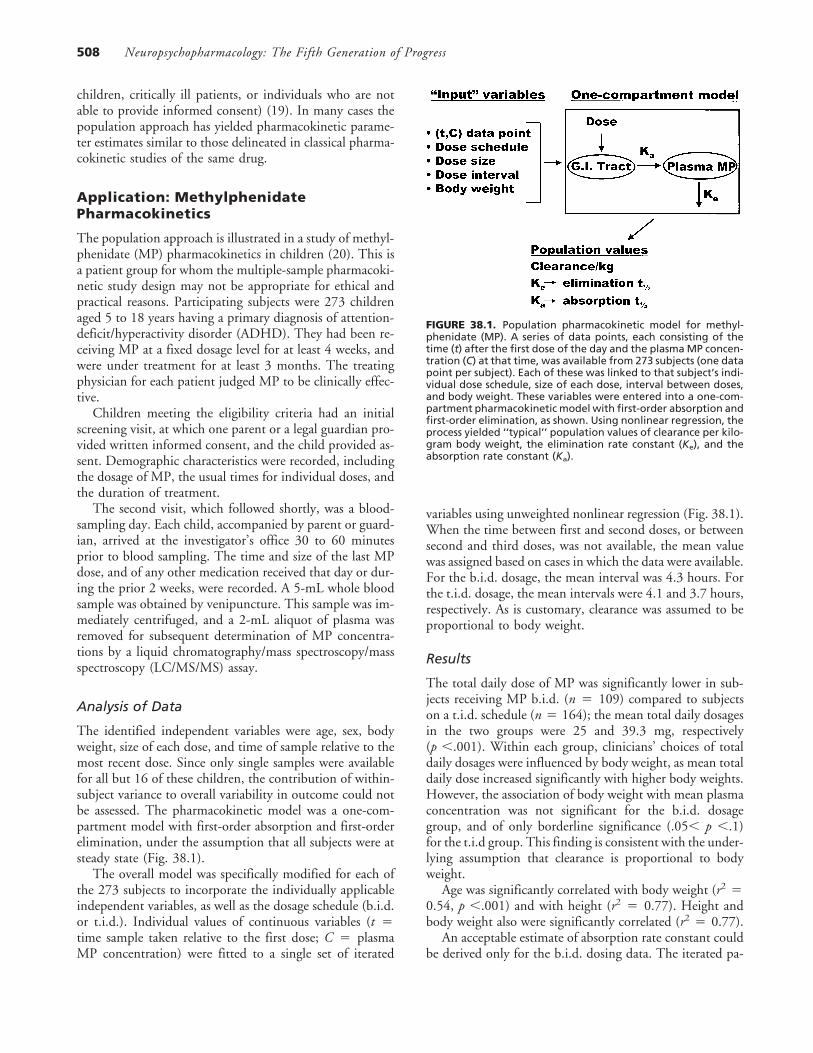
The identified independent variables were age, sex, bodyweight, size of each dose, and time of sample relative to themost recent dose. Since only single samples were availablefor all but 16 of these children, the contribution of within-subject variance to overall variability in outcome could notbe assessed. The pharmacokinetic model was a one-com-partment model with first-order absorption and first-orderelimination, under the assumption that all subjects were atsteady state (Fig. 38.1).
The overall model was specifically modified for each ofthe 273 subjects to incorporate the individually applicableindependent variables, as well as the dosage schedule (b.i.d.or t.i.d.). Individual values of continuous variables (t �time sample taken relative to the first dose; C � plasmaMP concentration) were fitted to a single set of iterated
FIGURE 38.1. Population pharmacokinetic model for methyl-phenidate (MP). A series of data points, each consisting of thetime (t) after the first dose of the day and the plasma MP concen-tration (C) at that time, was available from 273 subjects (one datapoint per subject). Each of these was linked to that subject’s indi-vidual dose schedule, size of each dose, interval between doses,and body weight. These variables were entered into a one-com-partment pharmacokinetic model with first-order absorption andfirst-order elimination, as shown. Using nonlinear regression, theprocess yielded ‘‘typical’’ population values of clearance per kilo-gram body weight, the elimination rate constant (Ke), and theabsorption rate constant (Ka).
variables using unweighted nonlinear regression (Fig. 38.1).When the time between first and second doses, or betweensecond and third doses, was not available, the mean valuewas assigned based on cases in which the data were available.For the b.i.d. dosage, the mean interval was 4.3 hours. Forthe t.i.d. dosage, the mean intervals were 4.1 and 3.7 hours,respectively. As is customary, clearance was assumed to beproportional to body weight.
Results
The total daily dose of MP was significantly lower in sub-jects receiving MP b.i.d. (n � 109) compared to subjectson a t.i.d. schedule (n� 164); the mean total daily dosagesin the two groups were 25 and 39.3 mg, respectively(p �.001). Within each group, clinicians’ choices of totaldaily dosages were influenced by body weight, as mean totaldaily dose increased significantly with higher body weights.However, the association of body weight with mean plasmaconcentration was not significant for the b.i.d. dosagegroup, and of only borderline significance (.05� p �.1)for the t.i.d group. This finding is consistent with the under-lying assumption that clearance is proportional to bodyweight.
Age was significantly correlated with body weight (r2 �0.54, p �.001) and with height (r2 � 0.77). Height andbody weight also were significantly correlated (r2 � 0.77).
An acceptable estimate of absorption rate constant couldbe derived only for the b.i.d. dosing data. The iterated pa-
38: Pharmacokinetics, Pharmacodynamics, and Drug Disposition 509
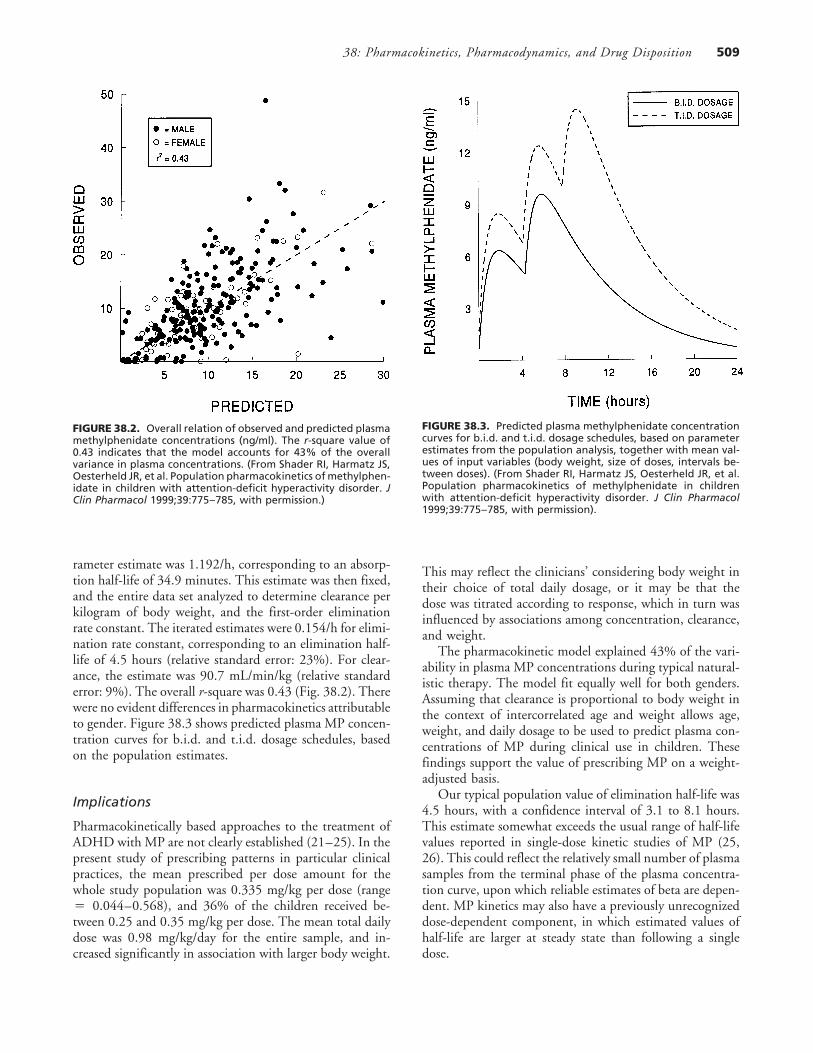
FIGURE 38.2. Overall relation of observed and predicted plasmamethylphenidate concentrations (ng/ml). The r-square value of0.43 indicates that the model accounts for 43% of the overallvariance in plasma concentrations. (From Shader RI, Harmatz JS,Oesterheld JR, et al. Population pharmacokinetics of methylphen-idate in children with attention-deficit hyperactivity disorder. JClin Pharmacol 1999;39:775–785, with permission.)
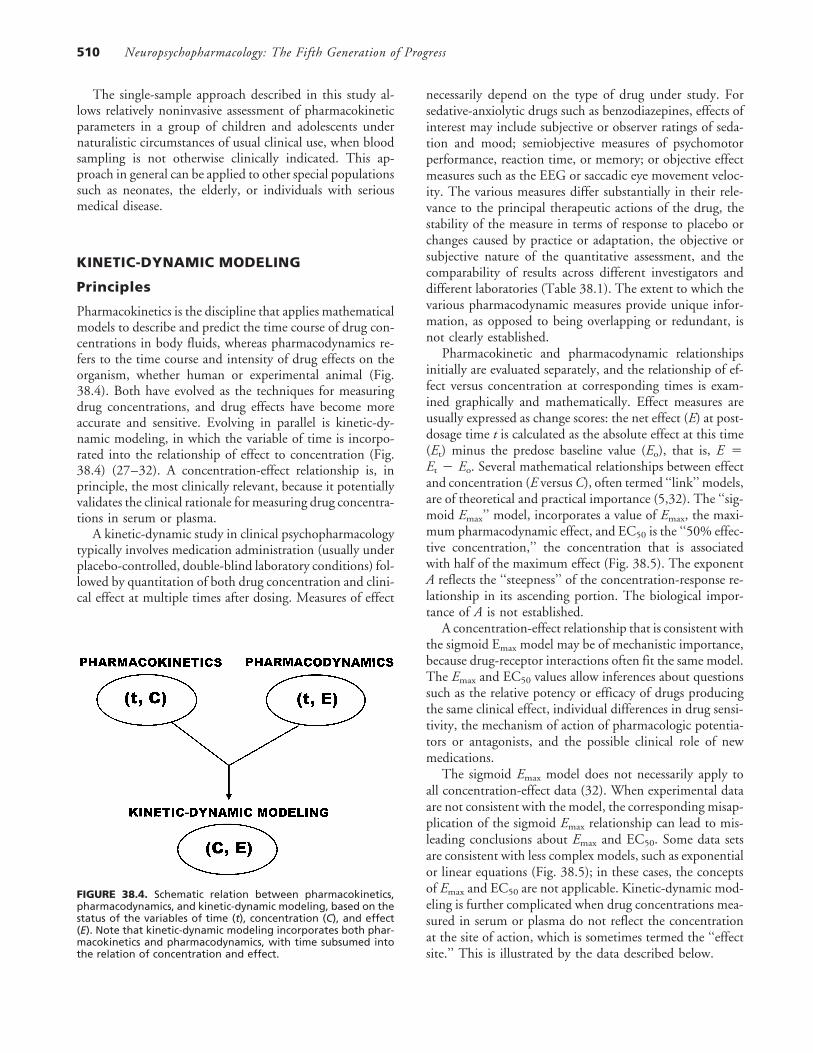
rameter estimate was 1.192/h, corresponding to an absorp-tion half-life of 34.9 minutes. This estimate was then fixed,and the entire data set analyzed to determine clearance perkilogram of body weight, and the first-order eliminationrate constant. The iterated estimates were 0.154/h for elimi-nation rate constant, corresponding to an elimination half-life of 4.5 hours (relative standard error: 23%). For clear-ance, the estimate was 90.7 mL/min/kg (relative standarderror: 9%). The overall r-square was 0.43 (Fig. 38.2). Therewere no evident differences in pharmacokinetics attributableto gender. Figure 38.3 shows predicted plasma MP concen-tration curves for b.i.d. and t.i.d. dosage schedules, basedon the population estimates.
Implications
Pharmacokinetically based approaches to the treatment ofADHD with MP are not clearly established (21–25). In thepresent study of prescribing patterns in particular clinicalpractices, the mean prescribed per dose amount for thewhole study population was 0.335 mg/kg per dose (range� 0.044–0.568), and 36% of the children received be-tween 0.25 and 0.35 mg/kg per dose. The mean total dailydose was 0.98 mg/kg/day for the entire sample, and in-creased significantly in association with larger body weight.
FIGURE 38.3. Predicted plasma methylphenidate concentrationcurves for b.i.d. and t.i.d. dosage schedules, based on parameterestimates from the population analysis, together with mean val-ues of input variables (body weight, size of doses, intervals be-tween doses). (From Shader RI, Harmatz JS, Oesterheld JR, et al.Population pharmacokinetics of methylphenidate in childrenwith attention-deficit hyperactivity disorder. J Clin Pharmacol1999;39:775–785, with permission).
This may reflect the clinicians’ considering body weight intheir choice of total daily dosage, or it may be that thedose was titrated according to response, which in turn wasinfluenced by associations among concentration, clearance,and weight.
The pharmacokinetic model explained 43% of the vari-ability in plasma MP concentrations during typical natural-istic therapy. The model fit equally well for both genders.Assuming that clearance is proportional to body weight inthe context of intercorrelated age and weight allows age,weight, and daily dosage to be used to predict plasma con-centrations of MP during clinical use in children. Thesefindings support the value of prescribing MP on a weight-adjusted basis.
Our typical population value of elimination half-life was4.5 hours, with a confidence interval of 3.1 to 8.1 hours.This estimate somewhat exceeds the usual range of half-lifevalues reported in single-dose kinetic studies of MP (25,26). This could reflect the relatively small number of plasmasamples from the terminal phase of the plasma concentra-tion curve, upon which reliable estimates of beta are depen-dent. MP kinetics may also have a previously unrecognizeddose-dependent component, in which estimated values ofhalf-life are larger at steady state than following a singledose.
Neuropsychopharmacology: The Fifth Generation of Progress510
The single-sample approach described in this study al-lows relatively noninvasive assessment of pharmacokineticparameters in a group of children and adolescents undernaturalistic circumstances of usual clinical use, when bloodsampling is not otherwise clinically indicated. This ap-proach in general can be applied to other special populationssuch as neonates, the elderly, or individuals with seriousmedical disease.
KINETIC-DYNAMIC MODELING
Principles
Pharmacokinetics is the discipline that applies mathematicalmodels to describe and predict the time course of drug con-centrations in body fluids, whereas pharmacodynamics re-fers to the time course and intensity of drug effects on theorganism, whether human or experimental animal (Fig.38.4). Both have evolved as the techniques for measuringdrug concentrations, and drug effects have become moreaccurate and sensitive. Evolving in parallel is kinetic-dy-namic modeling, in which the variable of time is incorpo-rated into the relationship of effect to concentration (Fig.38.4) (27–32). A concentration-effect relationship is, inprinciple, the most clinically relevant, because it potentiallyvalidates the clinical rationale for measuring drug concentra-tions in serum or plasma.
A kinetic-dynamic study in clinical psychopharmacologytypically involves medication administration (usually underplacebo-controlled, double-blind laboratory conditions) fol-lowed by quantitation of both drug concentration and clini-cal effect at multiple times after dosing. Measures of effect
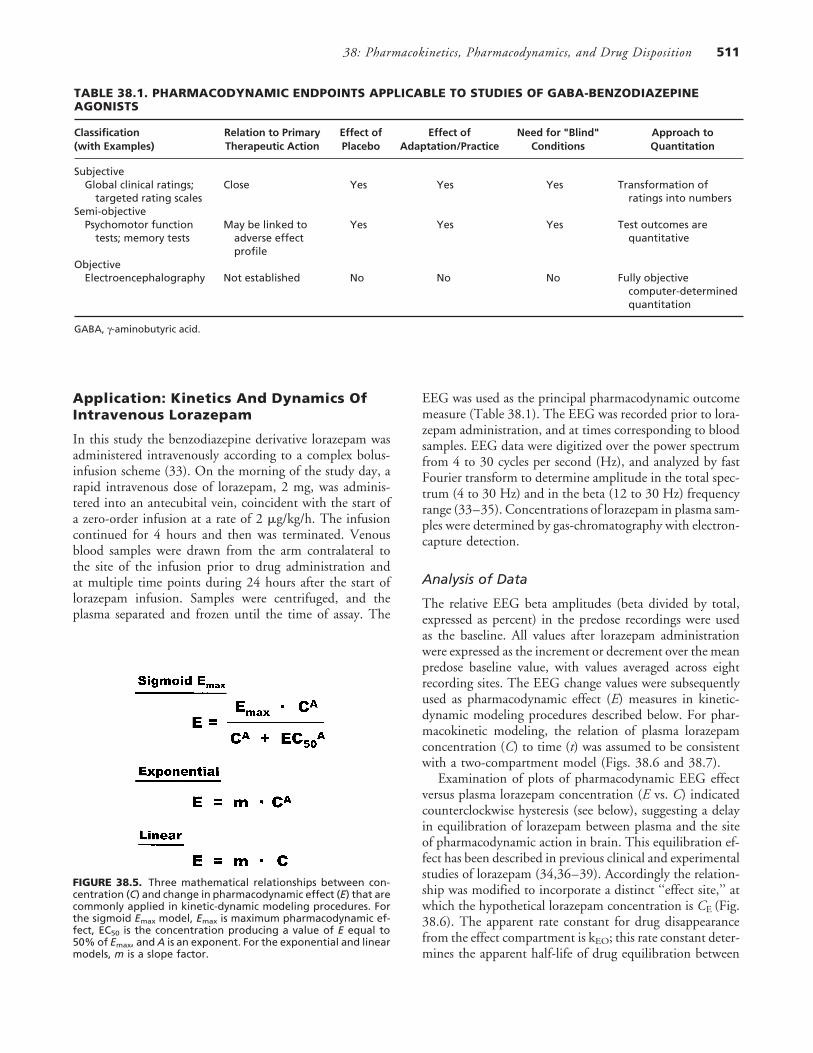
FIGURE 38.4. Schematic relation between pharmacokinetics,pharmacodynamics, and kinetic-dynamic modeling, based on thestatus of the variables of time (t), concentration (C), and effect(E). Note that kinetic-dynamic modeling incorporates both phar-macokinetics and pharmacodynamics, with time subsumed intothe relation of concentration and effect.
necessarily depend on the type of drug under study. Forsedative-anxiolytic drugs such as benzodiazepines, effects ofinterest may include subjective or observer ratings of seda-tion and mood; semiobjective measures of psychomotorperformance, reaction time, or memory; or objective effectmeasures such as the EEG or saccadic eye movement veloc-ity. The various measures differ substantially in their rele-vance to the principal therapeutic actions of the drug, thestability of the measure in terms of response to placebo orchanges caused by practice or adaptation, the objective orsubjective nature of the quantitative assessment, and thecomparability of results across different investigators anddifferent laboratories (Table 38.1). The extent to which thevarious pharmacodynamic measures provide unique infor-mation, as opposed to being overlapping or redundant, isnot clearly established.
Pharmacokinetic and pharmacodynamic relationshipsinitially are evaluated separately, and the relationship of ef-fect versus concentration at corresponding times is exam-ined graphically and mathematically. Effect measures areusually expressed as change scores: the net effect (E) at post-dosage time t is calculated as the absolute effect at this time(Et) minus the predose baseline value (Eo), that is, E �Et � Eo. Several mathematical relationships between effectand concentration (E versusC), often termed ‘‘link’’ models,are of theoretical and practical importance (5,32). The ‘‘sig-moid Emax’’ model, incorporates a value of Emax, the maxi-mum pharmacodynamic effect, and EC50 is the ‘‘50% effec-tive concentration,’’ the concentration that is associatedwith half of the maximum effect (Fig. 38.5). The exponentA reflects the ‘‘steepness’’ of the concentration-response re-lationship in its ascending portion. The biological impor-tance of A is not established.
A concentration-effect relationship that is consistent withthe sigmoid Emax model may be of mechanistic importance,because drug-receptor interactions often fit the same model.The Emax and EC50 values allow inferences about questionssuch as the relative potency or efficacy of drugs producingthe same clinical effect, individual differences in drug sensi-tivity, the mechanism of action of pharmacologic potentia-tors or antagonists, and the possible clinical role of newmedications.
The sigmoid Emax model does not necessarily apply toall concentration-effect data (32). When experimental dataare not consistent with the model, the corresponding misap-plication of the sigmoid Emax relationship can lead to mis-leading conclusions about Emax and EC50. Some data setsare consistent with less complex models, such as exponentialor linear equations (Fig. 38.5); in these cases, the conceptsof Emax and EC50 are not applicable. Kinetic-dynamic mod-eling is further complicated when drug concentrations mea-sured in serum or plasma do not reflect the concentrationat the site of action, which is sometimes termed the ‘‘effectsite.’’ This is illustrated by the data described below.
38: Pharmacokinetics, Pharmacodynamics, and Drug Disposition 511
TABLE 38.1. PHARMACODYNAMIC ENDPOINTS APPLICABLE TO STUDIES OF GABA-BENZODIAZEPINEAGONISTS
Classification Relation to Primary Effect of Effect of Need for "Blind" Approach to(with Examples) Therapeutic Action Placebo Adaptation/Practice Conditions Quantitation
SubjectiveGlobal clinical ratings; Close Yes Yes Yes Transformation of
targeted rating scales ratings into numbersSemi-objective
Psychomotor function May be linked to Yes Yes Yes Test outcomes aretests; memory tests adverse effect quantitative
profileObjective
Electroencephalography Not established No No No Fully objectivecomputer-determinedquantitation
GABA, γ-aminobutyric acid.
Application: Kinetics And Dynamics OfIntravenous Lorazepam
In this study the benzodiazepine derivative lorazepam wasadministered intravenously according to a complex bolus-infusion scheme (33). On the morning of the study day, arapid intravenous dose of lorazepam, 2 mg, was adminis-tered into an antecubital vein, coincident with the start ofa zero-order infusion at a rate of 2 �g/kg/h. The infusioncontinued for 4 hours and then was terminated. Venousblood samples were drawn from the arm contralateral tothe site of the infusion prior to drug administration andat multiple time points during 24 hours after the start oflorazepam infusion. Samples were centrifuged, and theplasma separated and frozen until the time of assay. The
FIGURE 38.5. Three mathematical relationships between con-centration (C) and change in pharmacodynamic effect (E) that arecommonly applied in kinetic-dynamic modeling procedures. Forthe sigmoid Emax model, Emax is maximum pharmacodynamic ef-fect, EC50 is the concentration producing a value of E equal to50% of Emax, and A is an exponent. For the exponential and linearmodels, m is a slope factor.
EEG was used as the principal pharmacodynamic outcomemeasure (Table 38.1). The EEG was recorded prior to lora-zepam administration, and at times corresponding to bloodsamples. EEG data were digitized over the power spectrumfrom 4 to 30 cycles per second (Hz), and analyzed by fastFourier transform to determine amplitude in the total spec-trum (4 to 30 Hz) and in the beta (12 to 30 Hz) frequencyrange (33–35). Concentrations of lorazepam in plasma sam-ples were determined by gas-chromatography with electron-capture detection.
Analysis of Data
The relative EEG beta amplitudes (beta divided by total,expressed as percent) in the predose recordings were usedas the baseline. All values after lorazepam administrationwere expressed as the increment or decrement over the meanpredose baseline value, with values averaged across eightrecording sites. The EEG change values were subsequentlyused as pharmacodynamic effect (E) measures in kinetic-dynamic modeling procedures described below. For phar-macokinetic modeling, the relation of plasma lorazepamconcentration (C) to time (t) was assumed to be consistentwith a two-compartment model (Figs. 38.6 and 38.7).
Examination of plots of pharmacodynamic EEG effectversus plasma lorazepam concentration (E vs. C) indicatedcounterclockwise hysteresis (see below), suggesting a delayin equilibration of lorazepam between plasma and the siteof pharmacodynamic action in brain. This equilibration ef-fect has been described in previous clinical and experimentalstudies of lorazepam (34,36–39). Accordingly the relation-ship was modified to incorporate a distinct ‘‘effect site,’’ atwhich the hypothetical lorazepam concentration is CE (Fig.38.6). The apparent rate constant for drug disappearancefrom the effect compartment is kEO; this rate constant deter-mines the apparent half-life of drug equilibration between
Neuropsychopharmacology: The Fifth Generation of Progress512
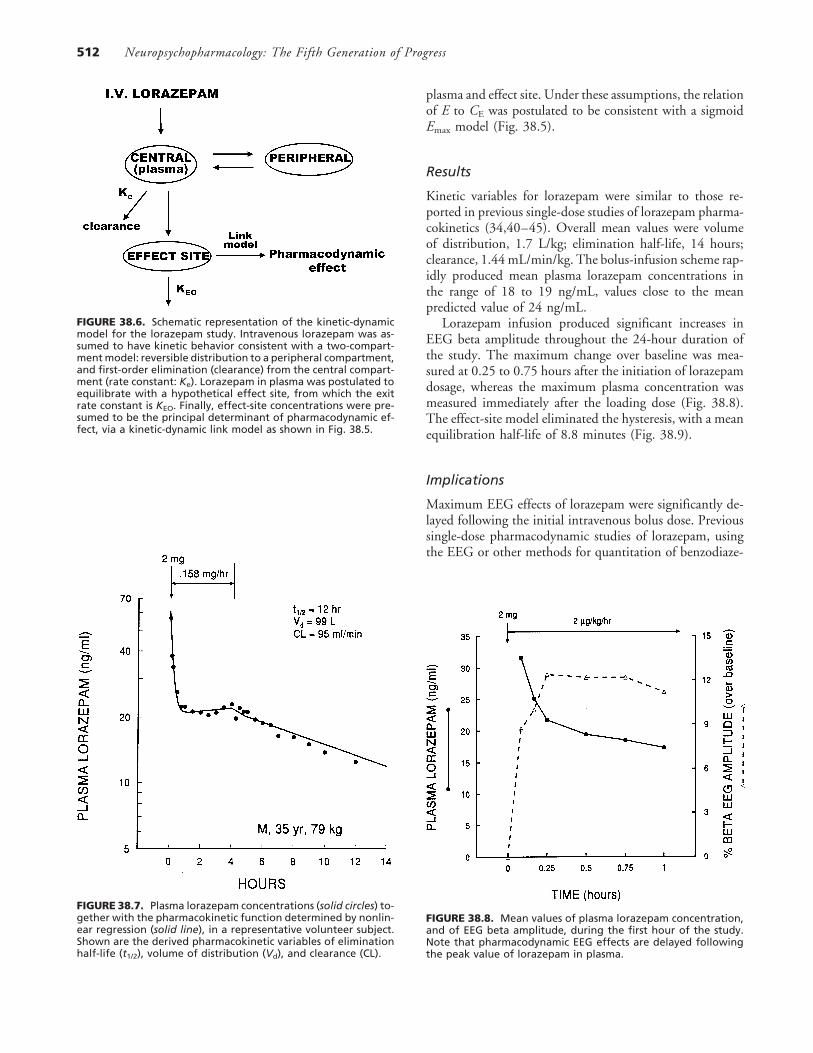
FIGURE 38.6. Schematic representation of the kinetic-dynamicmodel for the lorazepam study. Intravenous lorazepam was as-sumed to have kinetic behavior consistent with a two-compart-ment model: reversible distribution to a peripheral compartment,and first-order elimination (clearance) from the central compart-ment (rate constant: Ke). Lorazepam in plasma was postulated toequilibrate with a hypothetical effect site, from which the exitrate constant is KEO. Finally, effect-site concentrations were pre-sumed to be the principal determinant of pharmacodynamic ef-fect, via a kinetic-dynamic link model as shown in Fig. 38.5.
FIGURE 38.7. Plasma lorazepam concentrations (solid circles) to-gether with the pharmacokinetic function determined by nonlin-ear regression (solid line), in a representative volunteer subject.Shown are the derived pharmacokinetic variables of eliminationhalf-life (t1/2), volume of distribution (Vd), and clearance (CL).
plasma and effect site. Under these assumptions, the relationof E to CE was postulated to be consistent with a sigmoidEmax model (Fig. 38.5).
Results
Kinetic variables for lorazepam were similar to those re-ported in previous single-dose studies of lorazepam pharma-cokinetics (34,40–45). Overall mean values were volumeof distribution, 1.7 L/kg; elimination half-life, 14 hours;clearance, 1.44 mL/min/kg. The bolus-infusion scheme rap-idly produced mean plasma lorazepam concentrations inthe range of 18 to 19 ng/mL, values close to the meanpredicted value of 24 ng/mL.
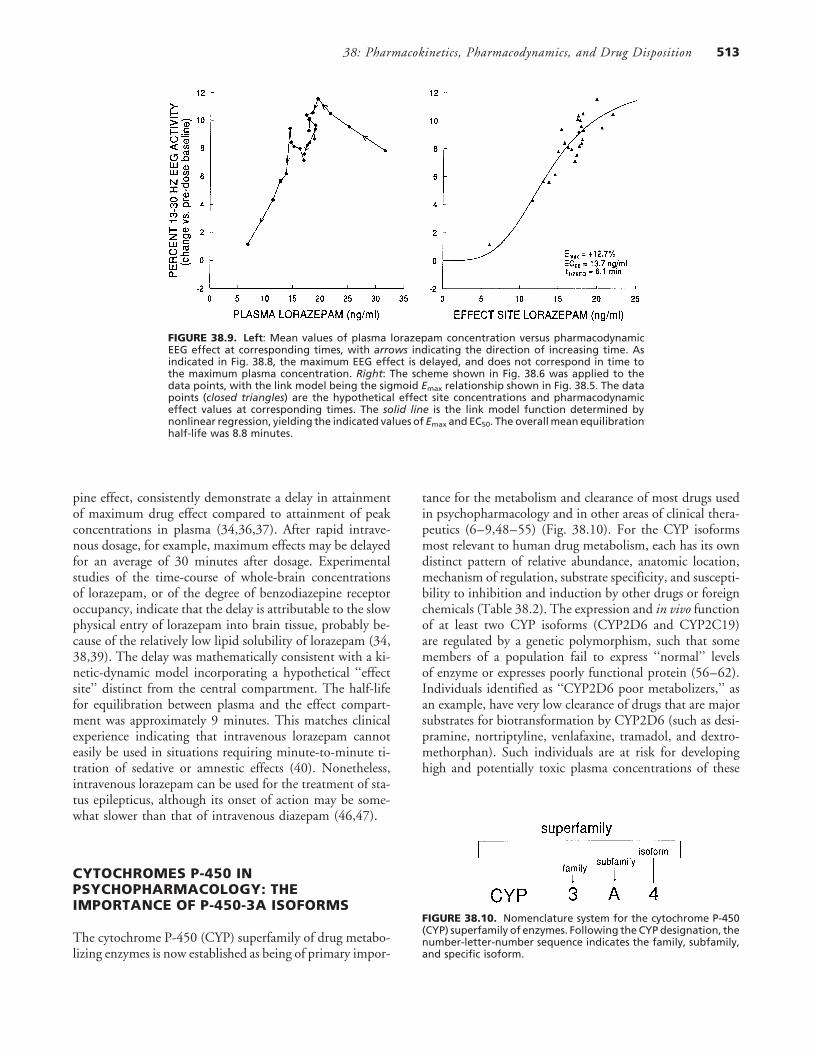
Lorazepam infusion produced significant increases inEEG beta amplitude throughout the 24-hour duration ofthe study. The maximum change over baseline was mea-sured at 0.25 to 0.75 hours after the initiation of lorazepamdosage, whereas the maximum plasma concentration wasmeasured immediately after the loading dose (Fig. 38.8).The effect-site model eliminated the hysteresis, with a meanequilibration half-life of 8.8 minutes (Fig. 38.9).
Implications
Maximum EEG effects of lorazepam were significantly de-layed following the initial intravenous bolus dose. Previoussingle-dose pharmacodynamic studies of lorazepam, usingthe EEG or other methods for quantitation of benzodiaze-
FIGURE 38.8. Mean values of plasma lorazepam concentration,and of EEG beta amplitude, during the first hour of the study.Note that pharmacodynamic EEG effects are delayed followingthe peak value of lorazepam in plasma.
38: Pharmacokinetics, Pharmacodynamics, and Drug Disposition 513
FIGURE 38.9. Left: Mean values of plasma lorazepam concentration versus pharmacodynamicEEG effect at corresponding times, with arrows indicating the direction of increasing time. Asindicated in Fig. 38.8, the maximum EEG effect is delayed, and does not correspond in time tothe maximum plasma concentration. Right: The scheme shown in Fig. 38.6 was applied to thedata points, with the link model being the sigmoid Emax relationship shown in Fig. 38.5. The datapoints (closed triangles) are the hypothetical effect site concentrations and pharmacodynamiceffect values at corresponding times. The solid line is the link model function determined bynonlinear regression, yielding the indicated values of Emax and EC50. The overall mean equilibrationhalf-life was 8.8 minutes.
pine effect, consistently demonstrate a delay in attainmentof maximum drug effect compared to attainment of peakconcentrations in plasma (34,36,37). After rapid intrave-nous dosage, for example, maximum effects may be delayedfor an average of 30 minutes after dosage. Experimentalstudies of the time-course of whole-brain concentrationsof lorazepam, or of the degree of benzodiazepine receptoroccupancy, indicate that the delay is attributable to the slowphysical entry of lorazepam into brain tissue, probably be-cause of the relatively low lipid solubility of lorazepam (34,38,39). The delay was mathematically consistent with a ki-netic-dynamic model incorporating a hypothetical ‘‘effectsite’’ distinct from the central compartment. The half-lifefor equilibration between plasma and the effect compart-ment was approximately 9 minutes. This matches clinicalexperience indicating that intravenous lorazepam cannoteasily be used in situations requiring minute-to-minute ti-tration of sedative or amnestic effects (40). Nonetheless,intravenous lorazepam can be used for the treatment of sta-tus epilepticus, although its onset of action may be some-what slower than that of intravenous diazepam (46,47).
CYTOCHROMES P-450 INPSYCHOPHARMACOLOGY: THEIMPORTANCE OF P-450-3A ISOFORMS
The cytochrome P-450 (CYP) superfamily of drug metabo-lizing enzymes is now established as being of primary impor-
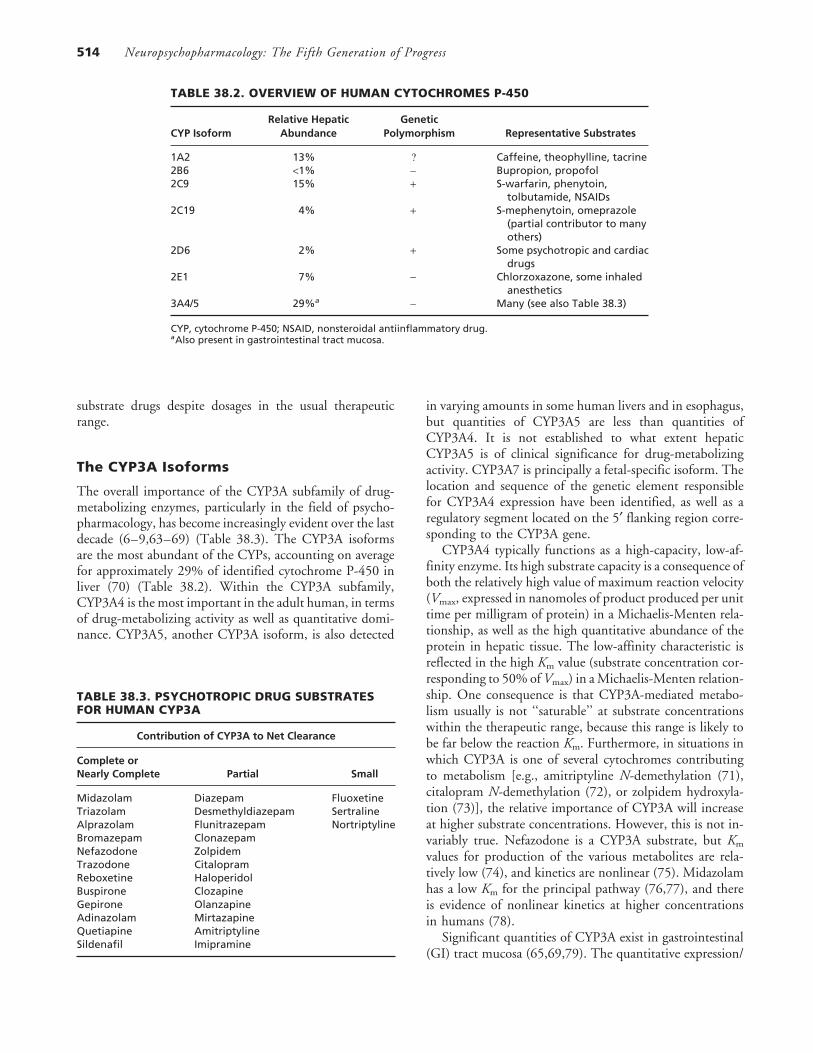
tance for the metabolism and clearance of most drugs usedin psychopharmacology and in other areas of clinical thera-peutics (6–9,48–55) (Fig. 38.10). For the CYP isoformsmost relevant to human drug metabolism, each has its owndistinct pattern of relative abundance, anatomic location,mechanism of regulation, substrate specificity, and suscepti-bility to inhibition and induction by other drugs or foreignchemicals (Table 38.2). The expression and in vivo functionof at least two CYP isoforms (CYP2D6 and CYP2C19)are regulated by a genetic polymorphism, such that somemembers of a population fail to express ‘‘normal’’ levelsof enzyme or expresses poorly functional protein (56–62).Individuals identified as ‘‘CYP2D6 poor metabolizers,’’ asan example, have very low clearance of drugs that are majorsubstrates for biotransformation by CYP2D6 (such as desi-pramine, nortriptyline, venlafaxine, tramadol, and dextro-methorphan). Such individuals are at risk for developinghigh and potentially toxic plasma concentrations of these
FIGURE 38.10. Nomenclature system for the cytochrome P-450(CYP) superfamily of enzymes. Following the CYP designation, thenumber-letter-number sequence indicates the family, subfamily,and specific isoform.
Neuropsychopharmacology: The Fifth Generation of Progress514
TABLE 38.2. OVERVIEW OF HUMAN CYTOCHROMES P-450
Relative Hepatic GeneticCYP Isoform Abundance Polymorphism Representative Substrates
1A2 13% ? Caffeine, theophylline, tacrine2B6 <1% − Bupropion, propofol2C9 15% + S-warfarin, phenytoin,
tolbutamide, NSAIDs2C19 4% + S-mephenytoin, omeprazole
(partial contributor to manyothers)
2D6 2% + Some psychotropic and cardiacdrugs
2E1 7% − Chlorzoxazone, some inhaledanesthetics
3A4/5 29%a − Many (see also Table 38.3)
CYP, cytochrome P-450; NSAID, nonsteroidal antiinflammatory drug.aAlso present in gastrointestinal tract mucosa.
substrate drugs despite dosages in the usual therapeuticrange.
The CYP3A Isoforms
The overall importance of the CYP3A subfamily of drug-metabolizing enzymes, particularly in the field of psycho-pharmacology, has become increasingly evident over the lastdecade (6–9,63–69) (Table 38.3). The CYP3A isoformsare the most abundant of the CYPs, accounting on averagefor approximately 29% of identified cytochrome P-450 inliver (70) (Table 38.2). Within the CYP3A subfamily,CYP3A4 is the most important in the adult human, in termsof drug-metabolizing activity as well as quantitative domi-nance. CYP3A5, another CYP3A isoform, is also detected
TABLE 38.3. PSYCHOTROPIC DRUG SUBSTRATESFOR HUMAN CYP3A
Contribution of CYP3A to Net Clearance
Complete orNearly Complete Partial Small
Midazolam Diazepam FluoxetineTriazolam Desmethyldiazepam SertralineAlprazolam Flunitrazepam NortriptylineBromazepam ClonazepamNefazodone ZolpidemTrazodone CitalopramReboxetine HaloperidolBuspirone ClozapineGepirone OlanzapineAdinazolam MirtazapineQuetiapine AmitriptylineSildenafil Imipramine
in varying amounts in some human livers and in esophagus,but quantities of CYP3A5 are less than quantities ofCYP3A4. It is not established to what extent hepaticCYP3A5 is of clinical significance for drug-metabolizingactivity. CYP3A7 is principally a fetal-specific isoform. Thelocation and sequence of the genetic element responsiblefor CYP3A4 expression have been identified, as well as aregulatory segment located on the 5′ flanking region corre-sponding to the CYP3A gene.
CYP3A4 typically functions as a high-capacity, low-af-finity enzyme. Its high substrate capacity is a consequence ofboth the relatively high value of maximum reaction velocity(Vmax, expressed in nanomoles of product produced per unittime per milligram of protein) in a Michaelis-Menten rela-tionship, as well as the high quantitative abundance of theprotein in hepatic tissue. The low-affinity characteristic isreflected in the high Km value (substrate concentration cor-responding to 50% ofVmax) in aMichaelis-Menten relation-ship. One consequence is that CYP3A-mediated metabo-lism usually is not ‘‘saturable’’ at substrate concentrationswithin the therapeutic range, because this range is likely tobe far below the reaction Km. Furthermore, in situations inwhich CYP3A is one of several cytochromes contributingto metabolism [e.g., amitriptyline N-demethylation (71),citalopram N-demethylation (72), or zolpidem hydroxyla-tion (73)], the relative importance of CYP3A will increaseat higher substrate concentrations. However, this is not in-variably true. Nefazodone is a CYP3A substrate, but Km
values for production of the various metabolites are rela-tively low (74), and kinetics are nonlinear (75). Midazolamhas a low Km for the principal pathway (76,77), and thereis evidence of nonlinear kinetics at higher concentrationsin humans (78).
Significant quantities of CYP3A exist in gastrointestinal(GI) tract mucosa (65,69,79). The quantitative expression/
38: Pharmacokinetics, Pharmacodynamics, and Drug Disposition 515
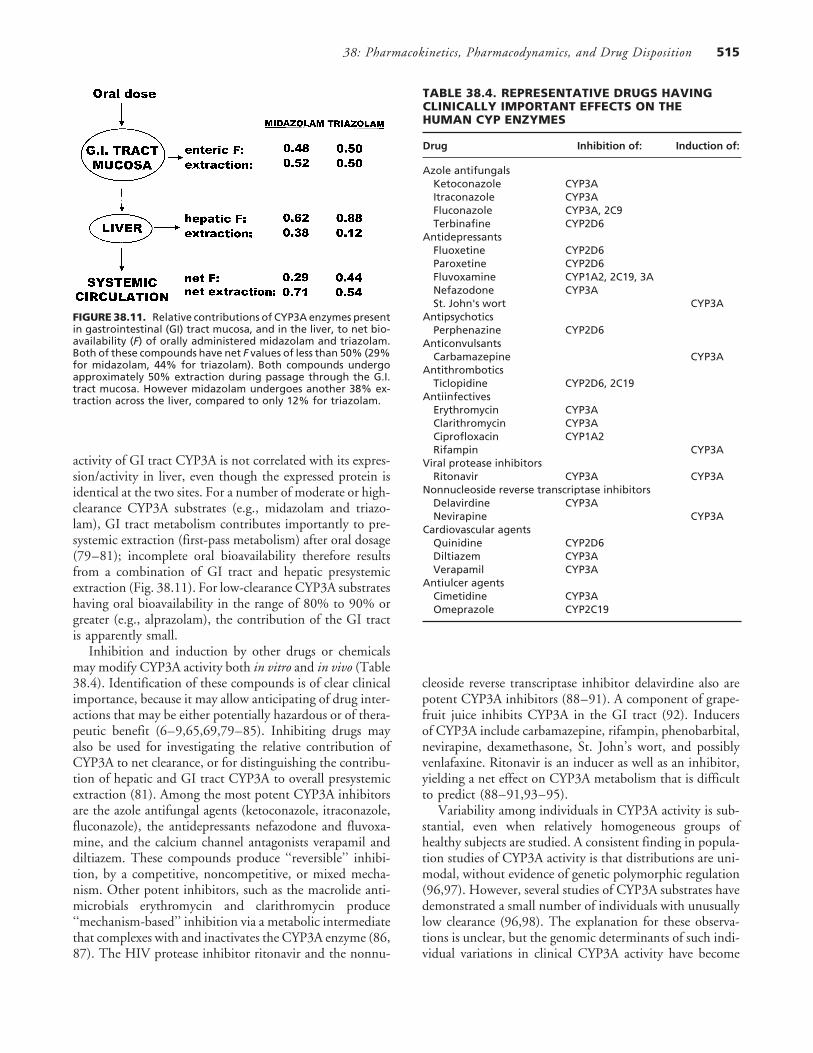
FIGURE 38.11. Relative contributions of CYP3A enzymes presentin gastrointestinal (GI) tract mucosa, and in the liver, to net bio-availability (F) of orally administered midazolam and triazolam.Both of these compounds have net F values of less than 50% (29%for midazolam, 44% for triazolam). Both compounds undergoapproximately 50% extraction during passage through the G.I.tract mucosa. However midazolam undergoes another 38% ex-traction across the liver, compared to only 12% for triazolam.
activity of GI tract CYP3A is not correlated with its expres-sion/activity in liver, even though the expressed protein isidentical at the two sites. For a number of moderate or high-clearance CYP3A substrates (e.g., midazolam and triazo-lam), GI tract metabolism contributes importantly to pre-systemic extraction (first-pass metabolism) after oral dosage(79–81); incomplete oral bioavailability therefore resultsfrom a combination of GI tract and hepatic presystemicextraction (Fig. 38.11). For low-clearance CYP3A substrateshaving oral bioavailability in the range of 80% to 90% orgreater (e.g., alprazolam), the contribution of the GI tractis apparently small.
Inhibition and induction by other drugs or chemicalsmay modify CYP3A activity both in vitro and in vivo (Table38.4). Identification of these compounds is of clear clinicalimportance, because it may allow anticipating of drug inter-actions that may be either potentially hazardous or of thera-peutic benefit (6–9,65,69,79–85). Inhibiting drugs mayalso be used for investigating the relative contribution ofCYP3A to net clearance, or for distinguishing the contribu-tion of hepatic and GI tract CYP3A to overall presystemicextraction (81). Among the most potent CYP3A inhibitorsare the azole antifungal agents (ketoconazole, itraconazole,fluconazole), the antidepressants nefazodone and fluvoxa-mine, and the calcium channel antagonists verapamil anddiltiazem. These compounds produce ‘‘reversible’’ inhibi-tion, by a competitive, noncompetitive, or mixed mecha-nism. Other potent inhibitors, such as the macrolide anti-microbials erythromycin and clarithromycin produce‘‘mechanism-based’’ inhibition via a metabolic intermediatethat complexes with and inactivates the CYP3A enzyme (86,87). The HIV protease inhibitor ritonavir and the nonnu-
TABLE 38.4. REPRESENTATIVE DRUGS HAVINGCLINICALLY IMPORTANT EFFECTS ON THEHUMAN CYP ENZYMES
Drug Inhibition of: Induction of:
Azole antifungalsKetoconazole CYP3AItraconazole CYP3AFluconazole CYP3A, 2C9Terbinafine CYP2D6
AntidepressantsFluoxetine CYP2D6Paroxetine CYP2D6Fluvoxamine CYP1A2, 2C19, 3ANefazodone CYP3ASt. John's wort CYP3A
AntipsychoticsPerphenazine CYP2D6
AnticonvulsantsCarbamazepine CYP3A
AntithromboticsTiclopidine CYP2D6, 2C19
AntiinfectivesErythromycin CYP3AClarithromycin CYP3ACiprofloxacin CYP1A2Rifampin CYP3A
Viral protease inhibitorsRitonavir CYP3A CYP3A
Nonnucleoside reverse transcriptase inhibitorsDelavirdine CYP3ANevirapine CYP3A
Cardiovascular agentsQuinidine CYP2D6Diltiazem CYP3AVerapamil CYP3A
Antiulcer agentsCimetidine CYP3AOmeprazole CYP2C19
cleoside reverse transcriptase inhibitor delavirdine also arepotent CYP3A inhibitors (88–91). A component of grape-fruit juice inhibits CYP3A in the GI tract (92). Inducersof CYP3A include carbamazepine, rifampin, phenobarbital,nevirapine, dexamethasone, St. John’s wort, and possiblyvenlafaxine. Ritonavir is an inducer as well as an inhibitor,yielding a net effect on CYP3A metabolism that is difficultto predict (88–91,93–95).
Variability among individuals in CYP3A activity is sub-stantial, even when relatively homogeneous groups ofhealthy subjects are studied. A consistent finding in popula-tion studies of CYP3A activity is that distributions are uni-modal, without evidence of genetic polymorphic regulation(96,97). However, several studies of CYP3A substrates havedemonstrated a small number of individuals with unusuallylow clearance (96,98). The explanation for these observa-tions is unclear, but the genomic determinants of such indi-vidual variations in clinical CYP3A activity have become
Neuropsychopharmacology: The Fifth Generation of Progress516
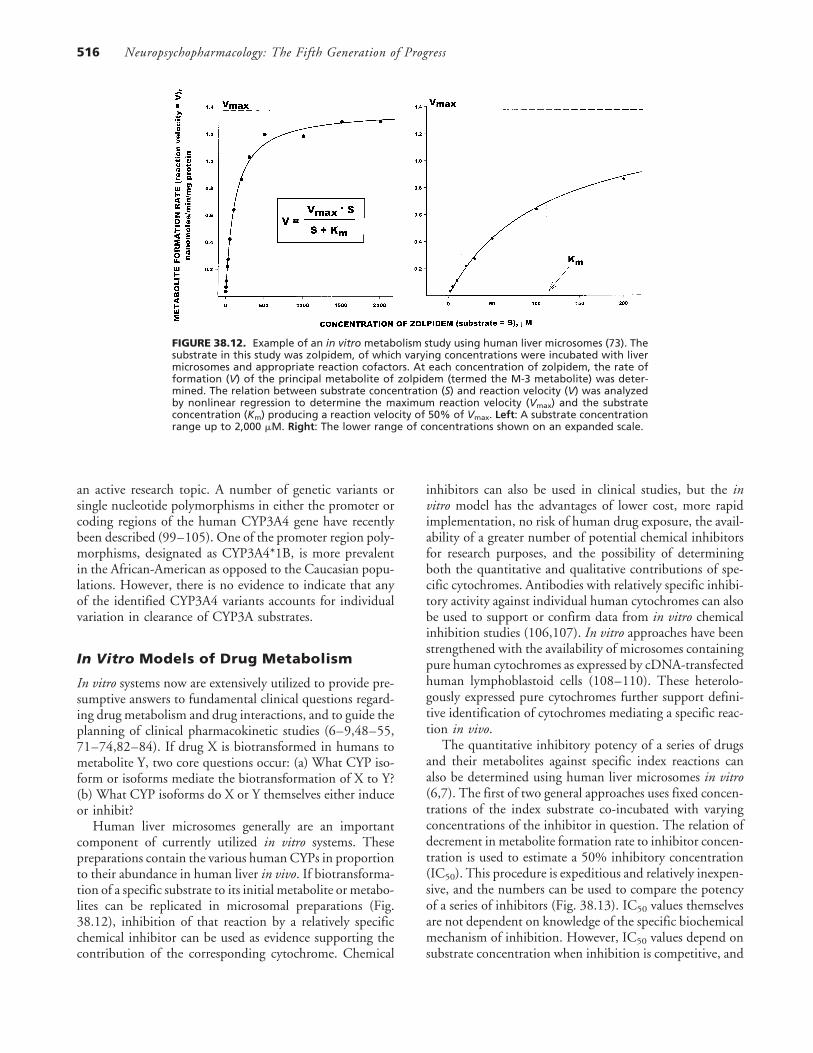
FIGURE 38.12. Example of an in vitro metabolism study using human liver microsomes (73). Thesubstrate in this study was zolpidem, of which varying concentrations were incubated with livermicrosomes and appropriate reaction cofactors. At each concentration of zolpidem, the rate offormation (V) of the principal metabolite of zolpidem (termed the M-3 metabolite) was deter-mined. The relation between substrate concentration (S) and reaction velocity (V) was analyzedby nonlinear regression to determine the maximum reaction velocity (Vmax) and the substrateconcentration (Km) producing a reaction velocity of 50% of Vmax. Left: A substrate concentrationrange up to 2,000 �M. Right: The lower range of concentrations shown on an expanded scale.
an active research topic. A number of genetic variants orsingle nucleotide polymorphisms in either the promoter orcoding regions of the human CYP3A4 gene have recentlybeen described (99–105). One of the promoter region poly-morphisms, designated as CYP3A4*1B, is more prevalentin the African-American as opposed to the Caucasian popu-lations. However, there is no evidence to indicate that anyof the identified CYP3A4 variants accounts for individualvariation in clearance of CYP3A substrates.
In Vitro Models of Drug Metabolism
In vitro systems now are extensively utilized to provide pre-sumptive answers to fundamental clinical questions regard-ing drug metabolism and drug interactions, and to guide theplanning of clinical pharmacokinetic studies (6–9,48–55,71–74,82–84). If drug X is biotransformed in humans tometabolite Y, two core questions occur: (a) What CYP iso-form or isoforms mediate the biotransformation of X to Y?(b) What CYP isoforms do X or Y themselves either induceor inhibit?
Human liver microsomes generally are an importantcomponent of currently utilized in vitro systems. Thesepreparations contain the various human CYPs in proportionto their abundance in human liver in vivo. If biotransforma-tion of a specific substrate to its initial metabolite or metabo-lites can be replicated in microsomal preparations (Fig.38.12), inhibition of that reaction by a relatively specificchemical inhibitor can be used as evidence supporting thecontribution of the corresponding cytochrome. Chemical
inhibitors can also be used in clinical studies, but the invitro model has the advantages of lower cost, more rapidimplementation, no risk of human drug exposure, the avail-ability of a greater number of potential chemical inhibitorsfor research purposes, and the possibility of determiningboth the quantitative and qualitative contributions of spe-cific cytochromes. Antibodies with relatively specific inhibi-tory activity against individual human cytochromes can alsobe used to support or confirm data from in vitro chemicalinhibition studies (106,107). In vitro approaches have beenstrengthened with the availability of microsomes containingpure human cytochromes as expressed by cDNA-transfectedhuman lymphoblastoid cells (108–110). These heterolo-gously expressed pure cytochromes further support defini-tive identification of cytochromes mediating a specific reac-tion in vivo.
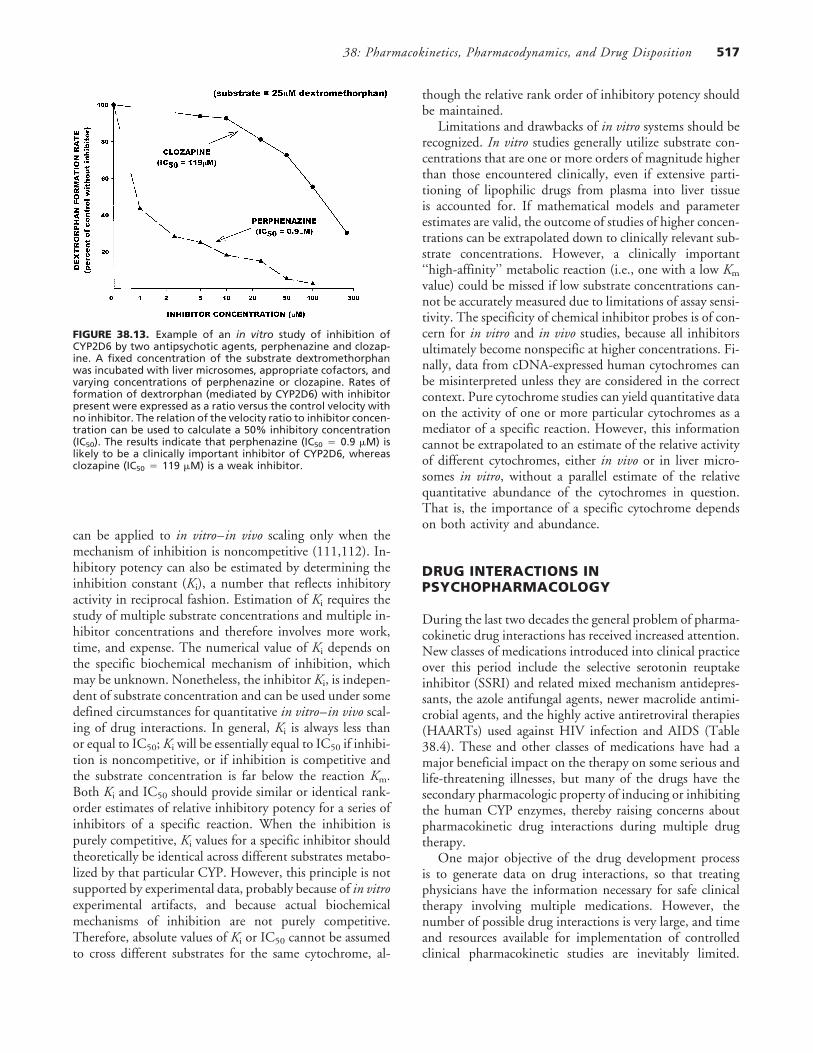
The quantitative inhibitory potency of a series of drugsand their metabolites against specific index reactions canalso be determined using human liver microsomes in vitro(6,7). The first of two general approaches uses fixed concen-trations of the index substrate co-incubated with varyingconcentrations of the inhibitor in question. The relation ofdecrement in metabolite formation rate to inhibitor concen-tration is used to estimate a 50% inhibitory concentration(IC50). This procedure is expeditious and relatively inexpen-sive, and the numbers can be used to compare the potencyof a series of inhibitors (Fig. 38.13). IC50 values themselvesare not dependent on knowledge of the specific biochemicalmechanism of inhibition. However, IC50 values depend onsubstrate concentration when inhibition is competitive, and
38: Pharmacokinetics, Pharmacodynamics, and Drug Disposition 517
FIGURE 38.13. Example of an in vitro study of inhibition ofCYP2D6 by two antipsychotic agents, perphenazine and clozap-ine. A fixed concentration of the substrate dextromethorphanwas incubated with liver microsomes, appropriate cofactors, andvarying concentrations of perphenazine or clozapine. Rates offormation of dextrorphan (mediated by CYP2D6) with inhibitorpresent were expressed as a ratio versus the control velocity withno inhibitor. The relation of the velocity ratio to inhibitor concen-tration can be used to calculate a 50% inhibitory concentration(IC50). The results indicate that perphenazine (IC50 � 0.9 �M) islikely to be a clinically important inhibitor of CYP2D6, whereasclozapine (IC50 � 119 �M) is a weak inhibitor.
can be applied to in vitro–in vivo scaling only when themechanism of inhibition is noncompetitive (111,112). In-hibitory potency can also be estimated by determining theinhibition constant (Ki), a number that reflects inhibitoryactivity in reciprocal fashion. Estimation of Ki requires thestudy of multiple substrate concentrations and multiple in-hibitor concentrations and therefore involves more work,time, and expense. The numerical value of Ki depends onthe specific biochemical mechanism of inhibition, whichmay be unknown. Nonetheless, the inhibitor Ki, is indepen-dent of substrate concentration and can be used under somedefined circumstances for quantitative in vitro–in vivo scal-ing of drug interactions. In general, Ki is always less thanor equal to IC50; Ki will be essentially equal to IC50 if inhibi-tion is noncompetitive, or if inhibition is competitive andthe substrate concentration is far below the reaction Km.Both Ki and IC50 should provide similar or identical rank-order estimates of relative inhibitory potency for a series ofinhibitors of a specific reaction. When the inhibition ispurely competitive, Ki values for a specific inhibitor shouldtheoretically be identical across different substrates metabo-lized by that particular CYP. However, this principle is notsupported by experimental data, probably because of in vitroexperimental artifacts, and because actual biochemicalmechanisms of inhibition are not purely competitive.Therefore, absolute values of Ki or IC50 cannot be assumedto cross different substrates for the same cytochrome, al-
though the relative rank order of inhibitory potency shouldbe maintained.
Limitations and drawbacks of in vitro systems should berecognized. In vitro studies generally utilize substrate con-centrations that are one or more orders of magnitude higherthan those encountered clinically, even if extensive parti-tioning of lipophilic drugs from plasma into liver tissueis accounted for. If mathematical models and parameterestimates are valid, the outcome of studies of higher concen-trations can be extrapolated down to clinically relevant sub-strate concentrations. However, a clinically important‘‘high-affinity’’ metabolic reaction (i.e., one with a low Km
value) could be missed if low substrate concentrations can-not be accurately measured due to limitations of assay sensi-tivity. The specificity of chemical inhibitor probes is of con-cern for in vitro and in vivo studies, because all inhibitorsultimately become nonspecific at higher concentrations. Fi-nally, data from cDNA-expressed human cytochromes canbe misinterpreted unless they are considered in the correctcontext. Pure cytochrome studies can yield quantitative dataon the activity of one or more particular cytochromes as amediator of a specific reaction. However, this informationcannot be extrapolated to an estimate of the relative activityof different cytochromes, either in vivo or in liver micro-somes in vitro, without a parallel estimate of the relativequantitative abundance of the cytochromes in question.That is, the importance of a specific cytochrome dependson both activity and abundance.
DRUG INTERACTIONS INPSYCHOPHARMACOLOGY
During the last two decades the general problem of pharma-cokinetic drug interactions has received increased attention.New classes of medications introduced into clinical practiceover this period include the selective serotonin reuptakeinhibitor (SSRI) and related mixed mechanism antidepres-sants, the azole antifungal agents, newer macrolide antimi-crobial agents, and the highly active antiretroviral therapies(HAARTs) used against HIV infection and AIDS (Table38.4). These and other classes of medications have had amajor beneficial impact on the therapy on some serious andlife-threatening illnesses, but many of the drugs have thesecondary pharmacologic property of inducing or inhibitingthe human CYP enzymes, thereby raising concerns aboutpharmacokinetic drug interactions during multiple drugtherapy.
One major objective of the drug development processis to generate data on drug interactions, so that treatingphysicians have the information necessary for safe clinicaltherapy involving multiple medications. However, thenumber of possible drug interactions is very large, and timeand resources available for implementation of controlledclinical pharmacokinetic studies are inevitably limited.
Neuropsychopharmacology: The Fifth Generation of Progress518
Some needed studies will therefore be postponed until aftera new drug is marketed, and some studies may be bypassedaltogether. As discussed above, in vitro data are becomingincreasingly important as a resource for identifying proba-ble, possible, or unlikely drug interactions, and thereby en-couraging rational planning and allocation of resources tomore definitive clinical studies.
Pharmacokinetic VersusPharmacodynamic Drug Interactions
A pharmacokinetic interaction implies that the drug pro-ducing the interaction (the ‘‘perpetrator’’) causes a changein the metabolic clearance of the drug being affected bythe interaction (the ‘‘victim’’), in turn either decreasing orincreasing concentrations of the victim drug in plasma andpresumably also at the site of action. This change may ormay not alter the clinical activity of the victim drug. Onepharmacokinetic interaction variant involves modificationby the perpetrator of the victim drug’s access to its pharma-cologic receptor site, without changing the systemic clear-ance or plasma levels of the victim. A familiar example isthe antagonism of benzodiazepine agonist activity by fluma-zenil; a less familiar example is benzodiazepine receptor an-tagonism by ketoconazole (113).
A pharmacodynamic interaction involves either inhibi-tion or enhancement of the clinical effects of the victimdrug as a result of similar or identical end-organ actions.Examples are the increase or decrease of the sedative-hyp-notic actions of benzodiazepines due to coadministrationof ethanol or caffeine, respectively.
Mechanisms of Inhibition VersusInduction of Metabolism
Drug interactions due to inhibition as opposed to inductionof CYP-mediated metabolism involve mechanistically dif-ferent processes. Chemical inhibition is an immediate phe-nomenon that becomes evident as soon as the inhibitorcomes in contact with the enzyme, and is in principle revers-ible when the inhibitor is no longer present [an exceptionis ‘‘mechanism-based’’ inhibition (86)]. The magnitude ofinhibition depends on the inhibitor concentration at thesite of the enzyme in relation to the intrinsic potency ofthe inhibitor. In vitro systems can be used to develop quanti-tative estimates of inhibitory potency, such as the inhibitionconstant (Ki) or the 50% inhibitory concentration (IC50)(Fig. 38.13). However, application of Ki or IC50 values fromin vitro systems to quantitative predictions of drug interac-tions in vivo is not straightforward, and requires knowledgeof the effective concentration of inhibitor that is availableto the enzyme. A generally applicable scheme for relatingtotal or unbound plasma concentrations of inhibitor to ef-fective enzyme-available concentration has not been estab-
lished. In any case, the theoretical assumption that unboundplasma concentrations are equal to enzyme-available intra-hepatic concentrations is incorrect in reality, and may yieldunderestimates of observed in vivo drug interactions by asmuch as an order of magnitude or more (8,83,85).
Induction of CYP-mediated metabolism requires priorexposure to a chemical inducer, which signals the syntheticmechanisms to upregulate the production of one or moreCYP isoforms (114–118). This process takes time, and theincrease in CYP activity is of slow onset following initiationof exposure to the inducer, and slowly reverts to baselineafter the inducer is removed. Increased CYP expression/activity due to chemical induction therefore reflects priorbut not necessarily current exposure to the inducer. Theextent of CYP induction probably depends on the dosage(concentration) of the inducer and on the duration of expo-sure. Induction, unlike inhibition, is not easily studied invitro, because induction requires intact cellular protein syn-thesis mechanisms as are available in cell culture models.
Inducers and inhibitors of CYP3A can be expected toinfluence both hepatic and gastrointestinal CYP3A, al-though not necessarily to the same extent. Very strong in-hibitors (such as ketoconazole) or very strong inducers (suchas rifampin) will produce substantial changes in both he-patic and gastrointestinal CYP3A. A uniquely complex situ-ation arises for ritonavir, which is both an inhibitor andinducer of CYP3A. Interactions of ritonavir with CYP3Asubstrate drugs will be time dependent. Initial exposure willproduce CYP3A inhibition, but as the duration of exposureproceeds, CYP3A induction may offset the inhibitory effectsof acute exposure. The net outcome typically is unpredict-able and variable across individuals (93–95).
Perspectives on the Clinical Importanceof Drug Interactions
Based on the prevalence of polypharmacy in clinical prac-tice, noninteractions of drugs are far more common thaninteractions. Coadministration of two drugs usually pro-duces no detectable pharmacokinetic or pharmacodynamicinteraction, and the pharmacokinetic disposition and clini-cal activity of each drug proceed independently of eachother. A less common outcome of drug coadministration isa kinetic interaction that could be detected in controlledlaboratory circumstances, but that is not clinically impor-tant in usual therapeutic circumstances because (a) the inter-action, whether or not statistically significant, is not largeenough to produce a clinically important change in dynam-ics of the victim drug; (b) the therapeutic index of the victimdrug is large enough so that even a substantial change inplasma levels will not alter therapeutic effects or toxicity;or (c) kinetics and response to the victim drug are so variablethat changes in plasma levels due to the drug interactionare far less important than inherent variability. Even lesscommon are clinically important interactions that require
38: Pharmacokinetics, Pharmacodynamics, and Drug Disposition 519
modification in dosage of the perpetrator, the victim, orboth. Finally, the most unusual consequence of a drug inter-action is a hazardous and contraindicated combination, asin the case of ketoconazole and terfenadine. These situationsare rare, but unfortunately receive excessive attention in thepublic media.
Many secondary sources and compendia are available assummary guides to the extensive literature on drug interac-tions, but these sources do not necessarily assist cliniciansin deciding which interactions should generate serious con-cern in the course of drug therapy. A useful general guidelineis that drug interactions are more likely to be importantwhen (a) the perpetrator drug is a powerful inducer or inhib-itor, and produces a very large change in the kinetics andplasma levels of the victim drug; or (b) the therapeutic indexof the victim is narrow. Case (a) is exemplified by powerfulinducers or inhibitors of CYP3A (ketoconazole, ritonavir,rifampin) coadministered with CYP3A substrates, or power-ful inhibitors of CYP2D6 (quinidine, fluoxetine, parox-etine) coadministered with CYP2D6 substrates. Case (b) isexemplified by victim drugs such as phenytoin, warfarin,and digoxin, for which small changes in plasma levels couldhave important clinical consequences.
Application of Kinetic-Dynamic Methodsto Study Drug Interactions
Drug interaction study protocols often incorporate pharma-codynamic endpoints to allow estimating the clinical conse-quences of drug interactions along with the usual pharmaco-kinetic outcome measures. The level of complexity of anintegrated kinetic-dynamic study depends on the nature ofthe pharmacodynamic actions of the drug under study aswell as the type of pharmacodynamic outcome measuresthat are required. A number of methodologic principles anddilemmas are illustrated by kinetic-dynamic design optionsfor drug interaction studies involving sedative-hypnotic andanxiolytic drugs acting on the �-aminobutyric acid(GABA)-benzodiazepine receptor system.
Biotransformation of the benzodiazepine triazolam is de-pendent on the activity of human CYP3A isoforms (119).Metabolism is strongly inhibited in vitro and in vivo byCYP3A inhibitors such as ketoconazole, itraconazole, rito-navir, and nefazodone (95,119–122). Some, but not all, ofthe macrolide antimicrobial agents also are CYP3A inhibi-tors via ‘‘mechanism-based’’ inhibition, in which the par-ent compound binds to the metabolically active site onthe CYP3A enzyme, yielding a metabolic intermediatethat inactivates the enzyme (86,87). We tested the inhibi-tory potency of four macrolide antimicrobial agents[troleandomycin (TAO), erythromycin, clarithromycin,azithromycin] versus triazolam hydroxylation using humanliver microsomes in vitro (123). Appropriate mean IC50 val-ues were TAO, 3.6 �M; erythromycin, 30 �M; and clar-ithromycin, 28 �M. These values indicate that all three
compounds produce substantial in vitro inhibition of triazo-lam hydroxylation and have the potential to produce a sig-nificant interaction with triazolam in vivo. However,azithromycin was a very weak inhibitor of triazolam in vitro(IC50 �250 �M), and is anticipated to produce no signifi-cant interaction in vivo.
In a clinical pharmacokinetic-pharmacodynamic study(123), a series of healthy volunteers were exposed to thefollowing treatment conditions:
A. Triazolam placebo plus macrolide placeboB. Triazolam (0.125 mg) plus macrolide placeboC. Triazolam (0.125 mg) plus azithromycinD. Triazolam (0.125 mg) plus erythromycinE. Triazolam (0.125 mg) plus clarithromycin
Dosage schedules of the coadministered macrolides werechosen to be consistent with usual dosage recommenda-tions. The five trials were randomized in sequence, and thetreatment conditions were double-blind.
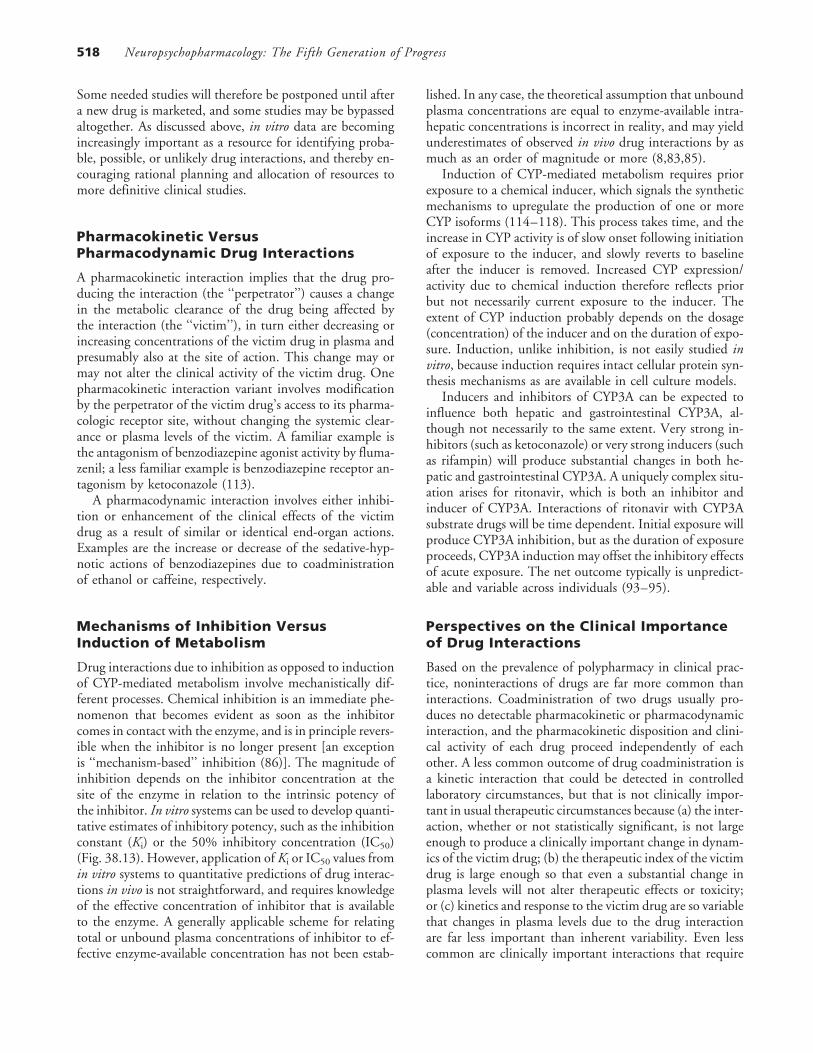
Following each dose of triazolam (or placebo to matchtriazolam), multiple venous blood samples were drawn overa period of 24 hours, and multiple pharmacodynamic test-ing procedures were performed. Triazolam plasma concen-trations were determined by gas chromatography with elec-tron capture detection (Fig. 38.14).
FIGURE 38.14. Mean plasma triazolam concentrations followingsingle 0.125-mg doses of triazolam during trials B, C, D, and E.Note that coadministration of triazolam with azithromycin (AZI,trial C) produced plasma levels nearly identical to triazolam ad-ministered with placebo (PL, trial B). However, coadministrationwith erythromycin (ERY, trial D) or clarithromycin (CLAR, trial E)produced a large increase in plasma triazolam concentrations.(Adapted in part from Greenblatt DJ, von Moltke LL, Harmatz JS,et al. Inhibition of triazolam clearance by macrolide antimicrobialagents: in vitro correlates and dynamic consequences. Clin Phar-macol Ther 1998;64:278–285, with permission.)
Neuropsychopharmacology: The Fifth Generation of Progress520
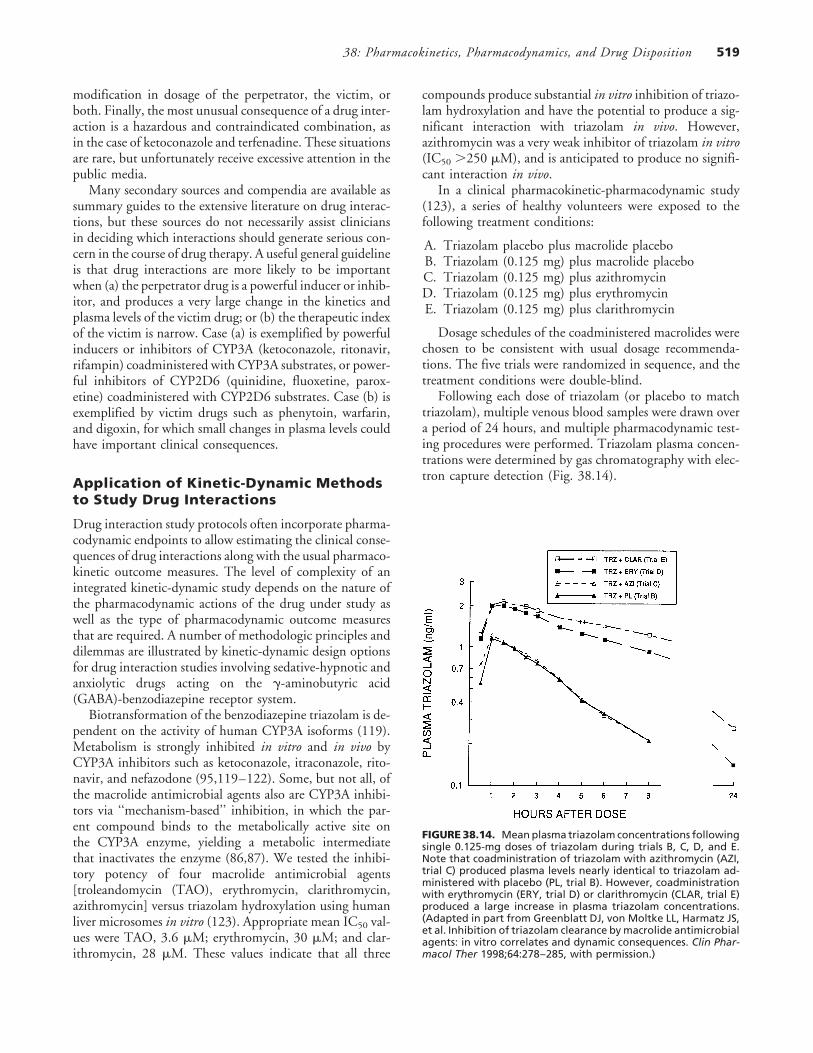
FIGURE 38.15. Mean (� standarderror, SE) 4-hour pharmacodynamiceffect areas for the digit-symbol sub-stitution test (DSST) score (left), andfor the EEG beta amplitude (right),during the five trials. Note that decre-ments in DSST score, and increases inEEG beta amplitude, were very similarbetween trials B and C, whereas ef-fects were significantly enhancedduring trials D and E.
Mean clearance of triazolam during trials B and C wasnearly identical (413 and 416 mL/min, respectively); thatis, coadministration of azithromycin had no effect on thepharmacokinetics of triazolam (Fig. 38.14). However, tria-zolam clearance was significantly reduced to 146 mL/minby erythromycin (trial D), and to 95 mL/min by clarithro-mycin (trial E) (Fig. 38.14). Thus the in vivo kinetic resultsare highly consistent with the in vitro data.
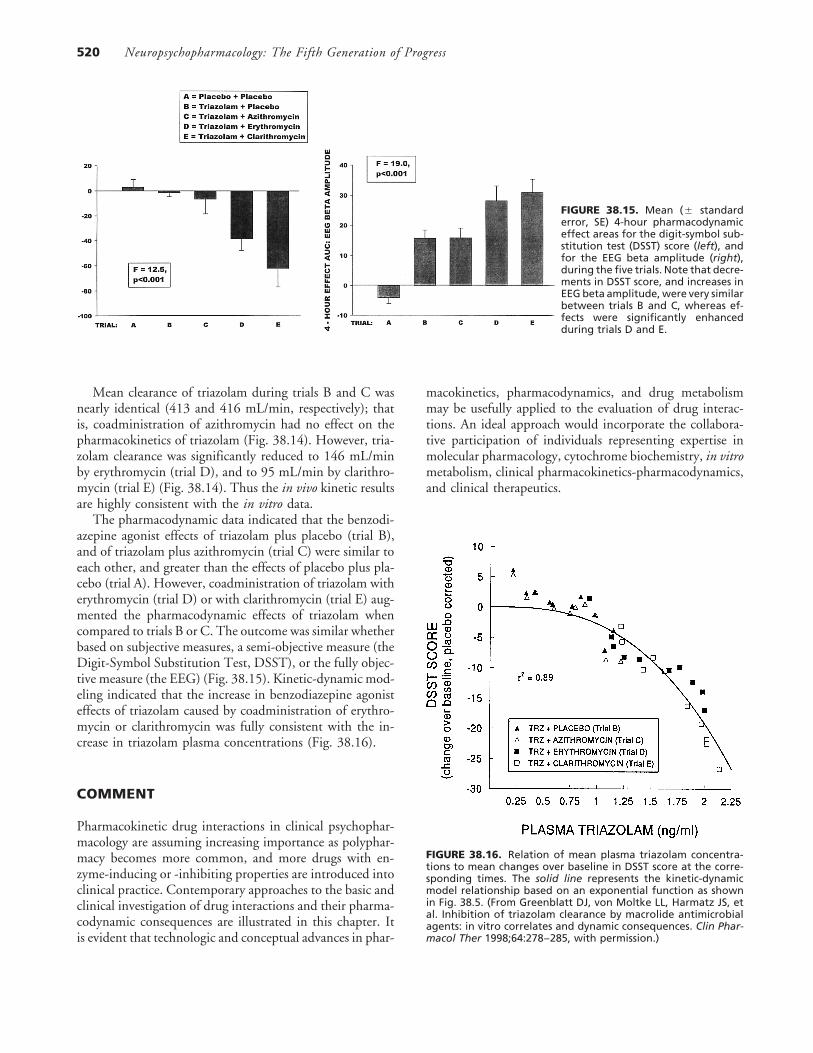
The pharmacodynamic data indicated that the benzodi-azepine agonist effects of triazolam plus placebo (trial B),and of triazolam plus azithromycin (trial C) were similar toeach other, and greater than the effects of placebo plus pla-cebo (trial A). However, coadministration of triazolam witherythromycin (trial D) or with clarithromycin (trial E) aug-mented the pharmacodynamic effects of triazolam whencompared to trials B or C. The outcome was similar whetherbased on subjective measures, a semi-objective measure (theDigit-Symbol Substitution Test, DSST), or the fully objec-tive measure (the EEG) (Fig. 38.15). Kinetic-dynamic mod-eling indicated that the increase in benzodiazepine agonisteffects of triazolam caused by coadministration of erythro-mycin or clarithromycin was fully consistent with the in-crease in triazolam plasma concentrations (Fig. 38.16).
COMMENT
Pharmacokinetic drug interactions in clinical psychophar-macology are assuming increasing importance as polyphar-macy becomes more common, and more drugs with en-zyme-inducing or -inhibiting properties are introduced intoclinical practice. Contemporary approaches to the basic andclinical investigation of drug interactions and their pharma-codynamic consequences are illustrated in this chapter. Itis evident that technologic and conceptual advances in phar-
macokinetics, pharmacodynamics, and drug metabolismmay be usefully applied to the evaluation of drug interac-tions. An ideal approach would incorporate the collabora-tive participation of individuals representing expertise inmolecular pharmacology, cytochrome biochemistry, in vitrometabolism, clinical pharmacokinetics-pharmacodynamics,and clinical therapeutics.
FIGURE 38.16. Relation of mean plasma triazolam concentra-tions to mean changes over baseline in DSST score at the corre-sponding times. The solid line represents the kinetic-dynamicmodel relationship based on an exponential function as shownin Fig. 38.5. (From Greenblatt DJ, von Moltke LL, Harmatz JS, etal. Inhibition of triazolam clearance by macrolide antimicrobialagents: in vitro correlates and dynamic consequences. Clin Phar-macol Ther 1998;64:278–285, with permission.)
38: Pharmacokinetics, Pharmacodynamics, and Drug Disposition 521
ACKNOWLEDGMENTS
The work was supported by grants MH-34223, MH-01237, DA-05258, DA-13209, MH-58435, DK-58496,and RR-00054 from the U.S. Department of Health andHuman Services.
REFERENCES
1. Stanski DR. Pharmacodynamic modeling of anesthetic EEGdrug effects. Annu Rev Pharmacol Toxicol 1992;32:423–447.
2. Derendorf H, Meibohm B.Modeling of pharmacokinetic/phar-macodynamic (PK/PD) relationships: concepts and perspec-tives. Pharm Res 1999;16:176–185.
3. Bellissant E, Sebille V, Paintaud G. Methodological issues inpharmacokinetic-pharmacodynamic modelling. Clin Pharma-cokinet 1998;35:151–166.
4. Mandema JW, Danhof M. Electroencephalogram effect mea-sures and relationships between pharmacokinetics and pharma-codynamics of centrally acting drugs. Clin Pharmacokinet 1992;23:191–215.
5. Laurijssens BE, Greenblatt DJ. Pharmacokinetic-pharmacody-namic relationships for benzodiazepines. Clin Pharmacokinet1996;30:52–76.
6. Greenblatt DJ, von Moltke LL, Harmatz JS, et al. Human cyto-chromes and some newer antidepressants: kinetics, metabolism,and drug interactions. J Clin Psychopharmacol 1999;19(suppl1):23S–35S.
7. Greenblatt DJ, von Moltke LL, Harmatz JS, et al. Drug interac-tions with newer antidepressants: role of human cytochromesP450. J Clin Psychiatry 1998;59(suppl 15):19–27.
8. von Moltke LL, Greenblatt DJ, Schmider J, et al. In vitro ap-proaches to predicting drug interactions in vivo. Biochem Phar-macol 1998;55:113–122.
9. Bertz RJ, Granneman GR. Use of in vitro and in vivo data toestimate the likelihood of metabolic pharmacokinetic interac-tions. Clin Pharmacokinet 1997;32:210–258.
10. Whiting B, Kelman AW, Grevel J. Population pharmacoki-netics. Theory and clinical application. Clin Pharmacokinet1986;11:387–401.
11. Vozeh S, Steimer JL, Rowland M, et al. The use of populationpharmacokinetics in drug development. Clin Pharmacokinet1996;30:81–93.
12. Maitre PO, Buhrer M, Thomson D, et al. A three-step approachcombining Bayesian regression and NONMEM populationanalysis: application to midazolam. J Pharmacokinet Biopharm1991;19:377–384.
13. Thomson AH, Whiting B. Bayesian parameter estimation andpopulation pharmacokinetics. Clin Pharmacokinet 1992;22:447–467.
14. Jonsson EN, Wade JR, Karlsson MO. Comparison of somepractical sampling strategies for population pharmacokineticstudies. J Pharmacokinet Biopharm 1996;24:245–263.
15. Carter AA, Rosenbaum SE, Dudley MN. Review of methodsin population pharmacokinetics. Clin Res Regul Affairs 1995;12:1–21.
16. Samara E, Granneman R. Role of population pharmacokineticsin drug development: a pharmaceutical industry perspective.Clin Pharmacokinet 1997;32:294–312.
17. Sheiner LB, Ludden TM. Population pharmacokinetics/dynam-ics. Annu Rev Pharmacol Toxicol 1992;32:185–209.
18. Aarons L. Population pharmacokinetics: theory and practice.Br J Clin Pharmacol 1991;32:669–670.
19. de Gatta MMF, Garcıa MJ, Lanao JM, et al. Bayesian forecast-ing in paediatric populations. Clin Pharmacokinet 1996;31:325–330.
20. Shader RI, Harmatz JS, Oesterheld JR, et al. Population phar-macokinetics of methylphenidate in children with attention-deficit hyperactivity disorder. J Clin Pharmacol 1999;39:775–785.
21. Safer DJ. Central stimulant treatment of childhood attentiondeficit hyperactivity disorder. CNS Drugs 1997;7:264–272.
22. Elia J, Ambrosini PJ, Rapoport JL. Treatment of attention-deficit-hyperactivity disorder. N Engl J Med 1999;340:780–788.
23. Cyr M, Brown CS. Current drug therapy recommendations forthe treatment of attention deficit hyperactivity disorder. Drugs1998;56:215–233.
24. Wilens TE, Biederman J, Spencer TJ. Pharmacotherapy of at-tention deficit hyperactivity disorder in adults. CNS Drugs1998;9:347–356.
25. Kimko HC, Cross JT, Abernethy DR. Pharmacokinetics andclinical effectiveness of methylphenidate. Clin Pharmacokinet1999;37:457–470.
26. Srinivas NR, Hubbard JW, Quinn D, et al. Enantioselectivepharmacokinetics and pharmacodynamics of dl-threo-methyl-phenidate in children with attention deficit hyperactivity disor-der. Clin Pharmacol Ther 1992;52:561–568.
27. Schwinghammer TL, Kroboth PD. Basic concepts in pharmaco-dynamic modeling. J Clin Pharmacol 1988;28:388–394.
28. Holford NH, Sheiner LB. Understanding the dose-effect rela-tionship: clinical application of pharmacokinetic-pharmacody-namic models. Clin Pharmacokinet 1981;6:429–453.
29. Swerdlow BN, Holley FO. Intravenous anaesthetic agents.Pharmacokinetic-pharmacodynamic relationships. Clin Phar-macokinet 1987;12:79–110.
30. Dingemanse J, Danhof M, Breimer DD. Pharmacokinetic-pharmacodynamic modeling of CNS drug effects: an overview.Pharmacol Ther 1988;38:1–52.
31. Campbell DB. The use of kinetic-dynamic interactions in theevaluation of drugs. Psychopharmacology 1990;100:433–450.
32. Greenblatt DJ, Harmatz JS. Kinetic-dynamic modeling in clini-cal psychopharmacology. J Clin Psychopharmacol 1993;13:231–234.
33. Greenblatt DJ, von Moltke LL, Ehrenberg BL, et al. Kineticsand dynamics of lorazepam during and after continuous intrave-nous infusion. Crit Care Med 2000;28:2750–2757.
34. Greenblatt DJ, Ehrenberg BL, Gunderman J, et al. Kinetic anddynamic study of intravenous lorazepam: comparison with in-travenous diazepam. J Pharmacol Exp Ther 1989;250:134–140.
35. Greenblatt DJ, Ehrenberg BL, Gunderman J, et al. Pharmacoki-netic and electroencephalographic study of intravenous diaze-pam, midazolam, and placebo. Clin Pharmacol Ther 1989;45:356–365.
36. Gupta SK, Ellinwood EH, Nikaido AM, et al. Simultaneousmodeling of the pharmacokinetic and pharmacodynamic prop-erties of benzodiazepines. I: Lorazepam. J Pharmacokinet Bio-pharm 1990;18:89–102.
37. Tedeschi G, Smith AT, Dhillon S, et al. Rate of entrance ofbenzodiazepines into the brain determined by eye movementrecording. Br J Clin Pharmacol 1983;15:103–107.
38. Greenblatt DJ, Sethy VH. Benzodiazepine concentrations inbrain directly reflect receptor occupancy: studies of diazepam,lorazepam, and oxazepam. Psychopharmacology 1990;102:373–378.
Neuropsychopharmacology: The Fifth Generation of Progress522
39. Walton NY, Treiman DM. Lorazepam treatment of experimen-tal status epilepticus in the rat: relevance to clinical practice.Neurology 1990;40:990–994.
40. Ameer B, Greenblatt DJ. Lorazepam: a review of its clinicalpharmacological properties and therapeutic uses. Drugs 1981;21:161–200.
41. Greenblatt DJ. Clinical pharmacokinetics of oxazepam and lor-azepam. Clin Pharmacokinet 1981;6:88–105.
42. Ochs HR, Greenblatt DJ, Knuchel M. Kinetics of diazepam,midazolam, and lorazepam in cigarette smokers. Chest 1985;87:223–226.
43. Abernethy DR, Greenblatt DJ, Ameer B, et al. Probenecid im-pairment of acetaminophen and lorazepam clearance: direct in-hibition of ether glucuronide formation. J Pharmacol Exp Ther1985;234:345–349.
44. Abernethy DR, Greenblatt DJ, Divoll M, et al. Differentialeffect of cimetidine on drug oxidation (antipyrine and diaze-pam) versus conjugation (acetaminophen and lorazepam): pre-vention of acetaminophen toxicity by cimetidine. J PharmacolExp Ther 1983;224:508–513.
45. Greenblatt DJ, Allen MD, Locniskar A, et al. Lorazepam kinet-ics in the elderly. Clin Pharmacol Ther 1979;26:103–113.
46. Treiman DM. The role of benzodiazepines in the managementof status epilepticus. Neurology 1990;40(suppl 2):32–42.
47. Lowenstein DH, Alldredge BK. Status epilepticus. N Engl JMed 1998;338:970–976.
48. Clarke SE. In vitro assessment of human cytochrome P450.Xenobiotica 1998;28:1167–1202.
49. Smith G, Stubbins MJ, Harries LW, et al. Molecular geneticsof the human cytochrome P450 monooxygenase superfamily.Xenobiotica 1998;28:1129–1165.
50. Smith DA, Abel SM, Hyland R, et al. Human cytochromeP450s: selectivity and measurement in vivo. Xenobiotica 1998;28:1095–1128.
51. Nelson DR, Koymans L, Kamataki T, et al. P450 superfamily:update on new sequences, gene mapping, accession numbersand nomenclature. Pharmacogenetics 1996;6:1–42.
52. Park BK, Pirmohamed M, Kitteringham NR. The role of cyto-chrome P450 enzymes in hepatic and extrahepatic human drugtoxicity. Pharmacol Ther 1995;68:385–424.
53. Wrighton SA, Stevens JC. The human hepatic cytochromesP450 involved in drug metabolism. Crit Rev Toxicol 1992;22:1–21.
54. Glue P, Clement RP. Cytochrome P450 enzymes and drugmetabolism—basic concepts and methods of assessment. CellMol Neurobiol 1999;19:309–323.
55. Parkinson A. An overview of current cytochrome P450 technol-ogy for assessing the safety and efficacy of new materials. ToxicolPathol 1996;24:45–57.
56. Kroemer HK, EichelbaumM.Molecular bases and clinical con-sequences of genetic cytochrome P450 2D6 polymorphism. LifeSci 1995;56:2285–2298.
57. Nebert DW. Polymorphisms in drug-metabolizing enzymes:what is their clinical relevance and why do they exist? Am JHum Genet 1997;60:265–271.
58. Ingelman-Sundberg M, Oscarson M, McLellan RA. Polymor-phic human cytochrome P450 enzymes: an opportunity for in-dividualized drug treatment. Trends Pharmacol Sci 1999;20:342–349.
59. Bertilsson L. Geographical/interracial differences in polymor-phic drug oxidation: current state of knowledge of cytochromesP450 (CYP) 2D6 and 2C19. Clin Pharmacokinet 1995;29:192–209.
60. Bertilsson L, Dahl M-L. Polymorphic drug oxidation. CNSDrugs 1996;3:200–223.
61. Fromm MF, Kroemer HK, Eichelbaum M. Impact of P450genetic polymorphism on the first-pass extraction of cardiovas-cular and neuroactive drugs. Advanced Drug Deliv Rev 1997;27:171–199.
62. Gonzalez FJ, Meyer UA. Molecular genetics of the debrisoquin-sparteine polymorphism. Clin Pharmacol Ther 1991;50:233–238.
63. Guengerich FP. Cytochrome P-450 3A4: regulation and rolein drug metabolism. Annu Rev Pharmacol Toxicol 1999;39:1–7.
64. Dresser GK, Spence JD, Bailey DG. Pharmacokinetic-pharma-codynamic consequences and clinical relevance of cytochromeP450 3A4 inhibition. Clin Pharmacokinet 2000;38:41–57.
65. Thummel KE, Wilkinson GR. In vitro and in vivo drug interac-tions involving human CYP3A. Annu Rev Pharmacol Toxicol1998;38:389–430.
66. de Wildt SN, Kearns GL, Leeder JS, et al. Cytochrome P4503A: ontogeny and drug disposition. Clin Pharmacokinet 1999;37:485–505.
67. Ketter TA, Flockhart DA, Post RM, et al. The emerging roleof cytochrome P450 3A in psychopharmacology. J Clin Psycho-pharmacol 1995;15:387–398.
68. Maurel P. The CYP3A family. In: Ionnides C, ed. CytochromesP450. Boca Raton, FL: CRC Press, 1996:241–270.
69. von Moltke LL, Greenblatt DJ, Schmider J, et al. Metabolismof drugs by cytochrome P450 3A isoforms: implications fordrug interactions in psychopharmacology. Clin Pharmacokinet1995;29(suppl 1):33–43.
70. Shimada T, Yamazaki H, Mimura M, et al. Interindividualvariations in human liver cytochrome P-450 enzymes involvedin the oxidation of drugs, carcinogens and toxic chemicals: stud-ies with liver microsomes of 30 Japanese and 30 Caucasians. JPharmacol Exp Ther 1994;270:414–423.
71. Venkatakrishnan K, Greenblatt DJ, von Moltke LL, et al. Fivedistinct human cytochromes mediate amitriptyline N-demeth-ylation in vitro: dominance of CYP 2C19 and 3A4. J ClinPharmacol 1998;38:112–121.
72. vonMoltke LL, Greenblatt DJ, Grassi JM, et al. Citalopram anddesmethylcitalopram in vitro: human cytochromes mediatingtransformation, and cytochrome inhibitory effects. Biol Psychia-try 1999;46:839–849.
73. von Moltke LL, Greenblatt DJ, Granda BW, et al. Zolpidemmetabolism in vitro: responsible cytochromes, chemical inhibi-tors, and in vivo correlations. Br J Clin Pharmacol 1999;48:89–97.
74. von Moltke LL, Greenblatt DJ, Granda BW, et al. Nefazodone,meta-chlorophenylpiperazine, and their metabolites in vitro: cy-tochromesmediating transformation, and P450–3A4 inhibitoryactions. Psychopharmacology 1999;145:113–122.
75. Greene DS, Barbhaiya RH. Clinical pharmacokinetics of nefa-zodone. Clin Pharmacokinet 1997;33:260–275.
76. von Moltke LL, Greenblatt DJ, Schmider J, et al. Midazolamhydroxylation by human liver microsomes in vitro: inhibitionby fluoxetine, norfluoxetine, and by azole antifungal agents. JClin Pharmacol 1996;36:783–791.
77. Perloff MD, von Moltke LL, Court MH, et al. Midazolam andtriazolam biotransformation in mouse and human liver micro-somes: relative contribution of CYP3A and CYP2C9 isoforms.J Pharmacol Exp Ther 2000;292:618–628.
78. Bornemann LD, Min BH, Crews T, et al. Dose dependentpharmacokinetics of midazolam. Eur J Clin Pharmacol 1985;29:91–95.
79. Hall SD, Thummel KE,Watkins PB, et al.Molecular and physi-cal mechanisms of first-pass extraction. Drug Metab Dispos1999;27:161–166.
38: Pharmacokinetics, Pharmacodynamics, and Drug Disposition 523
80. Yuan R, Flockhart DA, Balian JD. Pharmacokinetic and phar-macodynamic consequences of metabolism-based drug interac-tions with alprazolam, midazolam, and triazolam. J Clin Phar-macol 1999;39:1109–1125.
81. Tsunoda SM, Velez RL, von Moltke LL, et al. Differentiationof intestinal and hepatic cytochrome P450 3A activity with useof midazolam as an in vivo probe: effect of ketoconazole. ClinPharmacol Ther 1999;66:461–471.
82. Lin JH, Lu AY. Inhibition and induction of cytochrome P450and the clinical implications. Clin Pharmacokinet 1998;35:361–390.
83. Venkatakrishnan K, von Moltke LL, Greenblatt DJ. Effects ofthe antifungal agents on oxidative drug metabolism in humans:clinical relevance. Clin Pharmacokinet 2000;38:111–180.
84. Ito K, Iwatsubo T, Kanamitsu S, et al. Prediction of pharmaco-kinetic alterations caused by drug-drug interactions: metabolicinteraction in the liver. Pharmacol Rev 1998;50:387–412.
85. Greenblatt DJ, von Moltke LL. Sedative-hypnotic and anxio-lytic agents. In: Levy RH, Thummel KE, Trager WF, et al.,eds. Metabolic drug interactions. Philadelphia: Lippincott Wil-liams & Wilkins, 2000:259–270.
86. Silverman R. Mechanism-based enzyme inactivators. MethodsEnzymol 1995;249:240–283.
87. Gillum JG, Israel DS, Polk RE. Pharmacokinetic drug interac-tions with antimicrobial agents. Clin Pharmacokinet 1993;25:450–482.
88. Barry M, Mulcahy F, Merry C, et al. Pharmacokinetics andpotential interactions amongst antiretroviral agents used to treatpatients with HIV infection. Clin Pharmacokinet 1999;36:289–304.
89. Malaty LI, Kuper JJ. Drug interactions of HIV protease inhibi-tors. Drug Safety 1999;20:147–169.
90. Tseng AL, Foisy MM. Significant interactions with new antiret-rovirals and psychotropic drugs. Ann Pharmacother 1999;33:461–473.
91. Hsu A, Granneman GR, Bertz RJ. Ritonavir. Clinical pharma-cokinetics and interactions with other anti-HIV agents. ClinPharmacokinet 1998;35:275–291.
92. Bailey DG, Malcom J, Arnold O, et al. Grapefruit juice–druginteractions. Br J Clin Pharmacol 1998;46:101–110.
93. Greenblatt DJ, von Moltke LL, Harmatz JS, et al. Alprazolam-ritonavir interaction: implications for product labeling. ClinPharmacol Ther 2000;67:335–341.
94. Greenblatt DJ, vonMoltke LL, Daily JP, et al. Extensive impair-ment of triazolam and alprazolam clearance by short-term low-dose ritonavir: the clinical dilemma of concurrent inhibitionand induction. J Clin Psychopharmacol 1999;19:293–296.
95. Greenblatt DJ, von Moltke LL, Harmatz JS, et al. Differentialimpairment of triazolam and zolpidem clearance by ritonavir.J AIDS 2000;24:129–136.
96. Kassai A, Toth G, EichelbaumM, et al. No evidence of a geneticpolymorphism in the oxidative metabolism of midazolam. ClinPharmacokinet 1988;15:319–325.
97. Friedman H, Greenblatt DJ, Burstein ES, et al. Populationstudy of triazolam pharmacokinetics. Br J Clin Pharmacol 1986;22:639–642.
98. Greenblatt DJ, Divoll M, Abernethy DR, et al. Reduced clear-ance of triazolam in old age: relation to antipyrine oxidizingcapacity. Br J Clin Pharmacol 1983;15:303–309.
99. Felix CA, Walker AH, Lange BJ, et al. Association of CYP3A4genotype with treatment-related leukemia. Proc Natl Acad SciUSA 1998;95:13176–13181.
100. Rebbeck TR, Jaffe JM, Walker AH, et al. Modification of clini-cal presentation of prostate tumors by a novel genetic variantin CYP3A4. J Natl Cancer Inst 1998;90:1225–1229.
101. Ball SE, Scatina A, Kao J, et al. Population distribution andeffects on drug metabolism of a genetic variant in the 5′ pro-moter region of CYP3A4. Clin Pharmacol Ther 1999;66:288–294.
102. Sata F, Sapone A, Elizondo G, Stocker P, et al. CYP3A4 allelicvariants with amino acid substitutions in exons 7 and 12: Evi-dence for an allelic variant with altered catalytic activity. ClinPharmacol Ther 2000;67:48–56.
103. von Moltke LL, Tran TH, Cotreau MM, et al. Unusually lowclearance of two CYP3A4 substrates, alprazolam and trazodone,in a volunteer subject with wild-type CYP3A promoter region.J Clin Pharmacol 2000;40:200–204.
104. Westlind A, Lofberg L, Tindberg N, et al. Interindividual differ-ences in hepatic expression of CYP3A4: relationship to geneticpolymorphism in the 5′-upstream regulatory region. BiochemBiophys Res Commun 1999;259:201–205.
105. Wandel C, Witte JS, Hall JM, et al. CYP3A activity in AfricanAmerican and European American men: population differencesand functional effect of CYP3A4*1B 5′-promoter region poly-morphism. Clin Pharmacol Ther 2000;68:82–91.
106. Gelboin HV, Krausz KW, Gonzalez FJ, et al. Inhibitory mono-clonal antibodies to human cytochrome P450 enzymes: a newavenue for drug discovery. Trends Pharmacol Sci 1999;20:432–438.
107. Shou M, Lu T, Krausz KW, et al. Use of inhibitory monoclonalantibodies to assess the contribution of cytochromes P450 tohuman drug metabolism. Eur J Pharmacol 2000;394:199–209.
108. Gonzalez FJ, Korzekwa KR. Cytochromes P450 expression sys-tems. Annu Rev Pharmacol Toxicol 1995;35:369–390.
109. Crespi CL, Miller VP. The use of heterologously expressed drugmetabolizing enzymes—state of the art and prospects for thefuture. Pharmacol Ther 1999;84:121–131.
110. Crespi CL, Penman BW. Use of cDNA-expressed human cyto-chrome P450 enzymes to study potential drug-drug interac-tions. Adv Pharmacol 1997;43:171–188.
111. Halpert JR. Structural basis of selective cytochrome P450 inhi-bition. Annu Rev Pharmacol Toxicol 1995;35:29–53.
112. Segel IH. Enzyme kinetics. New York: Wiley, 1975.113. Fahey JM, Pritchard GA, von Moltke LL, et al. The effects of
ketoconazole on triazolam pharmacokinetics, pharmacodynam-ics and benzodiazepine receptor binding in mice. J PharmacolExp Ther 1998;285:271–276.
114. Barry M, Feely J. Enzyme induction and inhibition. PharmacolTher 1990;48:71–94.
115. Denison MS, Whitlock JP. Xenobiotic-inducible transcriptionof cytochromes P450 genes. J Biol Chem 1995;270:18175–18178.
116. Bock KW, Lipp H-P, Bock-Hennig BS. Induction of drug-metabolizing enzymes by xenobiotics. Xenobiotica 1990;20:1101–1111.
117. Waxman DJ, Azaroff L. Phenobarbital induction of cytochromeP-450 gene expression. Biochem J 1992;281:577–592.
118. Park BK, Kitteringham NR, Piromohamed M, et al. Relevanceof induction of human drug-metabolizing enzymes: pharmaco-logical and toxicological implications. Br J Clin Pharmacol 1996;41:477–491.
119. von Moltke LL, Greenblatt DJ, Harmatz JS, et al. Triazolambiotransformation by human liver microsomes in vitro: effectsof metabolic inhibitors, and clinical confirmation of a predictedinteraction with ketoconazole. J Pharmacol Exp Ther 1996;276:370–379.
120. von Moltke LL, Greenblatt DJ, Duan SX, et al. Inhibition oftriazolam hydroxylation by ketoconazole, itraconazole, hydroxy-
Neuropsychopharmacology: The Fifth Generation of Progress524
itraconazole and fluconazole in vitro. Pharm Pharmacol Com-mun 1998;4:443–445.
121. vonMoltke LL, Greenblatt DJ, Grassi JM, et al. Protease inhibi-tors as inhibitors of human cytochromes P450: high risk associ-ated with ritonavir. J Clin Pharmacol 1998;38:106–111.
122. Greenblatt DJ, Wright CE, von Moltke LL, et al. Ketoconazoleinhibition of triazolam and alprazolam clearance: differential
Neuropsychopharmacology: The Fifth Generation of Progress. Edited by Kenneth L. Davis, Dennis Charney, Joseph T. Coyle, andCharles Nemeroff. American College of Neuropsychopharmacology � 2002.
kinetic and dynamic consequences. Clin Pharmacol Ther 1998;64:237–247.
123. Greenblatt DJ, von Moltke LL, Harmatz JS, et al. Inhibitionof triazolam clearance by macrolide antimicrobial agents: invitro correlates and dynamic consequences.Clin Pharmacol Ther1998;64:278–285.
Recommended