10/16/2014
Pervious Concrete Research Design Phase Two (50% Report)
Fawaz Almutairi, Fahad Aloqaili PERVIOUS CONCRETE RESEARCH TEAM
2
Table of Contents
1.0 Introduction ............................................................................................................................................ 4
2.0 Acknowledgements ................................................................................................................................. 4
3.0 Background ............................................................................................................................................. 4
4.0 Project Description .................................................................................................................................. 5
4.1 Project Understanding ........................................................................................................................ 5
4.2 Current Conditions .............................................................................................................................. 5
4.3 Constraints and Limitations ................................................................................................................ 6
4.4 Task Lists ............................................................................................................................................. 6
5.0 Literature Review .................................................................................................................................... 7
6.0 Material Preparation ............................................................................................................................... 8
7.0 Specimen Production .............................................................................................................................. 9
8.0 Testing/Analysis .................................................................................................................................... 10
8.1 Compressive Strength Test ............................................................................................................... 10
8.2 Void Ratio Test .................................................................................................................................. 11
8.3 Freeze-Thaw Cycle Test ..................................................................................................................... 11
9.0 Mix Design Formulas ............................................................................................................................. 12
10.0 Testing Results .................................................................................................................................... 15
10.1 Compressive Strength Results ........................................................................................................ 15
10.2 Void Ratio Results ........................................................................................................................... 16
Freeze-Thaw Cycle Test Results .............................................................................................................. 17
Summary of Project Costs ........................................................................................................................... 17
Timeline....................................................................................................................................................... 17
Conclusions ................................................................................................................................................. 18
References .................................................................................................................................................. 19
Appendices .................................................................................................................................................. 19
3
Table of Figures Figure 1: mixer .............................................................................................................................................. 9
Figure 2: De-molding Specimens ................................................................................................................. 9
Figure 3: Covering Specimens ....................................................................................................................... 9
Figure 4: Curing Specimens ........................................................................................................................ 10
Figure 5: Compressive Strength Test Machine ........................................................................................... 10
Figure 6: Gilson Specific Gravity Bench .................................................................................................... 11
Figure 7: Gilson HM-120 Automatic Freeze-Thaw Apparatus .................................................................. 11
List of Tables
Table 1: Mix Design Formulas ................................................................................................................... 13
Table 2: Comparison Table ......................................................................................................................... 14
Table 3: Compressive Strength Results ...................................................................................................... 16
Table 4: Porosity Test Results .................................................................................................................... 17
4
1.0 Introduction
The purpose of this project is to help Dr. Chun-Hsing (Jun) Ho with his research in developing
pervious concrete mix design formulas. The pervious concrete mix design formula must withstand
the cold climate conditions, especially in Flagstaff, Arizona. This is the second phase of this
research project as the team continues with the project while having results and mix formulas
created in phase one. This project includes producing specimens, laboratory testing, creating the
final data sheet and the final mix design formula. Also, the team will compare mix design formulas
depending on having the admixture, Silica Fume, and fiber.
2.0 Acknowledgements
This project acknowledges the work done by Dr. Chun-Hsing Ho, Junyi Shen, Darius Ikan-Tubui
Ishaku, Mengxi Du for phase one of the same project, Phase one started in January of the year,
2013 and ended in the December of the same year. This project also acknowledges Dr. Wilbert
Odem, and Mark Odem for helping the team with their guidance in order to construct professional
proposal and report. Moreover, the research team would like to thank CEMEX Company,
especially Mr. Vern Harris, for providing the team with coarse aggregate.
3.0 Background
The US Environmental Protection Agency (EPA) recommends the pervious concrete pavement
system to manage surface storm-water runoff and treat the storm-water. When looking at the mix
materials and the mixing techniques, the conventional concrete mix is similar to the pervious
concrete mix. The pervious concrete has a higher void ratio, which reduces its strength when
compared to the conventional concrete. Pervious concrete has been applied in pavements for more
than 20 years around the United States. Unfortunately, 25% of the installations have failed. A
parking lot located near the Applied Research and Development building (ARD) of the campus
was made of pervious concrete in 2009. This parking lot failed after three years from the
application and completion. A team from phase one was to develop pervious concrete mix
formulas. The team members were Junyi Shen and Darius Ikan-tubui Ishaku. Then, based on the
formulas, the team produced specimens. While a few pervious concrete mixtures appeared to be a
promising product, there is still a need to improve its performance in durability, strength, and air
5
void. The information gathered from phase one is necessary for applying and monitoring part of
this phase. Also, the information is important to know the mistakes made by the first team as well
as the different mixtures created in the first phase. This will help in avoiding the same mistakes
and have more ideas in creating the stronger and more appropriate mixture for the parking lots.
The city of Flagstaff winter climate is often below freezing and this affects mixtures due to freeze-
thaw cycle. Also, the city of Flagstaff usually experiences high frequency of freeze-thaw cycles,
which will need to be considered when creating the mixtures.
4.0 Project Description
This section will explain the research as it includes the project understanding, the current
conditions and the constraints and limitations of the project.
4.1 Project Understanding
Pervious concrete is a mixture of concrete that specializes in high void ratio that allows water to
pass through the pavement to the ground in a short amount of time without affecting the pavement.
This helps in managing storm water by reducing flooding. The purpose of phase two of the
pervious concrete project is to apply the mixtures created in phase one of the same in a parking lot
near the Sky Dome building on NAU campus and another parking lot near the City Hall of
Flagstaff. After the completion of the two pervious concrete paving projects, monitoring the
performance of the mixtures is needed for this project. Another purpose for this project is to create
a stronger mixture of the pervious concrete by adding an admixture, Silica-Fume, which helps in
increasing the strength of concrete. The new mixture includes fiber, aggregate, cement, water and
Silica-Fume. These mixtures will be expected to increase the strength and void ratio of specimens,
which will advance the performance of pervious concrete.
4.2 Current Conditions
The failure of the parking lot near the ARD building started the project. Since then, specimens
have been created in order to find the best concrete mix design formula and apply it to the parking
lot. The specimens have different ratios of cement, coarse aggregate, water and sand. Also, the
specimens have chemical admixtures added to them like Hydration Stabilizer (DELVO), Mid-
range Water Reducer (P900), Viscosity Modifier (VMA), Air Entrainment (Micro Air). These
6
chemical admixtures were added to the specimens for both phases; however, for the second phase
and after looking up for more admixtures, Silica Fume admixture was added to the mix formulas.
These admixtures are used to increase the quality of performance of concrete. Two different molds
were used for testing the specimens created. The first mold is a cylindrical mold with a 4 inch
diameter and a height of 8 inches. This mold is used for the Compression Strength Test and the
Void Ratio Test. The second mold is rectangular mold that has a length of 16 inches, width of 4
inches and a height of 4 inches. These molds are used for the freeze-thaw cycle tests.
4.3 Constraints and Limitations
There are several constraints and limitations for the concrete mix design formula. A water to
cement ratio of 0.265-0.3 is required for the design. The resulted compression strength for the
specimens must be no lower than 2500 psi. Moreover, the void ratio must exceed 17%. This is
because having a lower percentage than 17 would decrease the chance of the seepage of water
when applying pervious concrete on the pavement. The city of Flagstaff experiences around 250
cycles of freeze-thaw. Therefore, the specimens must be able to withstand the weather conditions
and the high number of freeze-thaw cycles.
4.4 Task Lists
In order to complete the second phase of this research project, a set of tasks were developed. The
tasks will include every aspect related to finishing the second phase. This include deliverables,
meetings, preparation, designing and testing. The following is the list of tasks for the second phase
of pervious concrete mix design formula:
Task 1- Team Management
Task 2- Project Development
Task 3- State of the Art Literature Review
Task 4- Material Preparation
Task 5- Mix Formula Development
Task 6- Specimen Production
Task 7- Lab Testing
Task 8- Data Analysis
Task 9- Final Deliverable
7
5.0 Literature Review
In the past eight years, many researches and projects have been made about pervious concrete.
Also, some of the researches were done for the performance of pervious concrete at low
temperatures and high frequency of freeze-thaw cycle. For example, Roseen et al. studied the
performance of pervious concrete pavement for storm water management (1). Their research stated
that pervious concrete has demonstrated its ability for drainage, but the pavement color and
shading have been the major factors influencing the snow and ice accumulation in the studied
parking lot. Wang et al. studied the freeze and thaw durability of low permeability concrete with
and without air entrainment (2). They found out that air void system is the major factor that the
effectiveness of air entrainment for resisting freezing and thawing deterioration is dependent
mostly on. The air void system does not depend on the type of cementations material. They
recommended the amount of air voids needed to be 6% or greater. Kevern et al. studied the
influence of freeze-thaw cycle on the strength of pervious concrete and monitored the performance
with some laboratory testing (3). They used many mix design formulas with and without fiber and
the durability test was done under some number of freeze-thaw cycles. The results of the tests
confirm that the short fibers improved the strength of concrete, permeability, and freeze-thaw
durability of the mixes that do not have additional sand.
The National Ready Mixed Concrete Association (NRMCA) stated that most of pervious concrete
mixtures have water-cement-ratio between 0.27-0.45 and containing no fine aggregate and made
of single sided aggregate (4). There is no doubt that the aggregate influences the integrity of the
pervious concrete structure. Particularly, the interlock effect of aggregate particles transfers loads
between individual particles from the surface to the bottom of the pavements. It is still not clear
how to maximize the strength and the freezing-thawing durability of pervious concrete. They can
be changed by adjusting the rate of aggregates, fibers, admixtures, and voids. The mix design
presented in the paper considered all factors by using locally available limestone and basalt, fibers,
and admixtures (air entrainment, water reducer, viscosity modified, and hydration stabilizer). The
mix design was made to produce a number of pervious concrete specimens and then characterize
their porosity, compressive strength, and freezing-thawing resistance.
8
6.0 Material Preparation
In order to produce pervious concrete, specimen material should be prepared before mixing. The
pervious concrete specimens were produced using the following materials: Portland cement type
II and V , water, coarse aggregate (1/2”, 3/8”,3/4” and #4), fine aggregate (nature sand) up to 2%
fine sands by weight, fiber (Fibermesh@150), Air Entrainment, Mid-range Water Reducer,
Hydration Stabilizer, Viscosity Modifier, and Silica Fume. The last five materials are admixtures.
Admixtures were used in the mix design trying to improve the strength of pervious concrete
mixtures. Admixtures are also used to improve the properties of concrete in any. Using some ready
admixtures such as Micro Air, air-entraining admixture, is recommended because it provides more
protection for the concrete by generating small, strong and closely spaced air bubbles. Also, it
decreases the internal stresses caused by expansion and contraction of water in the concrete pores
upon freezing and melting during a daily cycle. In addition, Viscosity-modifying (vma) admixture
increase the viscidness of the concrete by enabling stability and flexibility in the concrete during
the placement. Also, Stabilizer admixture (DELVO) delays the setting time of the concrete which
controls the hydration of Portland cement. To improve the durability of the pervious concrete P900
admixture is used as a high range water reducing admixture along with fiber. For this phase, Silica
Fume is added to the mixture formulas. This admixture is used to improve the compressive
strength.
9
7.0 Specimen Production
A series of pervious concrete mixtures were created
when specimen production was needed. The
mixtures included three different kinds of coarse
aggregate (3/4”, 1/2”, 3/8” and No.4). The mixtures
had different ratios of each kind of aggregate and
sometimes they were not included in the mix. The
mixtures also had natural sands with a 2% ratio by
weight as a finer. Water and cement are added into
the mixture with a water to cement ratio of 27%.
Four different admixtures in liquid forms are added
to the mix with each having their influence on the
performance of the specimens. Moreover, some of
the mixtures had fiber mesh @150. For this phase, a
new admixture is added to mixture, which is Silica
Fume. Silica Fume is different than the other four
admixtures in being in sold powder form. For each
mix design formula, four specimens are made.
Therefore, the volume of the specimens must contain
at least four specimens. For this project, the volume
was considered for five specimens in case of any mistakes
taken through the mixing procedure.
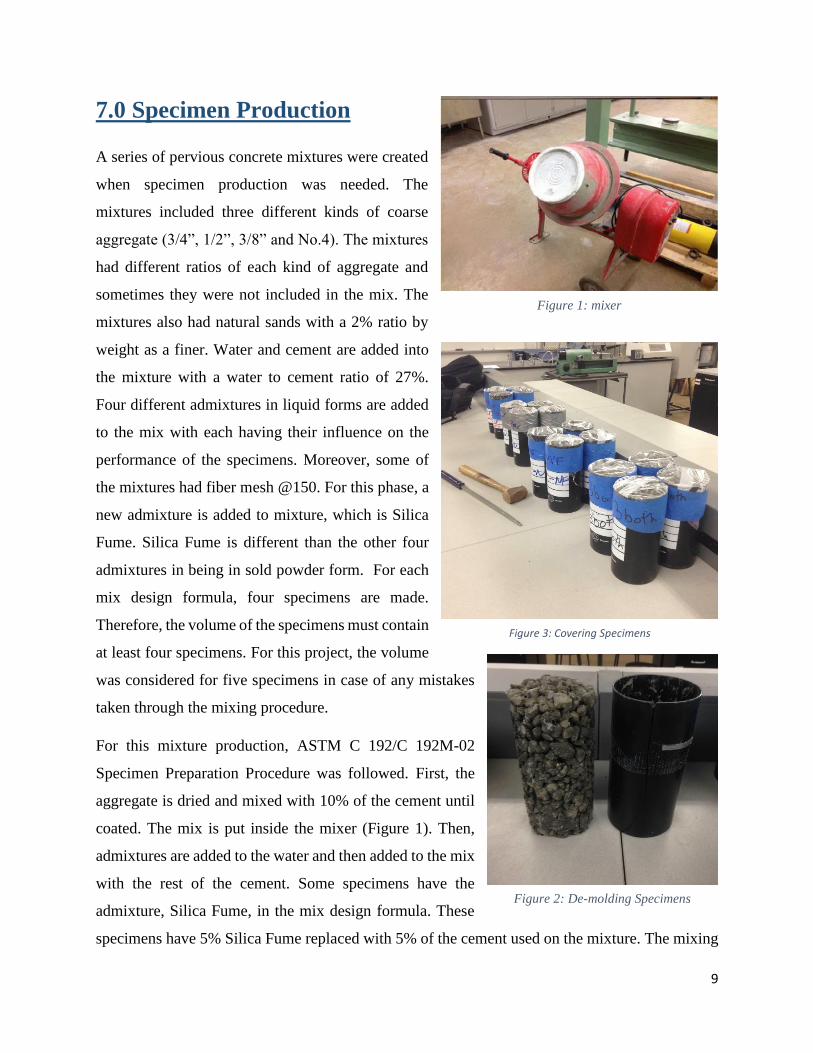
For this mixture production, ASTM C 192/C 192M-02
Specimen Preparation Procedure was followed. First, the
aggregate is dried and mixed with 10% of the cement until
coated. The mix is put inside the mixer (Figure 1). Then,
admixtures are added to the water and then added to the mix
with the rest of the cement. Some specimens have the
admixture, Silica Fume, in the mix design formula. These
specimens have 5% Silica Fume replaced with 5% of the cement used on the mixture. The mixing
Figure 1: mixer
Figure 3: Covering Specimens
Figure 2: De-molding Specimens
10
lasts for three minutes. After, that three minutes for resting
and another two minutes for mixing. The mixture is then
removed and placed inside cylindrical molds. When placing
the mix inside the mold, the mix is compacted for 25 hits in
two layers. Also, the mold is pounded on the ground for ten
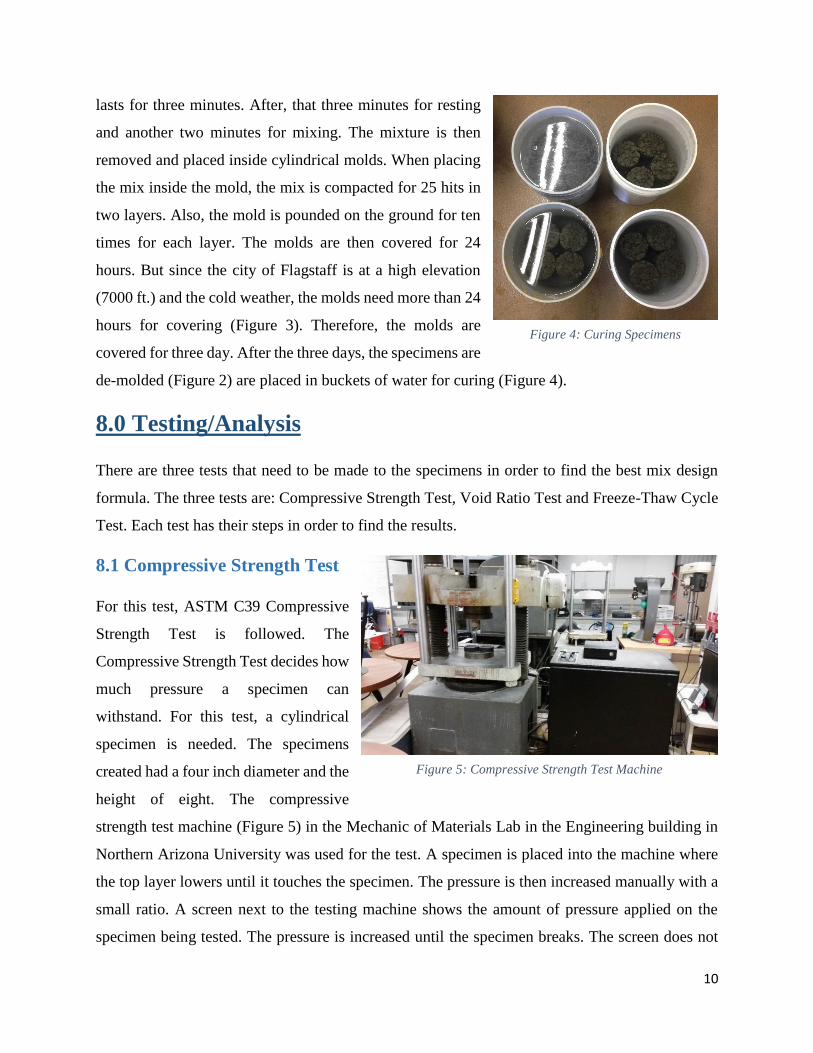
times for each layer. The molds are then covered for 24
hours. But since the city of Flagstaff is at a high elevation
(7000 ft.) and the cold weather, the molds need more than 24
hours for covering (Figure 3). Therefore, the molds are
covered for three day. After the three days, the specimens are
de-molded (Figure 2) are placed in buckets of water for curing (Figure 4).
8.0 Testing/Analysis
There are three tests that need to be made to the specimens in order to find the best mix design
formula. The three tests are: Compressive Strength Test, Void Ratio Test and Freeze-Thaw Cycle
Test. Each test has their steps in order to find the results.
8.1 Compressive Strength Test
For this test, ASTM C39 Compressive
Strength Test is followed. The
Compressive Strength Test decides how
much pressure a specimen can
withstand. For this test, a cylindrical
specimen is needed. The specimens
created had a four inch diameter and the
height of eight. The compressive
strength test machine (Figure 5) in the Mechanic of Materials Lab in the Engineering building in
Northern Arizona University was used for the test. A specimen is placed into the machine where
the top layer lowers until it touches the specimen. The pressure is then increased manually with a
small ratio. A screen next to the testing machine shows the amount of pressure applied on the
specimen being tested. The pressure is increased until the specimen breaks. The screen does not
Figure 4: Curing Specimens
Figure 5: Compressive Strength Test Machine
11
show the maximum pressure applied to the specimen; therefore, the person looking at the screen
must notice the number when the specimen breaks.
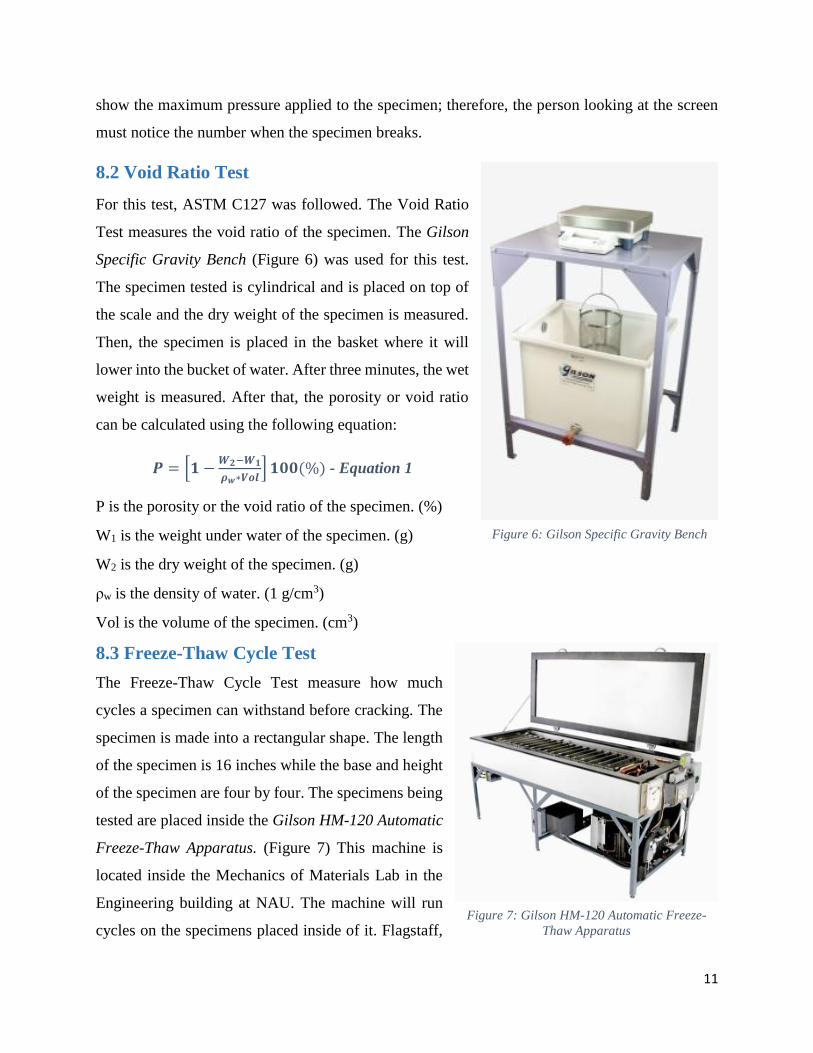
8.2 Void Ratio Test
For this test, ASTM C127 was followed. The Void Ratio
Test measures the void ratio of the specimen. The Gilson
Specific Gravity Bench (Figure 6) was used for this test.
The specimen tested is cylindrical and is placed on top of
the scale and the dry weight of the specimen is measured.
Then, the specimen is placed in the basket where it will
lower into the bucket of water. After three minutes, the wet
weight is measured. After that, the porosity or void ratio
can be calculated using the following equation:
𝑷 = [𝟏 −𝑾𝟐−𝑾𝟏
𝝆𝒘∗𝑽𝒐𝒍] 𝟏𝟎𝟎(%) - Equation 1
P is the porosity or the void ratio of the specimen. (%)
W1 is the weight under water of the specimen. (g)
W2 is the dry weight of the specimen. (g)
ρw is the density of water. (1 g/cm3)
Vol is the volume of the specimen. (cm3)
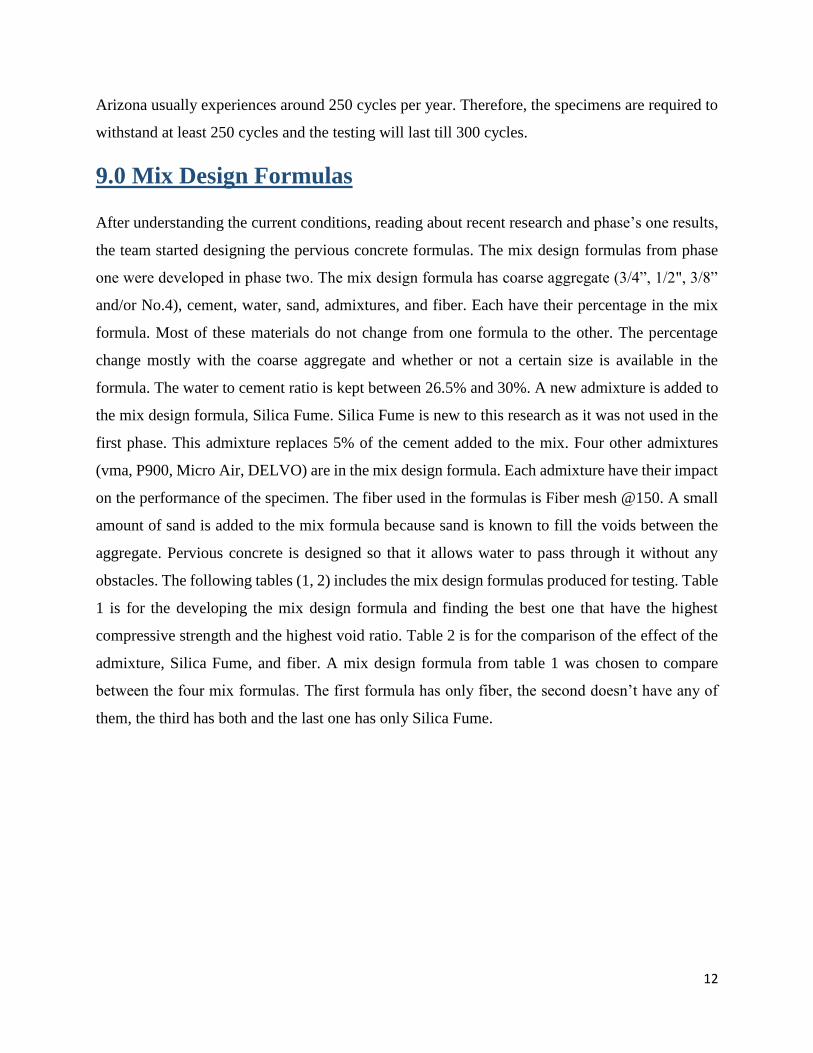
8.3 Freeze-Thaw Cycle Test
The Freeze-Thaw Cycle Test measure how much
cycles a specimen can withstand before cracking. The
specimen is made into a rectangular shape. The length
of the specimen is 16 inches while the base and height
of the specimen are four by four. The specimens being
tested are placed inside the Gilson HM-120 Automatic
Freeze-Thaw Apparatus. (Figure 7) This machine is
located inside the Mechanics of Materials Lab in the
Engineering building at NAU. The machine will run
cycles on the specimens placed inside of it. Flagstaff,
Figure 6: Gilson Specific Gravity Bench
Figure 7: Gilson HM-120 Automatic Freeze-
Thaw Apparatus
12
Arizona usually experiences around 250 cycles per year. Therefore, the specimens are required to
withstand at least 250 cycles and the testing will last till 300 cycles.
9.0 Mix Design Formulas
After understanding the current conditions, reading about recent research and phase’s one results,
the team started designing the pervious concrete formulas. The mix design formulas from phase
one were developed in phase two. The mix design formula has coarse aggregate (3/4”, 1/2", 3/8”
and/or No.4), cement, water, sand, admixtures, and fiber. Each have their percentage in the mix
formula. Most of these materials do not change from one formula to the other. The percentage
change mostly with the coarse aggregate and whether or not a certain size is available in the
formula. The water to cement ratio is kept between 26.5% and 30%. A new admixture is added to
the mix design formula, Silica Fume. Silica Fume is new to this research as it was not used in the
first phase. This admixture replaces 5% of the cement added to the mix. Four other admixtures
(vma, P900, Micro Air, DELVO) are in the mix design formula. Each admixture have their impact
on the performance of the specimen. The fiber used in the formulas is Fiber mesh @150. A small
amount of sand is added to the mix formula because sand is known to fill the voids between the
aggregate. Pervious concrete is designed so that it allows water to pass through it without any
obstacles. The following tables (1, 2) includes the mix design formulas produced for testing. Table
1 is for the developing the mix design formula and finding the best one that have the highest
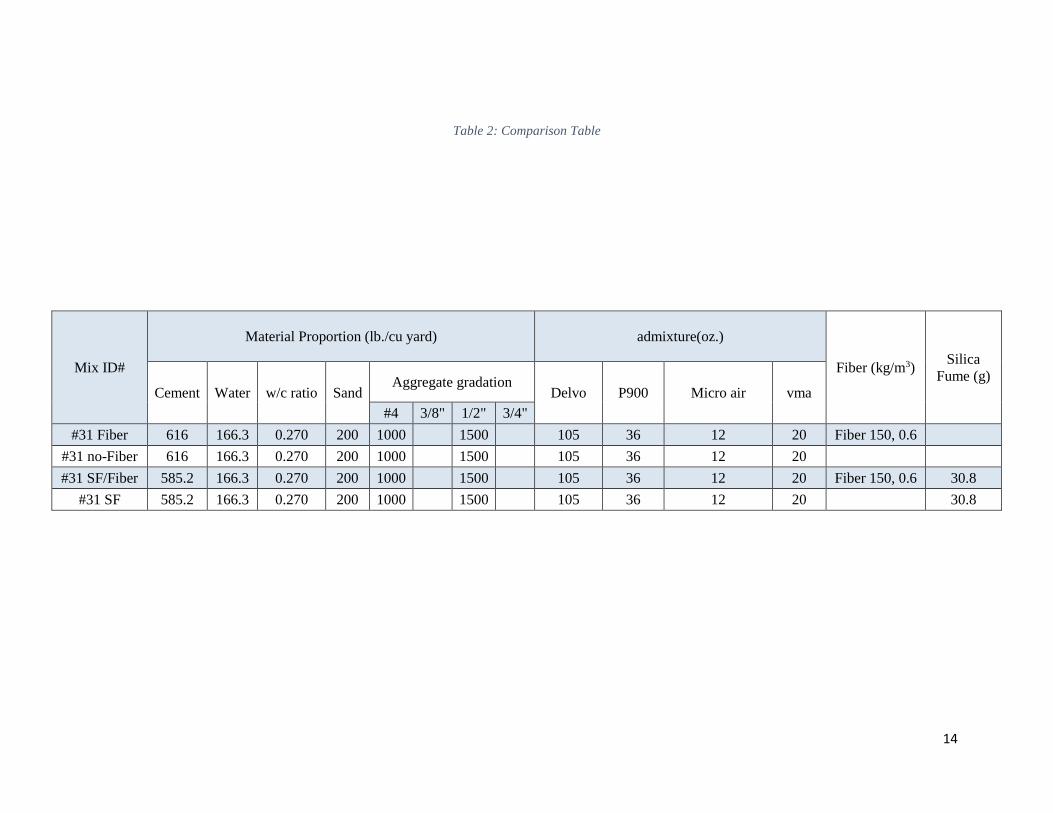
compressive strength and the highest void ratio. Table 2 is for the comparison of the effect of the
admixture, Silica Fume, and fiber. A mix design formula from table 1 was chosen to compare
between the four mix formulas. The first formula has only fiber, the second doesn’t have any of
them, the third has both and the last one has only Silica Fume.
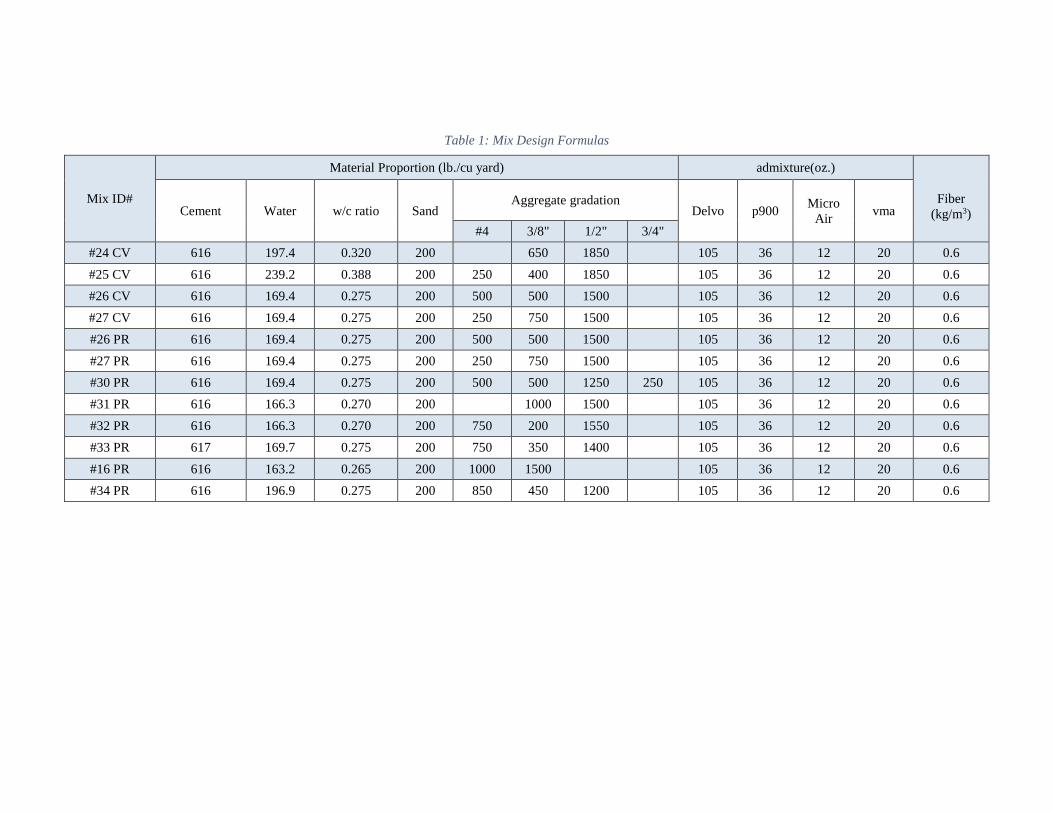
Table 1: Mix Design Formulas
Mix ID#
Material Proportion (lb./cu yard) admixture(oz.)
Fiber
(kg/m3) Cement Water w/c ratio Sand Aggregate gradation
Delvo p900 Micro
Air vma
#4 3/8" 1/2" 3/4"
#24 CV 616 197.4 0.320 200 650 1850 105 36 12 20 0.6
#25 CV 616 239.2 0.388 200 250 400 1850 105 36 12 20 0.6
#26 CV 616 169.4 0.275 200 500 500 1500 105 36 12 20 0.6
#27 CV 616 169.4 0.275 200 250 750 1500 105 36 12 20 0.6
#26 PR 616 169.4 0.275 200 500 500 1500 105 36 12 20 0.6
#27 PR 616 169.4 0.275 200 250 750 1500 105 36 12 20 0.6
#30 PR 616 169.4 0.275 200 500 500 1250 250 105 36 12 20 0.6
#31 PR 616 166.3 0.270 200 1000 1500 105 36 12 20 0.6
#32 PR 616 166.3 0.270 200 750 200 1550 105 36 12 20 0.6
#33 PR 617 169.7 0.275 200 750 350 1400 105 36 12 20 0.6
#16 PR 616 163.2 0.265 200 1000 1500 105 36 12 20 0.6
#34 PR 616 196.9 0.275 200 850 450 1200 105 36 12 20 0.6
14
Table 2: Comparison Table
Mix ID#
Material Proportion (lb./cu yard) admixture(oz.)
Fiber (kg/m3) Silica
Fume (g)
Cement Water w/c ratio Sand Aggregate gradation
Delvo P900 Micro air vma
#4 3/8" 1/2" 3/4"
#31 Fiber 616 166.3 0.270 200 1000 1500 105 36 12 20 Fiber 150, 0.6
#31 no-Fiber 616 166.3 0.270 200 1000 1500 105 36 12 20
#31 SF/Fiber 585.2 166.3 0.270 200 1000 1500 105 36 12 20 Fiber 150, 0.6 30.8
#31 SF 585.2 166.3 0.270 200 1000 1500 105 36 12 20 30.8
10.0 Testing Results
After producing the specimens using the ASTM C 192/C 192M-02 Specimen Preparation
Procedure and testing the specimens using the three tests specified in the Testing/Analysis section,
the team was able to create tables showing the results.
10.1 Compressive Strength Results
The compressive strength results varied due to using different kinds of aggregate in the mix design
formulas. First, the team brought aggregate for the city of Camp Verde, Arizona and the results
were not consistent. This is because the coarse aggregate from Camp Verde is a combination of
Basalt, Limestone, Quartzite, and Granite. Each kind of rock has different characteristics in terms
of compression strength. Therefore, the team brought aggregate from the city of Prescott, Arizona.
The results came out to be very consistent. This is because the coarse aggregate was mainly Basalt.
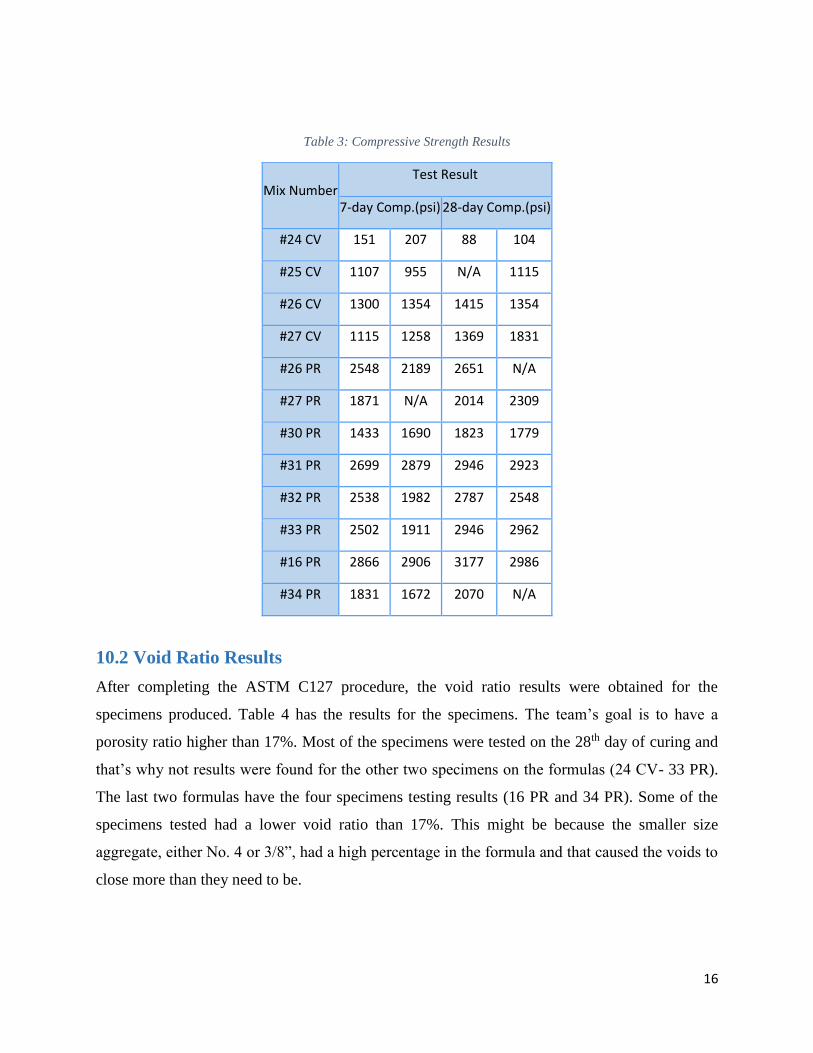
The specimens created were tested on the 7th and 28th days of curing. Table 3 shows the results of
compressive strength on the specimens created. Since the first phase group started with specimen
production, the team from phase two continued with the numbering. The first mix starts with the
number 24 as it is the 24th mix formula from the start of the project. CV means that the aggregate
is from the city of Camp Verde, AZ and PR means that the aggregate is from the city of Prescott,
AZ.
16
Table 3: Compressive Strength Results
Mix Number Test Result
7-day Comp.(psi) 28-day Comp.(psi)
#24 CV 151 207 88 104
#25 CV 1107 955 N/A 1115
#26 CV 1300 1354 1415 1354
#27 CV 1115 1258 1369 1831
#26 PR 2548 2189 2651 N/A
#27 PR 1871 N/A 2014 2309
#30 PR 1433 1690 1823 1779
#31 PR 2699 2879 2946 2923
#32 PR 2538 1982 2787 2548
#33 PR 2502 1911 2946 2962
#16 PR 2866 2906 3177 2986
#34 PR 1831 1672 2070 N/A
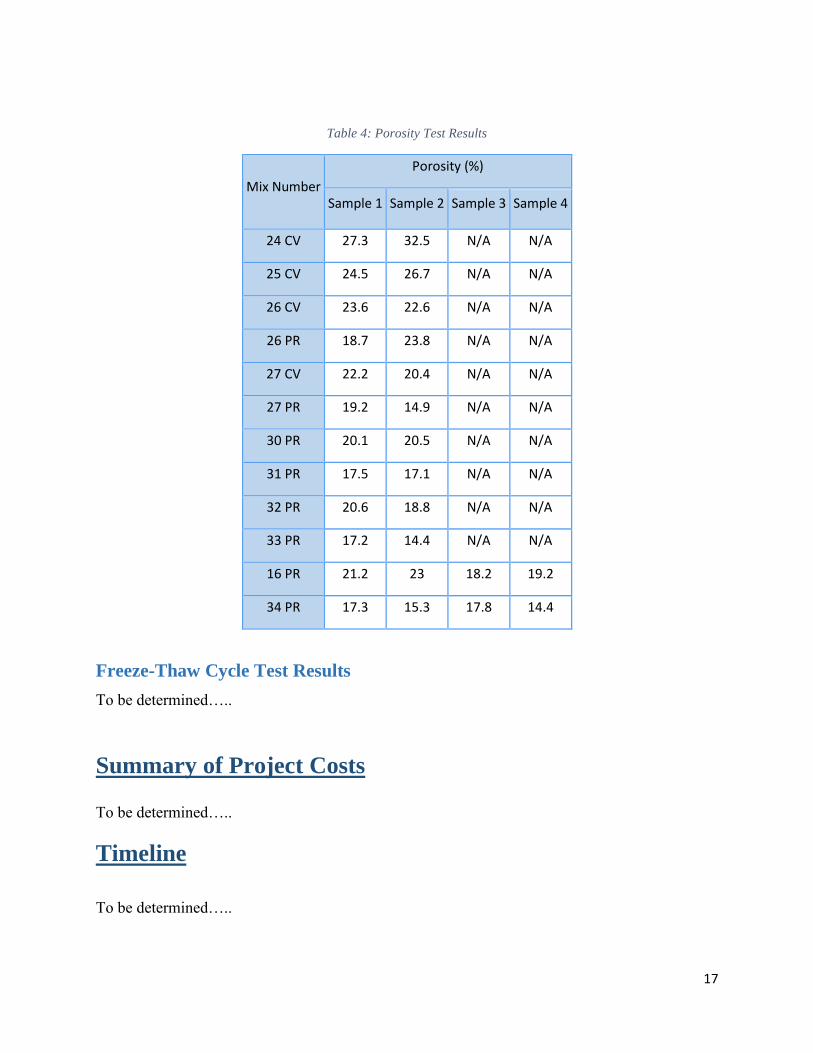
10.2 Void Ratio Results
After completing the ASTM C127 procedure, the void ratio results were obtained for the
specimens produced. Table 4 has the results for the specimens. The team’s goal is to have a
porosity ratio higher than 17%. Most of the specimens were tested on the 28th day of curing and
that’s why not results were found for the other two specimens on the formulas (24 CV- 33 PR).
The last two formulas have the four specimens testing results (16 PR and 34 PR). Some of the
specimens tested had a lower void ratio than 17%. This might be because the smaller size
aggregate, either No. 4 or 3/8”, had a high percentage in the formula and that caused the voids to
close more than they need to be.
17
Table 4: Porosity Test Results
Mix Number
Porosity (%)
Sample 1 Sample 2 Sample 3 Sample 4
24 CV 27.3 32.5 N/A N/A
25 CV 24.5 26.7 N/A N/A
26 CV 23.6 22.6 N/A N/A
26 PR 18.7 23.8 N/A N/A
27 CV 22.2 20.4 N/A N/A
27 PR 19.2 14.9 N/A N/A
30 PR 20.1 20.5 N/A N/A
31 PR 17.5 17.1 N/A N/A
32 PR 20.6 18.8 N/A N/A
33 PR 17.2 14.4 N/A N/A
16 PR 21.2 23 18.2 19.2
34 PR 17.3 15.3 17.8 14.4
Freeze-Thaw Cycle Test Results
To be determined…..
Summary of Project Costs
To be determined…..
Timeline
To be determined…..
18
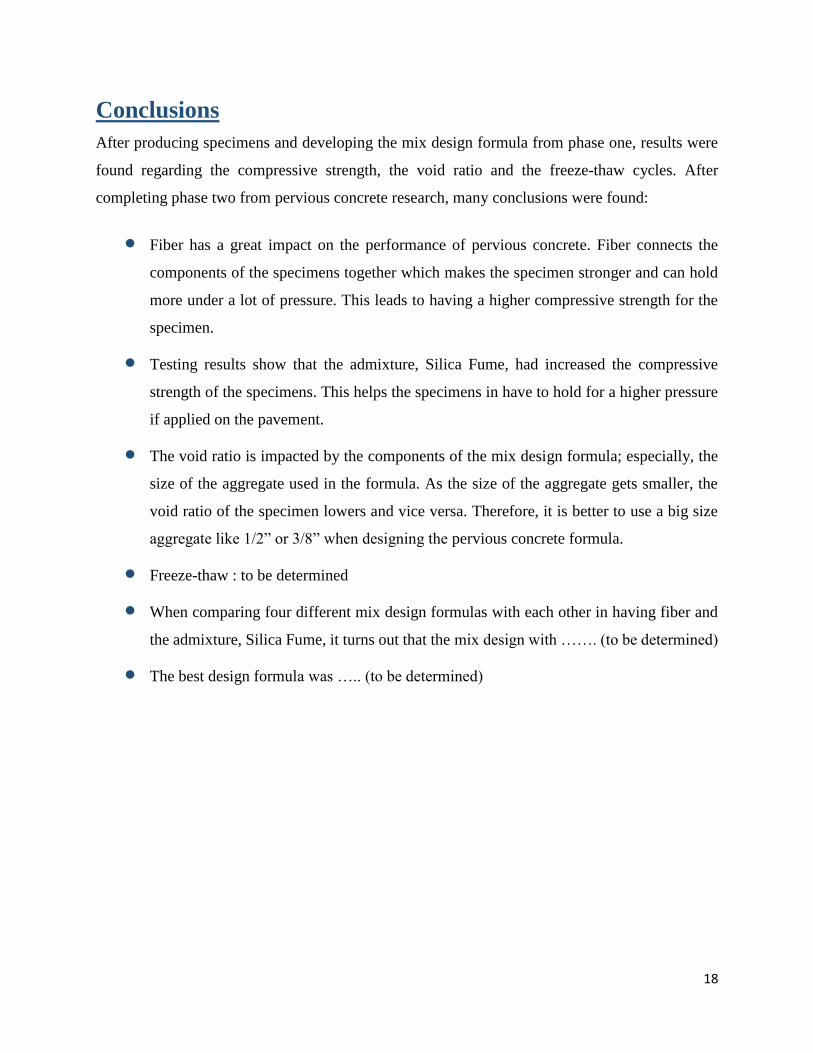
Conclusions
After producing specimens and developing the mix design formula from phase one, results were
found regarding the compressive strength, the void ratio and the freeze-thaw cycles. After
completing phase two from pervious concrete research, many conclusions were found:
Fiber has a great impact on the performance of pervious concrete. Fiber connects the
components of the specimens together which makes the specimen stronger and can hold
more under a lot of pressure. This leads to having a higher compressive strength for the
specimen.
Testing results show that the admixture, Silica Fume, had increased the compressive
strength of the specimens. This helps the specimens in have to hold for a higher pressure
if applied on the pavement.
The void ratio is impacted by the components of the mix design formula; especially, the
size of the aggregate used in the formula. As the size of the aggregate gets smaller, the
void ratio of the specimen lowers and vice versa. Therefore, it is better to use a big size
aggregate like 1/2” or 3/8” when designing the pervious concrete formula.
Freeze-thaw : to be determined
When comparing four different mix design formulas with each other in having fiber and
the admixture, Silica Fume, it turns out that the mix design with ……. (to be determined)
The best design formula was ….. (to be determined)
19
References
1. Roseen, R., Ballestero, T. P., Houle, K.M., and Briggs, J. F. Pervious concrete and porous asphalt
pavements performance in northern climate. Proceeding of the 2009 Cold Regions Engineering
Conference. ASCE, pp. 311-327, 2009.
2. Wang, K., Lomboy, G., and Steffes, R. Investigation into Freezing-Thawing Durability of Low-
Permeability Concrete with and without Air Entraining Agent.
http://www.intrans.iastate.edu/research/documents/research-reports/low-permeability-concrete.pdf .
3. Kevern, J.T., Schaefer, V.R., Wang, K. and Suleimani, M.T. Pervious concrete mixture proportions
for improved freeze-thaw durability. Journal of ASTM International, Vol. 5, No. 2, pp. 1-12, 2007.
4. National Ready Mixed Concrete Association (NRMCA). Freeze-Thaw Resistance of Pervious
Concrete, NRMCA, Silver Springs, MD, 2004.
5.
Appendices
Recommended


![Evans Pervious Concrete.ppt - CAIT · • Green Building Practice ... Why Pervious Concrete? Design ... Microsoft PowerPoint - Evans_Pervious Concrete.ppt [Compatibility Mode]](https://img.dokumen.tips/doc/110x75/5b877ec17f8b9aa0218cdb06/evans-pervious-cait-green-building-practice-why-pervious-concrete.jpg)