Arquivos Brasileiros de Cardiologia - Volume 86, Nº 3, March 2006
Original ArticleOriginal Article
Electrical Cardioversion and Myocardial Injury: Evaluation by New Cardiac Injury Markers
Elizabete Silva dos Santos, Marcos Paulo Pereira, Luiz Minuzzo, Dalmo A. R. Moreira, Rui Ramos, Álvaro Avezum, Ari Timerman, Leopoldo Piegas
Instituto Dante Pazzanese de Cardiologia - São Paulo, SP - Brazil
Mailing Address: Elizabete Silva dos Santos • Rua das Rosas, 126/32 – 04048-000 – Mirandópolis , SP - Brazi lE-mail: [email protected] Received on 12/07/04 • Accepted on 05/04/05
OBJECTIVE Evaluate, based on the evolution of new biochemical
markers of cardiac damage, if electrical cardioversion (ECV) causes myocardial injury.
METHODS Seventy-six patients (P) submitted to elective ECV for
atrial fi brillation or atrial fl utter were evaluated. Creatine phosphokinase (CPK), CK-MB activity, CK-MB mass, myoglobin and cardiac troponin I (cTnI) were measured before, and 6 and 24 hours after ECV.
RESULTS ECV was successful in 58 P (76.3%). Cumulative
energy (CE) was up to 350 joules (J) in 36 P, from 500 to 650 J in 20 P and from 900 to 960 J in 20 P; the mean energy delivered being 493 J (± 309). The levels of cTnI remained within normal limits in all 76 P. The increase of cumulative energy led to an elevation of CPK levels (> p value = 0.007), CK-MB activity (> p value = 0.002), CK-MB mass (> p value = 0.03), and myoglobin (> p value = 0.015). A positive correlation between the cumulative energy and CPK peaks was observed (r = 0.660; p < 0.001), CK-MB activity (r = 0.429; p < 0.0001), CK-MB mass (r = 0.265; p = 0.02), and myoglobin (r = 0.684; p < 0.0001), as well as between the number of shocks and the CPK peaks (r = 0.770; p < 0.001), CK-MB activity (r = 0.642; p < 0.0001), CK-MB mass (r = 0.430; p < 0,0001), and myoglobin (r = 0.745; p < 0.0001).
CONCLUSION ECV does not cause myocardial injury detectable by
cTnI measurement. Elevations of CPK, CK-MB activity, CK-MB mass and myoglobin result from skeletal muscle injury and are positively correlated with the CE delivered or with the number of shocks.
KEY WORDS Cardioversion, myocardial injury, cardiac troponin I.
Arquivos Brasileiros de Cardiologia - Volume 86, Nº 3, March 2006
ELECTRICAL CARDIOVERSION AND MYOCARDIAL INJURY: EVALUATION BY NEW CARDIAC INJURY MARKERS
Even though electrical cardioversion (ECV) has been indicated for the treatment of tachyarrhythmia for over 30 years, it is still controversial whether this technique can cause myocardial injury1. Evidence pointing to myocardial injury induced by this procedure is based on small studies that demonstrate moderate elevations of enzyme markers like creatine phosphokinase (CPK) and its isoenzyme CK-MB2. Histological studies conducted later confi rmed that these elevations may be secondary to the myocardial injury3-6. The injuries corresponded to localized necrosis and were observed only when high-energy shocks were applied after the delivery of repeated shocks7-10. A high-energy shock resulted in a higher number of injuries than several lower-energy shocks7,8.
New markers of myocardial injury with a higher degree of cardiospecifi city, such as troponins I and T, were developed recently. Troponins are proteins that regulate the actin-myosin interaction in the striated muscles, and a small percentage of troponins is free in the cytoplasm. Approximately 6% to 8% of troponin I and 2.8% to 4.1% of troponin T are found in the cytoplasm. The aminoacid sequence and molecular weight of both troponins differ, according to where they are found in the muscle. Cardiac troponin I (cTnI) has a unique aminoacid sequence, different from that of the skeletal troponin I, and it is not found in any human tissue other than the heart. Thus, no release of cTnI occurs in case of damage to skeletal muscle. Its measurement enables to discriminate between the myocardial or skeletal origin of muscle injuries11, as well as the detection of even minimal injury observed in some clinical conditions or experimental situations12-14.
Cell death and destruction of contractile apparatus induce a continuous release of cardiac troponin I for a period of seven to ten days15.
In the second half of the 90’s, studies about electrical cardioversion aiming to assess cardiac injury markers with a higher degree of cardiospecifi city were first published16-18. Some of them described slight elevations of troponin, both cTnI17 and troponin T18, after repeated cardioversions in patients who had undergone electrophysiological study.
The purpose of this study was to evaluate whether elective external ECV causes myocardial injury, based on the evolution of these biochemical markers of cardiac injury.
METHODSConsecutive patients referred to elective ECV for atrial
fi brillation or atrial fl utter, from July 2001 to August 2003, were considered eligible for inclusion in the study. Patients with acute coronary syndrome or who had undergone myocardial revascularization (surgical or percutaneous) in the previous month, had muscle disease or history of muscle injury in the last thirty days were excluded. Seventy-six patients were enrolled in the study, and after informed
consent was obtained, baseline characteristics such as past history, current medications, vital signs, weight and height were documented (Tab 1). All patients were appropriately anticoagulated (international normalized ratio [INR] above 2) and maintained anticoagulated for at least forty days after the procedure.
The study protocol was approved by the Institutional Research Ethics Committee.
Patients were informed about the technique used in the procedure and submitted to general anesthesia with intravenous Thionembutal (3 to 5 mg/kg). A 12-lead electrocardiogram was obtained immediately before and after cardioversion.
Cardioversions were performed using a direct-current, monophasic cardioverter and rectangular pads of 8 cm long in its longer axis coated with conductive gel. One pad was placed on the right second intercostal space and the other at the level of left hemiclavicular line on the sixth intercostal space. Shocks synchronized to the R-wave peak were delivered, the energy ranging from 50 to 360 joules (J), starting at 50 J for the atrial fl utter and followed by 100, 200, 300 J or a second energy discharge of 300 J, and starting at 100 J for the atrial fi brillation, followed by 200, 300 or 360 J. The interval between shocks was the shortest possible, bearing always in mind the need to keep approximately 10-kg weight over the pads, as well as not to withdraw them too fast after each shock delivered to prevent energy dispersion. The population studied was divided into
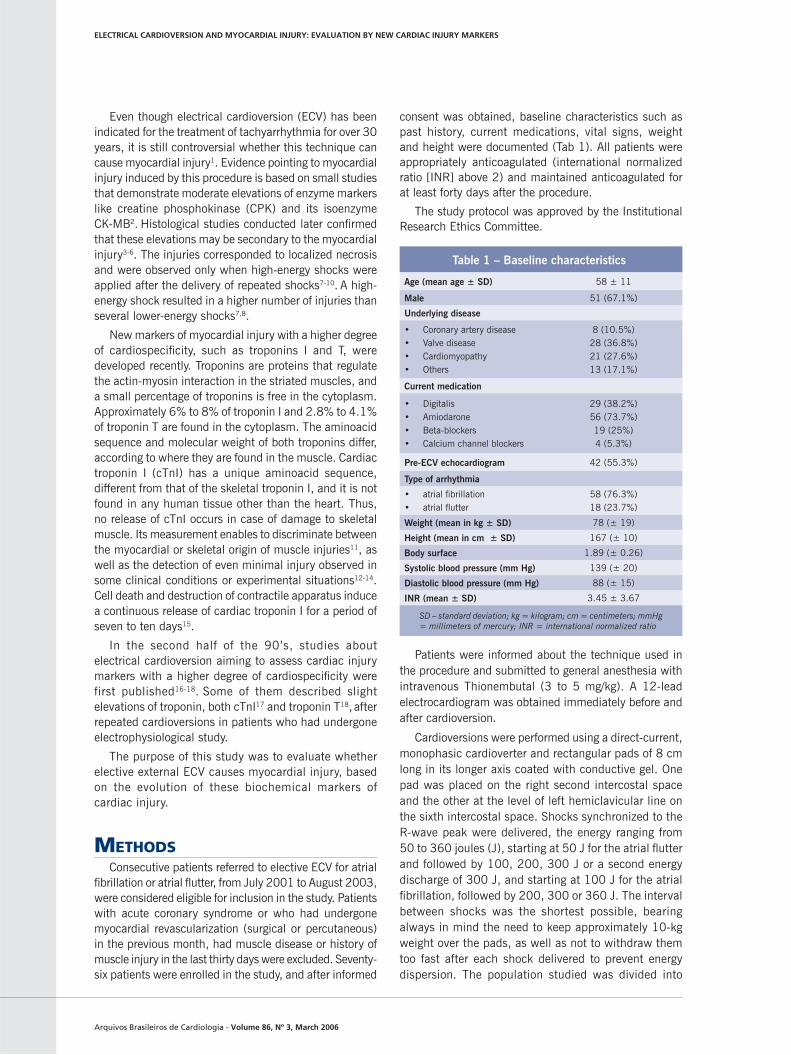
Table 1 – Baseline characteristics
Age (mean age ± SD) 58 ± 11
Male 51 (67.1%)
Underlying disease
• Coronary artery disease• Valve disease• Cardiomyopathy• Others
8 (10.5%)28 (36.8%)21 (27.6%)13 (17.1%)
Current medication
• Digitalis• Amiodarone• Beta-blockers• Calcium channel blockers
29 (38.2%)56 (73.7%)19 (25%)4 (5.3%)
Pre-ECV echocardiogram 42 (55.3%)
Type of arrhythmia
• atrial fi brillation• atrial fl utter
58 (76.3%)18 (23.7%)
Weight (mean in kg ± SD) 78 (± 19)
Height (mean in cm ± SD) 167 (± 10)
Body surface 1.89 (± 0.26)
Systolic blood pressure (mm Hg) 139 (± 20)
Diastolic blood pressure (mm Hg) 88 (± 15)
INR (mean ± SD) 3.45 ± 3.67
SD – standard deviation; kg = kilogram; cm = centimeters; mmHg = millimeters of mercury; INR = international normalized ratio
Arquivos Brasileiros de Cardiologia - Volume 86, Nº 3, March 2006
ELECTRICAL CARDIOVERSION AND MYOCARDIAL INJURY: EVALUATION BY NEW CARDIAC INJURY MARKERS
three groups, according to the cumulative energy (CE) delivered. Group A = CE up to 350 J (36 patients); Group B = CE from 500 to 650 J (20 patients); Group C = CE from 900 to 960 J (20 patients). The results among the three groups were compared, as well as the evolution of each group over time.
All patients were kept under observation in the emergency unit for six hours after the procedure.
Venipuncture was performed in one of the upper extremities for blood sampling and measurement of serum potassium and INR value. As serum potassium and INR levels were found to be adequate for cardioversion, the decision was taken to perform the procedure. The patients thus underwent blood sampling before and at 6 and 24 hours after cardioversion, for CPK, CK-MB activity, cTnI, CK-MB mass and myoglobin measurements.
CPK measurements were determined by the automated kinetic enzymatic method using a Hitachi 912® analyzer manufactured by Roche Diagnostics, and CK-MB activity was determined by the kinetic enzyme immunoassay method using the same device. The reference value for CPK is up to 80 U/L; and for CK-MB activity values up to 10 U/L were considered. CK-MB mass, myoglobin and cTnI were measured using the automated chemiluminescence method with IMMULITE® analyzer manufactured by DPC MedLab. Reference values are up to 70 ng/mL for myoglobin, up to 4.5 ng/mL for CK-MB mass, and up to 1.0 ng/mL for cTnI. The intra-assay coeffi cient of variation for CPK and CK-MB activity measurements is lower than 2.5%, and for the measurements using the chemiluminescence method the values do not exceed 6%.
Means and standard deviations were calculated to describe continuous variables. Analysis of variance with repeated measurements, followed by multiple comparisons of means, was performed to determine the evolution of each marker over time in the different groups of cumulative energy (SAS Software). The relationship between cumulative energy and each marker was estimated by Person’s correlation, and the relationship
between the number of shocks and each marker was estimated by Spearman’ correlation.
RESULTSOf the 76 patients studied, 58 had atrial fi brillation
(76.3%) and 18 had atrial fl utter (23.7%). Fifty-one patients (67.1%) were male, mean age of 58 years (±11). The underlying disease was cardiomyopathy in 21 patients (27.6%), valve disease in 28 (36.6%) and coronary artery disease in 8 (10.5%) (Tab. 1). In 67 patients (88.1%) the duration of arrhythmia exceeded six months.
A maximum of five shocks was determined for each patient, mean of 2.68 shocks (±1.1). The mean shock energy delivered was 493 J (±309). Fifty-eight patients (76.3%) were successfully cardioverted, with no complications related to the procedure and no ST-segment or T-wave changes (dynamics) on electrocardiogram after ECV. All patients were discharged six hours after ECV and asked to return 24 hours later for blood sampling.
There was no signifi cant difference regarding marker levels before ECV in the different groups of cumulative energy. Only one trend for higher CPK values was detected before ECV in group C as compared to group A (p = 0.053) or B (p = 0.05). The same occurred with myoglobin between groups A and C (p = 0.058) (tab. 2).
The measurements of the biochemical markers at the three times (before, and at 6 and 24 hours after the procedure) were performed for cTnI in 73 patients (96%), CPK in 69 (90.8%), CK-MB activity in 72 (94.7%), CK-MB mass and myoglobin in 70 (92.1%).
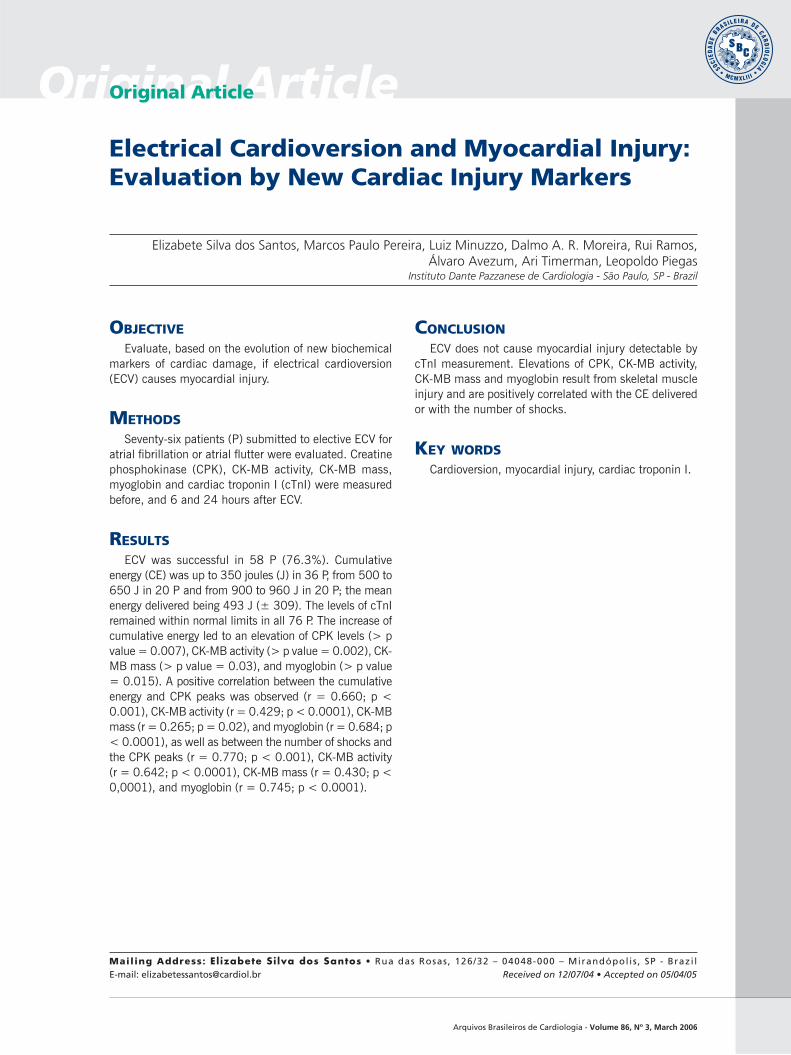
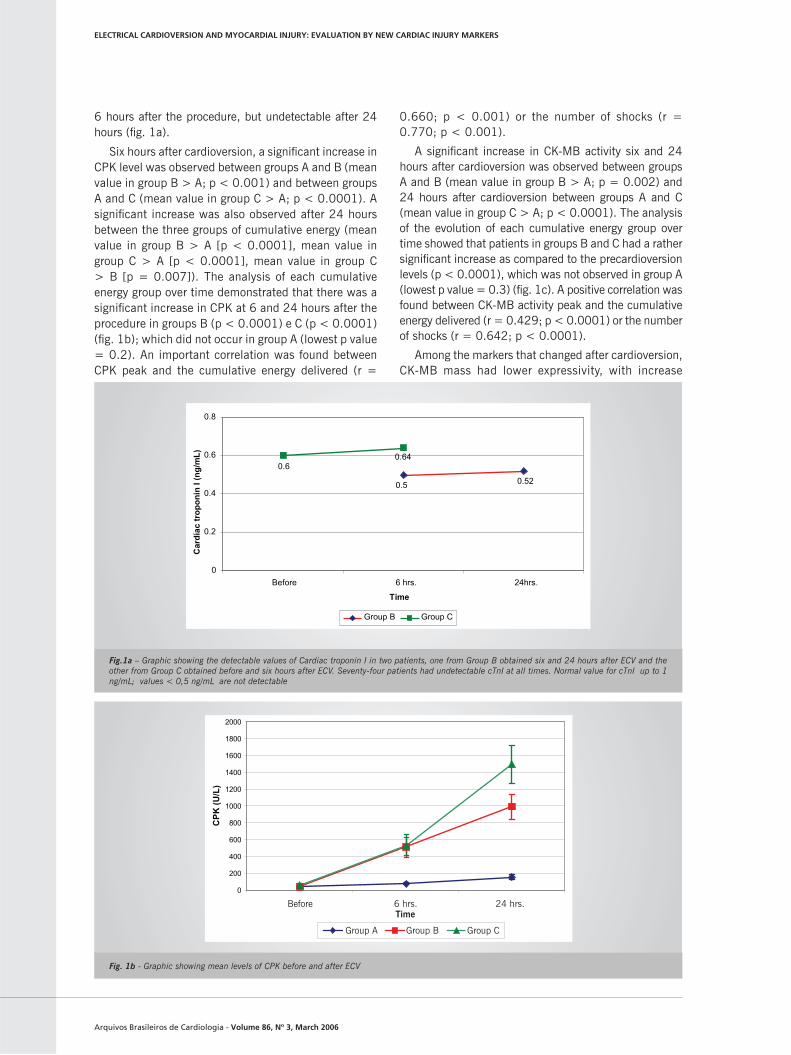
Cardiac troponin I remained undetectable (< 0.5 ng/mL) in 74 patients (97.4%) at all times. One patient in Group B showed values of 0.5 ng/mL and 0.52 ng/mL, respectively, at 6 and 24 hours after cardioversion. Another one in Group C showed value of 0.64 ng/mL
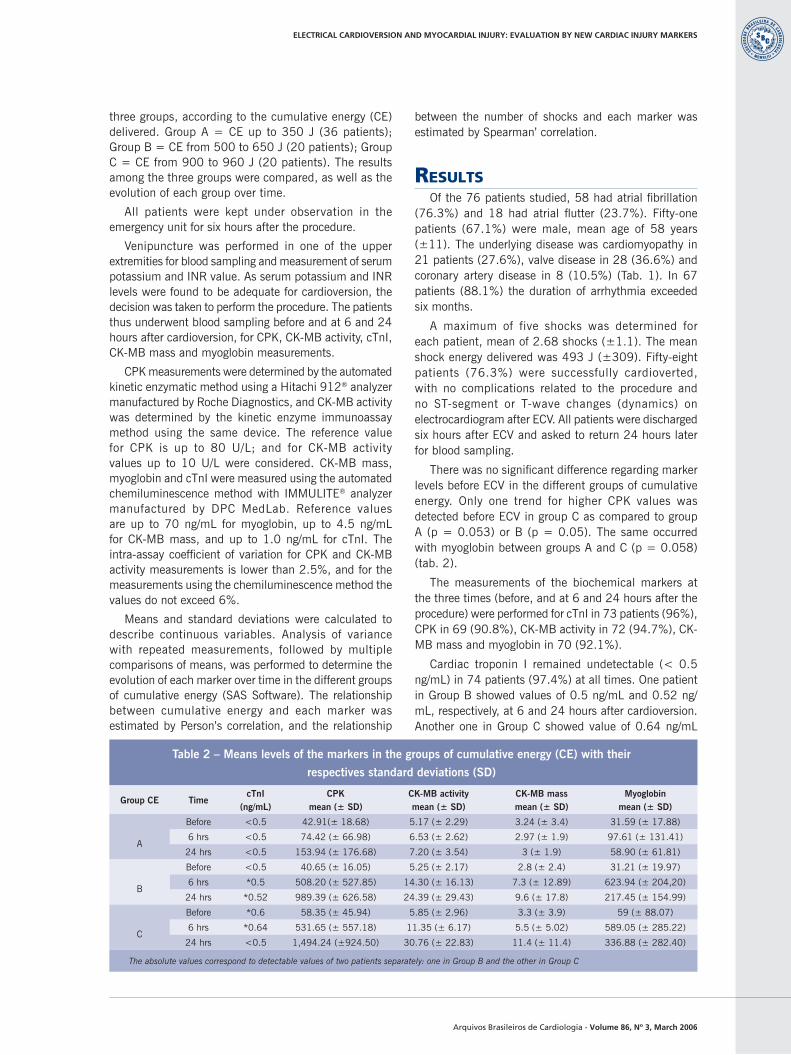
Table 2 – Means levels of the markers in the groups of cumulative energy (CE) with their
respectives standard deviations (SD)
Group CE TimecTnI
(ng/mL)CPK
mean (± SD)CK-MB activitymean (± SD)
CK-MB massmean (± SD)
Myoglobinmean (± SD)
A
Before <0.5 42.91(± 18.68) 5.17 (± 2.29) 3.24 (± 3.4) 31.59 (± 17.88)
6 hrs <0.5 74.42 (± 66.98) 6.53 (± 2.62) 2.97 (± 1.9) 97.61 (± 131.41)
24 hrs <0.5 153.94 (± 176.68) 7.20 (± 3.54) 3 (± 1.9) 58.90 (± 61.81)
B
Before <0.5 40.65 (± 16.05) 5.25 (± 2.17) 2.8 (± 2.4) 31.21 (± 19.97)
6 hrs *0.5 508.20 (± 527.85) 14.30 (± 16.13) 7.3 (± 12.89) 623.94 (± 204,20)
24 hrs *0.52 989.39 (± 626.58) 24.39 (± 29.43) 9.6 (± 17.8) 217.45 (± 154.99)
C
Before *0.6 58.35 (± 45.94) 5.85 (± 2.96) 3.3 (± 3.9) 59 (± 88.07)
6 hrs *0.64 531.65 (± 557.18) 11.35 (± 6.17) 5.5 (± 5.02) 589.05 (± 285.22)
24 hrs <0.5 1,494.24 (±924.50) 30.76 (± 22.83) 11.4 (± 11.4) 336.88 (± 282.40)
The absolute values correspond to detectable values of two patients separately: one in Group B and the other in Group C
Arquivos Brasileiros de Cardiologia - Volume 86, Nº 3, March 2006
6 hours after the procedure, but undetectable after 24 hours (fi g. 1a).
Six hours after cardioversion, a signifi cant increase in CPK level was observed between groups A and B (mean value in group B > A; p < 0.001) and between groups A and C (mean value in group C > A; p < 0.0001). A signifi cant increase was also observed after 24 hours between the three groups of cumulative energy (mean value in group B > A [p < 0.0001], mean value in group C > A [p < 0.0001], mean value in group C > B [p = 0.007]). The analysis of each cumulative energy group over time demonstrated that there was a signifi cant increase in CPK at 6 and 24 hours after the procedure in groups B (p < 0.0001) e C (p < 0.0001) (fi g. 1b); which did not occur in group A (lowest p value = 0.2). An important correlation was found between CPK peak and the cumulative energy delivered (r =
0.660; p < 0.001) or the number of shocks (r = 0.770; p < 0.001).
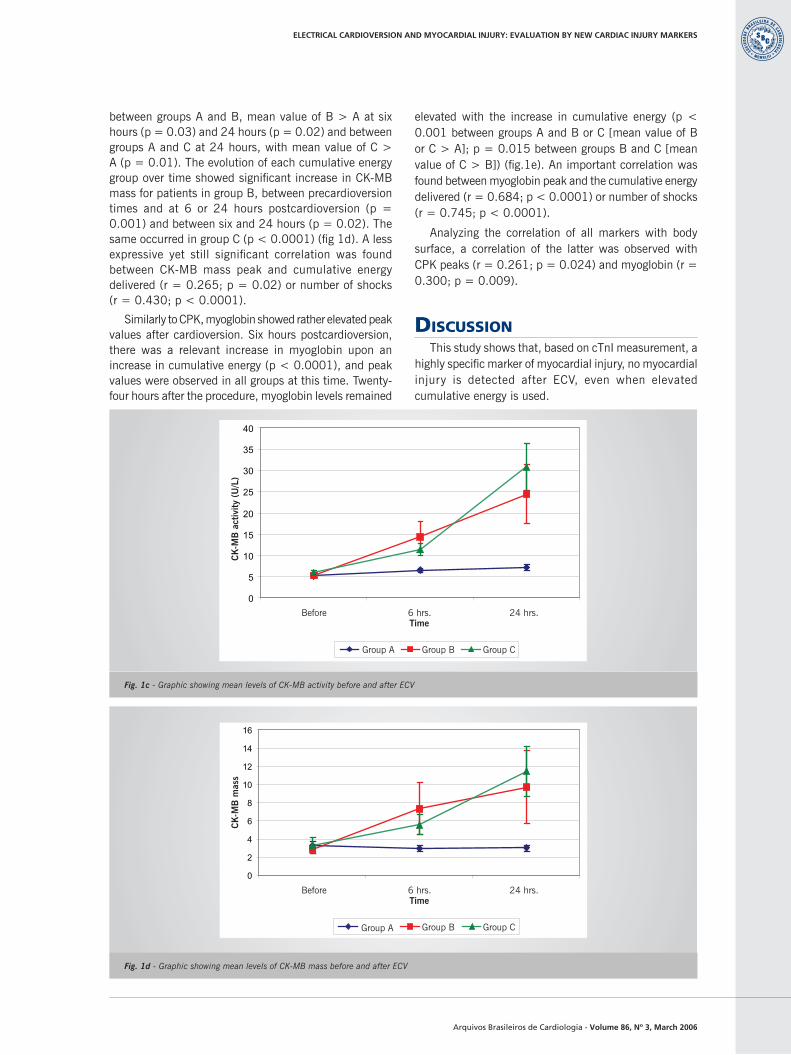
A signifi cant increase in CK-MB activity six and 24 hours after cardioversion was observed between groups A and B (mean value in group B > A; p = 0.002) and 24 hours after cardioversion between groups A and C (mean value in group C > A; p < 0.0001). The analysis of the evolution of each cumulative energy group over time showed that patients in groups B and C had a rather signifi cant increase as compared to the precardioversion levels (p < 0.0001), which was not observed in group A (lowest p value = 0.3) (fi g. 1c). A positive correlation was found between CK-MB activity peak and the cumulative energy delivered (r = 0.429; p < 0.0001) or the number of shocks (r = 0.642; p < 0.0001).
Among the markers that changed after cardioversion, CK-MB mass had lower expressivity, with increase
Fig.1a – Graphic showing the detectable values of Cardiac troponin I in two patients, one from Group B obtained six and 24 hours after ECV and the other from Group C obtained before and six hours after ECV. Seventy-four patients had undetectable cTnI at all times. Normal value for cTnI up to 1 ng/mL; values < 0,5 ng/mL are not detectable
0
200
400
600
800
1000
1200
1400
1600
1800
2000
Antes 6hs 24hsTempo
CPK
(U/L
)
Grupo A Grupo B Grupo C
Fig. 1b - Graphic showing mean levels of CPK before and after ECV
ELECTRICAL CARDIOVERSION AND MYOCARDIAL INJURY: EVALUATION BY NEW CARDIAC INJURY MARKERS
0.52 0.5
0.64 0.6
0
0.2
0.4
0.6
0.8
Before 6 hrs. 24hrs.
Group B Group C
Car
díac
trop
onin
I (n
g/m
L)
Time
BeforeTime6 hrs. 24 hrs.
Group A Group B Group C
Arquivos Brasileiros de Cardiologia - Volume 86, Nº 3, March 2006
0
2
4
6
8
10
12
14
16
Antes 6hs 24hsTempo
CK
MB
-M (n
g/m
l )
Grupo A Grupo B Grupo C
0
5
10
15
20
25
30
35
40
Antes 6hs 24hsTempo
CK
MB
-ativ
idad
e (U
/L)
Grupo A Grupo B Grupo C
Fig. 1c - Graphic showing mean levels of CK-MB activity before and after ECV
Fig. 1d - Graphic showing mean levels of CK-MB mass before and after ECV
between groups A and B, mean value of B > A at six hours (p = 0.03) and 24 hours (p = 0.02) and between groups A and C at 24 hours, with mean value of C > A (p = 0.01). The evolution of each cumulative energy group over time showed signifi cant increase in CK-MB mass for patients in group B, between precardioversion times and at 6 or 24 hours postcardioversion (p = 0.001) and between six and 24 hours (p = 0.02). The same occurred in group C (p < 0.0001) (fi g 1d). A less expressive yet still signifi cant correlation was found between CK-MB mass peak and cumulative energy delivered (r = 0.265; p = 0.02) or number of shocks (r = 0.430; p < 0.0001).
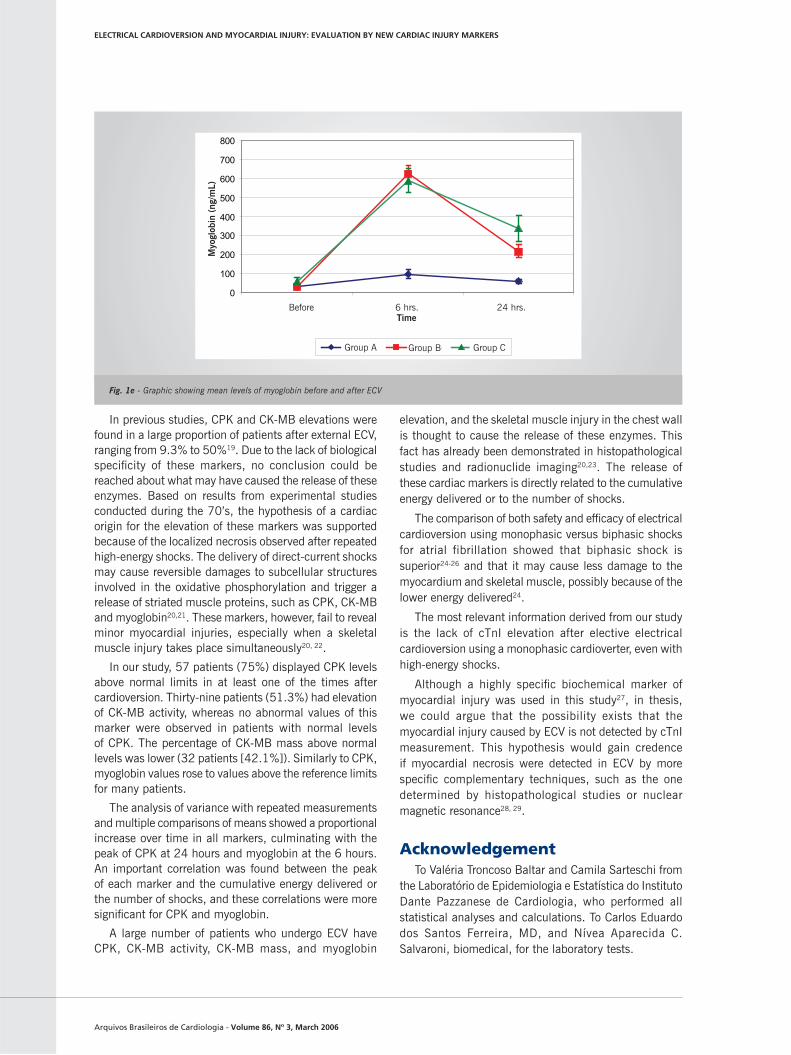
Similarly to CPK, myoglobin showed rather elevated peak values after cardioversion. Six hours postcardioversion, there was a relevant increase in myoglobin upon an increase in cumulative energy (p < 0.0001), and peak values were observed in all groups at this time. Twenty-four hours after the procedure, myoglobin levels remained
elevated with the increase in cumulative energy (p < 0.001 between groups A and B or C [mean value of B or C > A]; p = 0.015 between groups B and C [mean value of C > B]) (fi g.1e). An important correlation was found between myoglobin peak and the cumulative energy delivered (r = 0.684; p < 0.0001) or number of shocks (r = 0.745; p < 0.0001).
Analyzing the correlation of all markers with body surface, a correlation of the latter was observed with CPK peaks (r = 0.261; p = 0.024) and myoglobin (r = 0.300; p = 0.009).
DISCUSSIONThis study shows that, based on cTnI measurement, a
highly specifi c marker of myocardial injury, no myocardial injury is detected after ECV, even when elevated cumulative energy is used.
ELECTRICAL CARDIOVERSION AND MYOCARDIAL INJURY: EVALUATION BY NEW CARDIAC INJURY MARKERS
BeforeTime6 hrs. 24 hrs.
Group A Group B Group C
CK
-MB
act
ivity
(U
/L)
BeforeTime6 hrs. 24 hrs.
Group A Group B Group C
CK
-MB
mas
s
Arquivos Brasileiros de Cardiologia - Volume 86, Nº 3, March 2006
In previous studies, CPK and CK-MB elevations were found in a large proportion of patients after external ECV, ranging from 9.3% to 50%19. Due to the lack of biological specifi city of these markers, no conclusion could be reached about what may have caused the release of these enzymes. Based on results from experimental studies conducted during the 70’s, the hypothesis of a cardiac origin for the elevation of these markers was supported because of the localized necrosis observed after repeated high-energy shocks. The delivery of direct-current shocks may cause reversible damages to subcellular structures involved in the oxidative phosphorylation and trigger a release of striated muscle proteins, such as CPK, CK-MB and myoglobin20,21. These markers, however, fail to reveal minor myocardial injuries, especially when a skeletal muscle injury takes place simultaneously20, 22.
In our study, 57 patients (75%) displayed CPK levels above normal limits in at least one of the times after cardioversion. Thirty-nine patients (51.3%) had elevation of CK-MB activity, whereas no abnormal values of this marker were observed in patients with normal levels of CPK. The percentage of CK-MB mass above normal levels was lower (32 patients [42.1%]). Similarly to CPK, myoglobin values rose to values above the reference limits for many patients.
The analysis of variance with repeated measurements and multiple comparisons of means showed a proportional increase over time in all markers, culminating with the peak of CPK at 24 hours and myoglobin at the 6 hours. An important correlation was found between the peak of each marker and the cumulative energy delivered or the number of shocks, and these correlations were more signifi cant for CPK and myoglobin.
A large number of patients who undergo ECV have CPK, CK-MB activity, CK-MB mass, and myoglobin
elevation, and the skeletal muscle injury in the chest wall is thought to cause the release of these enzymes. This fact has already been demonstrated in histopathological studies and radionuclide imaging20,23. The release of these cardiac markers is directly related to the cumulative energy delivered or to the number of shocks.
The comparison of both safety and effi cacy of electrical cardioversion using monophasic versus biphasic shocks for atrial fibrillation showed that biphasic shock is superior24-26 and that it may cause less damage to the myocardium and skeletal muscle, possibly because of the lower energy delivered24.
The most relevant information derived from our study is the lack of cTnI elevation after elective electrical cardioversion using a monophasic cardioverter, even with high-energy shocks.
Although a highly specifi c biochemical marker of myocardial injury was used in this study27, in thesis, we could argue that the possibility exists that the myocardial injury caused by ECV is not detected by cTnI measurement. This hypothesis would gain credence if myocardial necrosis were detected in ECV by more specifi c complementary techniques, such as the one determined by histopathological studies or nuclear magnetic resonance28, 29.
AcknowledgementTo Valéria Troncoso Baltar and Camila Sarteschi from
the Laboratório de Epidemiologia e Estatística do Instituto Dante Pazzanese de Cardiologia, who performed all statistical analyses and calculations. To Carlos Eduardo dos Santos Ferreira, MD, and Nívea Aparecida C. Salvaroni, biomedical, for the laboratory tests.
0
100
200
300
400
500
600
700
800
Antes 6hs 24hsTempo
Mio
glob
ina
(ng/
ml)
Grupo A Grupo B Grupo C
Fig. 1e - Graphic showing mean levels of myoglobin before and after ECV
ELECTRICAL CARDIOVERSION AND MYOCARDIAL INJURY: EVALUATION BY NEW CARDIAC INJURY MARKERS
BeforeTime6 hrs. 24 hrs.
Group A Group B Group C
Myo
glob
in (
ng/m
L)
Arquivos Brasileiros de Cardiologia - Volume 86, Nº 3, March 2006
ELECTRICAL CARDIOVERSION AND MYOCARDIAL INJURY: EVALUATION BY NEW CARDIAC INJURY MARKERS
REFERENCES1. Neumayr G, Hagn C, Gänzer H et al. Plasma levels of troponin T after
electrical cardioversion of atrial fi brillation and fl utter. The American Journal of Cardiology 1997; 80: 1367-9.
2. Beck CS, Pritchard VM, Feil HS. Ventricular fi brillation of long duration abolished by electric shock. JAMA 1947; 135: 985-90.
3. Warner ED, Dahl C, Ewy GA. Myocardial injury from transthoracic defi brillator countershock. Arch Pathol 1975; 99: 55-60.
4. Trouton TG, Allen JD, Adgey AA. Oxidative metabolism and myocardial blood fl ow change after transthoracic DC countershocks in dogs. Eur Heart J 1992; 13: 1431-40.
5. Reiffel YA, McCarthy DM, Leahey EB. Does DC conversion affect isoenzyme recognition of myocardial infarction? Am Heart J 1979; 97: 269-75.
6. Stabilini R, Agostini A, Berli GC et al. Serum myoglobin, total CK, and MB CK isoenzyme after DC cardioversion and during the early phase of acute myocardial infarction. Acta Cardiol 1980; 5: 373-80.
7. Eshani A, Gordon AE, Sobel BE. Effects of electrical countershock on serum creatine phosphokinase (total CPK) isoenzime activity. Am J Cardiol 1976; 37: 12-8.
8. Dahl CF, Ewy GA, Warner ED. Myocardial necrosis from direct current countershock: effect of paddle size and time interval between discharges. Circulation 1974; 50: 956-61.
9. Dalzell GWN, Cunningham SR, Anderson J et al. Electrode pad size, transthoracic impedance and success of external ventricular defi brillation. Am J Cardiol 1989; 64: 741-4.
10. Moak JP. Acute nonpharmacologic treatment of tachyarrhythmias and bradyarrhythmias in pediatric arrhythmias. In Gillette PC, Garson A, (ed.) Electrophysiology and pacing. Philadelphia: WB Saunders, 1990: 516-28.
11. Morrow DA, Antman EM. Cardiac marker elevation after cardioversion: sorting out chicken and egg. Eur Heart J 2000; 21: 171-3.
12. Del Rey JM, Madrid AH, Rubí J et al. Cardiac troponin I and minor cardiac damage: biochemical markers in a clinical model of myocardial lesions. Clin Chem 1998; 44: 2270-6.
13. Madrid AH, Sánchez JMR, Rebollo JMG et al. Correlación anatomopatológica y bioquímica de las lesiones producidas por la radiofrecuencia con catéteres estandar e irrigados de 4mm. Rev Esp Cardiol 2000; 53: 1347-55.
14. Madrid AH, Del Rey JM, Rubi J et al. Biochemical markers and cardiac troponin I release after radiofrequency catheter ablation: approach to size of necrosis. Am Heart J 1998; 136: 948-55.
15. Bonnefoy E, Chevalier P, Kirkorian G et al. Cardiac troponin I does not increase after cardioversion. Chest 1997; 111(1): 15-18.
16. Greaves K, Crake T. Cardiac troponin T does not increase after electrical cardioversion for atrial fi brillation or atrial fl utter. Heart 1998; 80: 226-8.
17. Lund M, French JK, Johnson RN, Williams BF, White HD. Serum troponins T and I after elective cardioversion. Eur Heart J 2000; 21: 245-52.
18. Runsio M, Kallner A, Kallner G, Rsenqvist M, Bergfeldt L. Myocardial injury after electrical therapy for cardiac arrhythmias assessed by troponin T release. Am J Cardiol 1997; 79: 1241-5.
19. Georges J, Spentchian M, Caubel C et al. Time course of troponin I, myoglobin, and cardiac enzyme release after electrical cardioversion. Am J Cardiol 1996; 78: 825-7.
20. Sánchez JMR, Madrid AH, Rebollo JMG et al. Cardioversion eléctrica externa y sistemas de cardioversión interna: evaluación prospectiva y comparativa del daño celular con troponina I. Rev Esp Cardiol 2002; 55(3): 227-34.
21. Trouton T, Allen I, Adgey A. Oxidative metabolism and myocardial blood fl ow changes after transthoracic DC countershocks in dogs. Eur Heart J 1992;13:1431-40.
22. Zabel M, Kaster W, Hohnloser H. Usefulness of CK-MB and troponin T determinations in patients with acute myocardial infartion complicated by ventricular fi brillation. Clin Cardiol 1991; 16: 23-5.
23. Corbitt JD Jr, Sybers J, Levin JM. Muscle changes of the anterior chest wall secondary to electrical countershock. Am J Clin Pathol 1969; 51: 107-12.
24. Kosior D, Chwyczko T, Stawicki S et al. Myoglobin and troponin I as markers of myocardial damage during cardioversion of atrial fi brillation. Pol Arch Med Wewn 2003; 110(2): 827-36.
25. Carunchio A, Burattini M, Coletta C et al. Electrical cardioversion for atrial fi brillation: advantages of the transthoracic biphasic method. Ital Heart J Suppl 2002; 3(6): 638-45.
26. Kosior DA, Opolski G, Tadeusiak W et al. Serum troponin I and myoglobin after monophasic versus biphasic transthoracic shocks for cardioversion of persistent atrial fi brillation. Pacing Clin Electrophysiol 2005; 28(Suppl 1): S128-32.
27. Adams 3D JE, Boder GS, Davila-Roman VG et al. Cardiac troponin I. A marker with high specifi city for cardiac injury. Circulation 1993; 88(1): 101-6.
28. Pinto IM, Da luz PL, Magalhães HM et al. Consensos sobre métodos em cardiologia. Arq Bras Cardiol 1995; 65: 446-68.
29. Shan K, Constantine G, Sivananthan M, Flamm SD. Role of Cardiac Magnetic Resonance Imaging in the Assesment of Myocardiol Viability. Circulation 2004; 109: 1328-34.
Recommended