IJISET - International Journal of Innovative Science, Engineering & Technology, Vol. 1 Issue 6, August 2014.
www.ijiset.com
ISSN 2348 – 7968
Optimization Of Process Parameters In Cold Chamber Die Casting Process Using Taguchi Method
1*Senthiil, P. V., 2M.Chinnapandian and 3Aakash Sirusshti
1*Head, Director Advance Manufacturing Technology, Mechanical Engineering, St.Peters University, Chennai-600054, Tamilnadu, India
2Head of Aeronautical Engineering, SPCET,Chennai, Tamilnadu, India 3Department of Mech, SRM University Vadapalani Campus, Chennai, Tamilnadu, India.
Abstract:
High Pressure die casting process is a
process ideally suited to manufacture mass
produced metallic parts of complex shapes
requiring precise dimensions. In this process,
molten metal is forced in to empty cavity of
desired shape and is allowed to solidify under
high holding pressure. Die casting is a complex
process which is controlled by many parameters
such as die related parameters, machine related
parameters, which has direct impact on casting
quality. Improper settings of these parameters
end up in producing quality related issues in the
casting. One such issue is blow holes and
porosity which is caused by improper setting of
process parameters. In this paper an industrial
component having blow hole problem has been
taken. This study proposes application of
Taguchi methodology in identifying the optimum
process parameters in order to improve the
casting quality. Process parameters such as
holding furnace temperature, slow shot, Fast
shot, Die holding time, Intensification pressure
has been selected for optimization. The response
factor (quality characteristic) chosen is density of
the casting. Density of the casting is chosen as a
quality characteristic since it has direct
relationship with casting defects. Generally
denser the casting lesser the internal defects such
as porosity, blow holes etc. Besides all this, final
results were validated by both experimental and
casting simulation. [9]
1. Introduction
In manufacturing processes, there are
various parameters with different adjustment
levels, which may influence the final
characteristics of the product. To optimize a
manufacturing process, the trial and error
method is used to identify the best parameters to
manufacture a quality product. However, this
method demands extensive experimental work
and results in a great waste of time and money.
Thus, optimization methods appear to be an
important tool for continuous and rapid
improvements. These experimental methods may
325
IJISET - International Journal of Innovative Science, Engineering & Technology, Vol. 1 Issue 6, August 2014.
www.ijiset.com
ISSN 2348 – 7968
be employed to solve problems related to a
manufacturing process, and understand the
influence of various factors on the final quality
of a given product.
The die casting process is controlled by
several parameters. When properly determined
and adjusted, they result in an improvement in
quality of the die casting parts. Usually, the main
controlled variables are metal temperature, slow
shot, and fast shot, intensification pressure, die
holding time, chemical composition of metal.
G.O. Verran et al. (2008) has analysed the effects
of slow shot, Fast shot, and Intensification
pressure on casting density. The results indicate
that the injection parameters affect the casting
density to a greater extent. Similarly V.D.
Tsoukalas (2008) has analysed effects of die
casting process parameters on porosity formation
using genetic algorithm. The results reveal that
under optimized conditions porosity formation is
very less. P. Vijian et al. (2006) has applied
Taguchi method for optimizing the parameters in
squeeze casting in order to minimize surface
roughness.
In this study optimization of die casting
parameters using Taguchi methodology was
carried out to solve the blow hole problem in an
aluminium component named ‘Front Wheel Hub
I’ . The material is AlSi9MnMg alloy. The
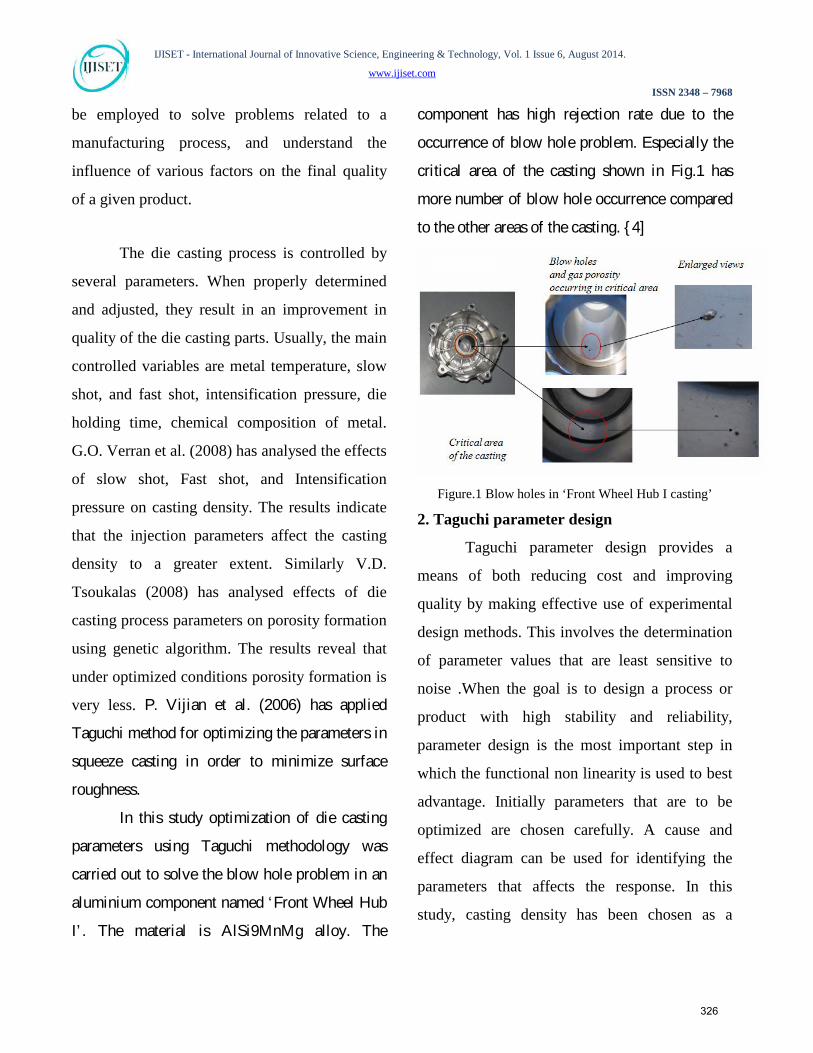
component has high rejection rate due to the
occurrence of blow hole problem. Especially the
critical area of the casting shown in Fig.1 has
more number of blow hole occurrence compared
to the other areas of the casting. { 4]
Figure.1 Blow holes in ‘Front Wheel Hub I casting’
2. Taguchi parameter design
Taguchi parameter design provides a
means of both reducing cost and improving
quality by making effective use of experimental
design methods. This involves the determination
of parameter values that are least sensitive to
noise .When the goal is to design a process or
product with high stability and reliability,
parameter design is the most important step in
which the functional non linearity is used to best
advantage. Initially parameters that are to be
optimized are chosen carefully. A cause and
effect diagram can be used for identifying the
parameters that affects the response. In this
study, casting density has been chosen as a
326
IJISET - International Journal of Innovative Science, Engineering & Technology, Vol. 1 Issue 6, August 2014.
www.ijiset.com
ISSN 2348 – 7968
response, since if the casting density is higher,
lower the internal defects such as blow holes and
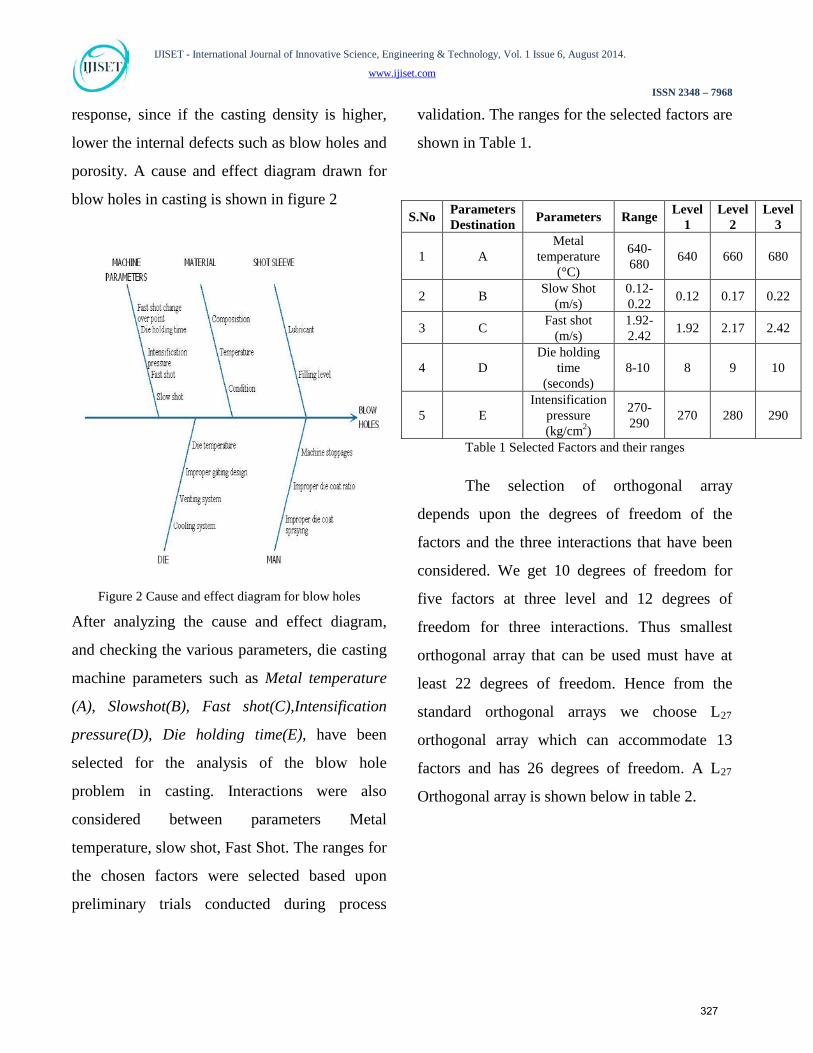
porosity. A cause and effect diagram drawn for
blow holes in casting is shown in figure 2
Figure 2 Cause and effect diagram for blow holes
After analyzing the cause and effect diagram,
and checking the various parameters, die casting
machine parameters such as Metal temperature
(A), Slowshot(B), Fast shot(C),Intensification
pressure(D), Die holding time(E), have been
selected for the analysis of the blow hole
problem in casting. Interactions were also
considered between parameters Metal
temperature, slow shot, Fast Shot. The ranges for
the chosen factors were selected based upon
preliminary trials conducted during process
validation. The ranges for the selected factors are
shown in Table 1.
Table 1 Selected Factors and their ranges
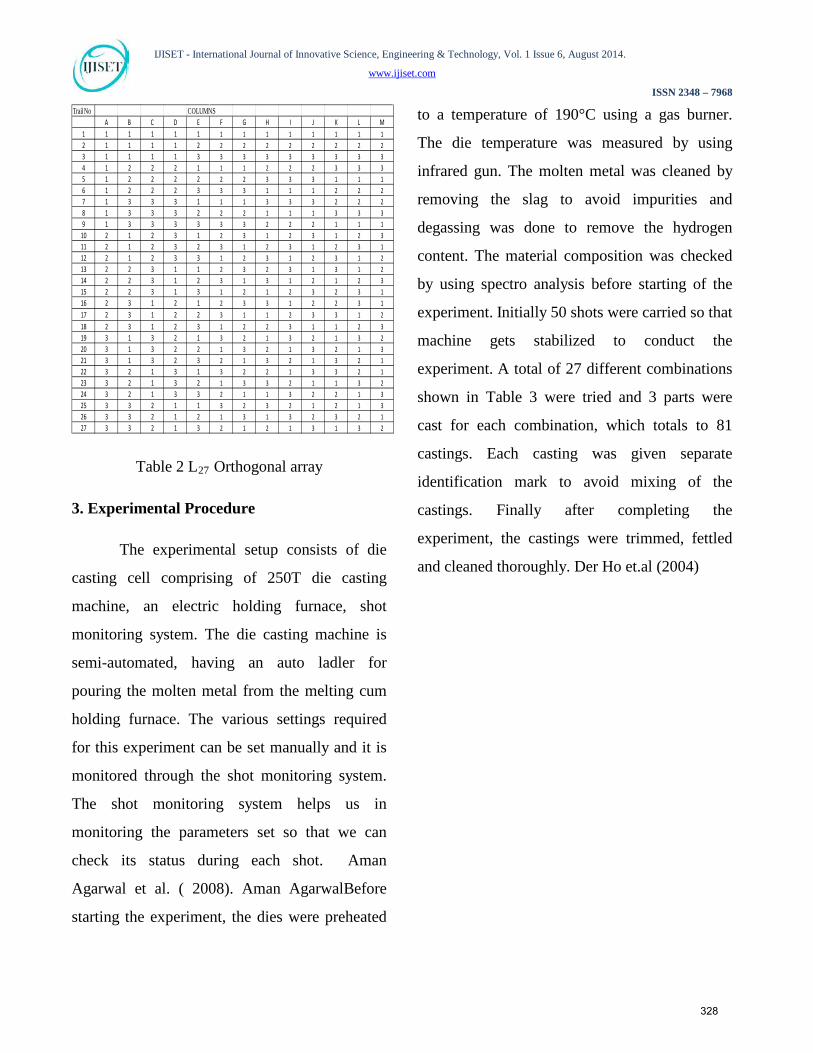
The selection of orthogonal array
depends upon the degrees of freedom of the
factors and the three interactions that have been
considered. We get 10 degrees of freedom for
five factors at three level and 12 degrees of
freedom for three interactions. Thus smallest
orthogonal array that can be used must have at
least 22 degrees of freedom. Hence from the
standard orthogonal arrays we choose L27
orthogonal array which can accommodate 13
factors and has 26 degrees of freedom. A L27
Orthogonal array is shown below in table 2.
S.No Parameters Destination Parameters Range Level
1 Level
2 Level
3
1 A Metal
temperature (°C)
640-680 640 660 680
2 B Slow Shot (m/s)
0.12-0.22 0.12 0.17 0.22
3 C Fast shot (m/s)
1.92-2.42 1.92 2.17 2.42
4 D Die holding
time (seconds)
8-10 8 9 10
5 E Intensification
pressure (kg/cm2)
270-290 270 280 290
327
IJISET - International Journal of Innovative Science, Engineering & Technology, Vol. 1 Issue 6, August 2014.
www.ijiset.com
ISSN 2348 – 7968
Trail NoA B C D E F G H I J K L M
1 1 1 1 1 1 1 1 1 1 1 1 1 12 1 1 1 1 2 2 2 2 2 2 2 2 23 1 1 1 1 3 3 3 3 3 3 3 3 34 1 2 2 2 1 1 1 2 2 2 3 3 35 1 2 2 2 2 2 2 3 3 3 1 1 16 1 2 2 2 3 3 3 1 1 1 2 2 27 1 3 3 3 1 1 1 3 3 3 2 2 28 1 3 3 3 2 2 2 1 1 1 3 3 39 1 3 3 3 3 3 3 2 2 2 1 1 1
10 2 1 2 3 1 2 3 1 2 3 1 2 311 2 1 2 3 2 3 1 2 3 1 2 3 112 2 1 2 3 3 1 2 3 1 2 3 1 213 2 2 3 1 1 2 3 2 3 1 3 1 214 2 2 3 1 2 3 1 3 1 2 1 2 315 2 2 3 1 3 1 2 1 2 3 2 3 116 2 3 1 2 1 2 3 3 1 2 2 3 117 2 3 1 2 2 3 1 1 2 3 3 1 218 2 3 1 2 3 1 2 2 3 1 1 2 319 3 1 3 2 1 3 2 1 3 2 1 3 220 3 1 3 2 2 1 3 2 1 3 2 1 321 3 1 3 2 3 2 1 3 2 1 3 2 122 3 2 1 3 1 3 2 2 1 3 3 2 123 3 2 1 3 2 1 3 3 2 1 1 3 224 3 2 1 3 3 2 1 1 3 2 2 1 325 3 3 2 1 1 3 2 3 2 1 2 1 326 3 3 2 1 2 1 3 1 3 2 3 2 127 3 3 2 1 3 2 1 2 1 3 1 3 2
COLUMNS
Table 2 L27 Orthogonal array
3. Experimental Procedure
The experimental setup consists of die
casting cell comprising of 250T die casting
machine, an electric holding furnace, shot
monitoring system. The die casting machine is
semi-automated, having an auto ladler for
pouring the molten metal from the melting cum
holding furnace. The various settings required
for this experiment can be set manually and it is
monitored through the shot monitoring system.
The shot monitoring system helps us in
monitoring the parameters set so that we can
check its status during each shot. Aman
Agarwal et al. ( 2008). Aman AgarwalBefore
starting the experiment, the dies were preheated
to a temperature of 190°C using a gas burner.
The die temperature was measured by using
infrared gun. The molten metal was cleaned by
removing the slag to avoid impurities and
degassing was done to remove the hydrogen
content. The material composition was checked
by using spectro analysis before starting of the
experiment. Initially 50 shots were carried so that
machine gets stabilized to conduct the
experiment. A total of 27 different combinations
shown in Table 3 were tried and 3 parts were
cast for each combination, which totals to 81
castings. Each casting was given separate
identification mark to avoid mixing of the
castings. Finally after completing the
experiment, the castings were trimmed, fettled
and cleaned thoroughly. Der Ho et.al (2004)
328
IJISET - International Journal of Innovative Science, Engineering & Technology, Vol. 1 Issue 6, August 2014.
www.ijiset.com
ISSN 2348 – 7968
Trial.No Metal
temperature (A)
Slow shot (B)
Fast shot (C)
Die holding time (D)
Intensification pressure (E)
1 640 0.12 1.92 8 270
2 640 0.12 2.17 9 280
3 640 0.12 2.42 10 290
4 640 0.17 1.92 9 280
5 640 0.17 2.17 10 290
6 640 0.17 2.42 8 270
7 640 0.22 1.92 10 290
8 640 0.22 2.17 8 270
9 640 0.22 2.42 9 280
10 660 0.12 1.92 9 290
11 660 0.12 2.17 10 270
12 660 0.12 2.42 8 280
13 660 0.17 1.92 10 270
14 660 0.17 2.17 8 280
15 660 0.17 2.42 9 290
16 660 0.22 1.92 8 280
17 660 0.22 2.17 9 290
18 660 0.22 2.42 10 270
19 680 0.12 1.92 10 280
20 680 0.12 2.17 8 290
21 680 0.12 2.42 9 270
22 680 0.17 1.92 8 290
23 680 0.17 2.17 9 270
24 680 0.17 2.42 10 280
25 680 0.22 1.92 9 270
26 680 0.22 2.17 10 280
27 680 0.22 2.42 8 290
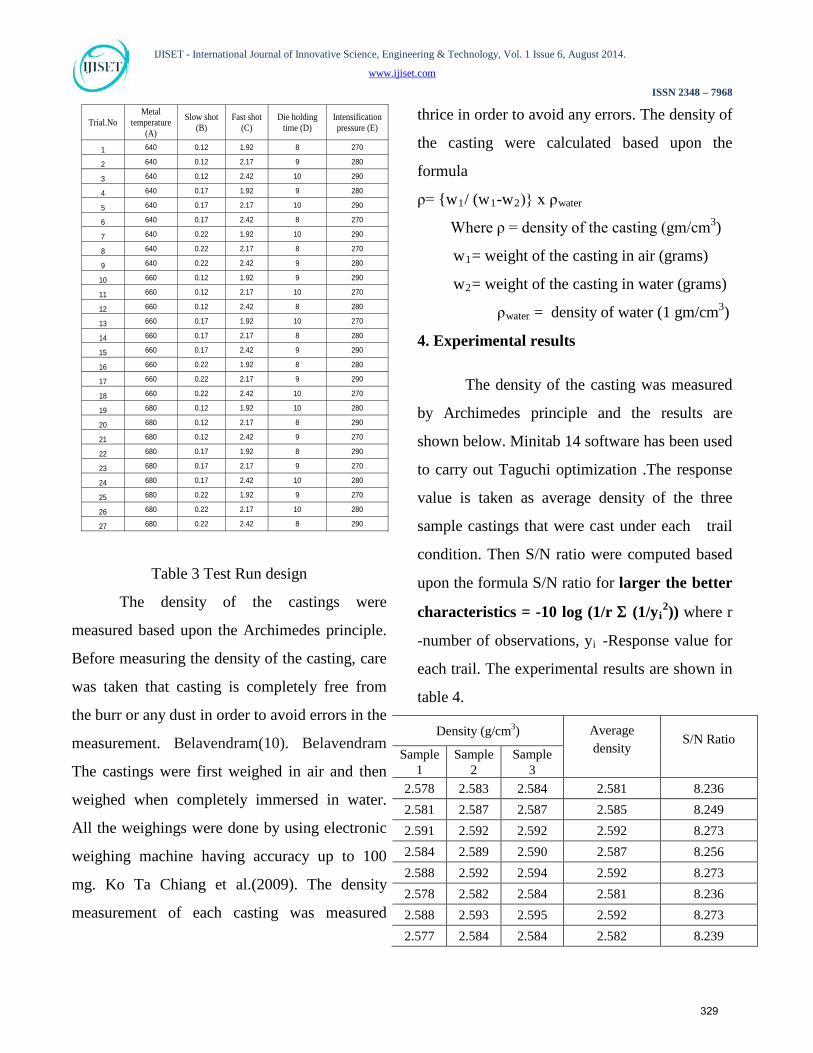
Table 3 Test Run design
The density of the castings were
measured based upon the Archimedes principle.
Before measuring the density of the casting, care
was taken that casting is completely free from
the burr or any dust in order to avoid errors in the
measurement. Belavendram(10). Belavendram
The castings were first weighed in air and then
weighed when completely immersed in water.
All the weighings were done by using electronic
weighing machine having accuracy up to 100
mg. Ko Ta Chiang et al.(2009). The density
measurement of each casting was measured
thrice in order to avoid any errors. The density of
the casting were calculated based upon the
formula
ρ= {w1/ (w1-w2)} x ρwater
Where ρ = density of the casting (gm/cm3)
w1= weight of the casting in air (grams)
w2= weight of the casting in water (grams)
ρwater = density of water (1 gm/cm3)
4. Experimental results
The density of the casting was measured
by Archimedes principle and the results are
shown below. Minitab 14 software has been used
to carry out Taguchi optimization .The response
value is taken as average density of the three
sample castings that were cast under each trail
condition. Then S/N ratio were computed based
upon the formula S/N ratio for larger the better
characteristics = -10 log (1/r Σ (1/yi2)) where r
-number of observations, yi -Response value for
each trail. The experimental results are shown in
table 4.
Density (g/cm3) Average density
S/N Ratio Sample
1 Sample
2 Sample
3 2.578 2.583 2.584 2.581 8.236 2.581 2.587 2.587 2.585 8.249 2.591 2.592 2.592 2.592 8.273 2.584 2.589 2.590 2.587 8.256 2.588 2.592 2.594 2.592 8.273 2.578 2.582 2.584 2.581 8.236 2.588 2.593 2.595 2.592 8.273 2.577 2.584 2.584 2.582 8.239
329
IJISET - International Journal of Innovative Science, Engineering & Technology, Vol. 1 Issue 6, August 2014.
www.ijiset.com
ISSN 2348 – 7968
2.582 2.588 2.589 2.586 8.253 2.587 2.592 2.594 2.591 8.269 2.584 2.582 2.586 2.584 8.246 2.581 2.586 2.587 2.585 8.249 2.582 2.587 2.588 2.586 8.253 2.582 2.588 2.589 2.586 8.253 2.585 2.592 2.593 2.590 8.266 2.583 2.589 2.590 2.587 8.256 2.588 2.589 2.594 2.590 8.266 2.574 2.588 2.589 2.584 8.246 2.586 2.591 2.592 2.590 8.266 2.585 2.591 2.592 2.590 8.266 2.579 2.585 2.585 2.583 8.242 2.588 2.593 2.597 2.592 8.273 2.582 2.586 2.588 2.585 8.249 2.585 2.590 2.592 2.589 8.263 2.582 2.588 2.589 2.586 8.253 2.584 2.590 2.591 2.588 8.259 2.586 2.591 2.593 2.590 8.266
Average=2.587 Average=8.256
Table 4 Experimental results
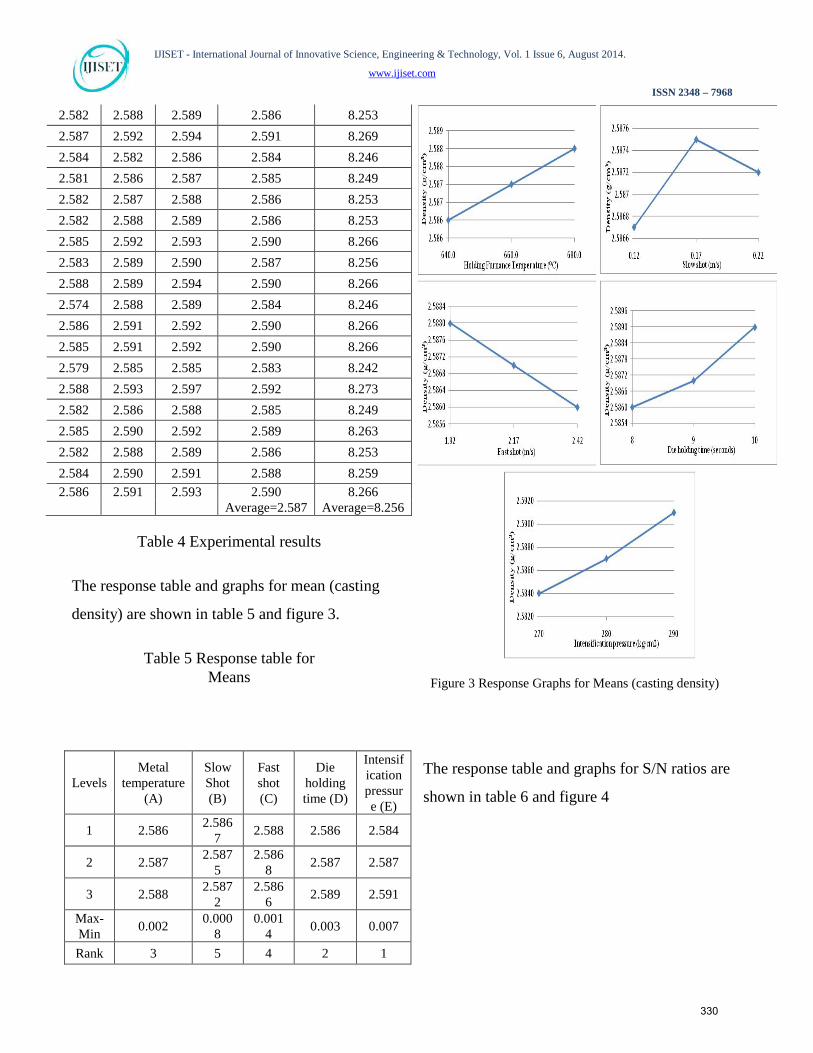
The response table and graphs for mean (casting
density) are shown in table 5 and figure 3.
Table 5 Response table for Means
Figure 3 Response Graphs for Means (casting density)
The response table and graphs for S/N ratios are
shown in table 6 and figure 4 Levels
Metal temperature
(A)
Slow Shot (B)
Fast shot (C)
Die holding time (D)
Intensification pressure (E)
1 2.586 2.5867 2.588 2.586 2.584
2 2.587 2.5875
2.5868 2.587 2.587
3 2.588 2.5872
2.5866 2.589 2.591
Max-Min 0.002 0.000
8 0.001
4 0.003 0.007
Rank 3 5 4 2 1
330
IJISET - International Journal of Innovative Science, Engineering & Technology, Vol. 1 Issue 6, August 2014.
www.ijiset.com
ISSN 2348 – 7968
Levels Metal
temperature (A)
Slow Shot (B)
Fast shot (C)
Die holding time (D)
Intensification pressure (E)
1 8.254 8.255 8.25
9 8.253 8.244
2 8.256 8.258 8.25
6 8.256 8.256
3 8.26 8.257 8.25
5 8.261 8.269 Max-Min 0.006 0.003
0 0.00
4 0.008 0.025
Rank 3 5 4 2 1
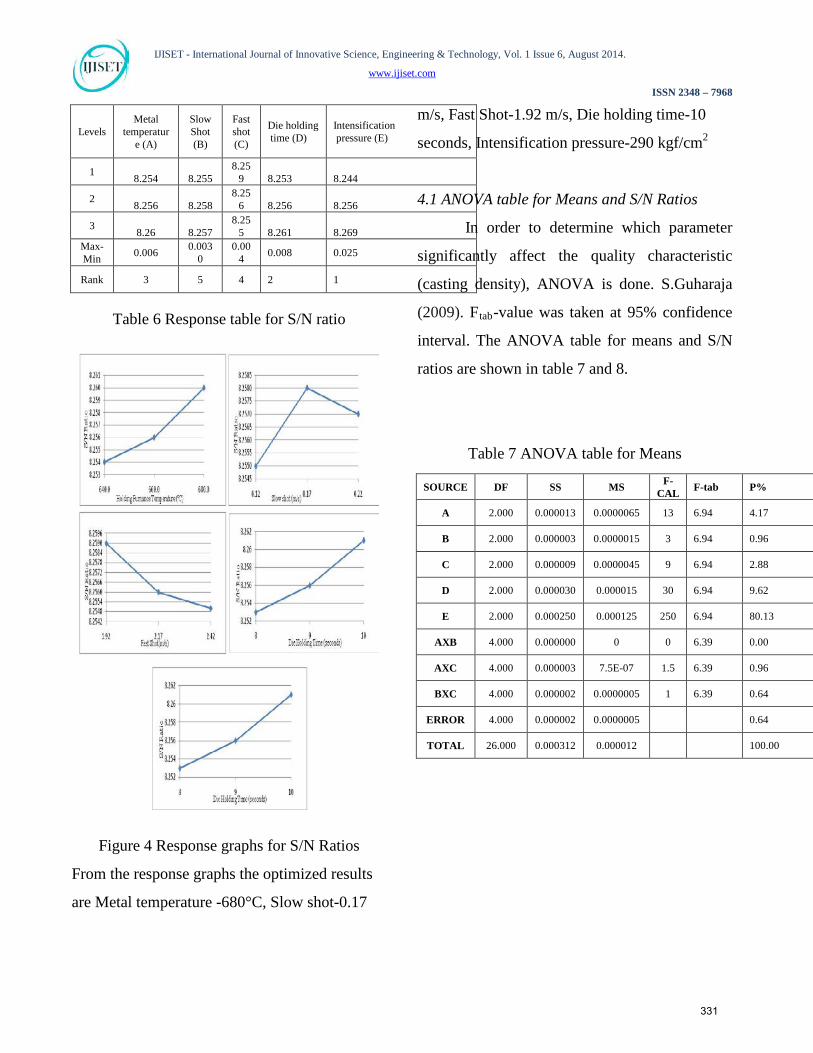
Table 6 Response table for S/N ratio
Figure 4 Response graphs for S/N Ratios
From the response graphs the optimized results
are Metal temperature -680°C, Slow shot-0.17
m/s, Fast Shot-1.92 m/s, Die holding time-10
seconds, Intensification pressure-290 kgf/cm2
4.1 ANOVA table for Means and S/N Ratios
In order to determine which parameter
significantly affect the quality characteristic
(casting density), ANOVA is done. S.Guharaja
(2009). Ftab-value was taken at 95% confidence
interval. The ANOVA table for means and S/N
ratios are shown in table 7 and 8.
Table 7 ANOVA table for Means
SOURCE DF SS MS F-CAL F-tab P%
A 2.000 0.000013 0.0000065 13 6.94 4.17
B 2.000 0.000003 0.0000015 3 6.94 0.96
C 2.000 0.000009 0.0000045 9 6.94 2.88
D 2.000 0.000030 0.000015 30 6.94 9.62
E 2.000 0.000250 0.000125 250 6.94 80.13
AXB 4.000 0.000000 0 0 6.39 0.00
AXC 4.000 0.000003 7.5E-07 1.5 6.39 0.96
BXC 4.000 0.000002 0.0000005 1 6.39 0.64
ERROR 4.000 0.000002 0.0000005 0.64
TOTAL 26.000 0.000312 0.000012 100.00
331
IJISET - International Journal of Innovative Science, Engineering & Technology, Vol. 1 Issue 6, August 2014.
www.ijiset.com
ISSN 2348 – 7968
SOURCE DF SS MS F-CAL F-tab P%
A 2 14E-03 73E-04 10.81 6.94 4.150
B 2 31E-04 155E-04 2.30 6.94 0.881
C 2 104E-03 52E-04 7.70 6.94 2.956
D 2 337E-03 1685E-03 24.96 6.94 9.579
E 2 281E-02 0.001408 208.59 6.94 80.045
AXB 4 4E-05 0.000001 0.15 6.39 0.114
AXC 4 29E-04 7.25E-06 1.07 6.39 0.824
BXC 4 24E-04 0.000006 0.89 6.39 0.682
ERROR 4 27E-04 6.75E-06 0.767
TOTAL 26 3518E-02
0.0001353 100.000
Table 8 ANOVA table for S/N Ratio
4.2 Prediction of Optimum response
In establishing to what extent the data of
the experiment is successful, it is necessary to
predict the mean at the optimum condition and
then compare them against a confirmation
experiment. For mean response the overall
average of casting density (T) is 2.587. The
predicted optimal response (µ) is:
µpredicted = Estimate of the process mean at
optimum condition
= T+(A3-T)+(C1-T)+(D3-T)+(E3-T)
= 2.595
Estimation of confidence interval (means) for
confirmation experiment is :
C.I= (F(α,1,ve)Ve(1/ηeff +1/r))1/2
where α is the level of risk, ve is the degrees of
freedom for error, ηeff is the effective number of
replications is the number trials taken for
confirmation test, Ve is the error variance
ηeff = (Total number of experiments/sum of dof
used in estimate of mean)
UsingthevaluesF-
ratio(0.05,1,4)=7.71,Ve=0.0000005, ve=4,r=3
Therefore C.I = {7.71*0.0000005*((1/9)+(1/3))}
= ±0.001308
The 95% confidence interval of the predicted
optimum of the casting density is 2.593<µ<2.596
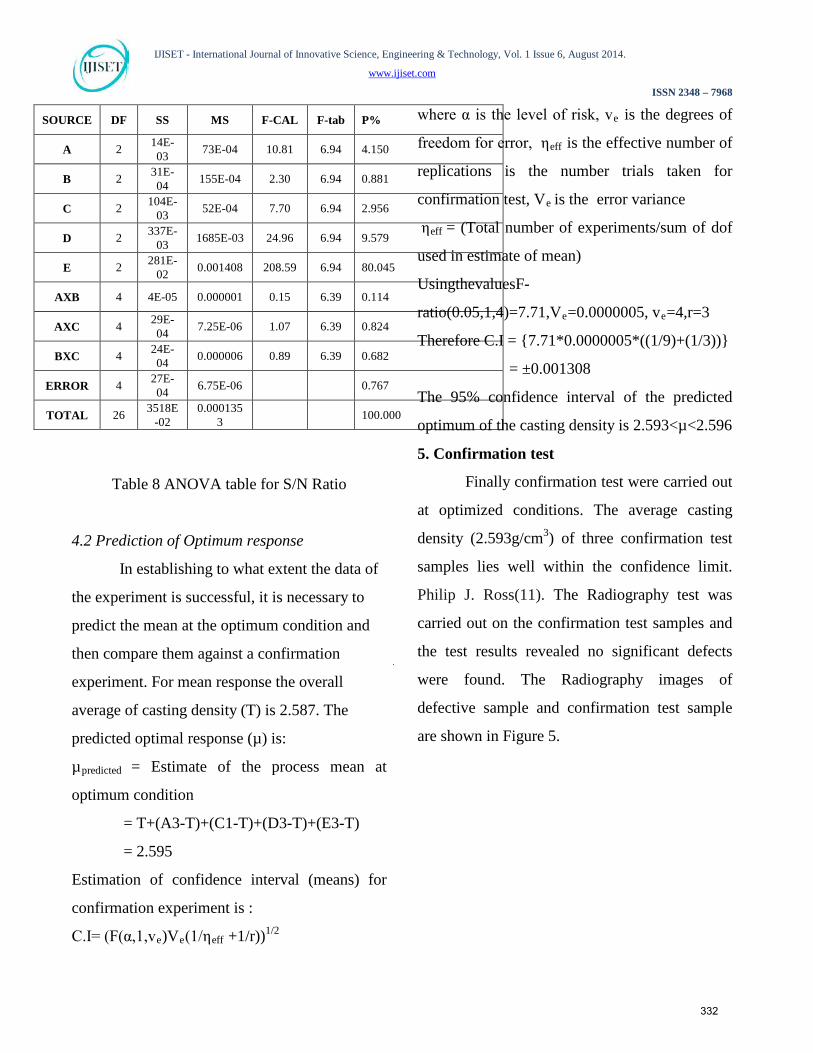
5. Confirmation test
Finally confirmation test were carried out
at optimized conditions. The average casting
density (2.593g/cm3) of three confirmation test
samples lies well within the confidence limit.
Philip J. Ross(11). The Radiography test was
carried out on the confirmation test samples and
the test results revealed no significant defects
were found. The Radiography images of
defective sample and confirmation test sample
are shown in Figure 5.
332
IJISET - International Journal of Innovative Science, Engineering & Technology, Vol. 1 Issue 6, August 2014.
www.ijiset.com
ISSN 2348 – 7968
Defective sample
Confirmation test sample
Figure 5 Radiography images
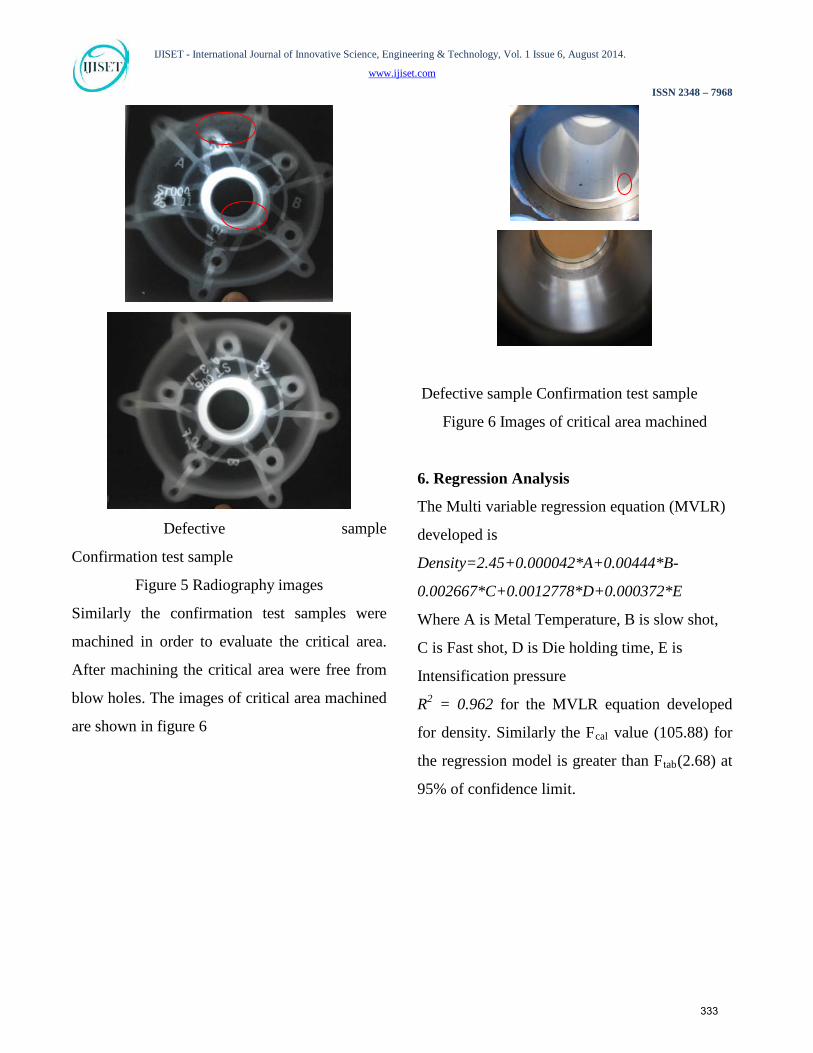
Similarly the confirmation test samples were
machined in order to evaluate the critical area.
After machining the critical area were free from
blow holes. The images of critical area machined
are shown in figure 6
Defective sample Confirmation test sample
Figure 6 Images of critical area machined
6. Regression Analysis
The Multi variable regression equation (MVLR)
developed is
Density=2.45+0.000042*A+0.00444*B-
0.002667*C+0.0012778*D+0.000372*E
Where A is Metal Temperature, B is slow shot,
C is Fast shot, D is Die holding time, E is
Intensification pressure
R2 = 0.962 for the MVLR equation developed
for density. Similarly the Fcal value (105.88) for
the regression model is greater than Ftab(2.68) at
95% of confidence limit.
333
IJISET - International Journal of Innovative Science, Engineering & Technology, Vol. 1 Issue 6, August 2014.
www.ijiset.com
ISSN 2348 – 7968
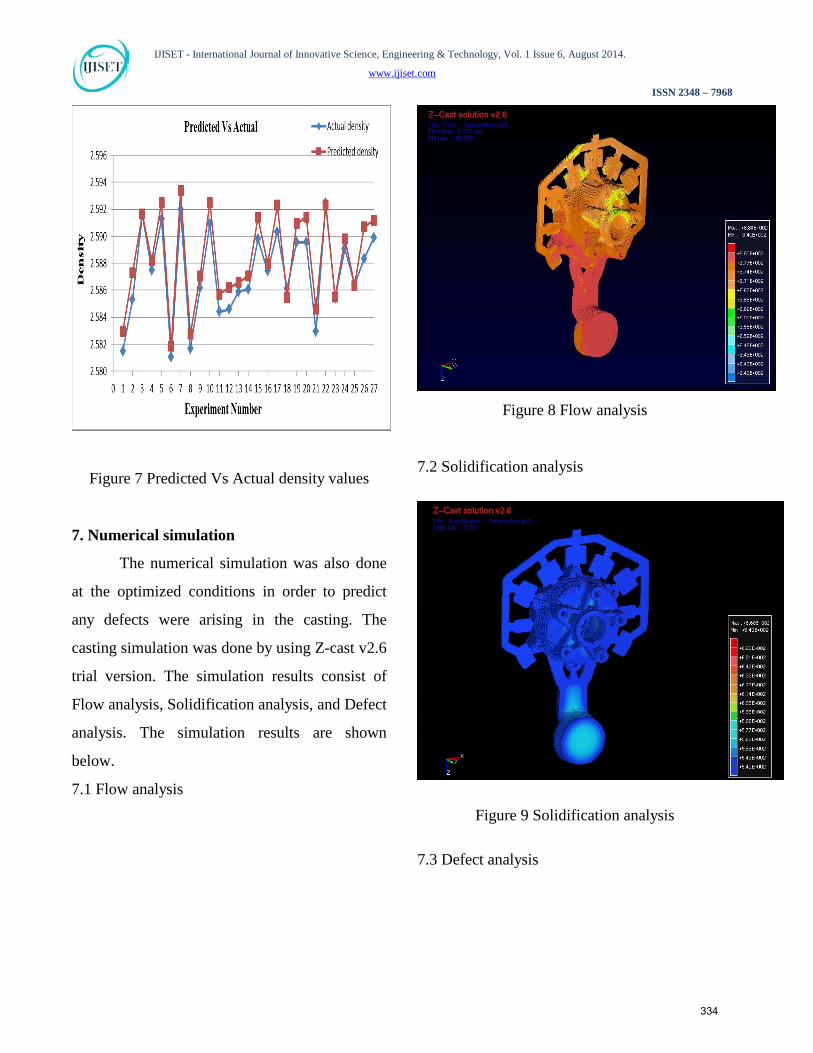
Figure 7 Predicted Vs Actual density values
7. Numerical simulation
The numerical simulation was also done
at the optimized conditions in order to predict
any defects were arising in the casting. The
casting simulation was done by using Z-cast v2.6
trial version. The simulation results consist of
Flow analysis, Solidification analysis, and Defect
analysis. The simulation results are shown
below.
7.1 Flow analysis
Figure 8 Flow analysis
7.2 Solidification analysis
Figure 9 Solidification analysis
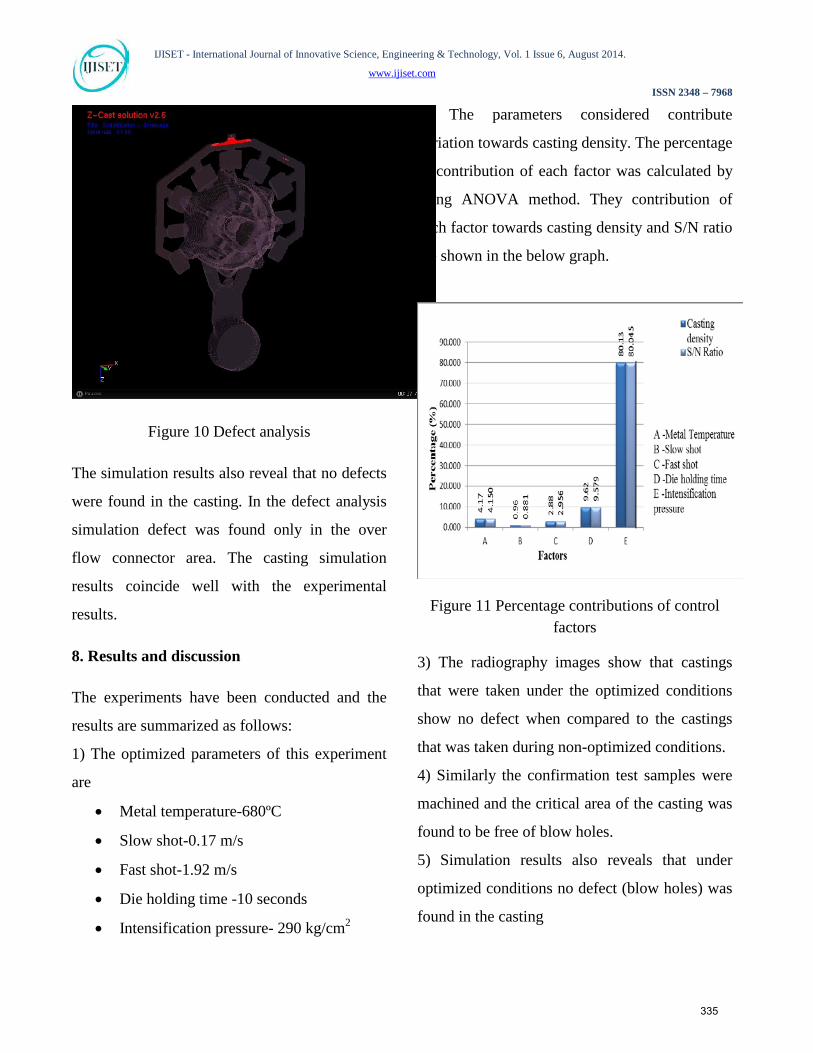
7.3 Defect analysis
334
IJISET - International Journal of Innovative Science, Engineering & Technology, Vol. 1 Issue 6, August 2014.
www.ijiset.com
ISSN 2348 – 7968
Figure 10 Defect analysis
The simulation results also reveal that no defects
were found in the casting. In the defect analysis
simulation defect was found only in the over
flow connector area. The casting simulation
results coincide well with the experimental
results.
8. Results and discussion
The experiments have been conducted and the
results are summarized as follows:
1) The optimized parameters of this experiment
are
• Metal temperature-680ºC
• Slow shot-0.17 m/s
• Fast shot-1.92 m/s
• Die holding time -10 seconds
• Intensification pressure- 290 kg/cm2
2) The parameters considered contribute
variation towards casting density. The percentage
of contribution of each factor was calculated by
using ANOVA method. They contribution of
each factor towards casting density and S/N ratio
are shown in the below graph.
Figure 11 Percentage contributions of control factors
3) The radiography images show that castings
that were taken under the optimized conditions
show no defect when compared to the castings
that was taken during non-optimized conditions.
4) Similarly the confirmation test samples were
machined and the critical area of the casting was
found to be free of blow holes.
5) Simulation results also reveals that under
optimized conditions no defect (blow holes) was
found in the casting
335
IJISET - International Journal of Innovative Science, Engineering & Technology, Vol. 1 Issue 6, August 2014.
www.ijiset.com
ISSN 2348 – 7968
10. Conclusion
The optimization procedure has been
made to study the effect of die casting process
parameters on casting density. Generally when
the casting density is higher, internal defects
such as blow holes and porosity is eliminated.
So, the basic idea is to provide a decision tool for
setting optimum parameters so that the defects
occurring in the casting is reduced.
Taguchi method was applied for
optimizing the die casting process parameters,
and the results obtained using this method was
useful in eliminating the blow holes problem in
Front Wheel Hub I casting. At optimized
parameters the casting quality was better than the
previous casting that was cast under the non
optimized conditions. The radiography test
results also revealed that samples cast under the
optimized parameters has no significant defects.
Similarly the results obtained using simulation
software Z-cast V2.6 (Trial version) at optimized
condition shows no presence of defects in
casting. Considering the contribution of the
parameters, intensification pressure was the
factor showing more influence on the casting
density compared to the other parameters.
The outcome of this project work was
very useful for finding solution for casting
defects that occurs due to the incorrect process
parameters in die casting. Also these results will
help in improving the productivity of Front
Wheel Hub I castings at Roots Cast Private
Limited in future. Thus combination of
optimization techniques along with casting
simulation serves as a tool for improving the
productivity of the castings to a greater extent, in
die casting industries.
References
[1].DOE applied to optimization of aluminum alloy die castings by G.O. Verran, R.P.K. Mendes, L.V.O. Dalla Valentina, , Journal of Materials Processing Technology, May 2008
[2].Optimization of porosity formation in AlSi9Cu3 pressure die castings using genetic algorithm analysis by V.D Tsoukalas , Materials & Design, December 2008
[3].Use of Taguchi method to develop robust design for the magnesium alloy die casting process by Der Ho Wu, Mao Sheng Chang , Materials Science and Engineering, August 2004
[4].Modelling and analysis of the effects of processing parameters on the performance characteristics in the high pressure die casting process of Al–SI alloys by Ko-Ta Chiang & Nun-Ming Liu & Te-Chang Tsai, International Journal of Advanced Manufacturing Technology (2009)
[5].Optimization of squeeze cast parameters of LM6 aluminium alloy for surface roughness using Taguchi method by P. Vijian, V.P.
336
IJISET - International Journal of Innovative Science, Engineering & Technology, Vol. 1 Issue 6, August 2014.
www.ijiset.com
ISSN 2348 – 7968
Arunachalam,Journal of Materials Processing Technology, December 2006
[6].Optimization of Green sand casting process parameters by using Taguchi’s method by S.Guharaja, A.Noorul Haq, K.M.Karuppannan, International Journal of Advanced Manufacturing Technology (2009)
[7].Optimizing power consumption for CNC turned parts using response surface methodology and Taguchi’s technique- by Aman Agarwal,Hari Singh, Pradeep Kumar, Manmohan singh , Journal of materials processing technology ( 2008)
[8].Optimization of high pressure die-casting process parameters using artificial neural network by by Jiang Zheng, Qudong Wang,Peng Zhao, Congbo Wu, International Journal of Advanced Manufacturing Technology (2009)
[9].Die Casting Engineering by Bill Anderson
[10].Quality by design by Nicole Belavendram, He did two Bachelor degrees in B. Sc Physics at Ayya Nadar Janaki Ammal College, M.K. University, Madurai, and B. Tech Automobile Engineering at Madras Institute of Technology (M.I.T) Chrompet Campus, Anna University Chennai, Master degree in M.E Energy Engineering at the College of Engineering Guindy, Anna University Chennai. He received his Ph. D Mechanical Engineering from College of Engineering Guindy, Anna University Chennai in recognizing his significant contribution in the area of Cascaded Latent Heat Storage System for Diesel Engine Waste Heat RecoveryPrentice Hall Publications
[11].Taguchi techniques for Quality engineering, by Philip J. Ross, McGraw Hill Publications. BioGraphy:
Dr. P.V Senthiil is currently working as Director(AMT)Prof & Head, Mechanical Engg at St Peter's University, Chennai, India. He lectures modules in CNC machines, Rapid Prototyping and AI & Robotics. He is also guiding 10 researchers in different disciplines. His work experience as a Factory consultant / knowledge transfer partnership associate working for electronic goods consumer industry in south Africa, France, UK. He was involved in developing, implementing & documenting operating procedures in advanced applications CNC industries for inventory reduction activities within various sectors of the company. Prior to start of his research, Dr Senthiil was working as a Professor at Coimbatore Institute of Technology between May 1986 to Jun 2011. He did his masters in Mechanical Engineering at PSG Tech, April 1985, Bachelor’s at PSG Tech, in Mechanical Engineering, April 1983. He is a World Science Academy Council Member,Visiting Professor – Nottinghamshire University, Malaysia and Visiting Professor of Caledonian University, MUSCAT/AIT Bhagdad Dr M.Chinnapandian is currently working as Prof & Head, Aeronautical Engg at St Peter's College of Engg Tech, Chennai, India. He did two Bachelor degrees in B. Sc Physics at Ayya Nadar Janaki Ammal College, M.K. University, Madurai, and B. Tech Automobile Engineering at Madras Institute of Technology (M.I.T) Chrompet Campus, Anna University Chennai, Master degree in M.E Energy Engineering at the College of Engineering Guindy, Anna University Chennai. He received his Ph. D Mechanical Engineering from College of Engineering Guindy, Anna University Chennai in recognizing his significant contribution in the area of Cascaded Latent Heat Storage System for Diesel Engine Waste Heat Recovery.
337
Recommended