1
NONLINEAR SEISMIC SOIL-STRUCTURE (SSI) ANALYSIS USING
AN EFFICIENT COMPLEX FREQUENCY APPROACH
Dan M. GHIOCEL1
ABSTRACT
The paper introduces a novel approach for modeling nonlinear hysteretic behavior of reinforced
concrete structures in the complex frequency domain. The new approach can be used to perform fast
and accurate nonlinear SSI analyses, including sophisticated nonlinear hysteretic models, at a small
fraction of the runtime of a time domain nonlinear SSI analysis. A case study of a typical low-rise
shearwall nuclear plant structure is shown to demonstrate the proposed nonlinear SSI analysis
approach. The story drifts, shear forces and in-structure acceleration response spectra (ARS) computed
using both linear elastic and nonlinear SSI analyses are compared for the design level earthquake input
with 0.30g ZPGA and a severe review level earthquake input with 0.70g ZPGA. The new nonlinear
SSI approach also eliminates the need to use simplified cascaded multistep approaches that loose
physics by neglecting the effects of the structural degradation on the SSI system dynamic behavior.
INTRODUCTION
Based on the up-to-date technical literature, the nonlinear behavior of dynamic structural
systems can be accurately captured only using nonlinear time domain analyses. Most of the
sophisticated FEA codes include time domain algorithms for nonlinear seismic structural analysis. It
has been believed that the nonlinear hysteretic models can be handled only in the time domain using
step-by-step approaches, so that at each time step the dynamic system stiffness can be updated based
on the stress-dependent material constitutive model, the load and response variations. So far, the
nonlinear hysteretic system behavior could not be fully considered in the complex frequency domain,
except by simple, time-invariant equivalent linear models.
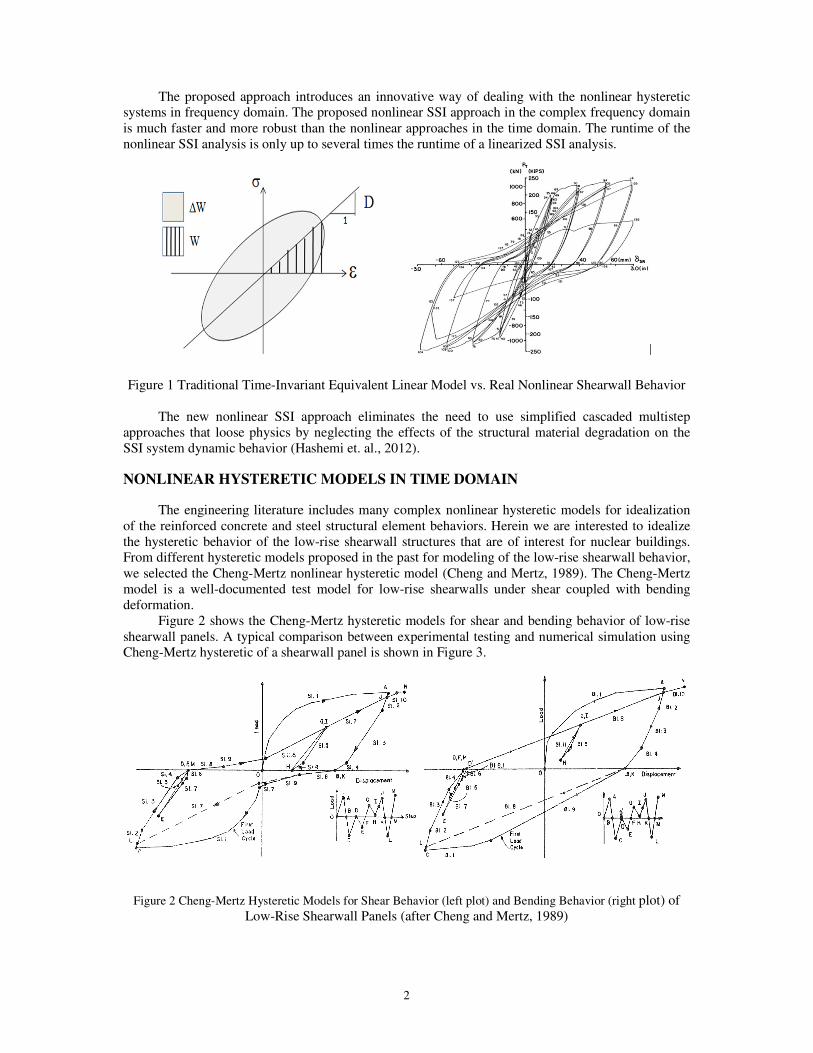
Figure 1 shows a typical time-invariant equivalent linear model that is used in the complex
frequency domain to idealize the real, nonlinear hysteretic system behavior. It should be noted that
equivalent linear model considers the system stiffness and damping properties as being invariant in
both time and frequency. This imposes a serious limitation of the complex frequency approaches for
dealing with nonlinear dynamic models. As a result of this time invariant behavior of the equivalent
linear model, its dynamic system response could be either over or under estimated at different time
moments during the earthquake duration.
Adequate nonlinear hysteretic models should have the stiffness and damping properties that
change with the time due to the accumulation of damage in the material subjected to the random
seismic loading history. Real systems have time-variant dynamic properties that also translate via
complex Fourier transformation in frequency-variant dynamic properties. The nonlinear hysteretic
models can be defined as piece-wise linearized models in both time and frequency domains.
1 Chief of Engineering, Ghiocel Predictive Technologies, Inc., Rochester, New York, and Adjunct Professor,
Case Western Reserve University, Cleveland, Ohio, USA, [email protected]
2
The proposed approach introduces an innovative way of dealing with the nonlinear hysteretic
systems in frequency domain. The proposed nonlinear SSI approach in the complex frequency domain
is much faster and more robust than the nonlinear approaches in the time domain. The runtime of the
nonlinear SSI analysis is only up to several times the runtime of a linearized SSI analysis.
Figure 1 Traditional Time-Invariant Equivalent Linear Model vs. Real Nonlinear Shearwall Behavior
The new nonlinear SSI approach eliminates the need to use simplified cascaded multistep
approaches that loose physics by neglecting the effects of the structural material degradation on the
SSI system dynamic behavior (Hashemi et. al., 2012).
NONLINEAR HYSTERETIC MODELS IN TIME DOMAIN
The engineering literature includes many complex nonlinear hysteretic models for idealization
of the reinforced concrete and steel structural element behaviors. Herein we are interested to idealize
the hysteretic behavior of the low-rise shearwall structures that are of interest for nuclear buildings.
From different hysteretic models proposed in the past for modeling of the low-rise shearwall behavior,
we selected the Cheng-Mertz nonlinear hysteretic model (Cheng and Mertz, 1989). The Cheng-Mertz
model is a well-documented test model for low-rise shearwalls under shear coupled with bending
deformation.
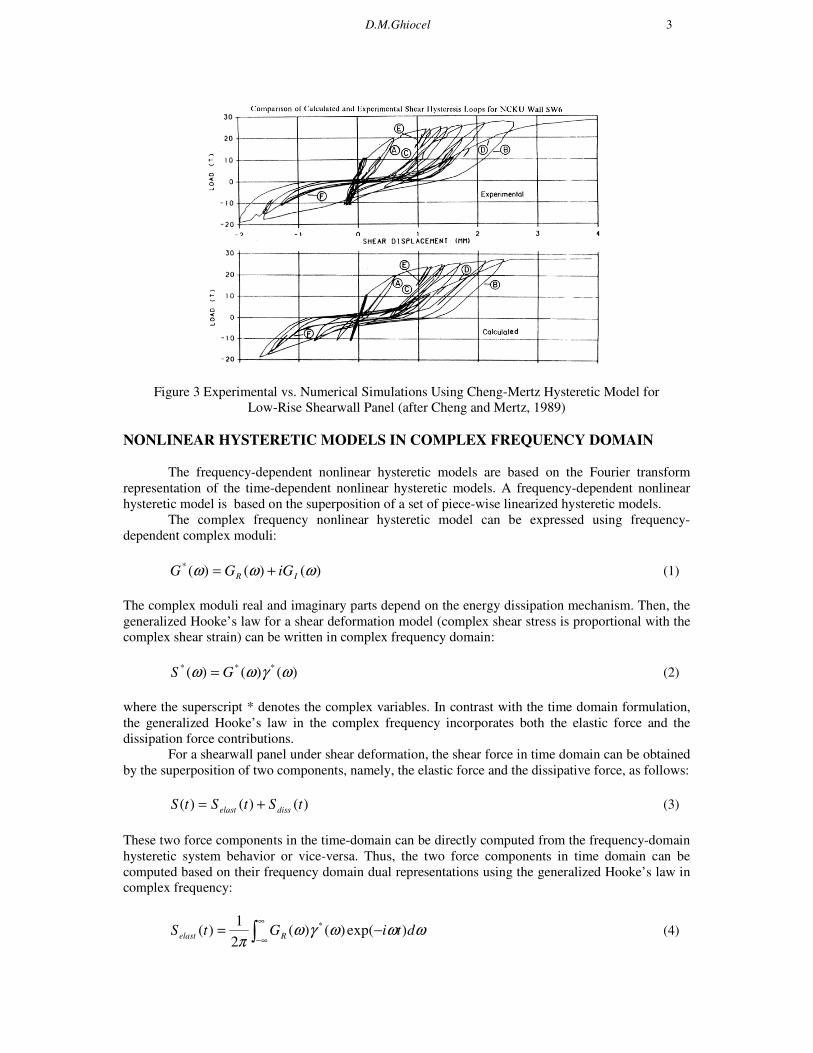
Figure 2 shows the Cheng-Mertz hysteretic models for shear and bending behavior of low-rise
shearwall panels. A typical comparison between experimental testing and numerical simulation using
Cheng-Mertz hysteretic of a shearwall panel is shown in Figure 3.
Figure 2 Cheng-Mertz Hysteretic Models for Shear Behavior (left plot) and Bending Behavior (right plot) of
Low-Rise Shearwall Panels (after Cheng and Mertz, 1989)
D.M.Ghiocel 3
Figure 3 Experimental vs. Numerical Simulations Using Cheng-Mertz Hysteretic Model for
Low-Rise Shearwall Panel (after Cheng and Mertz, 1989)
NONLINEAR HYSTERETIC MODELS IN COMPLEX FREQUENCY DOMAIN
The frequency-dependent nonlinear hysteretic models are based on the Fourier transform
representation of the time-dependent nonlinear hysteretic models. A frequency-dependent nonlinear
hysteretic model is based on the superposition of a set of piece-wise linearized hysteretic models.
The complex frequency nonlinear hysteretic model can be expressed using frequency-
dependent complex moduli:
)()()(*ωωω IR iGGG += (1)
The complex moduli real and imaginary parts depend on the energy dissipation mechanism. Then, the
generalized Hooke’s law for a shear deformation model (complex shear stress is proportional with the
complex shear strain) can be written in complex frequency domain:
)()()( ***ωγωω GS = (2)
where the superscript * denotes the complex variables. In contrast with the time domain formulation,
the generalized Hooke’s law in the complex frequency incorporates both the elastic force and the
dissipation force contributions.
For a shearwall panel under shear deformation, the shear force in time domain can be obtained
by the superposition of two components, namely, the elastic force and the dissipative force, as follows:
)()()( tStStS disselast += (3)
These two force components in the time-domain can be directly computed from the frequency-domain
hysteretic system behavior or vice-versa. Thus, the two force components in time domain can be
computed based on their frequency domain dual representations using the generalized Hooke’s law in
complex frequency:
∫∞
∞−
−= ωωωγωπ
dtiGtS Relast )exp()()(2
1)( *
(4)
4
∫∞
∞−
−= ωωωγωπ
dtiGtS Idiss )exp()()(2
1)( *
(5)
It should be noted that tentative attempts to use frequency-dependent piece-wise linear
hysteretic models for nonlinear material behavior are not totally new. Kausel and Assimaki (2002) and
Yoshida et al. (2002) proposed two different frequency dependent hysteretic models for modeling the
soil material nonlinear behavior under seismic motion.
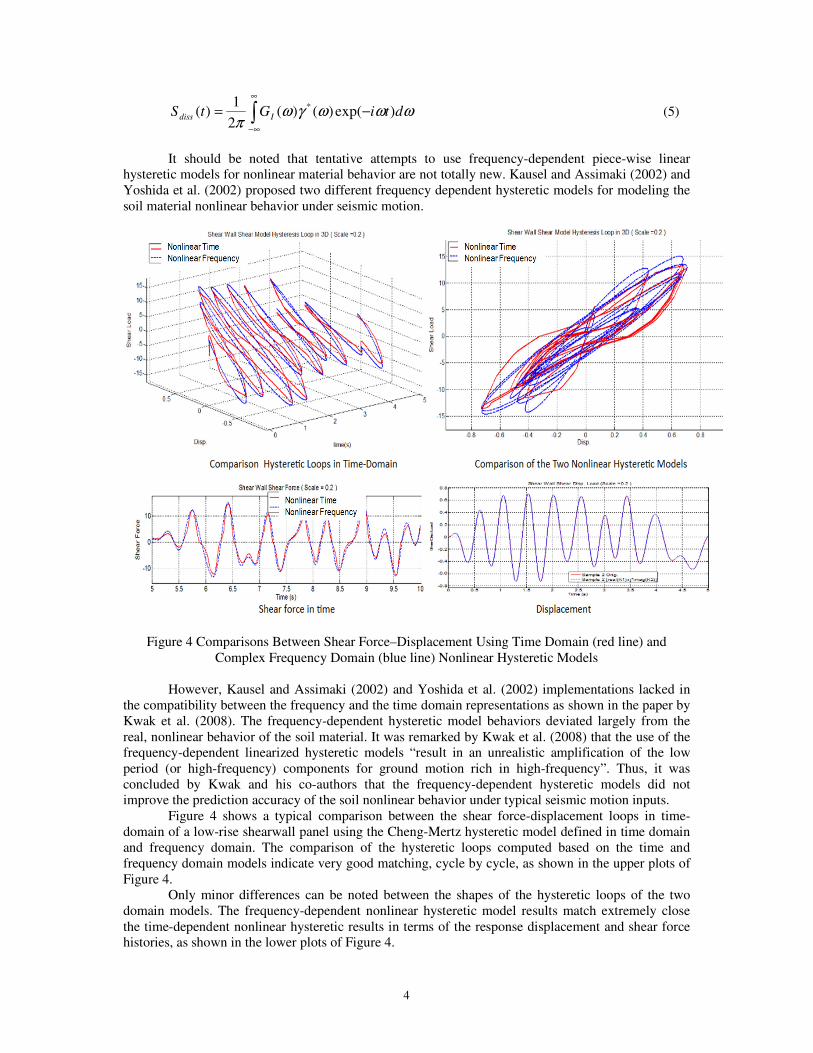
Figure 4 Comparisons Between Shear Force–Displacement Using Time Domain (red line) and
Complex Frequency Domain (blue line) Nonlinear Hysteretic Models
However, Kausel and Assimaki (2002) and Yoshida et al. (2002) implementations lacked in
the compatibility between the frequency and the time domain representations as shown in the paper by
Kwak et al. (2008). The frequency-dependent hysteretic model behaviors deviated largely from the
real, nonlinear behavior of the soil material. It was remarked by Kwak et al. (2008) that the use of the
frequency-dependent linearized hysteretic models “result in an unrealistic amplification of the low
period (or high-frequency) components for ground motion rich in high-frequency”. Thus, it was
concluded by Kwak and his co-authors that the frequency-dependent hysteretic models did not
improve the prediction accuracy of the soil nonlinear behavior under typical seismic motion inputs.
Figure 4 shows a typical comparison between the shear force-displacement loops in time-
domain of a low-rise shearwall panel using the Cheng-Mertz hysteretic model defined in time domain
and frequency domain. The comparison of the hysteretic loops computed based on the time and
frequency domain models indicate very good matching, cycle by cycle, as shown in the upper plots of
Figure 4.
Only minor differences can be noted between the shapes of the hysteretic loops of the two
domain models. The frequency-dependent nonlinear hysteretic model results match extremely close
the time-dependent nonlinear hysteretic results in terms of the response displacement and shear force
histories, as shown in the lower plots of Figure 4.
D.M.Ghiocel 5
The nonlinear SSI approach in complex frequency was implemented in the in-house version of
the ACS SASSI code (2013). To perform the seismic nonlinear SSI analysis the following steps were
applied:
1) For the initial iteration, perform a linear SSI analysis using the elastic properties for the
selected shearwall panels
2) Compute the reinforced concrete shearwall panel behavior in time domain and frequency
domain using the Cheng-Mertz hysteretic model adapted to each selected panel
3) Perform a new SSI analysis iteration using a fast reanalysis (restart analysis) in the complex
frequency domain using the hysteretic models computed in Step 2 for all selected panels
4) Check convergence of the nonlinear SSI response after new SSI iteration, and go back to Step
2 if the convergence was not achieved.
NUCLEAR SHEARWALL BUILDING CASE STUDY
A typical nuclear shearwall structure is investigated. The site-specific earthquake defined for
the design and review levels were assumed to have 0.30g and respectively 0.70g maximum
acceleration, and a 25 seconds duration. The soil profile was defined by an uniform rock formation
with Vs = 6,000 fps.
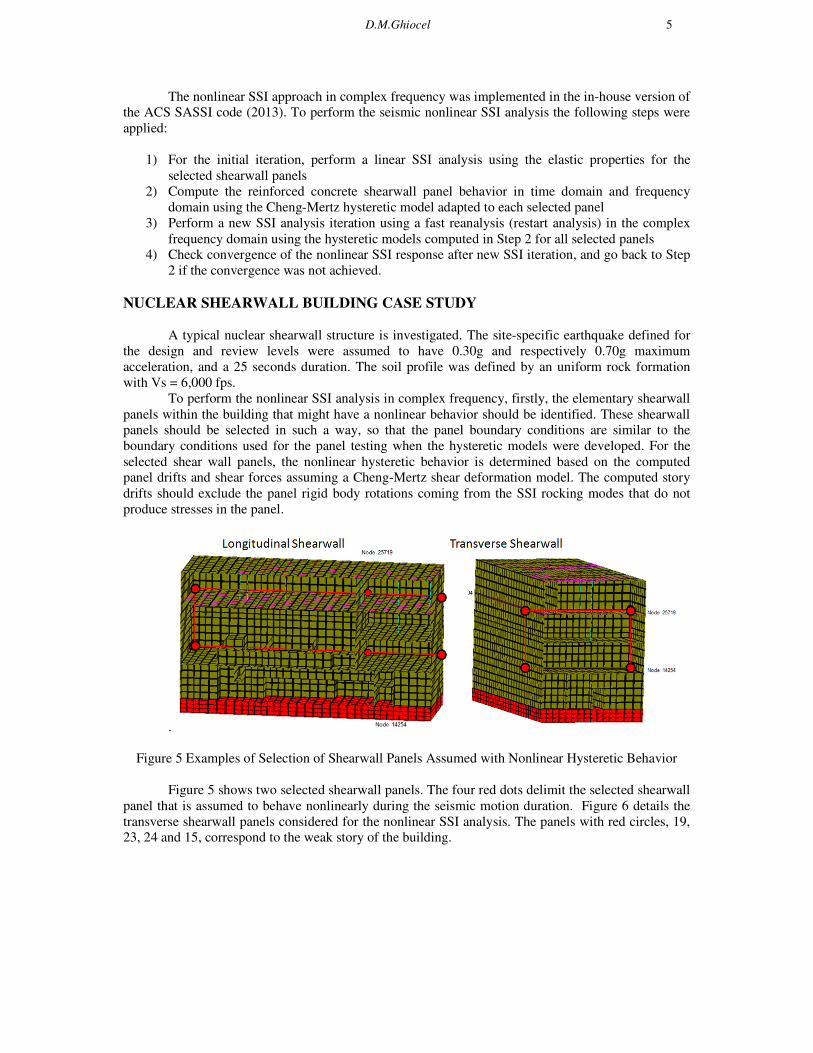
To perform the nonlinear SSI analysis in complex frequency, firstly, the elementary shearwall
panels within the building that might have a nonlinear behavior should be identified. These shearwall
panels should be selected in such a way, so that the panel boundary conditions are similar to the
boundary conditions used for the panel testing when the hysteretic models were developed. For the
selected shear wall panels, the nonlinear hysteretic behavior is determined based on the computed
panel drifts and shear forces assuming a Cheng-Mertz shear deformation model. The computed story
drifts should exclude the panel rigid body rotations coming from the SSI rocking modes that do not
produce stresses in the panel.
.
Figure 5 Examples of Selection of Shearwall Panels Assumed with Nonlinear Hysteretic Behavior
Figure 5 shows two selected shearwall panels. The four red dots delimit the selected shearwall
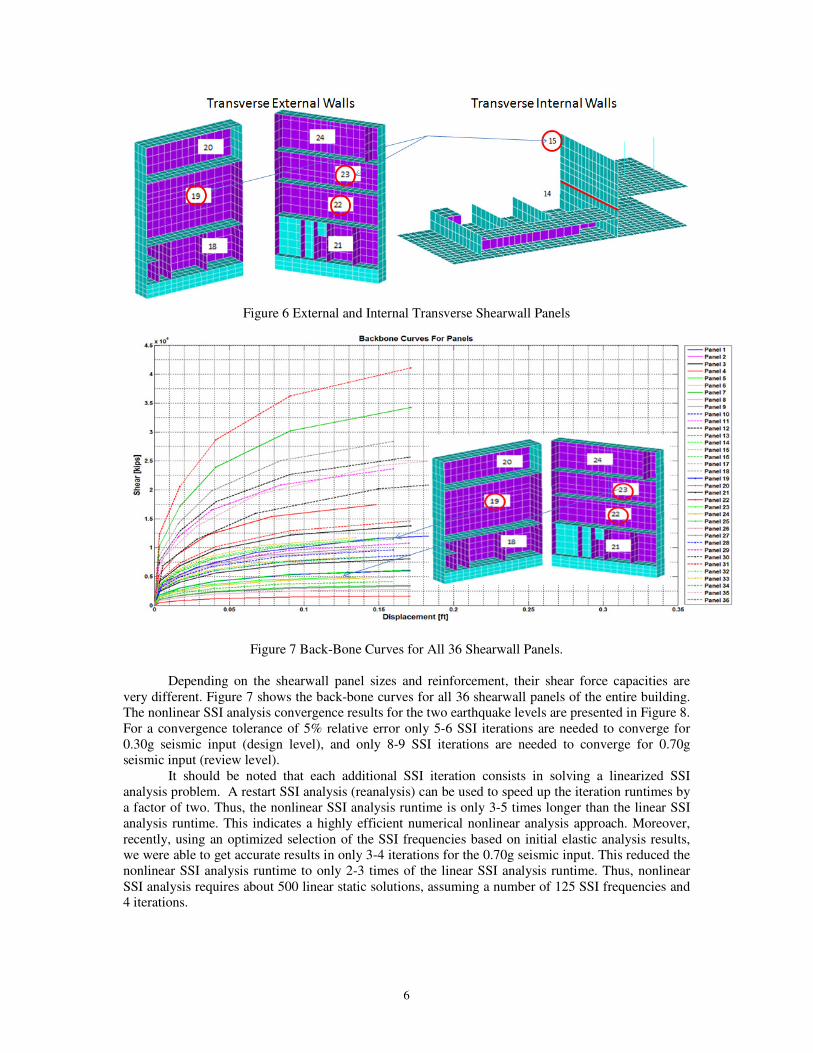
panel that is assumed to behave nonlinearly during the seismic motion duration. Figure 6 details the
transverse shearwall panels considered for the nonlinear SSI analysis. The panels with red circles, 19,
23, 24 and 15, correspond to the weak story of the building.
6
Figure 6 External and Internal Transverse Shearwall Panels
Figure 7 Back-Bone Curves for All 36 Shearwall Panels.
Depending on the shearwall panel sizes and reinforcement, their shear force capacities are
very different. Figure 7 shows the back-bone curves for all 36 shearwall panels of the entire building.
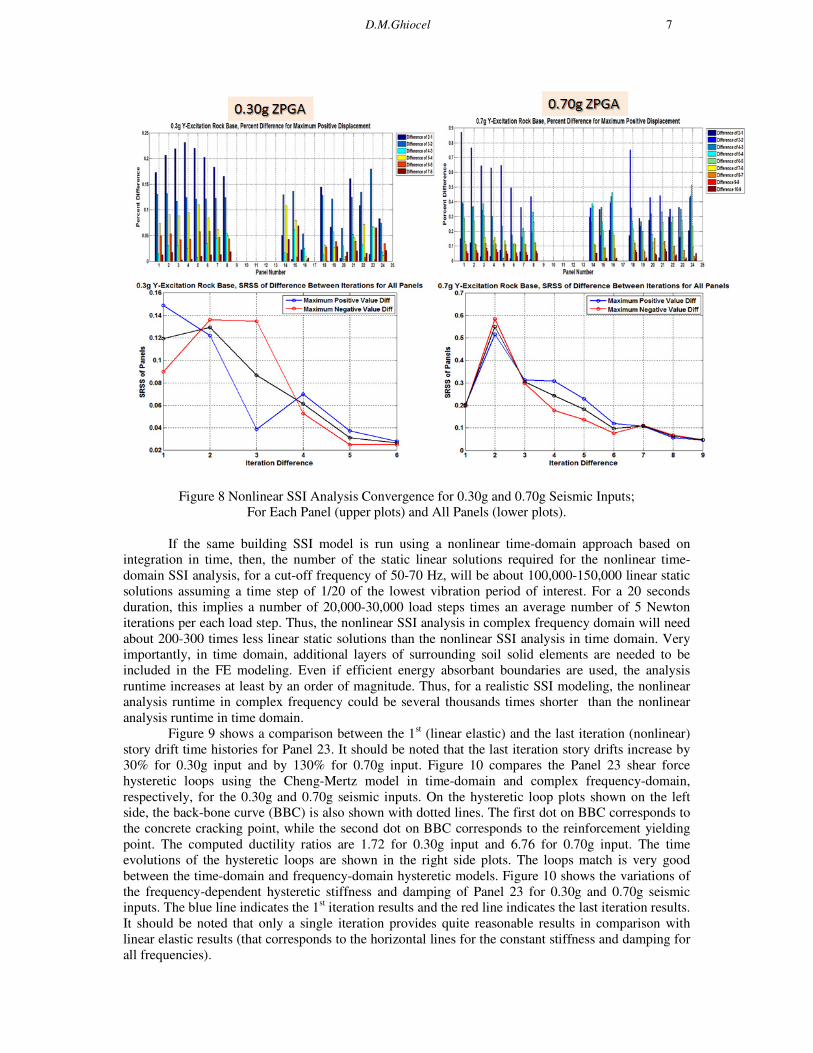
The nonlinear SSI analysis convergence results for the two earthquake levels are presented in Figure 8.
For a convergence tolerance of 5% relative error only 5-6 SSI iterations are needed to converge for
0.30g seismic input (design level), and only 8-9 SSI iterations are needed to converge for 0.70g
seismic input (review level).
It should be noted that each additional SSI iteration consists in solving a linearized SSI
analysis problem. A restart SSI analysis (reanalysis) can be used to speed up the iteration runtimes by
a factor of two. Thus, the nonlinear SSI analysis runtime is only 3-5 times longer than the linear SSI
analysis runtime. This indicates a highly efficient numerical nonlinear analysis approach. Moreover,
recently, using an optimized selection of the SSI frequencies based on initial elastic analysis results,
we were able to get accurate results in only 3-4 iterations for the 0.70g seismic input. This reduced the
nonlinear SSI analysis runtime to only 2-3 times of the linear SSI analysis runtime. Thus, nonlinear
SSI analysis requires about 500 linear static solutions, assuming a number of 125 SSI frequencies and
4 iterations.
D.M.Ghiocel 7
Figure 8 Nonlinear SSI Analysis Convergence for 0.30g and 0.70g Seismic Inputs;
For Each Panel (upper plots) and All Panels (lower plots).
If the same building SSI model is run using a nonlinear time-domain approach based on
integration in time, then, the number of the static linear solutions required for the nonlinear time-
domain SSI analysis, for a cut-off frequency of 50-70 Hz, will be about 100,000-150,000 linear static
solutions assuming a time step of 1/20 of the lowest vibration period of interest. For a 20 seconds
duration, this implies a number of 20,000-30,000 load steps times an average number of 5 Newton
iterations per each load step. Thus, the nonlinear SSI analysis in complex frequency domain will need
about 200-300 times less linear static solutions than the nonlinear SSI analysis in time domain. Very
importantly, in time domain, additional layers of surrounding soil solid elements are needed to be
included in the FE modeling. Even if efficient energy absorbant boundaries are used, the analysis
runtime increases at least by an order of magnitude. Thus, for a realistic SSI modeling, the nonlinear
analysis runtime in complex frequency could be several thousands times shorter than the nonlinear
analysis runtime in time domain.
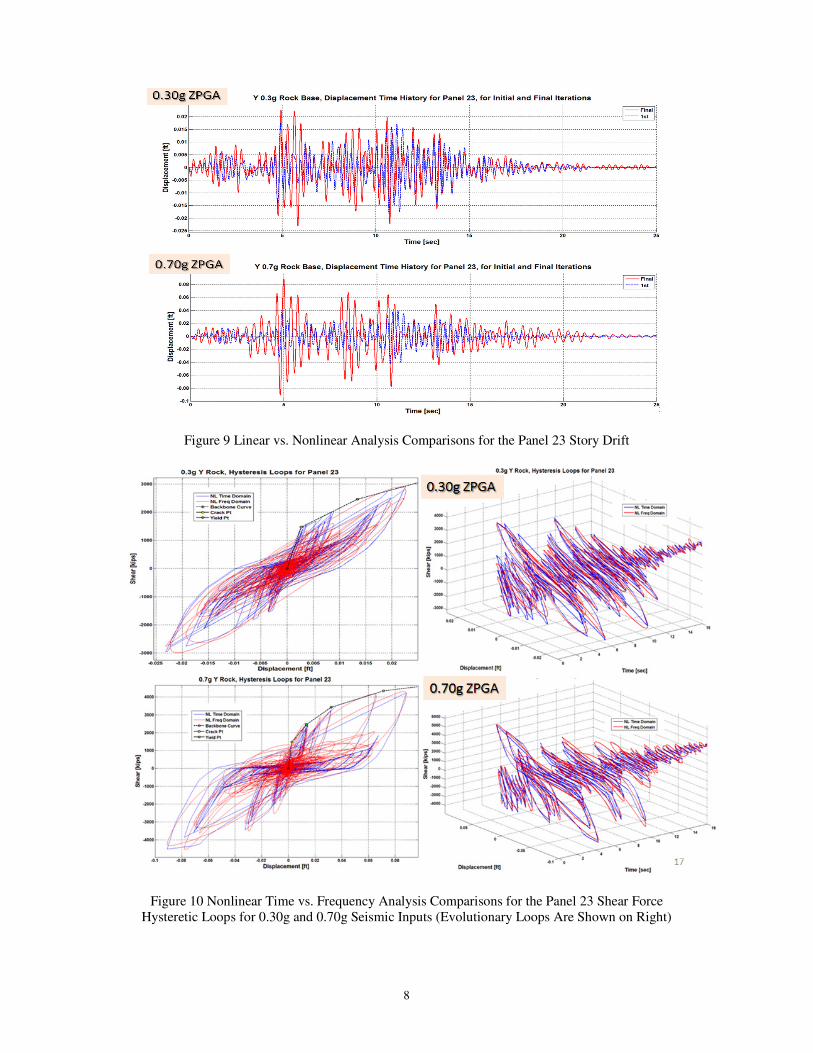
Figure 9 shows a comparison between the 1st (linear elastic) and the last iteration (nonlinear)
story drift time histories for Panel 23. It should be noted that the last iteration story drifts increase by
30% for 0.30g input and by 130% for 0.70g input. Figure 10 compares the Panel 23 shear force
hysteretic loops using the Cheng-Mertz model in time-domain and complex frequency-domain,
respectively, for the 0.30g and 0.70g seismic inputs. On the hysteretic loop plots shown on the left
side, the back-bone curve (BBC) is also shown with dotted lines. The first dot on BBC corresponds to
the concrete cracking point, while the second dot on BBC corresponds to the reinforcement yielding
point. The computed ductility ratios are 1.72 for 0.30g input and 6.76 for 0.70g input. The time
evolutions of the hysteretic loops are shown in the right side plots. The loops match is very good
between the time-domain and frequency-domain hysteretic models. Figure 10 shows the variations of
the frequency-dependent hysteretic stiffness and damping of Panel 23 for 0.30g and 0.70g seismic
inputs. The blue line indicates the 1st iteration results and the red line indicates the last iteration results.
It should be noted that only a single iteration provides quite reasonable results in comparison with
linear elastic results (that corresponds to the horizontal lines for the constant stiffness and damping for
all frequencies).
8
Figure 9 Linear vs. Nonlinear Analysis Comparisons for the Panel 23 Story Drift
Figure 10 Nonlinear Time vs. Frequency Analysis Comparisons for the Panel 23 Shear Force
Hysteretic Loops for 0.30g and 0.70g Seismic Inputs (Evolutionary Loops Are Shown on Right)
D.M.Ghiocel 9
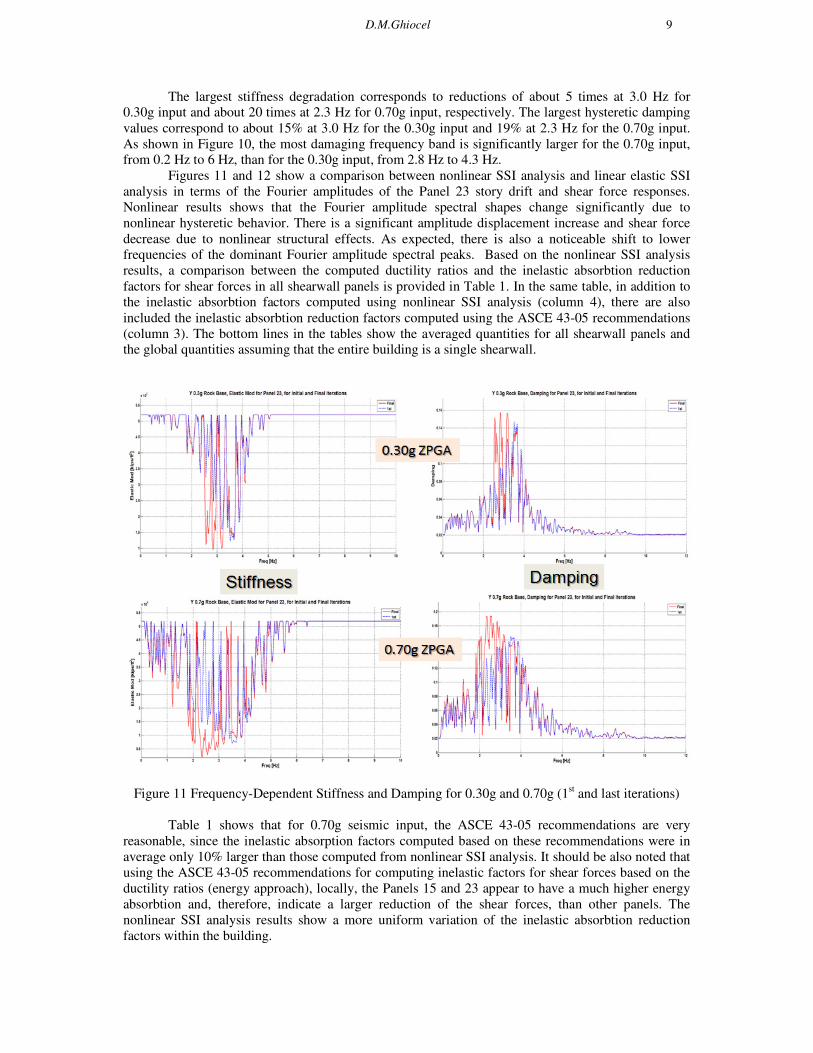
The largest stiffness degradation corresponds to reductions of about 5 times at 3.0 Hz for
0.30g input and about 20 times at 2.3 Hz for 0.70g input, respectively. The largest hysteretic damping
values correspond to about 15% at 3.0 Hz for the 0.30g input and 19% at 2.3 Hz for the 0.70g input.
As shown in Figure 10, the most damaging frequency band is significantly larger for the 0.70g input,
from 0.2 Hz to 6 Hz, than for the 0.30g input, from 2.8 Hz to 4.3 Hz.
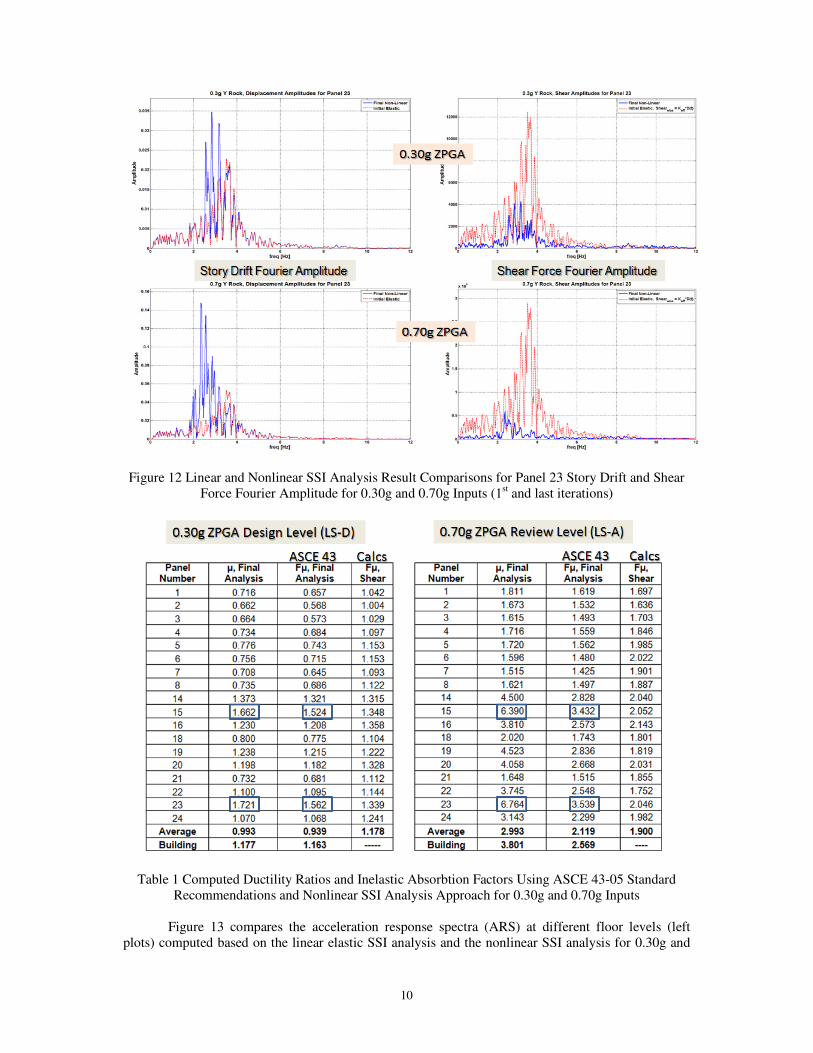
Figures 11 and 12 show a comparison between nonlinear SSI analysis and linear elastic SSI
analysis in terms of the Fourier amplitudes of the Panel 23 story drift and shear force responses.
Nonlinear results shows that the Fourier amplitude spectral shapes change significantly due to
nonlinear hysteretic behavior. There is a significant amplitude displacement increase and shear force
decrease due to nonlinear structural effects. As expected, there is also a noticeable shift to lower
frequencies of the dominant Fourier amplitude spectral peaks. Based on the nonlinear SSI analysis
results, a comparison between the computed ductility ratios and the inelastic absorbtion reduction
factors for shear forces in all shearwall panels is provided in Table 1. In the same table, in addition to
the inelastic absorbtion factors computed using nonlinear SSI analysis (column 4), there are also
included the inelastic absorbtion reduction factors computed using the ASCE 43-05 recommendations
(column 3). The bottom lines in the tables show the averaged quantities for all shearwall panels and
the global quantities assuming that the entire building is a single shearwall.
Figure 11 Frequency-Dependent Stiffness and Damping for 0.30g and 0.70g (1st and last iterations)
Table 1 shows that for 0.70g seismic input, the ASCE 43-05 recommendations are very
reasonable, since the inelastic absorption factors computed based on these recommendations were in
average only 10% larger than those computed from nonlinear SSI analysis. It should be also noted that
using the ASCE 43-05 recommendations for computing inelastic factors for shear forces based on the
ductility ratios (energy approach), locally, the Panels 15 and 23 appear to have a much higher energy
absorbtion and, therefore, indicate a larger reduction of the shear forces, than other panels. The
nonlinear SSI analysis results show a more uniform variation of the inelastic absorbtion reduction
factors within the building.
10
Figure 12 Linear and Nonlinear SSI Analysis Result Comparisons for Panel 23 Story Drift and Shear
Force Fourier Amplitude for 0.30g and 0.70g Inputs (1st and last iterations)
Table 1 Computed Ductility Ratios and Inelastic Absorbtion Factors Using ASCE 43-05 Standard
Recommendations and Nonlinear SSI Analysis Approach for 0.30g and 0.70g Inputs
Figure 13 compares the acceleration response spectra (ARS) at different floor levels (left
plots) computed based on the linear elastic SSI analysis and the nonlinear SSI analysis for 0.30g and
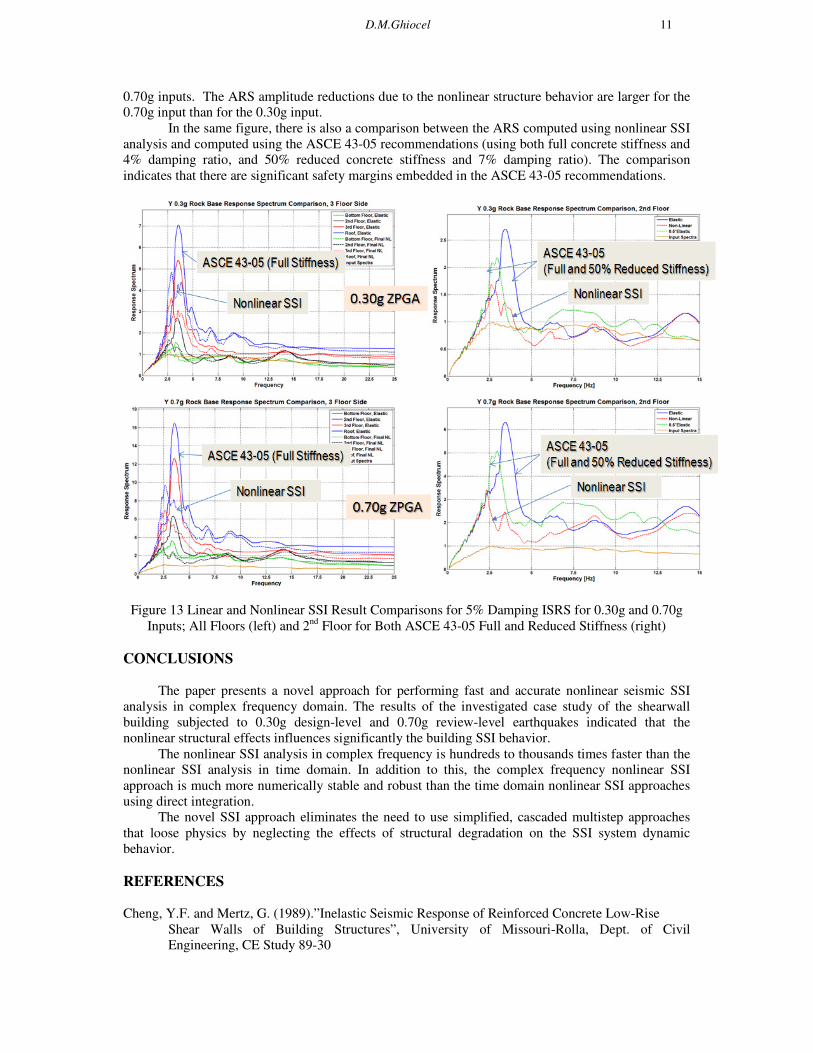
D.M.Ghiocel 11
0.70g inputs. The ARS amplitude reductions due to the nonlinear structure behavior are larger for the
0.70g input than for the 0.30g input.
In the same figure, there is also a comparison between the ARS computed using nonlinear SSI
analysis and computed using the ASCE 43-05 recommendations (using both full concrete stiffness and
4% damping ratio, and 50% reduced concrete stiffness and 7% damping ratio). The comparison
indicates that there are significant safety margins embedded in the ASCE 43-05 recommendations.
Figure 13 Linear and Nonlinear SSI Result Comparisons for 5% Damping ISRS for 0.30g and 0.70g
Inputs; All Floors (left) and 2nd
Floor for Both ASCE 43-05 Full and Reduced Stiffness (right)
CONCLUSIONS
The paper presents a novel approach for performing fast and accurate nonlinear seismic SSI
analysis in complex frequency domain. The results of the investigated case study of the shearwall
building subjected to 0.30g design-level and 0.70g review-level earthquakes indicated that the
nonlinear structural effects influences significantly the building SSI behavior.
The nonlinear SSI analysis in complex frequency is hundreds to thousands times faster than the
nonlinear SSI analysis in time domain. In addition to this, the complex frequency nonlinear SSI
approach is much more numerically stable and robust than the time domain nonlinear SSI approaches
using direct integration.
The novel SSI approach eliminates the need to use simplified, cascaded multistep approaches
that loose physics by neglecting the effects of structural degradation on the SSI system dynamic
behavior.
REFERENCES
Cheng, Y.F. and Mertz, G. (1989).”Inelastic Seismic Response of Reinforced Concrete Low-Rise
Shear Walls of Building Structures”, University of Missouri-Rolla, Dept. of Civil
Engineering, CE Study 89-30
12
Ghiocel, D.M. (2013).“ACS SASSI NQA Version 2.3.0 - An Advanced Computational Software for
3D Dynamic Analyses Including Soil Structure Interaction”, User Manuals, Rev. 8, January
Ghiocel, D.M. and Todorovski, L. (2013) “Fast Nonlinear Seismic Soil-Structure Interaction (SSI)
Analysis of Nuclear Shearwall Concrete Structures Subjected to Review Level Earthquake”,
SMiRT22 Proceedings, Division V, San Francisco, California, August 18-23
Hashemi, A., Elkhoraibi, T.E., and Ostadan, F.(2012) “Probabilistic Nonlinear Analysis of a RC Shear
Wall Structure including Soil-Structure Interaction”, 15WCEE, Lisboa, September
Kausel, E. and Assimaki, D. (2002).”Seismic Simulation of Inelastic Soils Via Frequency-Dependent
Moduli and Damping”, ASCE Journal of Engineering Mechanics, Vol. 128, No.1, January
Kwak, D.Y.K., Jeong, C.G., Park, D. and Park, S. (2008).”Comparisons of Frequency Dependent
Equivalent Linear Analysis Methods”, 14th WCEE, Beijing, October 12-17
Yoshida, N. et al. (2002).”Equivalent Linear Method Considering Frequency-Dependent
Characteristics of Stiffness and Damping”, Journal of Soil Dynamics and Earthquake
Engineering, Vol. 22 No.3
Recommended