
Int.J.Curr.Microbiol.App.Sci (2014) 3(3): 675-694
675
Original Research Article
Spatial and temporal variation of faecal pollution indicators (Escherichia coli and faecal streptococci) and physico-chemical parameters at the Oualidia
lagoon and its watershed (Morocco)
N.Hassou1, M.Maanan2, M.Hennani1, B.Zourarah3, and O.Assobhei1
1Marine biotechnology and Environment laboratory-REMER, Biology department, Faculty of Sciences, 24000 El Jadida, Morocco
2 Laboratoire Géolittomer, UMR 6554 LETG, Université de Nantes. Nantes, France. 3 Marine Geosciences laboratory-REMER (URAC 45), Earth Sciences department, Faculty of
Sciences, 24000 El Jadida, Morocco *Corresponding author
A B S T R A C T
Introduction
The Oualidia lagoon is one of the largest coastal wetlands in Morocco. Mainly in relation to its ornithological importance, this site has been classified as a site of Biological and Ecological Interest (SIBE), through the master plan of Protected Areas of Morocco, and as a Ramsar site since 2005.This site of international value is a
migratory stopover and winter refuge appreciated by various shorebirdspecies. It is characterized by a warm temperate climate and an average rainfall varying according to the natural fluctuations in rainfall patterns. Along its coastal strip made up of the wetland area of Oualidia, different water masses are juxtaposed: the
ISSN: 2319-7706 Volume 3 Number 3 (2014) pp. 675-694 http://www.ijcmas.com
K e y w o r d s
Escherichia coli; faecal streptococci; Oualidia lagoon; Atlantic coastline.
The spatio-temporal variations of four physico-chemical parameters (temperature, salinity, pH and turbidity) and content in water of Escherichia coli (E. coli) and faecal streptococci (FS) were studied between July 2010 and July 2011 at the Oualidia lagoon and its watershed in relation to the discharge of domestic and agricultural wastewater. The analysis of the spatio-temporal variability, performed by principal component analysis (PCA) combining physico-chemical and microbiological parameters, revealed a significant seasonal variation (at p <0.05) for the lagoon waters, while non-significant values (at p> 0.05) were observed for the watershed waters. Results show two types of pollution (i) urban pollution due to the intense tourist activity in summer and (ii) agricultural pollution due to leaching and infiltration of agricultural practices around the lagoon in the rainy season. The observations in this study can be useful for implementing faecal pollution management strategies and for predicting faecal contamination as a function of meteorological conditions.
Int.J.Curr.Microbiol.App.Sci (2014) 3(3): 675-694
676
groundwater, theOualidia lagoon waters, and the oceanic waters. This juxtaposition enables flow transfers of material within this ecosystem.The lagoon of Oualidia is experiencing a malfunction related to confinement, pollution by metals and land cover (Zourarahet al., 2007; Maanan, 2008; Hennaniet al., 2012; Maanan et al., 2013).
Local land use can lead to vegetation damage, soil, water and land degradation, as well as local and global climate change, either directly or indirectly (Mhamdiet al., 2010; Maanan et al., 2013; Lu et al., 2013).
Sewage discharges into the aquatic environment and soil leaching sometimes bring very large quantities of bacteria of faecal origin. Among these bacteria, some are pathogenic and are therefore a health concern whose importance depends on the level of contamination and on the water use (drinking water, swimming, etc.).Research into this kind of contamination is carried out on faecal contamination reference bacteria Escherichia coli (E. coli) and faecal streptococci (FS), whose high concentration may indicate the presence of pathogenic bacteria or viruses in the environment (Kay et al., 2010).
Due to its economic and tourism importance, the Oualidia lagoon has been the subject of several microbiological, hydrological and ecological (Maanan, 2008),geological and sedimentary studies (Maanan et al., 2013) aiming to establish its current state of functioning and to characterize the different areas of this paralic environment.
The anthropogenic pollution may restrict the potential of the lagoons for shellfish
farming and harvesting because ofthe sanitary risk presented by the consumption of these contaminated shellfish, raw or lightly cooked (Zourarahet al.,2009; Gourmelonet al., 2010; Kalloulet al., 2012).Therefore, national and international standards have been established which are based essentially on the level of faecal pollution indicators (Escherichia coli and faecal streptococci).
Faecal coliforms, and especially Escherichia coli, are considered good indicators of faecal water pollution (Schoen et al., 2011; Oladeindeet al., 2013). Their presence in water signifies recent contamination by faecal material, as their survival in the marine environment is limited. The presence of faecal streptococci, especially Streptococcus faecalis which is exclusively of animal origin, is another indicator of faecal contamination. These bacteria have the advantage of being resistant in water longer than faecal coliforms (Montielet al., 2013).
In order to enable the authorities to establish a program to clean up the lagoon based on the real sources of pollution, our study has set the following objectives: (1) to assess the concentrations of faecal indicators bacteria E. coli and FS contained in the lagoon and watershed watersduring an annual cycle (July 2010-June 2011), (2) to study the spatio-temporal distribution of these indicators of contamination depending on the land use of the watershed, (3) to link the variations of the microbiological parameters (E. coli and faecal streptococci) with the physico-chemical parameters (temperature, pH, salinity and turbidity) and the variability of practices resulting from the different land uses in the watershed using the statistical method of PCA (Principal

Int.J.Curr.Microbiol.App.Sci (2014) 3(3): 675-694
677
Component Analysis) as well as the descriptive statistical analysis SPSS 17.0. Materials and Methods
Study site
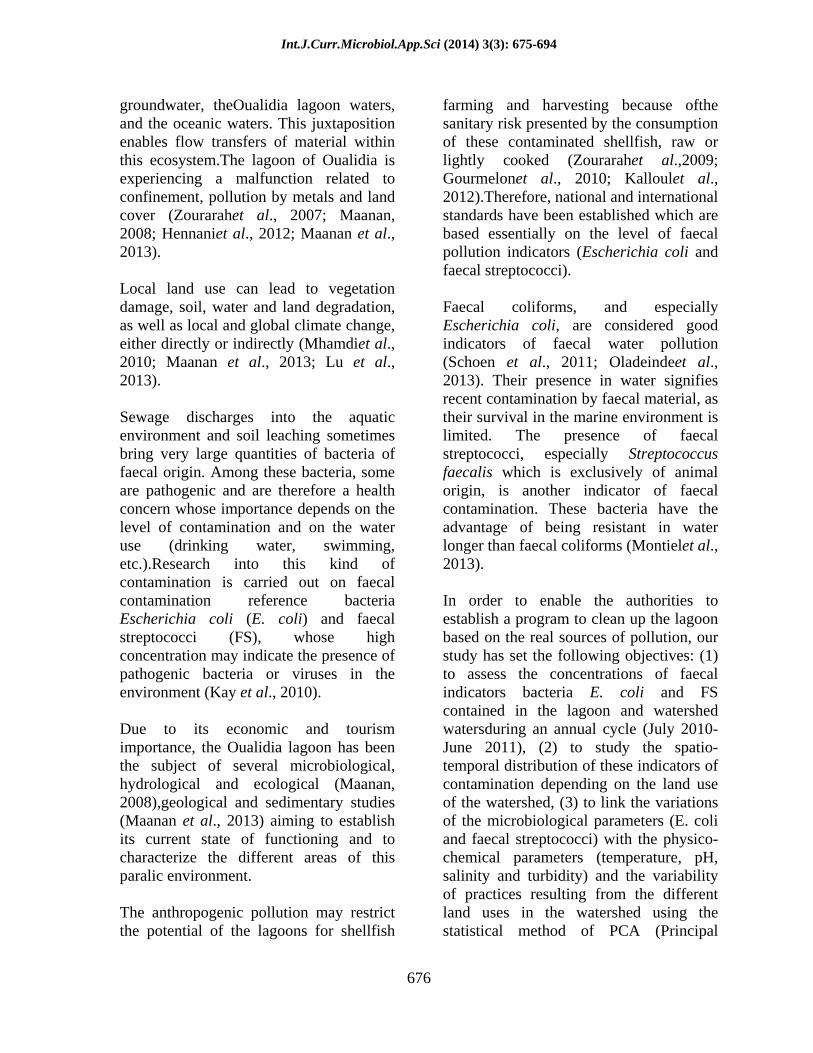
TheOualidia lagoon is located on the Moroccan Atlantic coast in the province of Sidi Bennour, 168 km south of the city of Casablanca, and extends parallel to the coast for a distance of about 8 km long and 0.5 km wide (Figure1).
The communication of the lagoon with the ocean is ensured by two passages located downstream. It extends upstream in the form of a channel, 7 km in length, up to the dike separating the lagoon from the salant tides. Sources of fresh water are distributed along the lagoon, resulting in a dilution of surface water, along a gradient of desalting from downstream to upstream. The main activities are agriculture (essentially cereals and vegetables) and cattle rearing (practiced by more than 90% of the population), shellfish farming (15%) and tourism. The population density has rapidly increased from 7741 inhabitants in 1971 to 15430 inhabitants in 2004 (http://www.statistic.gov.ma/), polluting and non-polluting human activities have been established in the lagoon, various marine activities for boating, bathing, camping, and other human activities have increased, and rapid urbanization of the region has occurred in recent years. In addition to the current population, there is an important influx of tourists in the summer, increasing the population by 54000 (http://www.statistic.gov.ma/).
Land use changes can have significant effects on runoff volume and consequently faecal bacteria input. Differences in land use in Oualidia lagoon and its watershed
are expected to produce different kinds of contamination. For example, aquaculture activities, remains farming of Pacific cupped oysters (Crassostreagigas), may promote the increase of organic enriched-sediment fluxes, whereas faecal bacteria contamination might result from agricultural activities, sewage dumping from urban areas and tourism activities in the lagoon. At present, most wastes waters discharged to Oualidia lagoon are not treated, which means that the contaminant loads might be reduced only by natural processes.
The hydrological regime of the lagoon is primarily subject to the rhythm of the tides. During spring tides, the water flow has an average speed of about 0.46 m/s and a maximum speed of around 0.77 m/s; the filling time during the flow is 7 h 25 min and that of emptying is 5 h during the backflow. During neap tides, flow velocities are lower, in the range of 0.1 to 0.2 m/s, and the times of filling and emptying are 4 h 25 min for the flow and 8 h in the ebb,respectively (Orbi et al., 2008). In addition, the hydrological regime of Oualidia lagoon is subject to the action of upwelling which affects the whole area, especially in summer (Makaouiet al., 2005).
The supply of fresh water to the lagoon occurs only upstream by means of a freshwater effluent, which maintains a certain gradient of desalting at low tide, while downstream it occurs via small resurgences.
Because of its position between two hills forming its watershed, the Oualidia lagoon is a confluence of runoff water during rainfall in the region. On the other hand, faecal contamination (during the spreading of animal manure) and wastewater

Int.J.Curr.Microbiol.App.Sci (2014) 3(3): 675-694
678
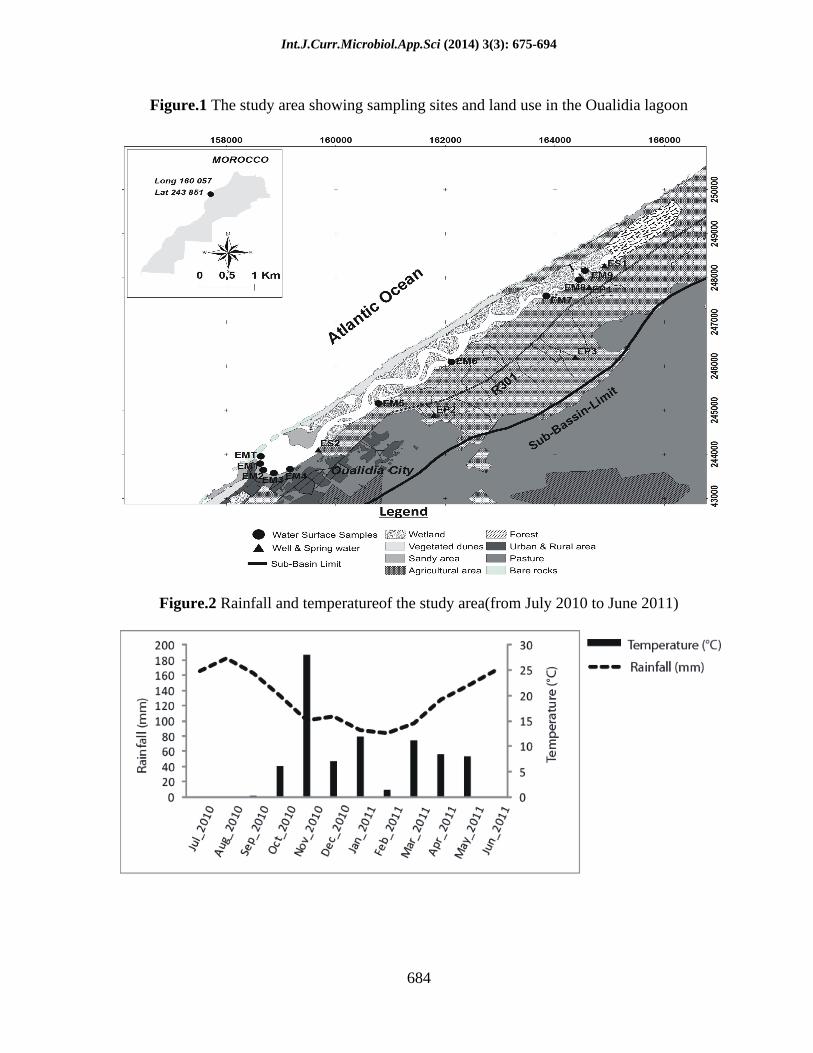
infiltration from septic tanks are the major mainland inputs to the lagoon (El Himeret al., 2013). The maximum rainfalls recorded during our study period were 187 mm in November and 80 mm in January with an average of 46 mm.
Sampling and methods of analysis
This study was carried out at 14 sampling sites distributed across the watershed and the Oualidia lagoon(Figure 1). The sampling points have been distributed as follows:
Points representing the watershed in its agricultural area: EM5, EM6, EM7 and EM8; Points representing the watershed in its urban and touristic area: EM2, EM3, EM4; Points representing a reference of the sea located at the pass of the lagoon (EMT) and a point very close to it (EM1); One point representing the situation at the salt marshes (EM9). Two points located at the downstream portion of the watershed representing points of freshwater sources, one at the upstream part of the lagoon and the other downstream part (PS1 and PS2). Three wells located at the upstream part of watershed EP1, EP2 and EP3 representing the groundwater infiltration.
The water samples were collected monthly at low tide during spring tides for an annual cycle (July 2010-June 2011) in ethanol-rinsed high density polyethylene bottles, which were washed with ambient water before sampling to prevent ethanol-related die-off. The water samples were collected near the edge at 20 cm from the surface for the sampling sites located in the lagoon, at the water outlet for the points of freshwater resurgence and by Niskin bottle for wells. They were
collected in sterile glass bottles previously rinsed with water from the sampling site. They were then stored at 4 °C and transported to the laboratory where the bacteriological analysis was performed in a period not exceeding 24 hours after collection. The rainfall data for 2010-2011 were obtained from the local weather station.
The physico-chemical analyses were performed by direct measurements on the surface, namely, the temperature and pH using a field pH meter Consort C931, the dissolved oxygen using a field oximeter Consort C932 and the salinity using a field salinometer Consort C861.
Faecal indicator bacteria (Escherichia coli and faecal streptococci) in lagoon and watershedwaters were enumerated using standard membrane filtration methods (APHA, 1999). Water samples (100ml) were enumerated in duplicate. The following media, temperature, and incubation time were used: EMB selective agar (Biokar) incubated at 37±1 °C for 24 h to individuate colonies of Escherichia coli and Slanetz and Bartley Agar (Biokar) incubated at 37±1°C for 48 h to individuate colonies of faecal streptococci. Results are expressed as Logarithmic number of colonies forming units (CFU) 100 ml-1 of water for faecal streptococci and for Escherichia coli.
The monthly mean rainfall data in Oualidia lagoon watershed form July 2010 to June 2011 are presented in the Figure 2. Depending on the rainfall data, the study period was divided into rainy period from September 2010 to May 2011 and a dry period including the months July-August 2010and June 2011.
Statistical analyses were performed using

Int.J.Curr.Microbiol.App.Sci (2014) 3(3): 675-694
679
the SPSS software (Statistical Package for the Social Sciences). The data were processed using Principal Component Analysis (PCA). Pearson s product-moment correlation test was used to identify significant relationships between indicators of faecal pollution (E. coli and FS), temperature, pH, salinity and turbidity in samples of water from both the lagoon and the watershed. The different statistical methods were performed with a confidence interval of 95% (p <0.05).
Results and Discussion
Spatio-temporal variation of physico-chemical parameters in the oualidia lagoon and watershed waters
Lagoon waters
The range of physico-chemical data and their median and mean values are summarized in the table 1. Temperature data leads to the conclusion that the temperature of the water lagoon is higher in the dry season than during the rainy season with average and median temperatures of 22.18°C and 21.82°C in the dry season and 19.35°C and 19.5 °C in the rainy season, respectively.
Measurements of the water temperature showseasonal and spatial variations(from downstream to upstream of the lagoon). Thus, over the year, two distinct periodsare observed, rainy and dry, during which the temperature undergoes opposing trends (Figure 2a).In the rainy season, the waters are cooler with temperatures below 20°C. The minimum is recorded from December to March.The dry period shows a gradual warming of the lagoon, with temperatures between 17°C and 29°C. In contrast to the previous period, the temperature increases from downstream to
upstream, where significant warming occurs and presents higher values. The decrease in water temperature downstream of the lagoon during the summer shows the existence of an upwelling phenomenon characterized by an upwelling of cold water rich in nutrients (Makaouiet al., 2005).
The salinity data shows that the medians of the dry and rainy periods are 24.45 g L-1
and 24.35 g L-1, respectively. Avery pronounced decreasing salinity gradient from downstream to upstream is observed which is explained by the arrival of freshwater masses upstream of the lagoon, which reduce the salinity of the EM9, EM8, EM6 and EM7 stations (upstream of the lagoon) (Figure 2b).This finding has also been reported by Rharbiet al., 2003.During the rainy season, rainfall inputs lower water salinity, unlike in the dry season when an increase in this parameter takes place supported by strong evaporation.
The pH is alkaline at all sampling pointsduring both rainy and dry periods. It varies between 8.13, recorded during the rainiest months, and 8.03, noted for dry months (Figure 2c). This implies a clear marine influence and absence of a significant seasonal variation.
The turbidity data confirms that the turbidity of the lagoon waters is higher in the dry season than in the rainy period, with medians of 5.62 and 4.40 NTU, respectively. During the rainy season, when the waters are more turbid upstream of the lagoon, turbidity reaches a maximum value greater than 9 NTU. The observed turbidity is due to leaching of the watershed(Göranssonet al., 2013). During the dry period, the turbidity is very significant downstream of the lagoon with

Int.J.Curr.Microbiol.App.Sci (2014) 3(3): 675-694
680
a maximum value of 10 NTU (Figure 2d), which is due to tourism activity. This shows that the turbidity generated by tourism activity is greater than that caused by rainfall inputs.
Waters of the lagoon watershed
The range of physico-chemical data and their median and mean values are summarized in the table 2.Temperature data confirm that the temperature of the watershed waters is higher in the dry season than in the rainy period with mean and median temperatures of 21.1°C and 20.8°C in the dry season and 20.2°C and 20.23°C in the rainy season, respectively. Figure 3a shows that only the seasonal effect is significant in the water temperature changes (temperatures in the dry period are higher than in the rainy period). In contrast, there is no tidal influence on the temperature. According to the median of both dry and rainy periods, it is clear that the seasonal effect is significant for the temperature parameter. Figure 3b shows that salinity increases from the upstream watershed downstream. In fact, the water sources are affected by ocean waters given their proximity to the sea(KaidRassouet al., 2005). The salinity at the water source station ES2 is close to 6 g L-1during the dry season and 4 g L-1in the rainy season. An analysis of the figures of temperature and salinity shows no significant action of the tides.
The pH values in natural waters are between 6 and 8.5. They decrease in the presence of high organic matter content and increase in the summer period, when evaporation is high.Oualidia groundwater pH values (Figure 3c) show no significant variations, with a minimum of 7.1 at the source point ES2 and a maximum of 7.5 at the EP1 well in summer and a minimum of
7.13 at water source ES2 , and a maximum of 7.47 at the source EP1. It is clearly observed that turbidity (Figure 3d) increases upstream of the watershed during the rainy period and vice versa in summer time.This is due to the location of these points upstream of the Oualidia lagoon, which is characterized by its muddy nature. The turbidity of the watershed is higher in the rainy season than in the dry period with a median and mean of 0 and 0.06 during the dry season and 0.13 and 0.15 in the rainy season,respectively,which shows that the turbidity caused by the rainfall inputs is higher than that generated by the tourism activity, unlike the performance of turbidity in the Oualidia lagoon.
Spatial and temporal distribution of the microbiological contamination of Oualidia lagoon and watershed waters
For processing the data by principal component analysis, temperature, pH, salinity, turbidity, E. coli and faecal streptococciwere used in combined manner as variables.The nine sample sitesin the Oualidia lagoon in the dry and rainy periodswere used as individuals. Also, the same variables were used with the five sample sitesin the watershed in the dry and rainy periods as individuals The results of the discriminant analysis highlight the strong seasonal variability (dry period / rainy period), both in the lagoon waters and in the watershed waters. The results of the lagoonal water variability (Fig. 4a, b and c) are represented first,followed by those of the watershed water variability (Fig. 5a, b and c). Once the principal components of the PCA were calculated, the first two axes were selected for graphical representation of the results for each type of variability. These two axes explain more than 61% of

Int.J.Curr.Microbiol.App.Sci (2014) 3(3): 675-694
681
the information contained in the data matrix for lagoon waters and more than 69% for watershed waters (Table 3).
Variability in the lagoon waters
Maps showing the spatial distribution of E. coli in the waters of the lagoon during the dry and rainy periods are shown in Figure 6. E. coliconcentrations are higher around the areas of major human activity including urban centers (urban wastewater, tourism), oyster farms, and agricultural areas. Mallinet al., 2001 also found such a strong correlation between population density and average levels of E. coliin surface waters. The number of animals in a watershed can be another cause of high levels of E. coli. The high counts for E. coliat sampling pointslocated upstream and middle of the lagoonduring rainy period can be explained in part by their location which was close toagriculture area, pastures regularly inhabited by dairy cattle and oyster farms. High faecal coliform counts have been positively related to urban development, agriculture, and the amount of erodible soils (Mehaffy et al., 2005) High E. coli counts are not only dependent on the total area of a particular land use within a watershed, but also on the amount of precipitation that the watershed received in the previous days (Mehaffy et al., 2005).
The range of E. coli and FS data, their median and mean values are summarized in the table 2. The data showed variationsbetween dry period and rainy period. The mean (± standard deviation) values of E. coli countsranged between4.37 ± 0.79 Log CFU 100m-1 in dry period and 4.6 ± 0.1 Log CFU 100m-1
in rainy period, whereas FS levels varied between 3.47 ± 0.1 Log CFU 100m-1 in
dry period and 4.01± 1.08 Log CFU 100m-
1 in rainy period. The meanlevels of E. coli counts in lagoon waters were higher than FSboth in dry and rainy period.
The concentrations of E. coli and FS during rainy seasonranged from 2.18 to 5.4 Log CFU 100m-1for E. coli, and from 2.19 to 5.28 Log CFU 100m-1for FS. In opposite,the concentrations of E. coli and FS during dry period ranged from 2.52 to 5.05 Log CFU 100m-1for E. coli and from 2 to 4.87 Log CFU 100m-1for FS.
The temporal distribution of faecal streptococci (figure 7), shows that the high concentration of faecal streptococci is in the rainy season and essentially upstream and in the middle of the lagoon which mean that essential contribution of FS is leaching from agriculture areas. A slight increase downstream of the lagoon is due to spillover of the septic tanks. In contrast, during the summer, a low concentration downstream and in the middle of the lagoon shows that the input of FS is related to tourism and grazing of animals.
The Pearson s product-moment correlation matrix between Temperature, pH, Turbidity, Salinity and bacterial contamination indicators is presented in table 4.The correlation test shows thatE.coli and FS were positively correlated with turbidity (r = 0.33 and 0.34, respectively) and negatively correlated with salinity (r = -0.28 and 0.19, respectively). In the same time, E. coli is correlated positively with FS (r=0.52). A highly significant positive correlation was observed between faecal indicator bacteria and turbidity. This can be explained by the natural presence of suspended particles in water, such as silt, clay, organic materials and inorganic thin particles, plankton and other organisms

Int.J.Curr.Microbiol.App.Sci (2014) 3(3): 675-694
682
that protect viruses and bacteria from disinfection.The positive correlation observed between faecal contamination bacteria and turbidity confirmsthat the source of faecal contamination of the lagoon is leaching from the watershed. A negative correlation was observed between faecal indicator bacteria and salinity. Indeed, Bennani et al., 2012, Chedad and Assobhei, 2007 and Hennani et al., 2014 showed that salinity is a very important stressor to faecal bacteria in the salty environment .The negative correlation observed between faecal indicator bacteria and salinity is believed to have a significant impact on bacterial mortality.The positive correlations between the two indicator bacteria (E.coli and FS) stress the fact that the detection of one indicator indicates a high probability of presence of the other(Konan et al.,2009) Principal Component Analysis (PCA) of the microbiological and physico-chemical parameters in the waters of the lagoon (dry and rainy periods) were conducted (figures 4).E. coli, faecal streptococci and turbidity parameters are organized in the same manner along the F1 axis. Salinity and temperature parameters are organized in opposite manner along the F2 axis.The E. coli and FS concentration gradient spreads from right to left of the F1 axis on an upstream-downstream gradient from the least to the most concentrated.Along these axe,these group can be further divided into five sub-groups of sampling points:
Subgroup 1:sampling points representing the upstream part of the lagoon i.e.the agricultural area and during the rainy period; Subgroup 2: sampling points representing the downstream part of the lagoon i.e. the urban area and tourism activity in both rainy and dry periods; Subgroup 3: sampling points representing
the upstream part during the dry season only;
Subgroup 4: sampling points "reference" located in the sea outside the lagoon during both rainy and dry periods;
Subgroup 5: point of discharge representing the borderline between urban and agricultural areas in both dry and rainy periods.
Downstream of the lagoon, the FS intake originates from the upstream part of the lagoon by currents. However, the concentrations are lower than upstream because of environmental factors (pH, salinity, turbidity and solar radiation) (Ruta et al, 2009; Hennani et al. 2013). In the dry period, the contribution of FS in the lagoon is low and is maintained by animal grazing upstream of the lagoon at low tide.
Variability in the waters of the watershed
The range of E. coli and FS data, their median and mean values are summarized in the table 3. The data showed variations between dry period and rainy period. The mean values of E. coli counts ranged between 5.52 ± 0,1 Log CFU 100m-1 in dry period and 4.9 ± 0.6 Log CFU 100m-1
in rainy period, whereas FS levels varied between 2 ± 1.4 Log CFU 100m-1 in dry period and 3.9± 0.9 Log CFU 100m-1 in rainy period. The mean levels of E. coli counts in watershed waters were higher than FS both in dry and rainy period.
The concentrations of E. coli and FS during rainy season ranged from 4.3 to 6.6 Log CFU 100m-1 for E. coli, and from 0 to 3.3 Log CFU 100m-1 for FS. In opposite, the concentrations of E. coli and

Int.J.Curr.Microbiol.App.Sci (2014) 3(3): 675-694
683
FS during dry period ranged from 4.4 to 5.9 Log CFU 100m-1 for E. coli and from 2.7 to 4.8 Log CFU 100m-1 for FS.
The median count of E. coli is higher in dray period than rainy period respectively 5.1 and 4.5 Log CFU 100m-1. This can be explained by tourism activity in dry period and leaching from the agricultural area of the watershed. However, the impact of tourism activity is more important. The median count of FS is lower in dray period than rainy period respectively 2.4 and 4.3 Log CFU 100m-1. This can be explained by leaching from the agricultural area of the watershed.
The Pearson s product-moment correlation matrix between Temperature, pH, Turbidity, Salinity and bacterial contamination indicators is presented in table 5. Pearson s product-moment correlation test shows that E.coli were positively correlated with pH (r = 0.27) and negatively correlated with salinity (r = -0.36). In contrast, FS is not correlated to any environmental parameter.A negative correlation was observed between E. coli only and salinity showed that salinity is believed to have a significant impact on bacterial mortality as reported in lagoon water.However, positive correlation observed between E. coli and pH confirms that the E. coli increases approaching from the sea therefore induced by the human activities.
Principal Component Analysis (PCA) of the microbiological and physico-chemical parameters in the waters of the watershed (dry and rainy periods) were conducted (figures 9). Faecal streptococci and turbidity parameters are organized along the F1 axis. E. coli and pH parameters are organized in the same manner along the F2 axis.
The FS concentration gradient is distributed from right to left of the F1 axis through an upstream-downstream gradient ranging from the most to the least concentrated, except for the point source ES1 (agricultural area). Regarding the E. coliconcentration gradient, it is distributed downward ranging from more to less concentrated and also on a seasonal gradient of dry months to wet months. This gradient applies only to the source points and wells EP3 (public wells for human and animal consumption) and EP1 (agricultural area), no agricultural activity. Along these two axes, both groups can be divided into two sub-groups of sampling points:
- First group indicating the spatial FS:
Subgroup 1-1: sampling points representing the rainy period. Subgroup 1-2: sampling points representing the dry season. For both groups, they follow an upstream-downstream gradient of the watershed.
- Second group indicating the spatial E. coli:
Subgroup 2-1: sampling points representing points close to summer activities (EP3 andES1). Subgroup 2-2: sampling points representing the watershed during the rainy period.
The concentrations of E. coli inputs in the rainy season are higher upstream of the lagoon but only in lagoon waters. This is explained by surface leaching from agricultural areas.
Downstream of the lagoon, E. coli inputs are lower than upstream both in the watershed and in the waters of the lagoon,
Int.J.Curr.Microbiol.App.Sci (2014) 3(3): 675-694
684
Figure.1 The study area showing sampling sites and land use in the Oualidia lagoon
Figure.2 Rainfall and temperatureof the study area(from July 2010 to June 2011)

Int.J.Curr.Microbiol.App.Sci (2014) 3(3): 675-694
685
Figure.3 Seasonal and spatial variation of (a) temperature, (b) salinity, (c) pH, and (d)
turbidity in the Oualidia lagoon

Int.J.Curr.Microbiol.App.Sci (2014) 3(3): 675-694
686
Figure.4 Seasonal and spatial variation of (a) temperature, (b) salinity, (c) pH and (d)
turbidity in the watershed

Int.J.Curr.Microbiol.App.Sci (2014) 3(3): 675-694
687
Figure.5Graphical presentation of the PCA of the microbiological and physico-chemical parameters in the waters of the lagoon (dry and rainy periods) according to the F1 * F2 plane.(a) Distribution of inertia between axes; (b) circle of correlation variables; (c) factorial map of stations and campaigns.

Int.J.Curr.Microbiol.App.Sci (2014) 3(3): 675-694
688
Figure.6 Graphical presentation of the PCA of the microbiological and physico-chemical parameters in the watershed waters (dry and rainy periods) according to the F1 * F2 plane. (a) Distribution of inertia between axes; (b) circle of correlation variables; (c) factorial map of stations and campaigns

Int.J.Curr.Microbiol.App.Sci (2014) 3(3): 675-694
689
Figure.7. Spatial distribution of Esherichia coli in the lagoon surface water
Figure.8 Spatial distribution of Faecal streptococci in the lagoon surface water

Int.J.Curr.Microbiol.App.Sci (2014) 3(3): 675-694
690
Table.1 Mean, minimum, maximum, and standard deviation values of faecal contamination (E. coli& FS) and the physico-chemical parameters in the Oualidia lagoon waters (n =120)
Dry period Rainyperiod
Min-Max Median Mean ± SD Min-Max
Median Mean ± SD
E. coli (Log CFU 100ml-1) 2.5-5.05 4.5 4.37 ± 0.79 2.2-5.4 4.9 4.6 ± 0.1
FS (Log CFU100ml-1) 2-4.9 3.6 3.47 ± 0.1 2.2-5.3 4.4 4.01 ± 1.08 T (°C) 19.7-25.2 21.8 22.2 ± 1.9 18.3-20.3
19.5 19.3 ± 0.8
pH 7.5-8.5 8.08 8.03 ± 0.3 7.9-8.6 8.1 8.1 ±0.2 Turbidity (NTU) 1.4-9.2 5.62 5.5 ± 2.7 2.7-7.2 4.4 4.8 ± 1.4 Salinity (g L-1) 9.1-3.,7 24.45 23.3 ± 7.5 16.9-31.4
24.35 24.8 ± 5.09
Table.2 Mean, minimum, maximum, and standard deviation values of faecal contamination (E. coli& FS) and the physico-chemical parameters in the Oualidia watershed (n =60)
Table.3 Inertia and cumulated inertia percentages of the first two factorial axes
Percentage of inertia (%) Type of variability F1 F2
Cumulative inertia percentages of the first two
axes (%) Watershed waters (dry/rainy) 43.35 26.05 69.41
Lagoon waters (dry/rainy) 36.937 25.000 61.938
Dry period Rainyperiod
Min-Max
Median Mean ± SD Min-Max
Median Mean ± SD E. coli (Log CFU 100ml-1) 4.3-6.6 5.1 5.52 ± 0.1 4.4-5.9 4.5 4.9 ± 0.6
FS (Log CFU 100ml-1) 0-3.3 2.4 2± 1.4 2.7-4.8 4.3 3.9 ± 0.9 T (°C) 20.6-21.8
20.8 21.1 ± 0.6 19.5-2 20.2 20.2 ± 0.6
pH 7.1-7.5 7.4 7.4 ± 0.1 7.1-7.5 7.3 7.3 ±0.13 Turbidity (NTU) 0-0.3 0 0.06± 0.1 0.03-0.4 0.13 0.15± 0.17
Salinity (g L-1) 0.3-5.4 1.5 2.02 ± 1.9 0.2-1.1 1.1 0.9± 0.4

Int.J.Curr.Microbiol.App.Sci (2014) 3(3): 675-694
691
Table.4 Pearson correlation coefficients between E. coli, FS and the physico-chemical parameters in the Oualidia lagoon [(n =120) significant correlation marked (*p < 0.05, **p < 0.01)]
E. coli FS T pH Turb Sal E. coli (Log CFU 100ml-1) 1 FS (Log CFU 100ml-1) 0.517** 1 T (°C) 0.066 -0.053 1 pH 0.060 0.074 -0.412**
1 Turb(NTU) 0.333** 0.346** -0.019 0.121 1 Sal (g L-1) -0.286** -0.199* -0.466**
0.419** 0.092 1
Table.5 Pearson s correlation between E. coli, FS and the physico-chemical parameters in the Oualidia watershed [(n =60) significant correlation marked (*p < 0.05,**p < 0.01)](*p < 0.05)]
E. coli FS T pH Turb Sal E. coli (Log CFU 100ml-1)
1 FS (Log CFU 100ml-1) 0.069 1 T (°C) -0.069 -0.089 1 pH 0.274* 0.113 -0.611** 1 Turb(NTU) -0.001 0.111 -0.147 0.188 1 Sal (g L-1) -0.363** -0.099 -0.073 -0.200
0.003 1
which is explained by the urban origin of the E. coli inputs in the lagoon (infiltration and overflowing septic tanks)(Ahmed et al. 2005; Sauer et al. 2011). In the dry season, the supply of E. coli inputs to the lagoon is low upstream of the lagoon (lagoon + watershed). On the contrary, it is very high downstream of the lagoon, both in the lagoon and in the watershed, due to the intense tourist activity during this period (Sardo et al., 2008; Ruta et al, 2009; Lu et al. 2011; Hennani al. 2013).
In order to contribute to a better understanding of the complexity of the functioning of this watershed-lagoon system, a spatio-temporal study was carried out of the physico-chemical and microbiological parameters affected by
climatic factors and continuous feeding by mainland waters and groundwater.
The typological analysis enabled a correlation of the concentration of E. coli and FS of the lagoon waters and those of the watershed during the dry season and in the rainy season.
In summary, there are two types of pollution in the Oualidia lagoon:
(i) Urban pollution: concentrated downstream of the lagoon and the watershed, which is due to the intense tourist activity in summer and (ii) Agricultural pollution: concentrated upstream of the lagoon and the watershed, which is due to leaching and infiltration
of agricultural practices around the lagoon in the rainy season. Thus, this study will

Int.J.Curr.Microbiol.App.Sci (2014) 3(3): 675-694
692
enable better approaches to be adopted to reduce the mainland and underground microbiological contribution of the watershed to the Oualidia lagoon.
Acknowledgement
This work was carried out in the framework of collaboration between the University Chouaib Doukkali of El Jadida and Sea Network REMER. The preparation of this paper was supported by grant No. 27106SJ from the Hubert Curien Program-Volubilis.
References
Ahmed, W., Neller, R., Katouli, M. 2005. Evidence of septic system failure determined by a bacterial biochemical fingerprinting method. Journal of Applied Microbiology 98:910 920
APHA. 1999. American Public Health Association, American Water Works Association, Water Environment Federation. Standard Methods for the Examination of Water and Wastewater, 20th edition.
Bennani, M., Amarouch, H., Boukanjer, A., Nadre, H., Lalaoui, M., Allali, M., Cohen, N. 2012. Influence des Facteurs Environnementaux Sur les Charges des Bactéries Fécales Dans le Littoral Méditerranéen du Maroc », European Journal of ScientificResearch. ISSN 1450-216X, Vol.71 No.1, pp. 24-35.
Chedad, KH., Assobhei, O. 2007. Etude de la survie des bactéries de contamination fécale (coliformes fécaux) dans les eaux de la zone ostréicole de la lagune de Oualidia (Maroc) », Bulletin de l Institut Scientifique, Rabat, section Sciences de la Vie, n°29, 71-79.
El Himer, H., Fakir, Y., Stigter, T.Y.,
Lepage, M., El Mandour, A., Ribeiro, L. 2013. Assessment of groundwater vulnerability to pollution of a wetland watershed: The case study of the Oualidia-Sidi Moussa wetland, Morocco. Aquatic Ecosystem Health & Management, 16, (2): 205-215.
Göransson, G., Larson, M., Bendz, D. 2013.Variation in turbidity with precipitation and flow in a regulated river system
River GötaÄlv, SW Sweden. Hydrology and Earth System Sciences Discussions, 10(1):255-293.
Gourmelon, M., Lazure, P., Hervio-Heath, D., Saux, J. C., Caprais, M. P., Guyader, F. S., Catherine, M., Pommepuy, M. 2010. Microbial modelling in coastal environments and early warning systems : useful tools to limit shellfish microbial contamination. World Health.
Hennani, M., Hassou, N., Aajjane, A .Assobhei, O. 2014. Adjusting a primary survival model of Enteric Bacteria "E. coli " in coastal environment : Oualidia lagoon. International of CurrentMicrobiology and Applied Sciences. 3(1):127-139.
Hennani, M., Maanan, M., Robin, M., Chedad, K., Assobhei, O. 2012.Temporal and Spatial Distribution of Faecal Bacteria in a Moroccan Lagoon.Polish Journal EnvironmentalStudies, 21(3):627-634.
KaidRassou, K., Fakir, Y., Bahir, M., Zouari, K., Marah, M.2005. Origine et datation des eaux souterraines du bassin hydrologique de la lagune d oualidia. Techniques. 196:191-196.
Kalloul, S., Hamid, W., Manan, M., Robin, M., Esayouty, H., Zourarah, B. 2012. Source contributions to heavy metal fluxes into the Loukous Estuary (Moroccan Atlantic Coast) Journal of Coastal Research, 28 (1): 174-183.

Int.J.Curr.Microbiol.App.Sci (2014) 3(3): 675-694
693
Kay, D., Anthony, S., Crowther, J.,
Chambers, B.J., Nicholson, F.A., Chadwick, D. 2010. Microbial water pollution: a screening tool for initial catchment-scale assessment and source apportionment. The Science of the Total Environment, 408 (23): 5649-56.
Konan, K.S., Kouassi, A. M., Adingra, A.A., Gnakri, D.2009. Spatial and temporal variation of faecal contamination indicators in Grand-Lahou lagoon, Côte d Ivoire.Journal of Applied Biosciences. 23: 1422 - 1435
Lu, J., Ryu, H., Hill, S., Schoen, M., Ashbolt, N., Edge, T.A., Santo Domingo, J. 2011. Distribution and potential significance of a gull faecal marker in urban coastal and riverine areas of southern Ontario, Canada.Water Research 45(13):3960-3968.
Lu, X.X., Ran, L.S., Liu, S., Jiang, T., Zhang, S.R., Wang, J.J. 2013. Sediment loads response to climate change: A preliminary study of eight large Chinese rivers. International Journal of Sediment Research 28, 1: 1-14.
Maanan, M., 2008. Trace metal contamination of marine organisms from the Moroccan North Atlantic coastal environments. Environmental Pollution, 153, 176-183.
Maanan, M., Landesman, C., Maanan, M., Zourarah, B., Fattal, P., Sahabi, M. 2013. Evaluation of the anthropogenic influx of metal and metalloid contaminants into the MoulayBousselham lagoon, Morocco, using chemometric methods coupled to geographical information systems. Environmental Sciences and Pollution Research, 20(7):4729-4741.
Makaoui, A., Orbi, A., Hilmi K., et al. 2005. L upwelling de la côte atlantique du Maroc entre 1994 et 1998. Comptes
Rendus Geoscience. 337(16):1518-1524.
Mallin, M. A., Ensign, S.H., Mciver, M. R., Shank, G.C., Fowler, P.K. 2001.Demographic, landscape, and meteo- rological factors controlling the microbial pollution of coastal waters.Hydrobiologia.460, (1-3), 185.
Mehaffy, M. H., Nash, M. S., Wade, T. G., Ebert, D. W., Jones, K. B., Rager, A. 2005. Linking Land Cover and Water Quality in New York City.s Water Supply Watersheds. Environmental Monitoring and Assessment, 107, 29-44.
MhamdiAlaoui, A., Choura, M., Maanan, M., Zourarah, B., Robin, M., FreitasConceição, M., Andrade, C., Khalid, M., Carruesco, C. 2010. Metal fluxes to the sediments of the MoulayBousselham lagoon, Morocco. Environmental Earth Sciences, 61 (2): 275-286.
Montiel, M., Silva, R., Núñez, J., Morales, F., Severeyn, H., García, Y. 2013. Enteroccoccus in Water, Sediment and Clams in a Tropical Environment, Maracaibo Lake, Venezuela. Journal of Marine Science Research & Development 3: 133. doi: 10.4172/2155-9910.1000133.
Oladeinde, A., Bohrmann, T., Wong, K., Purucker, S. T., Bradshaw, K., Brown, R., Snyder, B., Molina, M. 2013. Decay of faecal indicator bacterial populations and bovine-associated source tracking markers in freshly deposited cowpats. Applied and environmental microbiology. 2:1-34.
Orbi, A., Hilmi, K., LakhdarIdrissi, J., Zizah, S. 2008. Lagoon Ecosystem Study Trough Two Cases: Oualidia (Atlantic) and Nador (Mediterranean)
Morocco. In: Gönenç I.E, Vadineanu A., Wolflin J. P., Russo R. C. NATO Science for Peace and
Int.J.Curr.Microbiol.App.Sci (2014) 3(3): 675-694
694
Security Series, Sustainable Use and Development of Watersheds, 289-298.
Rharbi, N., Ramdani, M., Berraho, A. 2003. Elaboration d une stratégie d élevage de l huitre crassostrea gigas dans la lagune de oualidia (Maroc) sur la base de l étude des relations tropidques. Bulletin de la Société zoologique de France. 128 (1-2):63-86.
Ruta, M., Pepi, M., Franchi, E., Renzi, M., Volterrani, M., Perra, G., Guerranti, C., Zanini, A.,Focardi, S. E. 2009. Contamination levels and state assessment in the lakes of the Oliveri-Tindari Lagoon (North-Eastern Sicily, Italy). Chemistry and Ecology, 25: 27-38.
Sardo, A., Accornero, A., Giovinazzi, F. 2008. Luminescent bacteria as indicators of marine water quality: Preliminary results from the Campania coastal waters. Chemistry and Ecology, 24: 19-26.
Sauer, EP., VandeWalle, JL., Bootsma, MJ.,McLellan, SL. 2011. Detection of the human specific Bacteroides genetic marker provides evidence of widespread sewage contamination of stormwater in the urban environment. Water Research 45:4081 4091
Schoen, M.E., Soller, J.A., Ashbolt, N.J. 2011. What faecal source(s) contribute to bather illness in human-impacted waters? Water Research, 45(8): 2670-2680.
Zourarah, B., Maanan, M., Carruesco, C., Aajjane, A., Mehdi, K., ConceicaoFreitas, M. 2007.Fifty-year sedimentary record of heavy metal pollution in the lagoon of Oualidia (Moroccan Atlantic coast).Estuarine, Coastal and Shelf Science. 72 (1), 359-369.
Zourarah, B., Maanan, M., Robin, M., Carruesco, C. 2009. Sedimentary records of anthropogenic contribution to heavy metal content in OumErBia estuary (Morocco). Environmental Chemistry Letters, 7 (1), 67-78.
Recommended


![Allegato A (476.6 KiB) [file.pdf]](https://img.dokumen.tips/doc/110x75/589b081b1a28ab05468bf002/allegato-a-4766-kib-filepdf.jpg)


![Prontuario farmaceutico ADI [file.pdf]](https://img.dokumen.tips/doc/110x75/5859bd051a28ab6e32905aca/prontuario-farmaceutico-adi-filepdf.jpg)


![Relazione metodologica [file.pdf]](https://img.dokumen.tips/doc/110x75/586bef301a28ab6b518c0a10/relazione-metodologica-filepdf.jpg)


