MULTIVARIATE STATISTICAL TECHNIQUES FOR THE ANALYSIS OF INSTRUMENTAL AND SENSORIAL DATASETS: THE CASE OF AROMAS
AND THEIR PERCEPTION IN WINES
Mariana GONZÁLEZ-ÁLVAREZ, Raquel NOGUEROL-PATO, Carmen GONZÁLEZ-BARREIRO, Beatriz CANCHO-GRANDE, Jesus SIMAL-GÁNDARA
Nutrition and Bromatology Group, Department of Analytical and Food Chemistry. Faculty of Food
Science and Technology, University of Vigo, Ourense Campus, E-32004 Ourense, Spain, Phone: +34-988-387000; Fax: +34-988-387001
Corresponding author email: [email protected]
Abstract The purpose of this work is to look for changes in the aroma profile of wines obtained under Critical Agricultural Practices (CAP), in comparison with wines treated under Good Agricultural Practices (GAP). Four new fungicides (mandipropamid, valifenalate, cyazofamid and famoxadone) to control downy mildew (Plasmopara viticola) were applied under CAP in an experimental vineyard producing white grapes Vitis vinifera cv. Godello. Several fatty acids, their esters and acetates were formed during the winemaking process in higher levels under GAP and could be expected to strongly influence the aroma of the wines by introducing floral, fruity and spicy nuances. The concentrations of six compounds (2-phenylethyl acetate, ethyl butanoate, ethyl octanoate, 4-vinylguaiacol, 3-methylbutanoic acid and methionol) were found to suffice with a view to discriminating between wines from grapes treated with fungicides under CAP and under GAP. The critically treated wine was moved to a sweeter balance with a ripe fruit taste, which are associated to higher viscosity and also a higher cloudy colour. We conducted exploratory research with a view to correle the results of instrumental analyses of the aroma compounds in Godello wine and their sensory perception, using Principal Component Analysis (PCA) and Partial Least Squares Regression (PLS) for comparisons. PCA revealed the distribution of volatile compounds with near-unity or higher Odour Activity Values (OAVs) in relation to sensory characteristics, and PLS exposed relationships between sensory descriptors and volatile compounds in the wines. Key words: sensory properties, volatile compounds, multivariate statistical techniques, Vitis vinifera cv. Godello.
INTRODUCTION Aroma is one of the main factors contributing to the quality of wine and sets the difference between a vast number of wines (Rodríguez-Nogales, Fernández-Fernández & Vila-Crespo, 2009). More than a thousand flavour compounds have so far been identified in wine (Bonino, Schellino, Rizzi, Aigotti, Delfini & Baiocchi, 2003; Guth, 1997). Identifying the specific chemical compounds that impart wine desirable sensory characteristics requires a sound knowledge of the compounds concerned in wine (Francis & Newton, 2005). Volatile compounds can be analysed under conditions closely mimicking those under which humans perceive aroma. Gas chromatography (GC) and mass spectrometry (MS) provide an effective tool for the odorant characterization of wines (Noguerol-Pato, González-Barreiro, Cancho-
Grande & Simal-Gándara, 2009). Without sensory evaluation, the mere knowledge of the precise volatile composition of the “sniffed aroma” of a wine is inadequate to predict the flavour of the whole system as perceived by a trained sensory judge (Noble & Ebeler, 2002). Aroma compounds can interact synergistically and have masking or suppressing effects at above-threshold concentrations, or additive interactions at sub-threshold concentrations (Francis & Newton, 2005). Multivariate statistical techniques have been used on multiple occasions to elucidate the relationships between sensory and instrumental data for wines (Aznar, López, Cacho & Ferreira, 2003; Campo, Ferreira, Escudero & Cacho, 2005; Lee & Noble, 2006; Botelho, Mendes-Faia & Clímago, 2008; Pereira, Reis, Saraiva & Marques, 2010).
9
AgroLife Scientific Journal - Volume 2, Number 1, 2013
ISSN 2285-5718; ISSN CD-ROM 2285-5726; ISSN ONLINE 2286-0126; ISSN-L 2285-5718
In this work, a combination of sensory analysis and aroma compound detection was used to identify the aroma characteristics of monovarietal Godello white wines, using multivariate analysis to look for changes in the aroma profile of wines obtained under Critical Agricultural Practices (CAP), in comparison with wines treated under Good Agricultural Practices (GAP).
Experimental All experimental details about grapes, wines, materials, methods and statistics are taken from our previous works (González-Álvarez, González-Barreiro, Cancho-Grande & Simal-Gándara, 2011, 2012; González-Álvarez, Noguerol-Pato, González-Barreiro, Cancho-Grande & Simal-Gándara, 2012). RESULTS AND DISCUSSIONS 1. Volatiles by instrumental analysis 1.1.-Volatile composition of the wines GC-MS analysis of the five Godello wines studied allowed the identification and quantitation of 37 compounds belonging to 9 different groups of volatile compounds (Table 1), namely: terpenes (6 compounds), alcohols (8), acetates (3), ethyl esters (6), volatile phenols (6), volatile fatty acids (5), lactones (1), aldehydes (1) and sulphur compounds (1). The alcohols were, quantitatively, the largest group of volatile compounds, accounting for about 83% and followed by volatile fatty acids Table 1 shows the mean and standard deviation for each compound in the five wines. The relatively low standard deviations obtained confirm that the volatile profile of Godello wines is highly stable within the same vintage. More than 80% of the volatile fraction consisted of two compounds: isoamyl alcohol and 2-phenylethanol. Both are fusel alcohols, which are usually present in wines as a result of yeast metabolism during alcoholic fermentation. Concentrations above 300 mg/L in these alcohols have an adverse impact on wine aroma and flavour (specifically, a pungent smell and taste) (Rapp & Versini, 1991); on the other hand, concentrations below that level can have a positive impact by imparting the wine with fruity and floral notes.
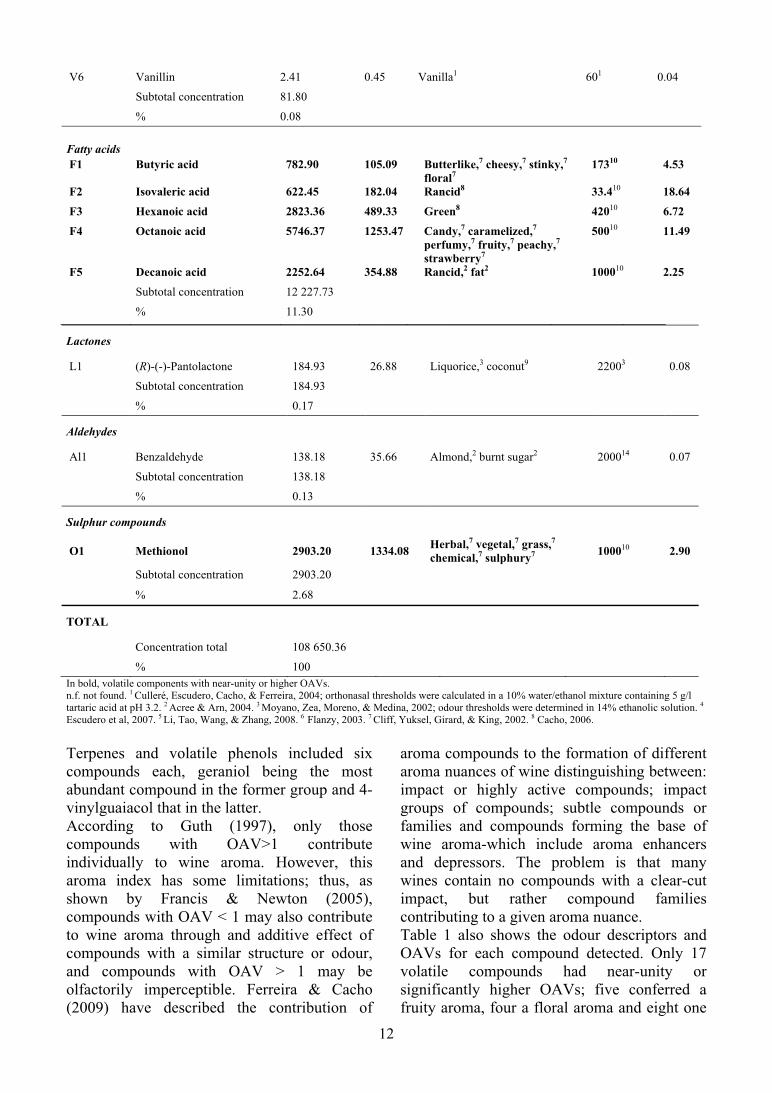
All volatile fatty acids detected were present at concentrations above 500 g/L. Although fatty acids usually confer undesirable odours, they only do at concentrations above 20 mg/L (Ribéreau-Gayon, Glories, Maujean & Dubourdieu, 2006), which were found in none of the Godello wines. In small amounts, fatty acids can contribute to a balanced aroma in wine by hindering hydrolysis of their esters (Flanzy, 2003). Among acetates and the ethyl esters family, isoamyl, hexyl acetate, ethyl hexanoate and octanoate, were the major volatile compounds in terms of concentration in the wines. Most wine esters are produced by yeasts during alcoholic fermentation. Ethyl acetates of fatty acids have very pleasant odours of wax and honey which contribute to the aromatic finesse of white wines. Also, acetic esters of higher alcohols contribute to the complex aroma of naturally neutral wines, but may mask some varietal aromas (Ribéreau-Gayon et al., 2006). In addition to the previous major components, the wines contained minor compounds including terpenes, volatile phenols, aldehydes (0.11%, 0.08% and 0.013%, respectively) and even C13-norisoprenoids -in trace amounts. Terpenes and volatile phenols included six compounds each, geraniol being the most abundant compound in the former group and 4-vinylguaiacol that in the latter. According to Guth (1997), only those compounds with OAV>1 contribute individually to wine aroma. However, this aroma index has some limitations; thus, as shown by Francis & Newton (2005), compounds with OAV<1 may also contribute to wine aroma through and additive effect of compounds with a similar structure or odour, and compounds with OAV>1 may be olfactorily imperceptible. Ferreira & Cacho (2009) have described the contribution of aroma compounds to the formation of different aroma nuances of wine distinguishing between: impact or highly active compounds; impact groups of compounds; subtle compounds or families and compounds forming the base of wine aroma-which include aroma enhancers and depressors. The problem is that many wines contain no compounds with a clear-cut impact, but rather compound families contributing to a given aroma nuance.
10
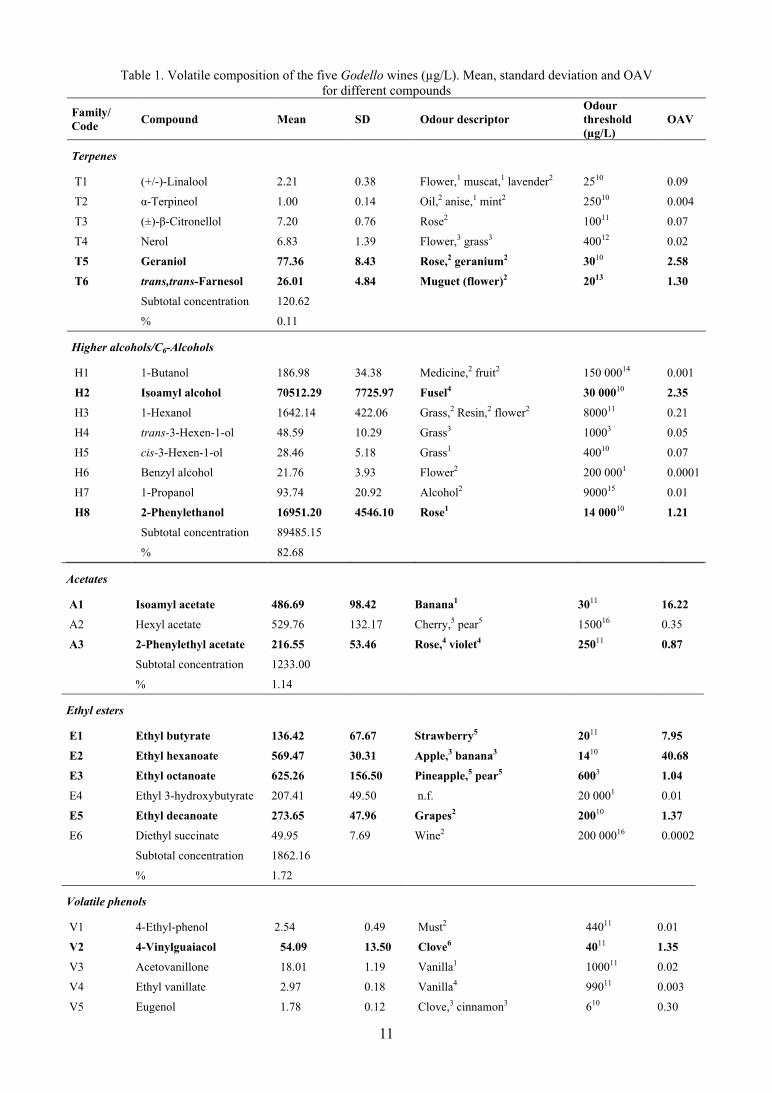
Table 1. Volatile composition of the five Godello wines (μg/L). Mean, standard deviation and OAV
for different compounds Family/ Code Compound Mean SD Odour descriptor
Odour threshold (μg/L)
OAV
Terpenes
T1 (+/-)-Linalool 2.21 0.38 Flower,1 muscat,1 lavender2 2510 0.09
T2 -Terpineol 1.00 0.14 Oil,2 anise,1 mint2 25010 0.004
T3 (±)- -Citronellol 7.20 0.76 Rose2 10011 0.07
T4 Nerol 6.83 1.39 Flower,3 grass3 40012 0.02
T5 Geraniol 77.36 8.43 Rose,2 geranium2 3010 2.58
T6 trans,trans-Farnesol 26.01 4.84 Muguet (flower)2 2013 1.30
Subtotal concentration 120.62
% 0.11
Higher alcohols/C6-Alcohols
H1 1-Butanol 186.98 34.38 Medicine,2 fruit2 150 00014 0.001
H2 Isoamyl alcohol 70512.29 7725.97 Fusel4 30 00010 2.35
H3 1-Hexanol 1642.14 422.06 Grass,2 Resin,2 flower2 800011 0.21
H4 trans-3-Hexen-1-ol 48.59 10.29 Grass3 10003 0.05
H5 cis-3-Hexen-1-ol 28.46 5.18 Grass1 40010 0.07
H6 Benzyl alcohol 21.76 3.93 Flower2 200 0001 0.0001
H7 1-Propanol 93.74 20.92 Alcohol2 900015 0.01
H8 2-Phenylethanol 16951.20 4546.10 Rose1 14 00010 1.21
Subtotal concentration 89485.15
% 82.68
Acetates
A1 Isoamyl acetate 486.69 98.42 Banana1 3011 16.22
A2 Hexyl acetate 529.76 132.17 Cherry,5 pear5 150016 0.35
A3 2-Phenylethyl acetate 216.55 53.46 Rose,4 violet4 25011 0.87
Subtotal concentration 1233.00
% 1.14
Ethyl esters
E1 Ethyl butyrate 136.42 67.67 Strawberry5 2011 7.95
E2 Ethyl hexanoate 569.47 30.31 Apple,3 banana3 1410 40.68
E3 Ethyl octanoate 625.26 156.50 Pineapple,5 pear5 6003 1.04
E4 Ethyl 3-hydroxybutyrate 207.41 49.50 n.f. 20 0001 0.01
E5 Ethyl decanoate 273.65 47.96 Grapes2 20010 1.37
E6 Diethyl succinate 49.95 7.69 Wine2 200 00016 0.0002
Subtotal concentration 1862.16
% 1.72
Volatile phenols
V1 4-Ethyl-phenol 2.54 0.49 Must2 44011 0.01
V2 4-Vinylguaiacol 54.09 13.50 Clove6 4011 1.35
V3 Acetovanillone 18.01 1.19 Vanilla1 100011 0.02
V4 Ethyl vanillate 2.97 0.18 Vanilla4 99011 0.003
V5 Eugenol 1.78 0.12 Clove,3 cinnamon3 610 0.30
11
V6 Vanillin 2.41 0.45 Vanilla1 601 0.04
Subtotal concentration 81.80
% 0.08 Fatty acids
F1 Butyric acid 782.90 105.09 Butterlike,7 cheesy,7 stinky,7 floral7
17310 4.53
F2 Isovaleric acid 622.45 182.04 Rancid8 33.410 18.64
F3 Hexanoic acid 2823.36 489.33 Green8 42010 6.72
F4 Octanoic acid 5746.37 1253.47 Candy,7 caramelized,7 perfumy,7 fruity,7 peachy,7 strawberry7
50010 11.49
F5 Decanoic acid 2252.64 354.88 Rancid,2 fat2 100010 2.25
Subtotal concentration 12 227.73
% 11.30
Lactones
L1 (R)-(-)-Pantolactone 184.93 26.88 Liquorice,3 coconut9 22003 0.08
Subtotal concentration 184.93
% 0.17
Aldehydes
Al1 Benzaldehyde 138.18 35.66 Almond,2 burnt sugar2 200014 0.07
Subtotal concentration 138.18
% 0.13
Sulphur compounds
O1 Methionol 2903.20 1334.08 Herbal,7 vegetal,7 grass,7 chemical,7 sulphury7 100010 2.90
Subtotal concentration 2903.20
% 2.68
TOTAL
Concentration total 108 650.36
% 100 In bold, volatile components with near-unity or higher OAVs. n.f. not found. 1 Culleré, Escudero, Cacho, & Ferreira, 2004; orthonasal thresholds were calculated in a 10% water/ethanol mixture containing 5 g/l tartaric acid at pH 3.2. 2 Acree & Arn, 2004. 3 Moyano, Zea, Moreno, & Medina, 2002; odour thresholds were determined in 14% ethanolic solution. 4
Escudero et al, 2007. 5 Li, Tao, Wang, & Zhang, 2008. 6 Flanzy, 2003. 7 Cliff, Yuksel, Girard, & King, 2002. 8 Cacho, 2006. Terpenes and volatile phenols included six compounds each, geraniol being the most abundant compound in the former group and 4-vinylguaiacol that in the latter. According to Guth (1997), only those compounds with OAV>1 contribute individually to wine aroma. However, this aroma index has some limitations; thus, as shown by Francis & Newton (2005), compounds with OAV < 1 may also contribute to wine aroma through and additive effect of compounds with a similar structure or odour, and compounds with OAV > 1 may be olfactorily imperceptible. Ferreira & Cacho (2009) have described the contribution of
aroma compounds to the formation of different aroma nuances of wine distinguishing between: impact or highly active compounds; impact groups of compounds; subtle compounds or families and compounds forming the base of wine aroma-which include aroma enhancers and depressors. The problem is that many wines contain no compounds with a clear-cut impact, but rather compound families contributing to a given aroma nuance. Table 1 also shows the odour descriptors and OAVs for each compound detected. Only 17 volatile compounds had near-unity or significantly higher OAVs; five conferred a fruity aroma, four a floral aroma and eight one
12
deemed “spicy” and including peculiar or distinct nuances. The highest OAVs were those of the ethyl esters (particularly ethyl hexanoate, with OAV = 40.68). Fatty acids and acetates followed, with specially high OAVs for isovaleric acid (18.64) and isoamyl acetate (16.22). Geraniol and trans,trans-farnesol were the only terpenes with OAVs slightly higher than 1 (2.58 and 1.30, respectively). 4-Vinylguaiacol, a volatile phenol, exhibited a near-unity OAV (1.35) and the sulphur compound methionol one close to 3. On the other hand, neither lactones nor aldehydes seemingly contribute individually to aroma in Godello wines —their OAVs were all lower than 0.08. 1.2.-. Major volatiles in wines from grapes treated with fungicides under CAP and GAP A discriminant analysis based on a stepwise forward selection algorithm with F-to-enter and remove = 4 was used to identify those variables being significant predictors for the five groups of samples, i.e., those treated with fungicides against downy mildew under CAP (A, B, C and D) and those treated under GAP (control wine). The four standardized discriminating functions with P < 0.05 were statistically significant at the 95% confidence level and constructed from 6 variables, namely: SDF1 (86.71% variance) = 2.870 × (2-phenylethyl acetate) + 0.564 × (ethyl butanoate) + 2.077 × (ethyl octanoate) + 1.448 × (4-vinylguaiacol) – 1.646 × (3-methylbutanoic acid) – 4.286 × (methionol). SDF2 (8.78% variance) = – 0.244 × (2-phenylethyl acetate) + 0.431 × (ethyl butanoate) – 0.931 × (ethyl octanoate) + 2.090 × (4-vinylguaiacol) – 0.349 × (3-methylbutanoic acid) – 0.600 × (methionol). SDF3 (3.52% variance) = – 0.818 × (2-phenylethyl acetate) + 1.263 × (ethyl butanoate) + 0.251 × (ethyl octanoate) + 0.250 × (4-vinylguaiacol) – 1.125 × (3-methylbutanoic acid) + 0.042 × (methionol). SDF4 (0.99% variance) = – 0.883 × (2-phenylethyl acetate) + 0.612 × (ethyl butanoate) – 0.197 × (ethyl octanoate) + 0.237 × (4-vinylguaiacol) + 0.683 × (3-methylbutanoic acid) – 0.373 × (methionol). The six variables were selected stepwise in the following sequence (with F-to-enter between brackets): methionol (140.78) = 4-
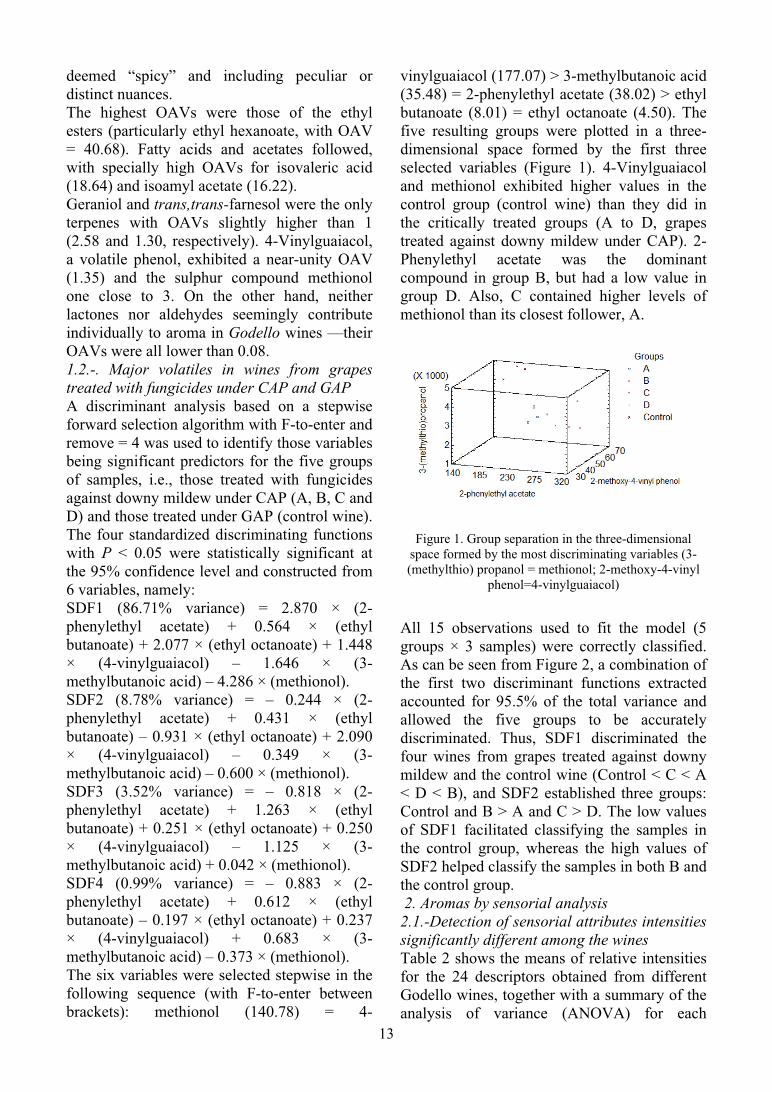
vinylguaiacol (177.07) > 3-methylbutanoic acid (35.48) = 2-phenylethyl acetate (38.02) > ethyl butanoate (8.01) = ethyl octanoate (4.50). The five resulting groups were plotted in a three-dimensional space formed by the first three selected variables (Figure 1). 4-Vinylguaiacol and methionol exhibited higher values in the control group (control wine) than they did in the critically treated groups (A to D, grapes treated against downy mildew under CAP). 2-Phenylethyl acetate was the dominant compound in group B, but had a low value in group D. Also, C contained higher levels of methionol than its closest follower, A.
Figure 1. Group separation in the three-dimensional space formed by the most discriminating variables (3-(methylthio) propanol = methionol; 2-methoxy-4-vinyl
phenol=4-vinylguaiacol)
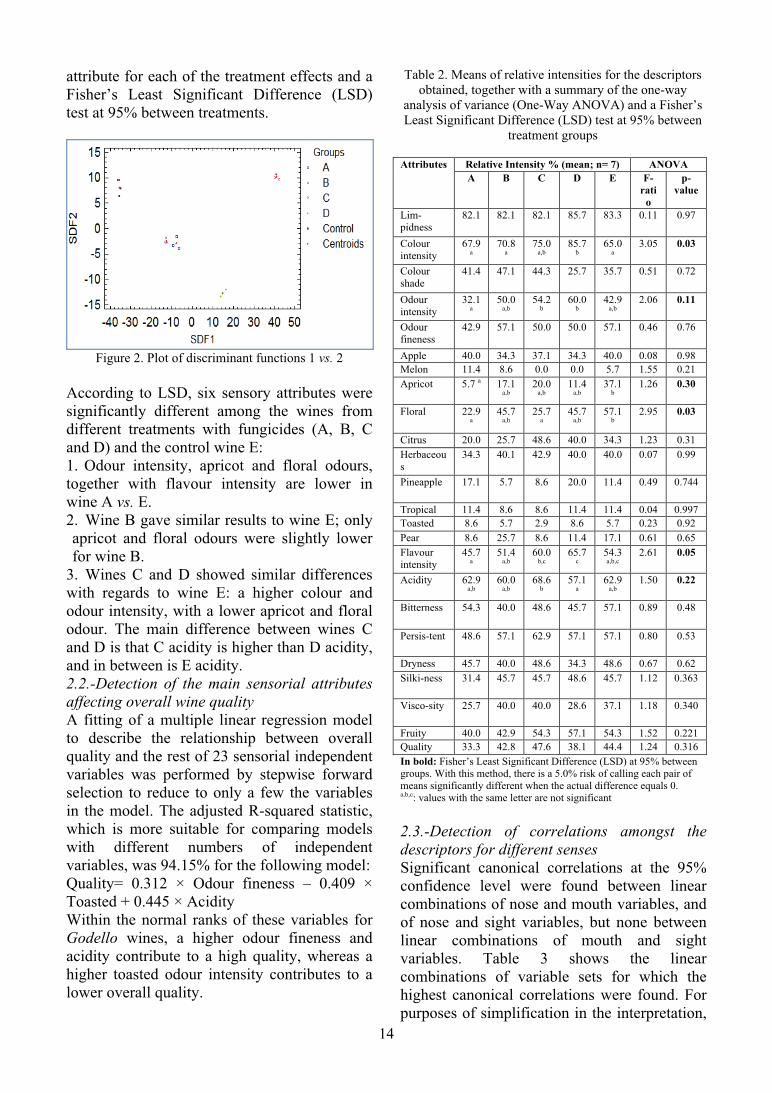
All 15 observations used to fit the model (5 groups × 3 samples) were correctly classified. As can be seen from Figure 2, a combination of the first two discriminant functions extracted accounted for 95.5% of the total variance and allowed the five groups to be accurately discriminated. Thus, SDF1 discriminated the four wines from grapes treated against downy mildew and the control wine (Control < C < A < D < B), and SDF2 established three groups: Control and B > A and C > D. The low values of SDF1 facilitated classifying the samples in the control group, whereas the high values of SDF2 helped classify the samples in both B and the control group. 2. Aromas by sensorial analysis 2.1.-Detection of sensorial attributes intensities significantly different among the wines Table 2 shows the means of relative intensities for the 24 descriptors obtained from different Godello wines, together with a summary of the analysis of variance (ANOVA) for each
13
attribute for each of the treatment effects and a Fisher’s Least Significant Difference (LSD) test at 95% between treatments.
Figure 2. Plot of discriminant functions 1 vs. 2
According to LSD, six sensory attributes were significantly different among the wines from different treatments with fungicides (A, B, C and D) and the control wine E: 1. Odour intensity, apricot and floral odours, together with flavour intensity are lower in wine A vs. E. 2. Wine B gave similar results to wine E; only apricot and floral odours were slightly lower for wine B.
3. Wines C and D showed similar differences with regards to wine E: a higher colour and odour intensity, with a lower apricot and floral odour. The main difference between wines C and D is that C acidity is higher than D acidity, and in between is E acidity. 2.2.-Detection of the main sensorial attributes affecting overall wine quality A fitting of a multiple linear regression model to describe the relationship between overall quality and the rest of 23 sensorial independent variables was performed by stepwise forward selection to reduce to only a few the variables in the model. The adjusted R-squared statistic, which is more suitable for comparing models with different numbers of independent variables, was 94.15% for the following model: Quality= 0.312 × Odour fineness – 0.409 × Toasted + 0.445 × Acidity Within the normal ranks of these variables for Godello wines, a higher odour fineness and acidity contribute to a high quality, whereas a higher toasted odour intensity contributes to a lower overall quality.
Table 2. Means of relative intensities for the descriptors obtained, together with a summary of the one-way
analysis of variance (One-Way ANOVA) and a Fisher’s Least Significant Difference (LSD) test at 95% between
treatment groups Attributes Relative Intensity % (mean; n= 7) ANOVA
A B C D E F-rati
o
p-value
Lim-pidness
82.1 82.1 82.1 85.7 83.3 0.11 0.97
Colour intensity
67.9 a
70.8a
75.0
a,b 85.7
b 65.0
a 3.05 0.03
Colour shade
41.4 47.1 44.3 25.7 35.7 0.51 0.72
Odour intensity
32.1 a
50.0 a,b
54.2 b
60.0 b
42.9 a,b
2.06 0.11
Odour fineness
42.9 57.1 50.0 50.0 57.1 0.46 0.76
Apple 40.0 34.3 37.1 34.3 40.0 0.08 0.98 Melon 11.4 8.6 0.0 0.0 5.7 1.55 0.21 Apricot 5.7 a 17.1
a,b 20.0
a,b 11.4
a,b 37.1
b 1.26 0.30
Floral 22.9 a
45.7 a,b
25.7 a
45.7 a,b
57.1 b
2.95 0.03
Citrus 20.0 25.7 48.6 40.0 34.3 1.23 0.31 Herbaceous
34.3 40.1 42.9 40.0 40.0 0.07 0.99
Pineapple 17.1 5.7 8.6 20.0 11.4 0.49 0.744
Tropical 11.4 8.6 8.6 11.4 11.4 0.04 0.997 Toasted 8.6 5.7 2.9 8.6 5.7 0.23 0.92 Pear 8.6 25.7 8.6 11.4 17.1 0.61 0.65 Flavour intensity
45.7 a
51.4 a,b
60.0 b,c
65.7 c
54.3 a,b,c
2.61 0.05
Acidity 62.9 a,b
60.0 a,b
68.6 b
57.1 a
62.9 a,b
1.50 0.22
Bitterness 54.3 40.0 48.6 45.7 57.1 0.89 0.48
Persis-tent 48.6 57.1 62.9 57.1 57.1 0.80 0.53
Dryness 45.7 40.0 48.6 34.3 48.6 0.67 0.62 Silki-ness 31.4 45.7 45.7 48.6 45.7 1.12 0.363
Visco-sity 25.7 40.0 40.0 28.6 37.1 1.18 0.340
Fruity 40.0 42.9 54.3 57.1 54.3 1.52 0.221 Quality 33.3 42.8 47.6 38.1 44.4 1.24 0.316 In bold: Fisher’s Least Significant Difference (LSD) at 95% between groups. With this method, there is a 5.0% risk of calling each pair of means significantly different when the actual difference equals 0. a,b,c: values with the same letter are not significant 2.3.-Detection of correlations amongst the descriptors for different senses Significant canonical correlations at the 95% confidence level were found between linear combinations of nose and mouth variables, and of nose and sight variables, but none between linear combinations of mouth and sight variables. Table 3 shows the linear combinations of variable sets for which the highest canonical correlations were found. For purposes of simplification in the interpretation,
14
only coefficients higher than 0.5 in the linear combinations were considered. In this way, it seems that a bitter taste together with a high viscosity and a low dryness in the mouth is correlated with a low odour fineness and an apricot odour (Table 3a). Instead, sight limpidness and a low colour intensity is correlated with high levels of melon odour and low levels of herbaceous and pear odours (Table 3b).
Table 3. Highest and significant (p<0.05) canonical correlations between the linear combinations of two sets
of variables: (a) nose vs. mouth, and (b) nose vs. sight (a)
Highest canonical correlations between nose & mouth variables
Linear combination of nose variables
Linear combination of mouth variables
Nose variables
Coefficients Mouth variables
Coefficients
Odour intensity
0.268 Flavour intensity
0.156
Odour fineness
-0.751 Acidity 0.340
Apple -0.223 Bitterness 0.941 Melon 0.410 Persitent -0.240 Apricot 0.648 Dryness -0.773 Floral -0.277 Silkiness 0.079 Citrus 0.402 Viscosity 0.604 Herbaceous -0.231 Fruity -0.009 Pineapple -0.452 Tropical 0.118 Toasted -0.298 Pear -0.128 Canonical correlation: 0.932 (p= 0.003)
(b) Highest canonical correlations between nose & sight variables Linear combination of nose variables
Linear combination of sight variables
Nose variables
Coefficients Sight variables
Coefficients
Odour intensity
0.240 Limpidness 1.069
Odour fineness
0.389 Colour intensity
-0.549
Apple -0.275 Colour shade 0.010 Melon 0.613 Apricot 0.403 Floral -0.234 Citrus 0.269 Herbaceous -0.610 Pineapple -0.114 Tropical -0.280 Toasted 0.495 Pear -0.587 Canonical correlation: 0.811 (p= 0.023)
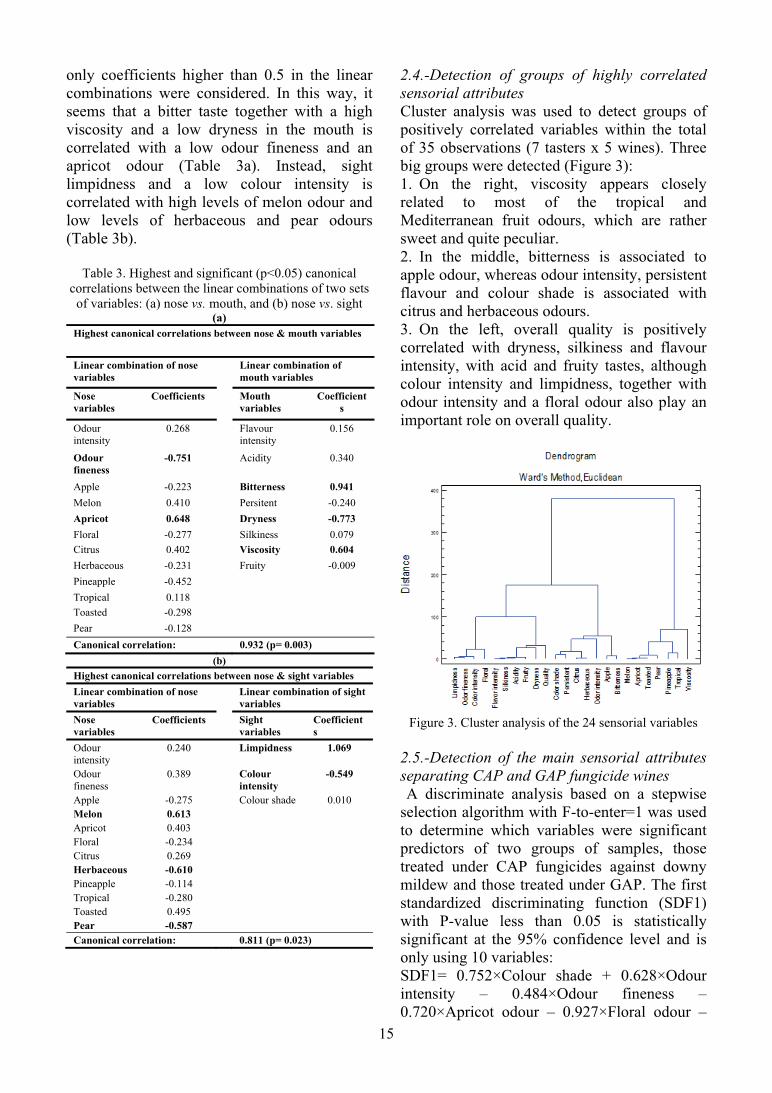
2.4.-Detection of groups of highly correlated sensorial attributes Cluster analysis was used to detect groups of positively correlated variables within the total of 35 observations (7 tasters x 5 wines). Three big groups were detected (Figure 3): 1. On the right, viscosity appears closely related to most of the tropical and Mediterranean fruit odours, which are rather sweet and quite peculiar. 2. In the middle, bitterness is associated to apple odour, whereas odour intensity, persistent flavour and colour shade is associated with citrus and herbaceous odours. 3. On the left, overall quality is positively correlated with dryness, silkiness and flavour intensity, with acid and fruity tastes, although colour intensity and limpidness, together with odour intensity and a floral odour also play an important role on overall quality.
Figure 3. Cluster analysis of the 24 sensorial variables
2.5.-Detection of the main sensorial attributes separating CAP and GAP fungicide wines A discriminate analysis based on a stepwise
selection algorithm with F-to-enter=1 was used to determine which variables were significant predictors of two groups of samples, those treated under CAP fungicides against downy mildew and those treated under GAP. The first standardized discriminating function (SDF1) with P-value less than 0.05 is statistically significant at the 95% confidence level and is only using 10 variables: SDF1= 0.752×Colour shade + 0.628×Odour intensity – 0.484×Odour fineness –0.720×Apricot odour – 0.927×Floral odour –
15
0.417×Herbaceous odour + 0.516×Tropical odour – 0.693×Bitterness – 0.706×Dryness – 0.375×Quality. Amongst the 35 observations used to fit the model (7 tasters x 5 wines), 34 or 97% were correctly classified: 27/28 in group 1 (96%) and 7/7 in group 2 (100%). From the relative magnitude of the coefficients in the above equation, together with the classification functions obtained for each group (Table 4), it is possible to determine how the independent variables are being used to discriminate amongst both groups. High inputs of 3 variables (colour shade, odour intensity and tropical odour) contribute to classify the samples in group 1 (those treated with fungicides against downy mildew under CAP), whereas high inputs in the rest of 7 variables contribute to classify the samples in group 2 (those treated with fungicides against downy mildew under GAP). Table 4. Classification functions are used to predict which
level of Group new observations belong to Attributes Classification Function
Coefficients Group 1 (n=28)
Group 2 (n= 7)
Colour shade 0.103 -0.034 Odour intensity -0.027 -0.114 Odour fineness 0.197 0.259 Apricot -0.063 0.014 Floral 0.220 0.334 Herbaceous 0.198 0.239 Tropical -0.077 -0.155 Bitterness 0.538 0.646 Dryness 0.144 0.248 Quality 0.241 0.321 CONSTANT -34.8 -50.4
Groups: Those treated with fungicides against downy mildew under CAP (group 1) and under GAP (group 2) 2.6.-Changes on the sensorial properties of Godello white wines with fungicides residues Summarizing the results of the sensorial tests used with the wine samples, our main findings were: 1. Fisher’s LSD: in GAP wines there is a clear predominance of floral varietal odours with a distinct note at apricot odours. 2. Stepwise multiple linear regression: overall quality in these wines is clearly related to the equilibration of odours (the so-called odour fineness) and the appreciated acidity in these young wines.
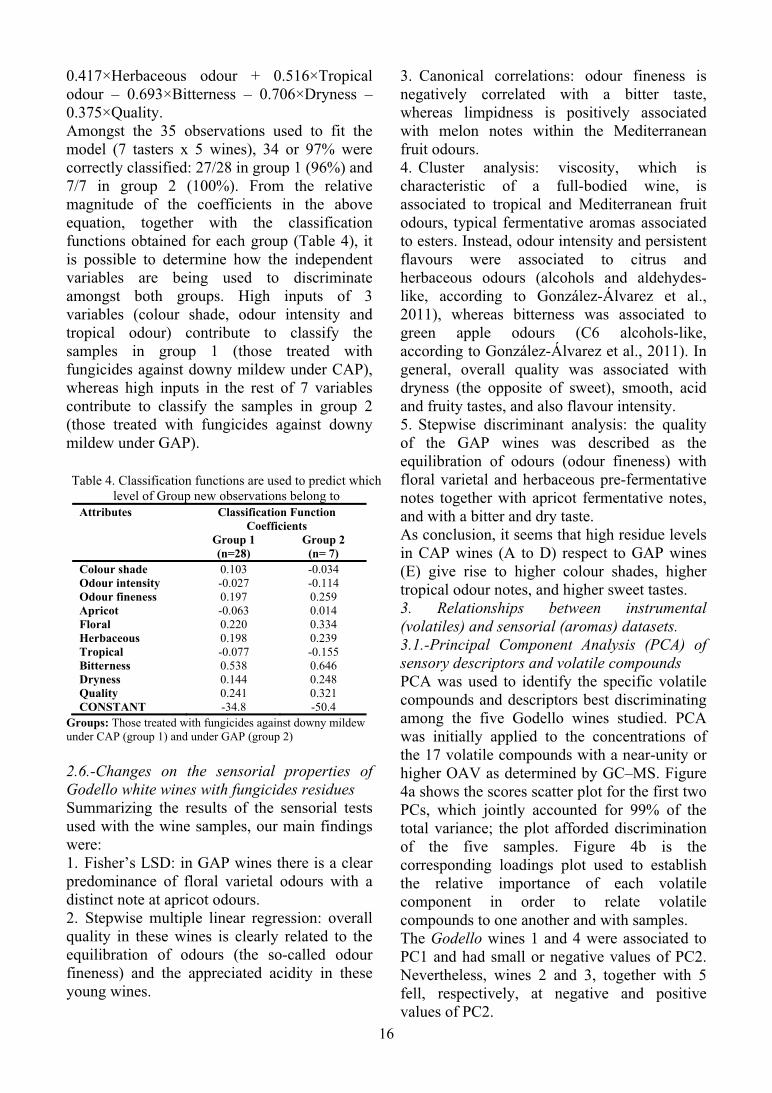
3. Canonical correlations: odour fineness is negatively correlated with a bitter taste, whereas limpidness is positively associated with melon notes within the Mediterranean fruit odours. 4. Cluster analysis: viscosity, which is characteristic of a full-bodied wine, is associated to tropical and Mediterranean fruit odours, typical fermentative aromas associated to esters. Instead, odour intensity and persistent flavours were associated to citrus and herbaceous odours (alcohols and aldehydes-like, according to González-Álvarez et al., 2011), whereas bitterness was associated to green apple odours (C6 alcohols-like, according to González-Álvarez et al., 2011). In general, overall quality was associated with dryness (the opposite of sweet), smooth, acid and fruity tastes, and also flavour intensity. 5. Stepwise discriminant analysis: the quality of the GAP wines was described as the equilibration of odours (odour fineness) with floral varietal and herbaceous pre-fermentative notes together with apricot fermentative notes, and with a bitter and dry taste. As conclusion, it seems that high residue levels in CAP wines (A to D) respect to GAP wines (E) give rise to higher colour shades, higher tropical odour notes, and higher sweet tastes. 3. Relationships between instrumental (volatiles) and sensorial (aromas) datasets. 3.1.-Principal Component Analysis (PCA) of sensory descriptors and volatile compounds PCA was used to identify the specific volatile compounds and descriptors best discriminating among the five Godello wines studied. PCA was initially applied to the concentrations of the 17 volatile compounds with a near-unity or higher OAV as determined by GC–MS. Figure 4a shows the scores scatter plot for the first two PCs, which jointly accounted for 99% of the total variance; the plot afforded discrimination of the five samples. Figure 4b is the corresponding loadings plot used to establish the relative importance of each volatile component in order to relate volatile compounds to one another and with samples. The Godello wines 1 and 4 were associated to PC1 and had small or negative values of PC2. Nevertheless, wines 2 and 3, together with 5 fell, respectively, at negative and positive values of PC2.
16
The major volatile compounds (Table 1) contributed to explaining the variability in the data sets; thus, they seemingly influence the complexity of the aroma profile of Godello wines. Most of the wines (1–3) were associated with 2-phenylethanol (H8) and octanoic acid (F4); on the other hand, sample 5 contained high relative correlations mainly of isoamyl alcohol (H2) and methionol (O1). (a)
(b)
Figure 4. Two-dimensional PCA: scores plot for Godello
wines (a) and loadings plot for 17 volatile components with near-unity or higher OAVs (b)
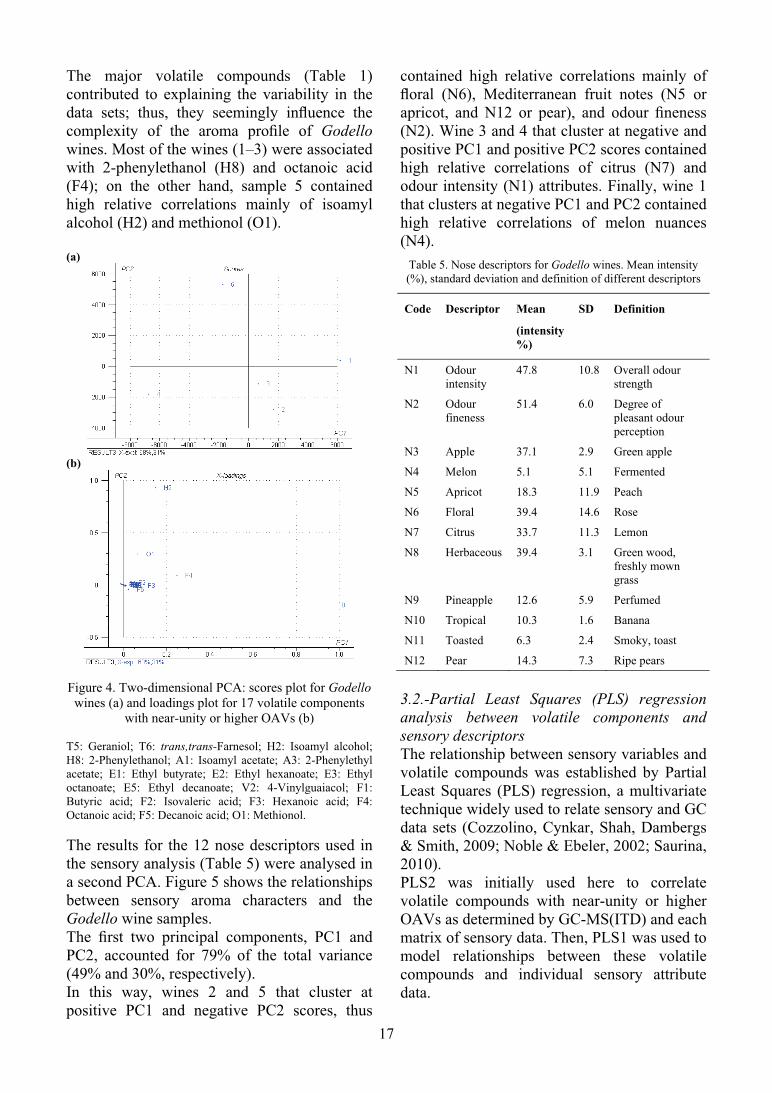
T5: Geraniol; T6: trans,trans-Farnesol; H2: Isoamyl alcohol; H8: 2-Phenylethanol; A1: Isoamyl acetate; A3: 2-Phenylethyl acetate; E1: Ethyl butyrate; E2: Ethyl hexanoate; E3: Ethyl octanoate; E5: Ethyl decanoate; V2: 4-Vinylguaiacol; F1: Butyric acid; F2: Isovaleric acid; F3: Hexanoic acid; F4: Octanoic acid; F5: Decanoic acid; O1: Methionol. The results for the 12 nose descriptors used in the sensory analysis (Table 5) were analysed in a second PCA. Figure 5 shows the relationships between sensory aroma characters and the Godello wine samples. The first two principal components, PC1 and PC2, accounted for 79% of the total variance (49% and 30%, respectively). In this way, wines 2 and 5 that cluster at positive PC1 and negative PC2 scores, thus
contained high relative correlations mainly of floral (N6), Mediterranean fruit notes (N5 or apricot, and N12 or pear), and odour fineness (N2). Wine 3 and 4 that cluster at negative and positive PC1 and positive PC2 scores contained high relative correlations of citrus (N7) and odour intensity (N1) attributes. Finally, wine 1 that clusters at negative PC1 and PC2 contained high relative correlations of melon nuances (N4).
Table 5. Nose descriptors for Godello wines. Mean intensity (%), standard deviation and definition of different descriptors
Code Descriptor Mean
(intensity %)
SD Definition
N1 Odour intensity
47.8 10.8 Overall odour strength
N2 Odour fineness
51.4 6.0 Degree of pleasant odour perception
N3 Apple 37.1 2.9 Green apple
N4 Melon 5.1 5.1 Fermented
N5 Apricot 18.3 11.9 Peach
N6 Floral 39.4 14.6 Rose
N7 Citrus 33.7 11.3 Lemon
N8 Herbaceous 39.4 3.1 Green wood, freshly mown grass
N9 Pineapple 12.6 5.9 Perfumed
N10 Tropical 10.3 1.6 Banana
N11 Toasted 6.3 2.4 Smoky, toast
N12 Pear 14.3 7.3 Ripe pears
3.2.-Partial Least Squares (PLS) regression analysis between volatile components and sensory descriptors The relationship between sensory variables and volatile compounds was established by Partial Least Squares (PLS) regression, a multivariate technique widely used to relate sensory and GC data sets (Cozzolino, Cynkar, Shah, Dambergs & Smith, 2009; Noble & Ebeler, 2002; Saurina, 2010). PLS2 was initially used here to correlate volatile compounds with near-unity or higher OAVs as determined by GC-MS(ITD) and each matrix of sensory data. Then, PLS1 was used to model relationships between these volatile compounds and individual sensory attribute data.
17

PLS2 modelling between the matrices of volatile compounds as determined by GC-MS(ITD) (17) and aroma descriptors (12) provided a two-factor model explaining 98% of the variance in X (volatile compounds with near-unity or higher OAVs) and 51% of that in Y (sensory descriptors) (Figure 6). (a)
(b)
Figure 5. Two-dimensional PCA: scores plot for Godello
wines (a) and loadings plot for the 12 nose descriptors (b). N1: Odour intensity; N2: Odour fineness; N3: Apple;
N4: Melon; N5: Apricot; N6: Floral; N7: Citrus; N8: Herbaceous; N9: Pineapple; N10: Tropical; N11:
Toasted; N12: Pear
The ensuing model was evaluated via the root mean square error for predictions (RMSEP), which was calculated to be lower than 10% for sensory descriptors. The central ellipsoid in Figure 6 indicates that all compounds inside the circle were poorly modelled and failed to explain variation in the sensory data. Positive correlations (r > 0.700) of the floral descriptor (N6) with ethyl hexanoate (E2) and isoamyl acetate (A1), and of the ripe fruit descriptor (e.g. melon notes, N4) and caprylic
acid (F4), were found. Similarly, negative correlations (r < –0.700) between isovaleric acid (F2) and odour intensity (N1), and —to some extent—, also of apricot (N5) with geraniol (T5) and ethyl decanoate (E5), were observed. Additional loading coefficients for the volatiles were estimated for some specific nose descriptors of the wines by applying PLS1 to a single Y variable at time (Table 6). Connecting the individual sensory descriptors to the seventeen volatile compounds in the wines exposed a relationship of each sensory note with 6 volatile variables mainly (Table 6). This allowed the following four descriptor categories to be established in terms of the relative weights of some volatiles: 1. Apple (N3), melon (N4), tropical (N10) and toasted (N11) were explained mainly by positive contributions of 3-methylbutanoic and octanoic acids (F2 and F4), but also isoamyl acetate (A1). 2. Apricot (N5), floral (N6) and pear (N12) were mainly explained by positive contributions of isoamyl acetate (A1), together with ethyl butyrate and hexanoate (E1 and E2), as well as by negative contributions of isovaleric and octanoic acids (F2 and F4). 3. Citrus (N7) and herbaceous (N8) were described by negative contributions of isovaleric and octanoic acids (F2 and F4). 4. Pineapple (N9) was positively explained by isoamyl acetate (A1) and ethyl hexanoate (E2), and negatively explained by both isovaleric and octanoic acids (F2 and F4), together with methionol (O1). 5. The loading weights (Table 4) obtained afford more useful conclusions, namely: 6. Two compounds classified as potentially discriminating odorants by PCA were also present in the models: methionol (O1) and n-octanoic acid (F4). 7. Seven of the ten nose descriptors (N3, N4, N10, N11, N5, N6 and N12) were positively influenced by three volatiles as a result of their high loading weights. The volatiles included an acetate (isoamyl acetate, A1), an ester (ethyl hexanoate, E2) and an organic acid (3-methylbutanoic acid, F2).
18

Table 6. One-dimensional PLS1: loading coefficients for X-variables (volatile components with near-unity or higher OAVs) used to estimate their weight into the Y-variables (sensory descriptors)
N3 N4 N5 N6 N7 N8 N9 N10 N11 N12 y-
expl %
62 79 63 76 62 65 55 46 49 44
A1 0.745 0.560 0.480 0.425 0.826 E1 0.271 0.297 E2 0.502 0.389 0.317 0.548 F2 0.919 0.880 –
0.510 –
0.693 –
0.899 –
0.878 –
1.473 1.051 1.450 –
0.497 F4 0.362 0.352 –
0.340 –
0.392 –
0.351 –
0.352 –
1.127 0.387 –
0.392 O1 –
0.444
a b
c d
T5: Geraniol; T6: trans,trans-Farnesol; H2: Isoamyl alcohol; H8: 2-Phenylethanol; A1: Isoamyl acetate; A3: 2-Phenylethyl acetate; E1: Ethyl butyrate; E2: Ethyl hexanoate; E3: Ethyl octanoate; E5: Ethyl decanoate; V2: 4-
Vinylguaiacol; F1: Butyric acid; F2: Isovaleric acid; F3: Hexanoic acid; F4: Octanoic acid; F5: Decanoic acid; O1: Methionol. N1: Odour intensity; N2: Odour fineness; N3: Apple; N4: Melon; N5: Apricot; N6: Floral; N7: Citrus; N8:
Herbaceous; N9: Pineapple; N10: Tropical; N11: Toasted; N12: Pear
Figure 6. Two-dimensional PLS2: scores plot for Godello wines (a), loadings plots of X-variables for the 17 volatile components with near-unity or higher OAVs (b) and of Y-variables for the 12 nose descriptors (c), together with
correlations between the loadings of X and Y variables (d)
8. Ethyl hexanoate (E2) and octanoic acid (F4) were the greatest negative contributors to the remaining nose descriptors: citrus (N7), herbaceous (N8) and pineapple (N9). 9. Similar results were obtained for floral (N6) and melon (N4) descriptors by applying, PLS1 and PLS2: the intensity of the floral note in
Godello wine is directly correlated with the wine content in ethyl hexanoate (E2) and isoamyl acetate (A1), and so is that of the melon note with the wine content in octanoic acid (F4). There were both positive and negative correlations and coefficients. This suggests that the perception of a given aromatic note is
19
influenced not only by the presence of a few components responsible for the note concerned, but also by that of other odorants with a negative impact on the perception the note (Aznar et al., 2003). Although confirming or rejecting the observed correlations would require further sensory testing (Campo et al., 2005; Escudero, Campo, Fariña, Cacho, & Ferreira, 2007), these theoretical aroma models are by themselves useful with a view to supplementing and improving the scant information currently available about Godello wines. CONCLUSIONS Fungicide residues might induce some modifications of yeast metabolism due to an increment of typical fermentative odours associated to esters in CAP wines (A-D) respect to the GAP wine (E); as a consequence, the fruity note was promoted in the aroma. The CAP wines were moved to a sweeter balance with a ripe fruit taste, which are associated to higher viscosity and also a higher cloudy colour. OAVs were used to evaluate the contribution to aroma composition of 31 volatile compounds quantified in all studied wines. Based on their OAVs, only 17 volatile compounds can be considered active odorants (i.e., substances with near-unity or higher OAV). Fatty acid esters (ethyl hexanoate, ethyl octanoate, ethyl butanoate), acetates (3-methyl-1-butyl acetate) and fatty acids (3-methylbutanoic acid, octanoic acid and hexanoic acid), which are formed during alcoholic fermentation, exhibited OAVs from 10 to 44. Based on a stepwise discriminant analysis, terpenes and higher alcohols were the only families of volatile compounds with OAVs > 1 not contributing to discrimination between sample groups. The other families with OAVs>1 had at least one member among the discriminant volatiles: 2-phenylethyl acetate among acetates; ethyl butanoate and octanoate among ethyl esters; 4-vinylguaiacol among phenols; 3-methylbutanoic acid among organic acids; methionol among sulphur compounds. With the results of the instrumental analysis, the compounds most markedly contributing to
flavour in Godello wines were those conferring a fruity (ethyl esters and acetates), spicy (fatty acids) or floral aroma (terpenes). Based on the sensory analysis, the descriptors with the highest intensity percent were fruity and floral (floral, apple and citrus), together with herbaceous notes. PCA was used to identify the specific volatile compounds and descriptors best discriminating among the five Godello wines studied, and PLS to detect positive and negative correlations between sensory descriptors and volatile compounds. ACKNOWLEDGEMENTS This work was funded with contract AGL2011–30378-C03-01 (Spanish Ministry of Science) and EU FEDER funds. C. González-Barreiro acknowledges Xunta de Galicia for their contract sponsorship through the Isidro Parga Pondal research program; R. Noguerol-Pato thanks the Spanish Ministry of Science by her FPU research grant; and M. González-Álvarez thanks the University of Vigo by her pre-doctoral research grant. The authors are grateful to J. Mazaira for his assistance. REFERENCES Acree T. & Arn H., 2004. Flavornet. Datu Inc.
<http://www.flavornet.org>. Aznar M., López R.J., Cacho F., Ferreira V., 2003.
Prediction of aged red wine aroma properties from aroma chemical composition. Partial least squares regression models. Journal of Agricultural and Food Chemistry, 51, p. 2700-2707.
Bonino M., Schellino R., Rizzi C., Aigotti R., Delfini C. & Baiocchi C., 2003. Aroma compounds of an Italian wine (Ruché) by HS–SPME analysis coupled with GC-ITMS. Food Chemistry, 80, p. 125-133.
Botelho G., Mendes-Faia A. & Clímago M.C., 2008. Differences in odor-active compounds of trincadeira wines obtained from five different clones. Journal of Agricultural and Food Chemistry, 56, p. 7393-7398.
Cacho J.F., 2006. La percepción de notas aromáticas del vino y el efecto de ciertas moléculas volátiles. ACE: Revista de Enología, p. 6.
Campo E., Ferreira V., Escudero A. & Cacho J., 2005. Prediction of the wine properties related to grape variety from dynamic-headspace gas chromatography-olfactometry data. Journal of Agricultural and Food Chemistry, 53, p. 5682-5690.
Cliff M., Yuksel D., Girard B. & King M., 2002. Characterization of Canadian ice wines by sensory
20

and compositional analysis. American Journal of Enology and Viticulture, 53, p. 46-50.
Cozzolino D., Cynkar W.U., Shah N., Dambergs R.G., & Smith P.A., 2009. A brief introduction to multivariate methods in grape and wine analysis. International Journal of Wine Research, 1, p. 123-130.
Culleré L., Escudero A., Cacho J., & Ferreira V., 2004. Gas chromatography–olfactometry and chemical quantitative study of the aroma of six premium quality Spanish aged red wines. Journal of Agricultural and Food Chemistry, 52, p. 1653-1660.
Darriet P., 1996. La grande diversité des formes de l’arôme dans le raisin. Vigne et Vin Publication Internacionales-Matillac, 33, p. 89-98.
Escudero A., Campo E., Fariña L., Cacho J. & Ferreira V., 2007. Analytical characterization of the aroma of five premium red wines. Insights into the role of odor families and the concept of fruitiness of wines. Journal of Agricultural and Food Chemistry. 55, p. 4501-4510.
Etiévant P.X., 1991. Wine. In H. Maarse (Ed.), Volatile compounds of food and beverages. New York: Marcel Dekker, p. 483-546.
Fazzalari F.A., 1978. Compilation of odor and taste threshold values data; ASTM Data Series DS 48A. Philadelphia: American Society for Testing and Materials.
Ferreira V. & Cacho J., 2009. Identification of impact odorants of wines. In M. Victoria Moreno-Arribas & M. Carmen Polo (Eds.), Wine chemistry and biochemistry, New York: Springer Science + Business Media, p. 393-415.
Ferreira V., López R. & Cacho J.F., 2000. Quantitative determination of the odorants of young red wines from different grape varieties. Journal of the Science of Food and Agriculture, 80, p. 1659-1667.
Flanzy C., 2003. Enología: fundamentos científicos y tecnológicos. (2nd ed.). Madrid: AMV Ediciones, Ediciones Mundi-Prensa.
Francis I.L. & Newton J.L., 2005. Determining wine aroma from compositional data. Australian Journal of Grape Wine Research, 11, p. 114-126.
González-Álvarez M., González-Barreiro C., Cancho-Grande B., Simal-Gándara J., 2011. Relationships between Godello white wine sensory properties and its aromatic fingerprinting obtained by GC-MS. Food Chemistry, 129, p. 890-898.
González-Álvarez M., González-Barreiro C., Cancho-Grande B., Simal-Gándara J., 2012. Impact of phytosanitary treatments with new fungicides (cyazofamid, famoxadone, mandipropamid and valifenalate) to control downy mildew on the volatile profile of Godello white wines. Food Chemistry, 131(3), p. 826-836.
González-Álvarez M., Noguerol-Pato R., González-Barreiro C., Cancho-Grande B., Simal-Gándara J., 2012. Changes on the sensorial attributes of white wines with the application of new anti-mildew fungicides under critical agricultural practices. Food Chemistry, 130(1), p. 139-146.
Guth H., 1997. Identification of character impact odorants of different white wine varieties. Journal of Agricultural and Food Chemistry, 45, p. 3027-3032.
Lee S.J. & Noble A.C., 2006. Use of partial least squares regression and multidimensional scaling on aroma models of California chardonnay wines. American Journal of Enology and Viticulture, 57, p. 363-370.
Li H., Tao Y.S., Wang H. & Zhang L., 2008. Impact odorants of Chardonnay dry white wine from Changli County (China). European Food Research and Technology, 227, p. 287-292.
Moyano L., Zea L., Moreno J. & Medina M., 2002. Analytical study of aromatic series in sherry wines subjected to biological aging. Journal of Agricultural and Food Chemistry, 50, p. 7356-7361.
Noble A.C. & Ebeler S.E., 2002. Use of multivariate statistics in understanding wine flavor. Food Reviews International, 18, p. 1-21.
Noguerol-Pato R., González-Barreiro C., Cancho-Grande B., Simal-Gándara J., 2009. Quantitative determination and characterisation of the main odourants of Mencía monovarietal red wines. Food Chemistry, 117, p. 473-484.
Ohloff G., 1978. Recent developments in the field of naturally occurring aroma components. Progress in the Chemistry of Organic Natural Products, 35, p. 431-527.
Pereira A.C., Reis M.S., Saraiva P.M. & Marques J.C., 2010. Analysis and assessment of Madeira wine ageing over an extended time period through GC–MS and chemometric analysis. Analytica Chimica Acta, 660, p. 8-21.
Rapp A. & Versini G., 1991. Influence of nitrogen compounds in grapes on aroma compounds of wine. In Rantz (Editor), Proceedings of the international symposium on nitrogen in grapes and wines, Davis, CA: American Society for Enology and Viticulture, p. 156-164.
Ribéreau-Gayon P., Glories Y., Maujean A. & Dubourdieu D., 2006. Handbook of enology. Vol. 2: The chemistry of wine stabilization and treatments. (2nd Ed.). Chichester, England: Jon Wiley & Sons.
Rodríguez-Nogales J., Fernández-Fernández E., Vila-Crespo J., 2009. Characterization and classification of Spanish Verdejo young white wines by volatile and sensory analysis with chemometric tools. Journal of the Science of Food and Agriculture, 89, p. 1927-1935.
Saurina J., 2010. Characterization of wines using compositional profiles and chemometrics. Trends in Analytical Chemistry, 29, p. 234-245.
Zea L., Moyano L., Moreno J., Cortes B. & Medina M., 2001. Discrimination of the aroma fraction of Sherry wines obtained by oxidative and biological ageing. Food Chemistry, 75, p. 79-84.
21
Recommended