PROOF ONLY
CSIRO PUBLISHING
www.publish.csiro.au/journals/ijwf International Journal of Wildland Fire 2009, 18, 1–11
Modeling and mapping wildfire ignition risk in Portugal
Filipe X. CatryA,C, Francisco C. RegoA, Fernando L. BacaoB
and Francisco MoreiraA
ACentre of Applied Ecology ‘Prof. Baeta Neves’, Institute of Agronomy, Technical University of Lisbon,Tapada da Ajuda, 1349-017 Lisbon, Portugal.
BInstitute of Statistics and Information Management, New University of Lisbon, Campus de Campolide,1070-312, Lisbon, Portugal.
CCorresponding author. Email: [email protected]
Abstract. Portugal has the highest density of wildfire ignitions among southern European countries. The ability topredict the spatial patterns of ignitions constitutes an important tool for managers, helping to improve the effectiveness offire prevention, detection and firefighting resources allocation. In this study, we analyzed 127 490 ignitions that occurred inPortugal during a 5-year period. We used logistic regression models to predict the likelihood of ignition occurrence, usinga set of potentially explanatory variables, and produced an ignition risk map for the Portuguese mainland. Results showthat population density, human accessibility, land cover and elevation are important determinants of spatial distributionof fire ignitions. In this paper, we demonstrate that it is possible to predict the spatial patterns of ignitions at the nationallevel with good accuracy and using a small number of easily obtainable variables, which can be useful in decision-makingfor wildfire management.
Additional keywords: geographic information systems, ignition occurrence, logistic regression, spatial patterns.
Introduction
Wildfires constitute a serious concern in many regions of theMediterranean Basin, representing important social, environ-mental and economic impacts. Statistics show that both theburned area and number of fire ignitions increased in Portugalduring the last decades, and in the period 2000–05, the averagedensity of ignitions was three times higher in Portugal than inSpain, France, Italy and Greece combined (ENOC 2007[AQ6]).Since 2000, Portugal has registered an average of ∼28 500 fireignitions every year (DGRF 2006).The increasing number of fireignitions occurs despite more resources being allocated to vigi-lance, firefighting and prevention, including management plans,public education campaigns and the implementation of morerestrictive legislation concerning human activities susceptibleof causing wildfires.
The importance of knowing the spatial patterns of fire igni-tion is widely recognized, and the ignition risk (i.e. the chance ofa fire starting as determined by the presence and activity of anycausative agent, also defined as ‘fire risk’; FAO 1986; NWCG2006) is an essential element in analyzing and assessing fire dan-ger (e.g. Johnson and Miyanishi 2001; Vasconcelos et al. 2001;Chuvieco et al. 2003; Bonazountas et al. 2005; Finney 2005;Roloff et al. 2005; Vasilakos et al. 2007). However, there arestill several fire prevention plans that only consider the factorsinfluencing fire spread and suppression difficulty (fuel, weather,topography, etc.).Although the high number of wildfire ignitionsin Portugal can constitute a problem in terms of fire detectionand firefighting resources dispersion, very few studies have con-centrated on trying to characterize and understand the factorsinfluencing their spatial occurrence and their causes. Until now,
the official fire danger estimation systems and cartography beingused gave little or no attention to specifically predicting thelikelihood of a fire starting (IGP 2004a; Carreiras and Pereira2006), which could be an important contribution to improvingthe predictive ability of these systems.
Although lightning is the primary cause of fire in severalregions of the world (e.g. Rorig and Ferguson 1999), in otherregions, including southern Europe, most contemporary wild-fires are of human origin (e.g. Cardille et al. 2001; DGRF 2006;MMA 2007). For example, in Portugal and Spain, ∼97% of allinvestigated wildfires were human-caused (DGRF 2006; MMA2007). A recent official report from the Portuguese Forest Ser-vices (DGRF 2006) shows that among the fires with knowncauses that occurred between 2000 and 2005 (∼3% of all fires),49% were intentionally caused (arson), while 37% were due tonegligence and 11% were accidentally caused.
Previous studies identified numerous factors influencingthe spatial patterns of fire ignitions (Chou 1992; Vega-Garciaet al. 1996; Cardille et al. 2001; Cardille and Ventura 2001;Vasconcelos et al. 2001; Mercer and Prestemon 2005; Gentonet al. 2006; Nunes and Duarte 2006; Catry et al. 2007a; Lobodaand Csiszar 2007; Romero-Calcerrada et al. 2008). However, theeffects of different factors on fire occurrence can vary amongecosystems and across spatial and temporal scales (e.g. Badia-Perpinyã and Pallares-Barbera 2006; Yang et al. 2007). Basedon previous knowledge, we concentrated our analysis on factorsrelated to human presence and activity, selecting a small groupof easily obtainable variables that could potentially explain thespatial patterns of fire ignition in Portugal, namely: populationdensity, distance to roads, land cover type and elevation. Our
© IAWF 2009 10.1071/WF07123 1049-8001/09/070001
AAUUTTHHOORRSS’’ PPAAGGEE PPRROOOOFFSS::NNOOTT FFOORR CCIIRRCCUULLAATTIIOONN
PROOF ONLY
2 Int. J. Wildland Fire F. X. Catry et al.
Spain
France
United KingdomIreland
SEW
N
GermanyBelgiumPoland
Slovakia
Hungary
Croatia
AustriaSwitzerland
Italy
Tunisia
AlgeriaMorocco
0 20 40 Km
Portugal
Serb
Albania
Gre
Czech Republic
Netherlands
Denmark
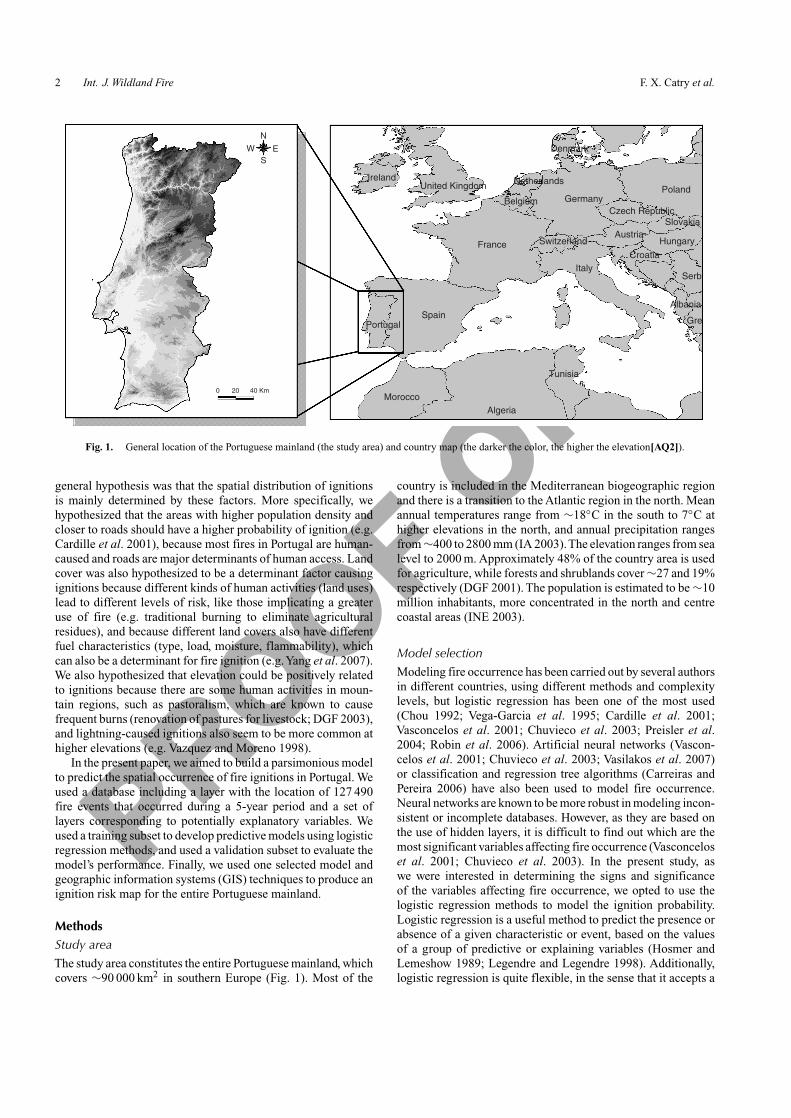
Fig. 1. General location of the Portuguese mainland (the study area) and country map (the darker the color, the higher the elevation[AQ2]).
general hypothesis was that the spatial distribution of ignitionsis mainly determined by these factors. More specifically, wehypothesized that the areas with higher population density andcloser to roads should have a higher probability of ignition (e.g.Cardille et al. 2001), because most fires in Portugal are human-caused and roads are major determinants of human access. Landcover was also hypothesized to be a determinant factor causingignitions because different kinds of human activities (land uses)lead to different levels of risk, like those implicating a greateruse of fire (e.g. traditional burning to eliminate agriculturalresidues), and because different land covers also have differentfuel characteristics (type, load, moisture, flammability), whichcan also be a determinant for fire ignition (e.g.Yang et al. 2007).We also hypothesized that elevation could be positively relatedto ignitions because there are some human activities in moun-tain regions, such as pastoralism, which are known to causefrequent burns (renovation of pastures for livestock; DGF 2003),and lightning-caused ignitions also seem to be more common athigher elevations (e.g. Vazquez and Moreno 1998).
In the present paper, we aimed to build a parsimonious modelto predict the spatial occurrence of fire ignitions in Portugal. Weused a database including a layer with the location of 127 490fire events that occurred during a 5-year period and a set oflayers corresponding to potentially explanatory variables. Weused a training subset to develop predictive models using logisticregression methods, and used a validation subset to evaluate themodel’s performance. Finally, we used one selected model andgeographic information systems (GIS) techniques to produce anignition risk map for the entire Portuguese mainland.
MethodsStudy areaThe study area constitutes the entire Portuguese mainland, whichcovers ∼90 000 km2 in southern Europe (Fig. 1). Most of the
country is included in the Mediterranean biogeographic regionand there is a transition to the Atlantic region in the north. Meanannual temperatures range from ∼18◦C in the south to 7◦C athigher elevations in the north, and annual precipitation rangesfrom ∼400 to 2800 mm (IA 2003).The elevation ranges from sealevel to 2000 m. Approximately 48% of the country area is usedfor agriculture, while forests and shrublands cover ∼27 and 19%respectively (DGF 2001). The population is estimated to be ∼10million inhabitants, more concentrated in the north and centrecoastal areas (INE 2003).
Model selectionModeling fire occurrence has been carried out by several authorsin different countries, using different methods and complexitylevels, but logistic regression has been one of the most used(Chou 1992; Vega-Garcia et al. 1995; Cardille et al. 2001;Vasconcelos et al. 2001; Chuvieco et al. 2003; Preisler et al.2004; Robin et al. 2006). Artificial neural networks (Vascon-celos et al. 2001; Chuvieco et al. 2003; Vasilakos et al. 2007)or classification and regression tree algorithms (Carreiras andPereira 2006) have also been used to model fire occurrence.Neural networks are known to be more robust in modeling incon-sistent or incomplete databases. However, as they are based onthe use of hidden layers, it is difficult to find out which are themost significant variables affecting fire occurrence (Vasconceloset al. 2001; Chuvieco et al. 2003). In the present study, aswe were interested in determining the signs and significanceof the variables affecting fire occurrence, we opted to use thelogistic regression methods to model the ignition probability.Logistic regression is a useful method to predict the presence orabsence of a given characteristic or event, based on the valuesof a group of predictive or explaining variables (Hosmer andLemeshow 1989; Legendre and Legendre 1998). Additionally,logistic regression is quite flexible, in the sense that it accepts a

PROOF ONLY
Modeling fire ignition risk in Portugal Int. J. Wildland Fire 3
mixture of continuous and categorical variables, as well as non-normally distributed ones (Hosmer and Lemeshow 1989; Leg-endre and Legendre 1998). Its analysis is based on the followingfunction:
P = 1/(1 + e−z), (1)
where P is the probability of occurrence of the event, and z isobtained from a linear combination of the independent variablesestimated from a maximum likelihood fitting:
z = b0 + b1x1 + b2x2 + . . . + bnxn,
where b0 is the constant and bn is the weighing factor of thevariable xn. The z values can be interpreted as a function of theprobability of occurrence, and P converts z values in a continuousfunction (probability) that ranges from 0 to 1.
Fire ignition databaseThe dependent variable used in our analysis was the presence orabsence of wildfire ignitions. For presence, we used the officialwildfire database from the Portuguese Forest Services (DGRF),which contained the geographical coordinates and other char-acteristics (e.g. fire code, start and end date) of all fires thatoccurred in Portugal between 2001 and 2005. This databasewas then corrected, avoiding duplications, and removing all therecords with inconsistent data, which included ignitions witherroneous coordinates or with missing dates. After these proce-dures, from an initial number of 137 204 ignition points, 127 490remained in the database for analysis. As we also needed toaccount for non-ignition locations in order to model ignition risk,191 235 points (1.5 times the number of ignition points) wererandomly generated within the whole country, and were consid-ered as non-ignition points. Ignition and non-ignition points werecoded in a numeric binary format (1 – presence, 0 – absence),constituting the fire ignition dependent variable.
Because an evaluation of model performance (predictive abil-ity) based on the same dataset used to build the model willprobably result in an over-fit (Hosmer and Lemeshow 1989), weprepared two separate datasets. From the fire ignition database,we randomly selected 63 745 ignitions (50%) and 127 490 non-ignition points to build the model, constituting the trainingsubset; we opted to use two times more non-ignition points(average density 1.5 points km−2), to better represent the spatialheterogeneity of the country, as it is expected that its variabilityis larger than that found in the ignition sample. For the test-ing phase, we reserved the remaining fire ignitions and an equalnumber of non-ignition points, constituting the validation subset.
Geographic constraintsThe majority of fire ignition coordinates in Portugal are asso-ciated with the nearest toponymic location, meaning that theydo not have totally accurate coordinates, which is also a rela-tively common problem in other countries (e.g. Amatulli et al.2007). In order to have an idea of the geographic inaccuraciesassociated with this location method, we used random points andverified that 96% of them were located at less than 500 m fromthe nearest toponimy; thus, we can estimate that 96% of fire igni-tions would have a maximum error of 500 m, if they occurredrandomly in the territory. However, the real errors in the fire
database are probably considerably lower, because the majorityof ignitions occur in areas where the toponymic density is higher.In fact, considering the seven districts with a higher number offire ignitions (comprising 77% of all occurrences), we estimatedthat the majority of them (∼80%) would have a maximum errorof ∼250 m. Although we believe that these positional uncertain-ties do not have a significant influence on our analysis, becausewe are mainly dealing with geographic information at relativelylarge spatial scales and with a very large sample, they influencedsome subsequent decisions concerning the spatial resolution ofcartographic layers (see next section).
Cartographic informationAll the spatial analysis and cartographic production were madeusing GIS, mainly ArcGIS (ESRI 2005). Because of the men-tioned ignition location uncertainties, and in order to reducetheir potential influence on the analysis, the base raster mapswere produced with 250-m spatial resolution, as it is recognizedthat an increment in cell size (i.e. generalization) can reduceor eliminate location accuracy problems (e.g. Koutsias et al.2004). Next, we describe the base cartography used and the pre-processing steps performed to obtain the explanatory variablemaps.
(i) Population density – this map was obtained using a databasefrom the National Statistics Institute concerning the 2001Census (INE 2003), which included the number of personspresent in each parish. This information was assigned to theofficial parish map (IGP 2004b; vector format) and the pop-ulation density (number of persons per km2) was calculatedfor each of the 4050 parishes in the country mainland.
(ii) Land cover – we used the Corine Land Cover 2000 car-tography at 1 : 100 000 scale (IA 2005; vector format). ThePortuguese cartography identifies 42 land cover classes,which were grouped into six major classes according totheir main characteristics: (1) agriculture (agricultural areas;covering ∼47.8% of the country surface); (2) forests (cov-ering 27.3%); (3) shrublands (covering 18.8%; includingsome natural grasslands); (4) urban–rural interspersed areas(covering 2.7%; including urbanized and other artificiallymodified areas); (5) sparsely vegetated areas (covering1.9%); and (6) wetlands (covering 1.5%; also includingwater bodies, covering 0.1%). Class 4 corresponds mainly toareas where urban structures and other artificially modifiedareas are interspersed with other land uses (mainly agricul-ture); continuous urban fabric represents less than 6% of thetotal area of this class.
(iii) Distance to roads – this map was obtained using thePortuguese Itinerary Military Map in vector format at1 : 500 000 scale (IGEOE 2005), representing the mainnational and regional roads. Distance (in m) from eachlocation of the territory to the nearest road was calculated,producing a raster map with 100-m spatial resolution thatwas resampled to 250 m using the bilinear interpolationmethod (ESRI 2005).
(iv) Elevation – we used a digital elevation model (m) in rasterformat and with 90-m spatial resolution (NASA et al. 2004).This map was submitted to several operations, includingprojection transformation to be consistent with other data
PROOF ONLY
4 Int. J. Wildland Fire F. X. Catry et al.
layers, and correction of negative and no-data values. Finallythe map was also resampled to 250 m using the bilinearinterpolation method.
Fire ignition characterization and modelingThe fire ignition database, including both fire ignitions and non-ignitions, was transformed into a vector point map and overlayedwith all the other maps in order to gather all the information in asingle database, where each presence–absence record containedthe information of all the other layers.As we noticed the existenceof a residual number of ignitions (∼0.08%) located in dams orother water bodies (wetlands class) that were considered locationerrors, we opted to assign these points to the nearest land coverclass.
In a first step, we performed a frequency analysis to charac-terize the spatial occurrence of fire ignitions. For that purpose,continuous variables were classified in intervals, and expectedv. observed frequencies were registered and compared. Observedfrequencies were the number of fire ignitions that occurred in the5-year period in each class interval, and the expected frequencieswere represented by the area of each class in the whole country,assuming that this would correspond to a random distribution.Comparisons between observed and expected frequencies werebased on χ2 statistics (Sokal and Rohlg 1987), using a signifi-cance level of 0.001.The same method was used by other authors(Badia-Perpinyã and Pallares-Barbera 2006).
In a second step, using the training dataset, we used logis-tic regression to fit models to predict the probability of ignitionoccurrence.As the proportion of ignitions was determined by thenumber of non-ignition localities that were defined, the obtainedlogistic model probabilities represent relative probabilities,rather than real ignition probabilities.
Continuous variables were very skewed; thus they werelog(x + 1) transformed to approach normality and reduce vari-ance. As models with transformed variables systematicallyshowed a better fit to the data, they were retained, replacingthe original variables.Additionally, the correlation between vari-ables was analyzed using the Pearson correlation coefficient.Themost correlated pairs of variables were distance to roads andpopulation density (r = −0.328; P < 0.01), and population den-sity and elevation (r = −0.315; P < 0.01); thus all the variableswere used as candidates for model selection. For the multivari-ate logistic regression, the independent variables were selectedusing forward stepwise selection (forward likelihood ratio).
The results of the statistical tests performed should always beseen as an indication, as observations are bound to have somedegree of temporal and spatial dependence. All analyses werecarried out using SPSS software (SPSS 2006).
Production of the fire ignition risk mapIn order to spatialize the model obtained in the multivariatelogistic analysis, we had to prepare all the cartographic layersusing GIS techniques. All the maps needed to be in raster for-mat and coregistered in a common base 250-m cell size. Themaps in vector format (population density and land cover) weredirectly converted to the raster format, while distance to roadsand elevation maps were previously resampled using a bilinear
interpolation technique. Following these steps, the model equa-tion was spatialized through map algebra operations in a GISenvironment, in order to obtain the ignition risk map. The mapproduced was classified into six risk classes, representing thedifferent probabilities that a sample point corresponds to a wild-fire ignition: extremely low (0–10%), very low (10–20%), low(20–40%), medium (40–60%), high (60–80%) and very high(80–100%).
Evaluation of model and ignition risk map performanceThe assessment of the model’s performance and adjustment weredone by means of different standard approaches for logisticregression. First, signs of estimated parameters were checkedto make sure they agreed with theoretical expectations based onprevious knowledge of fire occurrence. The significance of eachsingle variable was evaluated using the Wald test (Legendre andLegendre 1998), considering that the parameter was useful to themodel if the significance level was lower than 0.001. The overallsignificance of the models was assessed through the Hosmer andLemeshow goodness-of-fit test, which is a measure of how wellthe model performs (Hosmer and Lemeshow 1989; SPSS 2006).If the significance of the test is small (i.e. less than 0.05), thenthe model does not adequately fit the data (Norusis 2002; SPSS2006).
Quantification of the model predictive ability was also doneby comparing observed with predicted probability of ignition,both in the training and in the validation datasets. A confusionmatrix (Congalton 1991) was used to assess the model clas-sification accuracy, as a 2 × 2 classification table of observedv. predicted values. For this purpose, we had to establish someprobability at which to accept the occurrence of an ignition.Cut-off points are used to convert probability of ignition todichotomous 0–1 data, where cells with values below the cut-off are considered as non-ignition sites, while all above becomepredicted as ignition sites. Although in some cases a value of 0.5is used, this threshold can be modified, and ultimately dependson the objectives of the user (Vega-Garcia et al. 1995; Vasconce-los et al. 2001; Chuvieco et al. 2003). The training dataset wasused to construct classification tables for different cut-off points,helping define an optimal value. Two statistics were computedfor each cut-off point considered: sensitivity and specificity. Sen-sitivity is the proportion of true positives that are predicted asevents and specificity is the proportion of true negatives thatare predicted as non-events. The optimal cut-off point corre-sponds to the value where both sensitivity and specificity reachthe same proportion (e.g. Vega-Garcia et al. 1995; Vasconceloset al. 2001), which in our case was 0.34.
Another procedure used to evaluate how well a model isparameterized and calibrated in presence–absence models is theROC (receiver operating characteristic) analysis (Swets 1988;Pearce and Ferrier 2000; SPSS 2006). The ROC method hasadvantages in assessing model performance in a threshold-independent fashion, being independent of prevalence (e.g.Manel et al. 2001). The curve is obtained by plotting sensitiv-ity v. specificity for varying probability thresholds. Good modelperformance is characterized by a curve that maximizes sensitiv-ity for low values of specificity (i.e. large areas under the curve,(AUC)). Usually AUC values of 0.5–0.7 are taken to indicate

PROOF ONLY
Modeling fire ignition risk in Portugal Int. J. Wildland Fire 5
00–10
Agriculture Forest Shrubland Urban-rural Sparsely vegetated
Wetlands
10–20 20–40
Population density (persons/km2) Distance to roads (m)
Elevation (m)Land cover
Fre
quen
cy (
%)
Fre
quen
cy (
%)
40–100 �100 0–500 500–1000 1000–1500 1500–2000 �2000
0–250 250–500 500–750 750–1000 �1000
10
20
30
40
50
60
70(a) (b)
(d )(c)
0
10
20
30
40
50
60
70
Country
Ignitions
Country
Ignitions
Country
Ignitions
Country
Ignitions
Fig. 2. Fire ignition frequency in relation to different variables: (a) population density; (b) distance to roads; (c) land cover; and (d) elevation. The expectedfrequencies (country) are represented by the area of each class in the country, assuming that this would correspond to a random distribution[AQ3].
low accuracy, values of 0.7–0.9 indicate useful applications andvalues above 0.9 indicate high accuracy (Swets 1988).
The produced ignition risk map was also evaluated to assessits ability to predict ignition occurrence. This was also madethrough a confusion matrix using the validation dataset com-posed of 63 745 known ignition points, and with an equal numberof non-ignition points, in order to evaluate the effect of modelspatialization. Additionally, for each ignition point, we recordedthe respective probability value present in the map, and analyzedthe results by comparing the percentage of area covered by eachrisk class in the whole country with the percentage of ignitionsoccurring at each one. Ignition density in each risk class was alsoevaluated using all ignition points. At a final step, a regressionequation was developed to predict average density of ignitionsfrom the original explanatory variables.
ResultsFrequencies of fire ignitionsDuring the period analyzed, the year 2005 registered the high-est number of ignitions (27.2%), followed by 2001 (20.5%),2002 (20.0%), 2004 (16.3%) and 2003 (16.1%). The majority
of fire ignitions occurred between June and September (76.2%of the total), which is the fire season in Portugal. A prelimi-nary analysis of the ignition spatial distribution in relation tothe selected variables showed that ∼98% of ignitions occurredless than 2 km from the nearest road, and regarding elevation,98% occurred below 1000 m. Approximately 60% of ignitionswere located in agricultural areas, and 25% occurred in urban–rural interspersed areas. Forested areas registered 8.5% of allignitions, and uncultivated areas (including shrublands and natu-ral grasslands) registered 6.2%. Concerning population density,although municipalities with more than 100 persons per km2
only represent 21% of the territory, they registered 70% of allfire ignitions.
Comparisons between observed and expected frequencies offire ignitions in relation to the selected variables are presentedin Fig. 2. We used a homogeneity test to evaluate the differencesbetween observed and expected frequencies, and confirmed theexistence of significant differences in their spatial distributionin relation to all variables. The χ2 homogeneity test for popu-lation density with respect to frequency of ignitions per ha ofland showed that fire ignitions are more likely to occur in morepopulated areas (χ2 = 1 77 138.8, P < 0.001). The frequency

PROOF ONLY
6 Int. J. Wildland Fire F. X. Catry et al.
Table 1. Results of multivariate logistic regression model using four variablesVariables are ordered by decreasing importance. Full model goodness-of-fit statistic = 78 885.53 (d.f. = 8, P < 0.001); AUC (area
under the curve) = 0.869 ± 0.001 (P < 0.001)
Variables Coefficient s.e. Wald χ2 d.f. P value
Population density 0.820 0.005 24 266.36 1 <0.001Land cover 9667.60 5 <0.001
Urban–rural 2.455 0.158 242.06 1 <0.001Agriculture 1.672 0.157 113.89 1 <0.001Shrublands 0.439 0.158 7.74 1 0.005Sparsely vegetated 0.426 0.170 6.33 1 0.012Forest 0.388 0.157 6.08 1 0.014
Elevation 0.585 0.007 6981.76 1 <0.001Distance to roads −0.166 0.002 5919.22 1 <0.001Constant −7.833 0.162 2336.07 1 <0.001
Table 2. Results of multivariate logistic regression model using three variablesVariables are ordered by decreasing importance. Full model goodness-of-fit statistic = 1688.19 (d.f. = 8, P < 0.001);
AUC = 0.847 ± 0.001 (P < 0.001)
Variables Coefficient s.e. Wald χ2 d.f. P value
Population density 0.875 0.005 30 968.93 1 <0.001Distance to roads −0.214 0.002 11 072.16 1 <0.001Elevation 0.473 0.006 5492.23 1 <0.001Constant −5.890 0.049 14 552.78 1 <0.001
of ignitions also depended on the variable distance to roads(χ2 = 82 308.2, P < 0.001), showing that ignitions are morelikely to occur closer to the main roads. The land cover variablealso influenced the occurrence of fire ignitions (χ2 = 2 57 366.0,P < 0.001), and all classes were significant. The class desig-nated as urban–rural had nine times more ignitions than wouldbe expected if they occurred randomly in the territory, andas expected, the opposite situation was observed in wetlands,where ignition frequency was nine times lower. Forested anduncultivated areas (including shrublands and natural grasslands)registered approximately three times less fire ignitions than ifthey were randomly distributed. Finally, ignitions were also sig-nificantly affected by elevation (χ2 = 1906.2, P < 0.001), butthe differences between observed and expected frequencies aremuch less obvious than with the other three variables.
Fire ignition modelsThe obtained logistic regression model (Table 1) showed thatthe most influential variable explaining the spatial patterns ofignitions was population density, followed by land cover type,elevation, and distance to roads. The Hosmer and Lemeshowgoodness-of-fit test showed adequate fit of the model to the data(χ2 = 78 885.53, P < 0.001). TheAUC for this model was 0.869,and its global accuracy was 79.8% (using the training dataset),both of which indicate good model adjustment.
The model obtained is represented by the following equation:
P1 = 1/(1 + e−(−7.833+0.820Pop_D−0.166D_roads+0.585Elev+2.455Urb+1.672Agr+0.388For+0.439Shr+0.426Spa)),
where P1 is the probability that a point corresponds to a fire igni-tion, Pop_D is the population density (persons km−2), D_Roads
is the distance to the nearest road (m), Elev is the elevation (m),Urb is the land cover class representing urban–rural interspersedareas, Agr represents agriculture, For represents forest, Shr rep-resents shrublands, and Spa represents sparsely vegetated areas(all variables but land cover are log(x + 1) transformed).
Model classification accuracy was also evaluated using thevalidation dataset. According to the confusion matrix produced,this model correctly classified 80.3% of all observations.Amongobserved ignitions, 78.2% were correctly predicted by the model,and 82.7% of non-ignitions were also well classified. The omis-sion and commission errors for both ignition and non-ignitionwere not very high. Omission error of ignition events was 16.7%,representing the percentage of observed ignitions that were notpredicted by this model, and the commission error was 21.8%,representing the percentage of expected ignitions that were notobserved. The comparison between the model accuracy obtainedwith the training and the validation datasets revealed very smalldifferences (79.8 v. 80.3%).TheAUC using the validation datasetwas 87.2% (s.e. = ±0.001, P < 0.001).
In a subsequent step, we also evaluated the possibility ofdeveloping a simpler model to predict ignition occurrence, asit would allow easier use by managers. A model with fewervariables is expected to be more stable and easily generalized;however, the more variables are included in the model, the higherwill the estimated standard errors and the model dependence onthe observed data (Hosmer and Lemeshow 1989). Thus, a newlogistic model was developed without using the land cover vari-able, which is more likely to change through time than the othervariables.
The performance of the model using only three variables(Table 2) was not much different from the model using four

PROOF ONLY
Modeling fire ignition risk in Portugal Int. J. Wildland Fire 7
Fire ignition risk
Extremely low
Very low
Very high
Country limits
0 50 100
Km
Low
Medium
High
N
S
EW
Fig. 3. Fire ignition risk map produced for the entire Portuguese mainland[AQ4].
variables. The simplest model presented a global accuracy of77.1% with both the training and the validation datasets. Theomission error of ignition events was 23.2% and the commissionerror was 22.7%.TheAUC was 0.847 (s.e. = ±0.001, P < 0.001)with the training dataset, and 0.849 (s.e. = ±0.001, P < 0.001)with the validation dataset.
The new model obtained is represented by the followingequation:
P2 = 1/(1 + e−(−5.890+0.875Pop_D−0.214D_roads+0.473Elev)).
In order to evaluate model stability during the study period,we compared the coefficient values and the model performance

PROOF ONLY
8 Int. J. Wildland Fire F. X. Catry et al.
0
160
140
120
100
80
60
40
Igni
tion
dens
ity (
igni
tions
/100
km
2 /ye
ar)
20
020
D � 166.23 P2
R2 � 0.995
40Ignition risk (%)
60 80 100
Fig. 4. Density of ignitions (D) as an average for 2001–05, as a function ofP1 (P, probability of ignition occurrence), as computed in the Fire ignitionmodels section[AQ5].
of the global model (fitted with data from the 5-year period) withthose from separate models for each of the 5 years, and verifiedthat both coefficients and performance (AUC range = 0.832–0.855) were very similar. The same constancy was observed inthe model using four variables.
Fire ignition risk mapThe fire ignition model obtained using four explanatory vari-ables was spatialized in a GIS environment. The map obtainedrepresenting the relative probability that an ignition occurs at agiven location (Fig. 3) was classified into six risk classes rang-ing from extremely low to very high. The representation of eachclass in the country was the following: extremely low (covering42.1% of the territory), very low (23.0%), low (18.9%), medium(8.8%), high (4.6%) and very high (2.6%). The areas with highand very high risk of ignition occurrence, representing only 7.2%of the country, are mainly located in the north and central coastalregions, where human presence and activity is more important.
We evaluated the performance of the ignition risk map usinga confusion matrix, as we did previously for model evaluation.The map produced also showed good predictive results, witha global accuracy of 79.1%. With the objective of describingthe map prediction ability in a more detailed way, we overlaidthe validation ignition points with the map, recording the exactrisk class where the ignitions were located, verifying that morethan 50% of them were located in high and very high risk classesalthough they only represent 7% of the country area (i.e. ignitionsoccurred at these classes with a much higher frequency thanwould be expected in a random distribution). However, only 10%of the ignitions were located in the two lowest risk classes, whichcover more than 65% of the country area.
Average ignition density in each risk class (ignitions per100 km2 per year) was also computed to give a better idea ofthe potential number of ignitions that managers can expect. Ina 1-year period, the ignition density is expected to be ∼139times higher in the areas with very high risk than in areas withextremely low risk (covering 42% of the country), and four timeshigher than in areas with medium ignition risk. There is a strongrelationship between the obtained fire ignition risk (P) and the
real average density of ignition (D) (Fig. 4). The combination ofthe model developed for P1 and the relationship between P1 andD allows a general comprehensive final equation that predictsthe average density of ignitions directly from the explanatoryvariables as:
D = 166.23/(1+e−(−7.833+0.820Pop_D−0.166D_roads+0.585Elev+2.455Urb+1.672Agr+0.388For+0.439Shr+0.426Spa))2.
Discussion and conclusionsDeterminants of fire ignitionPortugal is the southern European country with the highest den-sity of fire ignitions (EC 2007). Results of the present studyshow that, as hypothesized, human presence and activity are thekey drivers of ignitions in Portugal. The selected explanatoryvariables, namely population density, distance to roads, landcover and elevation, were all highly significantly related withthe spatial distribution of ignitions.
Population density was the most important variable in ourmodel. This variable showed a positive influence on ignitionoccurrence, meaning a higher probability of ignition in the morepopulated areas, as was previously hypothesized. In regionswhere most fires are human-caused, this is a logical result, and inseveral other studies, population density was found to positivelyrelated to wildfire ignitions (e.g. Cardille et al. 2001; Mercerand Prestemon 2005). Also according to prior expectations,distance to roads showed a negative influence on ignitions distri-bution, meaning a decreasing probability of ignition occurrencewith increasing distance to roadways. This result is also consis-tent with other authors’ findings (e.g. Vega-Garcia et al. 1996;Romero-Calcerrada et al. 2008). Roadways increase humanaccess to several areas, including those with low population den-sity, and we think that this is the main reason for the higherfrequency of ignitions near roads. In our study, 98% of ignitionsoccurred less than 2 km from the nearest road and 85% werewithin a distance of 500 m.
Land cover showed a strong influence on fire ignitions,and other authors also found this variable to be important(e.g. Cardille and Ventura 2001; Vasconcelos et al. 2001; Yanget al. 2007). Most ignitions were located in agricultural andurban–rural interspersed areas (85%), and only 15% occurredin forested or uncultivated areas, although they cover 50% of thecountry. Our results indicate that agriculture is a very importantfactor influencing fire starts and are in accordance with previousinvestigations of fire causes in Portugal and Spain, which con-cluded that a large proportion of wildfires (both in terms of num-ber and of resulting area burned) is due to agricultural activitiesand mainly to agricultural burns (DGF 2003; MMA 2007). Alsocontributing to this high ignition incidence is probably the factthat more people are usually present in these areas, and that theherbaceous vegetation in many Mediterranean agricultural areasis easier to ignite and propagate fires in than other fuel types,especially during the summer when fuel moisture is very low.The high incidence of ignitions in urban–rural areas may alsobe explained by the co-occurrence of agricultural activities anda higher human presence. Forests, shrublands and sparsely veg-etated areas also showed a positive influence on ignition occur-rence, but their influence was considerably lower. The ignitionfrequency of these land cover classes was approximately three

PROOF ONLY
Modeling fire ignition risk in Portugal Int. J. Wildland Fire 9
times lower than would be expected in a random distribution.Although small differences exist between forests, shrublandsand sparsely vegetated areas, we can rank land cover classes interms of the relative probability of ignition occurrence in thefollowing way: urban–rural > agriculture > shrubs > sparselyvegetated > forests > wetlands. Cardille andVentura (2001) alsofound that fires in the NW USA were more likely to start innon-forest than within forests, independently of the resultingfire size, and other authors reported that an important propor-tion of wildfires in southern Europe start in non-forested areas(Badia-Perpinyã and Pallares-Barbera 2006; EC 2007). How-ever, these patterns can be completely distinct in regions withdifferent characteristics (Yang et al. 2007).
Elevation was found to have a positive influence on igni-tion distribution. This effect may be due to the fact that thereare some human activities at higher altitudes, such as the ren-ovation of pastures for livestock, which are known to causefrequent burns in the Iberian Peninsula, and to be one of themajor factors contributing to the total area burned (DGF 2003;MMA 2007). For example Badia-Perpinyã and Pallares-Barbera(2006) also found a higher ignition frequency at higher eleva-tion in a rural area of NE Spain. Additionally, and according tosome authors, lightning-caused ignitions are also more likely tooccur at higher elevations (Vazquez and Moreno 1998; Kilincand Beringer 2007).
Predictive ability of the modelThe model obtained using four variables showed good predic-tive ability when applied to the validation dataset. Analysis ofthe ROC curve indicates 87.2% concordance between predictedprobabilities and observed outcomes, while with the confusionmatrix method, we achieved a global accuracy of 80.3%.
Although this model was developed at a national level, andthus with large human and natural variability, the results werequite good when compared with other logistic regression modelsdeveloped to predict fire occurrence. For example, Vasconceloset al. (2001) modelled the spatial occurrence of fire ignitionsin five Portuguese municipalities (∼1.6% of the country area),obtaining a global accuracy of 73.9% (omission and commissionerrors were respectively 22.1 and 48.6%). Chuvieco et al. (1998,2003) developed models to predict the occurrence of large firesin southern Europe, obtaining a global accuracy of 60.0% (omis-sion and commission errors for observed fires were respectively37.5 and 51.7%). In another study, Vega-Garcia et al. (1995)also used logistic regression to predict the daily occurrence offires in Alberta (Canada), obtaining a global accuracy of 74.1%;these authors obtained an omission error of 25.9% for fire-daysand a very high commission error (95.1%). Although only thefirst of the models referred to is completely comparable with theone developed in the present work, these can give an idea of theaccuracy levels achieved in modeling fire occurrence.
A simpler model, using only three variables, was also devel-oped. In this model, the land cover variable was not included,as it is more complex to compute, and because this variable isexpected to suffer more changes in the short to medium term. Asexpected, its global accuracy was lower than in the more com-plex model (77.1 and 80.3%, respectively), but the differencesconcerning both global accuracy and omission or commission
errors were not sufficiently important to discourage its use as analternative solution.
Additionally, it was confirmed that models built for differentyears had a very similar performance, which seems to indicatethat little spatial variability is to be expected in a 5-year period,and that models developed using information from 1 or moreyears are expected to achieve similar results. The final equationexpressing D as a function of the explanatory variables has twodifferent components: a geographical component expressed byP1, and a coefficient, representing the maximum local densityof ignitions, estimated at 166.23 ignitions per 100 km2 per yearfor the period 2001–05, but that can vary yearly in accordancewith varying weather and social behavior.
Implications for managementWhen using the model or the map produced, the following issuesshould be kept in mind, particularly in terms of fire preventionand definition of priorities for firefighting:
(1) Special attention should be given to large forested areaswith high or very high risk, where ignitions can easilyoccur and produce large forest fires. However, areas withlow or medium ignition risk can also be very susceptible towildfires because of high biomass accumulation. Previousanalysis (e.g. Rego et al. 2004) showed that the areas of thecountry with the highest density of ignitions do not coincidewith those where larger fires occur. The increasing humanmigratory fluxes from inland to coastal areas have led toa situation of land abandonment, contributing to reducingthe risk of fire ignition in many inland regions. However,this situation simultaneously increased fuel accumulationand consequently increased fire hazard. At the same time,many of these areas have a low population density and aremore distant from roads, being less accessible to firefight-ers. Thus, these areas should be analyzed in fire planningand surveillance operations by simultaneously evaluatingthe fire hazard.
(2) Attention should also be given to non-forested areas witha higher ignition risk, especially when they are near poten-tially hazardous areas that are important to preserve (owingto their social, economical or ecological interest). Nowa-days, in several southern European countries (e.g. Portugal,Spain, Greece), a large proportion of both number of firesand area burned is not restricted to forested land (Morenoet al. 1998; EC 2007; MMA 2007), and many fires startingin agricultural areas or shrublands can rapidly spread andpropagate into forest stands or to other areas with a higherfire hazard (DGF 2003).
(3) Because of the strong positive influence of population den-sity on fire ignition risk, it can be seen that the areascorresponding to the centre of the larger cities (namelyLisboa and Porto) have been classified with a high riskof ignition, although we know that in fact very few igni-tions occur in these highly urbanized areas because theyhave almost no fuels to ignite . However, this kind of prob-lem will obviously be eliminated if the fire ignition map isused in association with a fire hazard map (or alternatively,by overlaying it with a fuel load or fuel models map andreclassifying the areas without vegetation).

PROOF ONLY
10 Int. J. Wildland Fire F. X. Catry et al.
(4) To use the information presented at the regional level, modeladjustments, including updated and more detailed data or theinclusion of other variables, can be required to improve theaccuracy of predictions. Variables could include, for exam-ple, summer population density in regions where tourismhighly increases the population during the fire season, ashappens in Algarve (southern Portugal), or cattle density inareas where pastoralism is an important activity.
In this work, we demonstrated the feasibility of modeling andmapping ignition risk at a national level using a limited numberof easily obtainable variables. We consider that both the modelsdeveloped and the ignition risk map produced have enough pre-dictive accuracy to be used in predicting the likelihood of ignitionoccurrence in Portugal. Nowadays, many fire-management deci-sions are still exclusively based on the factors influencing firespread and suppression difficulty. However, and as resources arelimited, it is important to define priorities among areas. Undersimilar fuel, topographic or weather conditions, the areas withhigher ignition risk should be given priority for surveillance(Vasconcelos et al. 2001; Chuvieco et al. 2003). The obtainedmodels and the ignition risk map are now available and can beeasily used in a GIS environment to integrate fire danger estima-tion systems, helping managers to define vigilance priority areasfor ground patrol units, or to define priority locations for newlookout tower installation (Catry et al. 2004; Rego and Catry2006; Catry et al. 2007b). These results can also be used formore informed decisions of firefighting resources allocation, orto optimize fire prevention public campaigns, by indicating themost problematic areas.
In spite of good results obtained, the prediction model canprobably be improved by including more accurate and updatedinformation, or by including some additional explanatory vari-ables. It would be very useful if the national authorities couldimprove the ignition location accuracy, especially if the objec-tives are to model this event at the local or municipal level. Weexpect that this study, the first performed in Portugal at a nationallevel, will encourage further research needed on this topic, whichcould include for example analyzing the characteristics of igni-tions that resulted in large fires, or measures of temporal fireactivity, such as predictions of number of fires per day.Additionalresearch on spatial and temporal factor variability of differentcauses should also be useful.
AcknowledgementsWe acknowledge the Portuguese Forest Services (DGRF) for all collabora-tion and for making available the wildfire database. We acknowledge PaulaLopes, António Nunes and Vasco Nunes for their help on preliminary dataprocessing. We also acknowledge several important comments made by threeanonymous reviewers, which contributed to improve this paper. Part of thisstudy was supported by the European Commission under the 6th FrameworkProgram through the Integrated Project ‘Fire Paradox’ (contract no. FP6–018505), and by Instituto de Financiamento da Agricultura e Pescas throughthe project ‘Recuperação de Áreas Ardidas’.
ReferencesAmatulli G, Pérez-Cabello F, de la Riva J (2007) Mapping lightning/human-
caused wildfire occurrence under ignition point location uncertainly.Ecological Modelling 200, 321–333. doi:10.1016/J.ECOLMODEL.2006.08.001
Badia-Perpinyã A, Pallares-Barbera M (2006) Spatial distribution ofignitions in Mediterranean periurban and rural areas: the case ofCatalonia. International Journal of Wildland Fire 15, 187–196.doi:10.1071/WF04008
Bonazountas M, Kallidromitou D, Kassomenos PA, Passas N (2005) Forestfire risk analysis. Human and Ecological Risk Assessment 11, 617–626.doi:10.1080/10807030590949717
Cardille JA, Ventura SJ (2001) Occurrence of wildfire in the northern GreatLakes Region: effects of land cover and land ownership assessed atmultiple scales. International Journal of Wildland Fire 10(2), 145–154.doi:10.1071/WF01010
Cardille JA, Ventura SJ, Turner MG (2001) Environmental and socialfactors influencing wildfires in the Upper Midwest, USA. Ecolog-ical Applications 11(1), 111–127. doi:10.1890/1051-0761(2001)011[0111:EASFIW]2.0.CO;2
Carreiras JMB, Pereira JMC (2006) An inductive fire risk map for Por-tugal. In ‘Proceedings of the 5th International Conference on ForestFire Research’, 27–30 November 2006, Figueira da Foz, Portugal.(Ed. DX Viegas) (CD ROM) (Associação para o Desenvolvimento daAerodinâmica Industrial (ADAI): Coimbra, Portugal)
Catry FX, Almeida RM, Rego FC (2004) Produção de cartografia de visi-bilidades para Portugal continental. A importância da sua utilização navigilância contra incêndios florestais. Silva Lusitana 12(2), 227–241. [InPortuguese]
Catry FX, Damasceno P, Silva JS, Galante M, Moreira F (2007a) Spatialdistribution patterns of wildfire ignitions in Portugal. In ‘Proceedingsof the 4th International Wildland Fire Conference[AQ1]’, 13–17 May2007, Seville, Spain. (CD ROM)
Catry FX, Rego FC, Santos T, Almeida J, Relvas P (2007b) Forest firesprevention in Portugal – using GIS to help improving early fire detec-tion effectiveness. In ‘Proceedings of the 4th International Wildland FireConference’, 13–17 May 2007, Seville, Spain. (CD ROM)
Chou YH (1992) Management of wildfires with a geographical informationsystem. International Journal of Geographical Information Systems 6,123–140. doi:10.1080/02693799208901900
Chuvieco E, Salas J, Barredo JI, Carvacho L, Karteris M, Koutsias N(1998) Global patterns of large fire occurrence in the European Mediter-ranean Basin: a GIS analysis. In ‘Proceedings of the 3rd InternationalConference on Forest Fire Research – 14th Conference on Forest FireMeteorology. Vol II’. (Ed. DX Viegas) pp. 2447–2462. (Associaçãopara o Desenvolvimento da Aerodinâmica Industrial (ADAI): Coimbra,Portugal)
Chuvieco E, Allgöwer B, Salas J (2003) Integration of physical and humanfactors in fire danger assessment. In ‘Wildland Fire Danger Estimationand Mapping. The Role of Remote Sensing Data’. (Ed. E Chuvieco)Vol. 4, pp. 197–218. (World Scientific Publishing: Singapore)
Congalton R (1991) A review of assessing the accuracy of classificationsof remotely sensed data. Remote Sensing of Environment 37, 35–46.doi:10.1016/0034-4257(91)90048-B
DGF (2001) ‘Inventário florestal nacional. Portugal continental. 3a Revisão,1995–1998.’ (Direcção-Geral das Florestas: Lisbon) [In Portuguese]
DGF (2003) Determinação das causas dos incêndios florestais em2002. Direcção-Geral das Florestas Report. (Lisbon, Portugal) [InPortuguese]
DGRF (2006) Incêndios florestais – Relatório de 2005. Divisão de Defesada Floresta Contra Incêndios. Direcção-Geral dos Recursos FlorestaisReport. (Lisbon, Portugal) [In Portuguese]
EC (2007) Forest fires in Europe 2006. Official Publication of the EuropeanCommission, EUR 22931 EN. (Ispra, Italy)
ESRI (2005) ‘ArcGIS 9.1. Software.’ (Environmental Systems ResearchInstitute: Redlands, CA)
FAO (1986) Wildland fire management terminology. Food and AgricultureOrganization of the United Nations, FAO Forestry Paper 70. (Rome,Italy)

PROOF ONLY
Modeling fire ignition risk in Portugal Int. J. Wildland Fire 11
Finney MA (2005) The challenge of quantitative risk analysis forwildland fire. Forest Ecology and Management 211, 97–108.doi:10.1016/J.FORECO.2005.02.010
Genton MG, Butry DT, Gumpertz ML, Prestemon JP (2006) Spatio-temporalanalysis of wildfire ignitions in the St Johns River Water Manage-ment District, Florida. International Journal of Wildland Fire 15, 87–97.doi:10.1071/WF04034
Hosmer DW, Lemeshow S (1989) ‘Applied Logistic Regression.’(JohnWileyand Sons: New York)
IA (2003) Atlas do Ambiente Digital. Instituto do Ambiente. Available atwww.iambiente.pt/atlas/est/index.jsp [Verified 2 March 2007]
IA (2005) CORINE Land Cover 2000 Portugal. Instituto do Ambiente.(Lisbon, Portugal)
IGEOE (2005) Carta Militar Itinerária de Portugal. Instituto Geográfico doExército. Available at www.igeoe.pt [Verified 2 March 2007]
IGP (2004a) Cartografia de risco de incêndio florestal. Relatório do distritode Viseu. Centro para a Exploração e Gestão de Informação e Situaçõesde Emergência, IGPTechnical Report. (Lisbon, Portugal) [In Portuguese]
IGP (2004b) Carta administrativa oficial de Portugal. Instituto GeográficoPortuguês. Available at www.igeo.pt/igeo/portugues/Frameset-egeo.htm[Verified 2 March 2007]
INE (2003) Dados estatísticos da população em Portugal – Censos 2001.Instituto Nacional de Estatística. (Lisbon, Portugal) [Database in Por-tuguese]
Johnson EA, Miyanishi K (2001) ‘Forest Fires: Behavior and EcologicalEffects.’ (Academic Press: San Diego, CA)
Koutsias N, Kalabokidis KD, Allgöwer B (2004) Fire occurrence patternsat landscape level: beyond positional accuracy of ignition points withkernel density estimation methods. Natural Resource Modeling 17(4),359–375.
Kilinc M, Beringer J (2007) The spatial and temporal distribution of light-ning strikes and their relationship. Journal of Climate 20(7), 1161–1173.doi:10.1175/JCLI4039.1
Legendre P, Legendre L (1998) ‘Numerical Ecology.’ 2nd English edn(Elsevier Science BV: Amsterdam)
LobodaTV, Csiszar IA (2007)Assessing the risk of ignition in the Russian FarEast within a modelling framework of fire threat. EcologicalApplications17(3), 791–805. doi:10.1890/05-1476
Manel S, Williams H, Ormerod SJ (2001) Evaluating presence–absencemodels in ecology: the need to account for prevalence. Journal ofAppliedEcology 38, 921–931. doi:10.1046/J.1365-2664.2001.00647.X
Mercer DE, Prestemon JP (2005) Comparing production function modelsfor wildfire risk analysis in the wildland–urban interface. Forest Policyand Economics 7, 782–795. doi:10.1016/J.FORPOL.2005.03.003
MMA (2007) Los incendios forestales en España. Decenio 1996–2005.Areade Defensa Contra Incendios Forestales, Ministerio de Medio Ambiente.(Madrid, Spain)
Moreno JM, Vázquez A, Vélez R (1998) Recent history of forest fires inSpain. In ‘Large Forest Fires’. (Ed. JM Moreno) pp. 159–186. (BackhuysPublishers: Leiden, the Netherlands)
NASA, NIMA, DLR,ASI (2004) Digital elevation model. NationalAeronau-tics and Space Administration; National Imagery and Mapping Agency;German space agency (DLR); Italian space agency (ASI). Available atftp://edcsgs9.cr.usgs.gov/pub/data/srtm [Verified 8 August 2006]
NWCG (2006) Glossary of wildland fire terminology. National WildfireCoordinating Group, PMS 205 (Boise, ID)
Norusis MJ (2002) ‘SPSS for Windows – Base System User’s Guide.’ (SPSSInc.: Chicago, IL)
Nunes A, Duarte J (2006) Assessment of forest fire risk in the Serra daEstrela Natural Park (Portugal): methodological application and vali-dation. In ‘Proceedings of the 5th International Conference on ForestFire Research’, 27–30 November 2006, Figueira da Foz, Portugal.
http://www.publish.csiro.au/journals/ijwf
(Ed. DX Viegas) (CD ROM) (Associação para o Desenvolvimento daAerodinâmica Industrial (ADAI): Coimbra, Portugal)
Pearce J, Ferrier S (2000) Evaluating the predictive performance of habitatmodels developed using logistic regression. Ecological Modelling 133,225–245. doi:10.1016/S0304-3800(00)00322-7
Preisler HK, Brillinger DR, Burgan RE, Benoir JW (2004) Probability-basedmodels for estimation of wildfire risk. International Journal of WildlandFire 13, 133–142. doi:10.1071/WF02061
Rego FC, Catry FX (2006) Modelling the effects of distance on the proba-bility of fire detection from lookouts. International Journal of WildlandFire 15, 197–202. doi:10.1071/WF04016
Rego FC, Catry FX, Maia MJ, Santos TA, Gravato A, Castro IC, MoreiraFO, Pinto PR, Almeida J (2004) Análise da rede nacional de postos devigia em Portugal. Centro de Ecologia Aplicada Prof. Baeta Neves –Instituto de Novas Tecnologias, Technical Report (Lisbon, Portugal) [InPortuguese]
Robin JG, Carrega P, Fox D (2006) Modelling fire ignition in the Alpes-Maritimes Department, France, a comparison. In ‘Proceedings of the5th International Conference on Forest Fire Research’, 27–30 November2006, Figueira da Foz, Portugal. (Ed. DX Viegas) (CD ROM) (Asso-ciação para o Desenvolvimento da Aerodinâmica Industrial (ADAI):Coimbra, Portugal)
Roloff GJ, Mealey SP, Clay C, Barry J, Yanish C, Neuenschwander L(2005) A process for modelling short- and long-term risk in the south-ern Oregon Cascades. Forest Ecology and Management 211, 166–190.doi:10.1016/J.FORECO.2005.02.006
Romero-Calcerrada R, Novillo CJ, Millington JDA, Gomez-Jimenez I(2008) GIS analysis of spatial patterns of human-caused wildfire igni-tion risk in the SW of Madrid (Central Spain). Landscape Ecology 23,341–354. doi:10.1007/S10980-008-9190-2
Rorig ML, Ferguson SA (1999) Characteristics of lightning and wildlandfire ignition in the Pacific North-west. Journal of Applied Meteorology38, 1565–1575. doi:10.1175/1520-0450(1999)038<1565:COLAWF>
2.0.CO;2Sokal RR, Rohlg FJ (1987) ‘Biometry.’ (WH Freeman and Company:
New York)SPSS (2006) ‘SPSS for Windows.’ (SPSS Inc.: Chicago, IL)Swets JA (1988) Measuring the accuracy of diagnostic systems. Science 240,
1285–1293. doi:10.1126/SCIENCE.3287615Vasconcelos MJP, Silva S, Tomé M, Alvim M, Pereira JMC (2001) Spatial
prediction of fire ignition probabilities: comparing logistic regressionand neural networks. Photogrammetric Engineering and Remote Sensing67(1), 73–81.
Vasilakos C, Kalabokidis K, Hatzopoulos J, Kallos G, Matsinos Y (2007)Integrating new methods and tools in fire danger rating. InternationalJournal of Wildland Fire 16(3), 306–316. doi:10.1071/WF05091
Vazquez A, Moreno JM (1998) Patterns of lightning- and human-causedfires in peninsular Spain. International Journal of Wildland Fire 8(2),103–115. doi:10.1071/WF9980103
Vega-Garcia C, Woodard PM, Titus SJ, Adamowicz WL, Lee BS (1995)A logit model for predicting the daily occurrence of human-causedforest fires. International Journal of Wildland Fire 5(2), 101–111.doi:10.1071/WF9950101
Vega-Garcia C, Lee BS, Woodard PM, Titus SJ (1996) Applying neural net-work technology to human-caused wildfire occurrence prediction. AIApplications 10(3), 9–18.
Yang J, Healy HS, Shifley SR, Gustafson EJ (2007) Spatial patterns ofmodern period human-caused fire occurrence in the Missouri OzarkHighlands. Forest Science 53(1), 1–15.
Manuscript received 25 August 2007, accepted 30 January 2009

PROOF ONLY
AUTHOR QUERIES
AQ1 Au: please provide publisher for this and Catry et al. 2007bAQ2 Instruction for typesetters: kilometers needs changing to kmAQ3 Instruction for typesetters: units need the forward slash removed and the space before > removedAQ4 Instruction for typesetters: Km should be kmAQ5 Instruction for typesetters: forward slash need removing and the units need correct spacingAQ6 Au: is this a reference citation? If so please provide a reference. Otherwise some further explanation would be helpful.
Recommended