Course book of
(The Principles of)
Microeconomics

For more details:
Ron Pirayoff; Economics Micro & Macro , Wiley
New York, 2004
P.Vihar; Introductory Microeconomics, CBSE, Delhi, 2008
H.R.Varian; Intermediate Microeconomics, New York , 2010
S.Rode; Modern Microeconomics, Ventus, Delhi, 2013
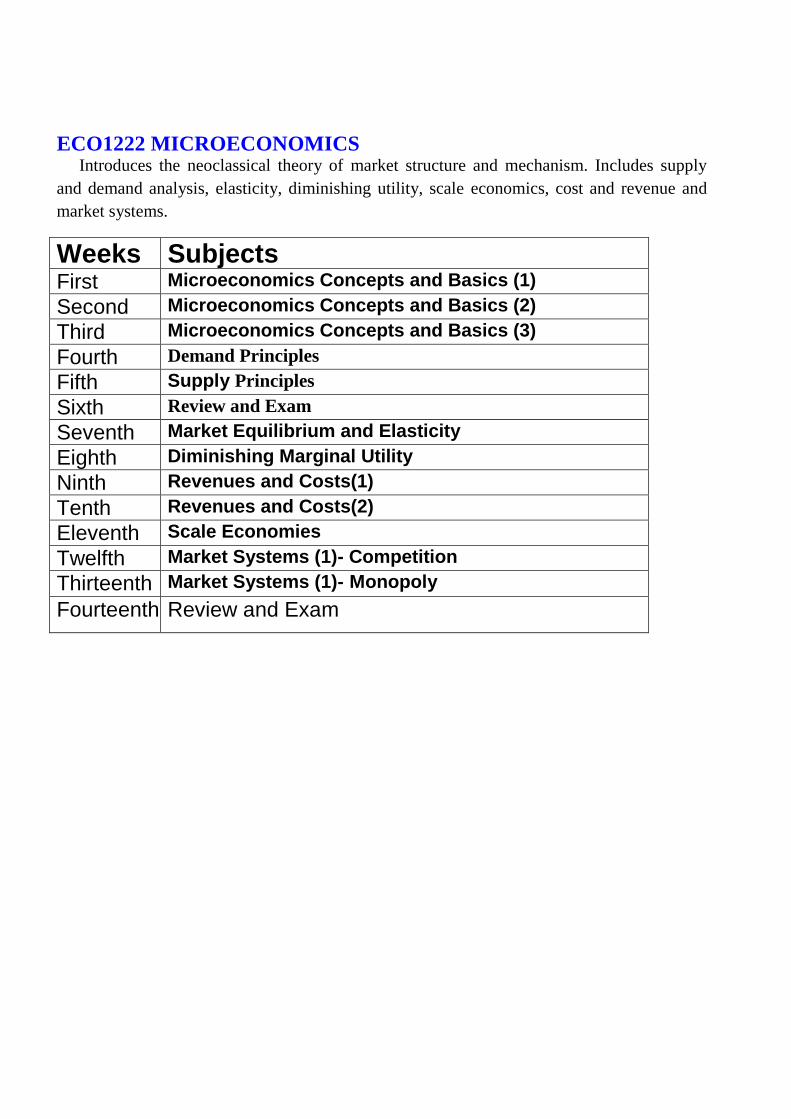
ECO1222 MICROECONOMICS Introduces the neoclassical theory of market structure and mechanism. Includes supply
and demand analysis, elasticity, diminishing utility, scale economics, cost and revenue and
market systems.
Weeks Subjects First Microeconomics Concepts and Basics (1)
Second Microeconomics Concepts and Basics (2)
Third Microeconomics Concepts and Basics (3)
Fourth Demand Principles
Fifth Supply Principles
Sixth Review and Exam
Seventh Market Equilibrium and Elasticity
Eighth Diminishing Marginal Utility
Ninth Revenues and Costs(1)
Tenth Revenues and Costs(2)
Eleventh Scale Economies
Twelfth Market Systems (1)- Competition
Thirteenth Market Systems (1)- Monopoly
Fourteenth Review and Exam

ONE-Microeconomics Concepts
Economics Scarcity: The Nature of Economics Systems Opportunity Costs and Production Possibilities The Functions of any Economic System The Nature and Functions of Product Markets Supply and Demand Models of Consumer Choice Firm Production, Costs, Revenues Product Pricing and Outputs within Different Market Structures Efficiency and Government policy toward imperfect Competition Factor Markets Derived Factor Demand Determination of Wages and Other Factor Prices Efficiency, Equity and the Role of the Government Externalities Public Goods Supply, Demand, Price Determination Price Indexes Efficiency. Opportunity cost Marginal changes Market economy. Market power Productivity Inflation

Basics Economics is a social science involving the study of choices and what necessitates those choices.
Macroeconomics is the branch of economics that examines the behaviour of the whole economy at
once. Microeconomics is the branch of economics that examines the choices and interactions of
individuals producing and consuming one product, in one firm or industry. When making a choice,
you automatically have created a cost and a benefit. The cost is what has been relinquished, and the
benefit is what has been gained. The term opportunity cost refers to the next best alternative. For
example, if you have $500 and you go to the mall and see a stereo, a jacket, and a television each
costing $500, which would you choose? If you rank the stereo as your first choice, the jacket as your
second, and the TV as your third choice, which would be the opportunity cost? The jacket is the
opportunity cost because it is your next best alternative. Note that the jacket and T.V. together are not
the opportunity cost because there can only be one opportunity cost. All participants in an economy
must make choices. The basic economic problem that necessitates choices is scarcity, which occurs
when limited resources are not sufficient to meet demand. Scarcity forces individuals, firms, and
other members of society to decide how to use the three factors of production: land, labour, and
capital. Land represents natural resources, such as oil and coal. Labour represents human resources,
like manual work. And capital represents anything that can help produce these resources, such as
education and machines. If a farmer has ten acres of land, she must decide how to use those ten acres.
If a factory owner has three workers, then she must decide how to use her workers. If you have a
hundred dollars in your pocket, you have to decide how to use these resources
Some people confuse capital with money. In economics, capital is an economic resource, and
money is a medium of exchange. What allows countries to produce more in the long run is an
increase in their factors of production, not necessarily an increase in money. Increasing the factors of
production allows a country to expand its production possibilities, which then allows that country’s
economy to grow for its population. It is important to note that a country can’t afford to with their
goods and services—they must continually grow to meet the demands of the population. In
economics there is no such thing as stagnant. Wants and needs are always growing; therefore, if an
economy is not expanding then it is contracting.
Product and Factor Markets Goods and services must be allocated between firms and households. When you go to the grocery
store to buy your favourite cereal, you are part of a product market. In a product market, the
monetary flow goes from households to firms, and the physical flow of goods and services goes from
firms to households. In a factor market, the monetary flow goes from firms to households and, in
exchange, the households give the firms the physical flow of goods and services. Labour is an
example of a factor market because the physical flow (labour) is being given to the firms and the
firms give the monetary flow (wages) to the households. This circular flow of goods, services, and
money can be seen
Labour is an example of a factor market because the physical flow (labour) is being given to the
firms and the firms give the monetary flow (wages) to the households. This circular flow of goods,
services, and money can be seen in a simple chart (circular)

Opportunity Cost and Production Possibilities By making the decision to take the exam in economics, you have decided to allocate time to
studying. When you are studying for this exam, you are making a choice and thereby creating a
benefit and an opportunity cost. The benefit is being better prepared for the exam, and the
opportunity cost is your next best alternative (sleeping or eating, for example).
Remember that the opportunity cost is the value of the next best alternative that is being given up.
In economics, countries, firms, and individuals have to make choices as to how to allocate (use)
resources. Suppose a country has to make a decision on how to use steel. Its two choices are
automobiles and chairs. When the country makes chairs, it cannot use the same resources to make
autos. The choices an economy faces and the opportunity cost of making one good rather than
another can be illustrated using a production possibilities frontier (PPF)..
The curve, or frontier, symbolizes efficiency, and it represents all of the possible combinations of
autos and chairs that could be produced using the country’s available steel. Anything that appears
outside the production possibilities curve is considered to be unattainable unless the economy has
additional resources.

CETERIS PARIBUS
Economists use the term ceteris paribus to signify that all the relevant variables, except those being studied at that moment, are held constant. The Latin phrase literally means “other things being equal.” The demand curve slopes downward because, ceteris paribus, lower prices mean a greater quantity demanded. Although the term ceteris paribus refers to a hypothetical situation in which some variables are assumed to be constant, in the real world many things change at the same time. For this reason, when we use the tools of supply and demand to analyze events or policies, it is important to keep in mind what is being held constant and what is not.
Review Questions Which one of the following is a factor of production?
A. Money
B. Government
C. Land
D. Checkable deposits
E. None of the above
2. What is opportunity cost?
A. The value of your choice
B. The dollar value of all your choices combined
C. The dollar and non-dollar value of all your choices
D. The value of your next best alternative
E. The value of all your alternatives
3. Which of the following inputs would a machine belong to?
A. Land
B. Labour
C. Capital
D. Money
E. All other above
4. What is the basic economic problem?
A. Scarcity is a result of limited wants and unlimited resources.
B. Scarcity results from the fact that prices are too high.
C. Scarcity exists because there aren’t enough people in the world.
D. Scarcity results from the fact that if prices are too high people want less.
E. Scarcity is caused by unlimited wants and limited resources
5. Which of the following best describes the circular flow of economic activity?
A. Firms earn money in exchange for goods and services in a factor market.
B. Firms and households both lose money in a factor market.
C. Households earn money in exchange for labour in a factor market.
D. Households earn money in exchange for labour in a product market.
E. None of the above.
6. What does every choice create?
A. More choices
B. An opportunity cost only
C. An opportunity benefit only
D. An opportunity cost and benefit

E. A monetary cost
7. Which one of the following is a factor of production?
A. Money
B. Revenue
C. Profit
D. Labour
E. Taxes
8. Which one of the following is considered the regulating force of the market system?
A. Government
B. Government and firms
C. Firms and taxes
D. Suppliers and consumers
E. All of the above
Answers to Review Questions
1. C. Land is a factor of production. Money is a medium of exchange, not a resource.
2. D. Opportunity cost is the value, both monetary and non-monetary, of your next best alternative.
There can be only one opportunity costs
3. C. Machines are used to produce other goods and services; therefore, they are considered capital.
There are two forms of capital: human and physical. Education is human capital, whereas machines
are considered physical capital.
4. E. Scarcity is caused by unlimited wants and limited resources.
5. C. In a factor market, firms pay households for goods and services. In a product market,
households pay firms for goods and services.
6. D. Every choice automatically creates a cost and a benefit. Choices don’t necessarily create
monetary benefits or costs.
7. D. Labour is one of the factors of production. Workers, along with land and capital, help produce
goods and services.
8. C. In a command economy, the government decides what to produce, how to produce it, and for
whom to produce it.

TWO-Demand and Supply: Demand Principles and Demand In a market system, the three economic questions what, how, and for whom to produce are answered
by the forces of supply and demand. These forces depend on variables that shift consumer choices
and set suppliers’ prices. In a market, buyers and sellers exchange goods and services. Buyers
demand products, and suppliers provide the product.
■ Quantity supplied is the amount a supplier is willing and able to supply at a certain price.
■ Quantity demanded is the amount a consumer is willing and able to buy at a certain price.
The Law of Supply states that the higher the price, the greater the quantity produced. When prices
decrease, the quantity of that good is decreased. Think of the law of supply in terms of scales. In one
hand you have prices and in the other you have quantity supplied. As one hand rises or falls (prices),
the other hand follows (quantity supplied).
The Law of Demand states that as prices rise, quantity demanded decreases. As prices decrease,
quantity demanded increases. There is an inverse relationship between prices and quantity demanded.
You can think of the law of demand in terms of a seesaw. As one side rises (prices), the other side
falls (quantity demanded).
The demand curve is downwardly or inversely sloped because more people are willing to buy at a
lower price or fewer people are willing to buy at a higher price. The concept of diminishing
marginal utility also contributes to the downward slope of the demand curve , that is along with
each additional unit consumed
The difference between quantity demanded and demand: Quantity demanded is the amount
consumers are willing and able to buy at a specific price. A change in price will affect quantity
demanded, whereas a change in one of the following determinants of demand will change demand.
The Seven Determinants of Demand The determinants of demand are factors that change demand. We already know that quantity
demanded is changed or influenced by price. Demand, on the other hand, is changed by these seven
factors: price of the demanded good or service, tastes or preferences, income, the substitution effect,
the price of complementary goods, population, and consumer expectations.
1.Price of the demanded good or service Because the quantity demanded falls as the price rises and rises as the price falls, we say that the quantity demanded is negatively related to the price. This relationship between price and quantity demanded is true for most goods in the economy and, in fact, is so pervasive that economists call it the law of demand: Other things equal, when the price of a good rises, the quantity demanded of the good falls.
2.Taste or Preference When one decides to go to the mall and buy a t-shirt he or she can find it a proper product to his or
her taste or preference and not to take advantage of the decrease in price.
3. Income The income effect changes demand by allowing consumers to purchase goods they wouldn’t
normally purchase due to a lack of affordability.
When looking at, income, we must consider the two types of goods:
■ Normal good—Any good that consumers purchase more of as their incomes increase. Examples:
luxury cars .
■ Inferior good—Any good that consumers purchase less of as their income increases. Examples:
canned food.
4.The Substitution Effect The substitution effect occurs because the price of the desired item is too expensive, so consumers
find a close alternative to the initial item.

5.The Price of Complementary Goods Complementary goods are goods that are used with each other , as gasoline and cars. If the price
of one good rises, then the demand for the complementary good will fall.
6. Population If an increase of immigration were to occur in a country, then the demand for any good or service
would increase.
7. Consumer Expectations If the price for a good is expected to rise in the near future, then the demand for that good will
increase now.
Review Questions 1. Which one of the following is not a determinant of demand?
A. Taste or preference
B. Income
C. Expenditures
D. Consumer expectations
E. Population
2. When demand increases, what happens to a demand curve?
A. It shifts left.
B. It shifts right.
C. No movement occurs.
D. The quantity does not change.
E. It becomes positively sloped.
3. What would happen to the demand curve for cars if the price of gasoline tripled?
A. It would shift to the right because of income.
B. It would shift to the right because of population.
C. It would shift to the left because of price of the complementary good.
D. It would shift to the left because of the price of the substitute.
E. Both A and D are correct.
Answers to Review Questions
1. C. Expenditures is not a determinant of demand.
2. B. A graphical increase in demand is illustrated by a shift in all quantities and prices to the right.
3. C. A shift to the left in the demand curve would occur because the price of the complementary
good would be increasing. Anytime the price of a complementary item increases, the demand curve
for the complementary item will shift to the left.
THREE-Supply Principles The market supply is the sum of all individual suppliers. Much like a demand schedule, a supply
schedule has both the market supply and the individual firm’s quantity supplied total.
In supply, a positive relationship exists between price and quantity supplied. Different from the
demand curve, the supply curve is positively sloped. The curve rises from left to right because of the
positive relationship between price and quantity supplied.
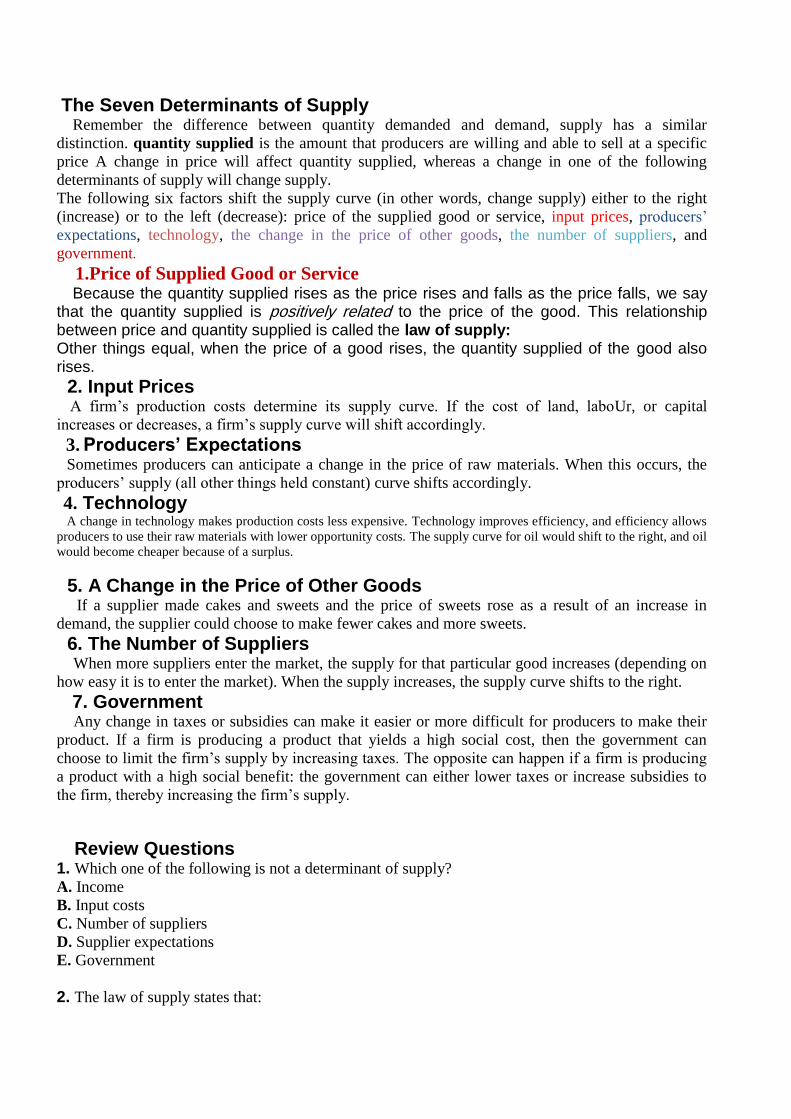
The Seven Determinants of Supply Remember the difference between quantity demanded and demand, supply has a similar
distinction. quantity supplied is the amount that producers are willing and able to sell at a specific
price A change in price will affect quantity supplied, whereas a change in one of the following
determinants of supply will change supply.
The following six factors shift the supply curve (in other words, change supply) either to the right
(increase) or to the left (decrease): price of the supplied good or service, input prices, producers’
expectations, technology, the change in the price of other goods, the number of suppliers, and
government.
1.Price of Supplied Good or Service Because the quantity supplied rises as the price rises and falls as the price falls, we say that the quantity supplied is positively related to the price of the good. This relationship between price and quantity supplied is called the law of supply: Other things equal, when the price of a good rises, the quantity supplied of the good also rises.
2. Input Prices A firm’s production costs determine its supply curve. If the cost of land, laboUr, or capital
increases or decreases, a firm’s supply curve will shift accordingly.
3. Producers’ Expectations Sometimes producers can anticipate a change in the price of raw materials. When this occurs, the
producers’ supply (all other things held constant) curve shifts accordingly.
4. Technology A change in technology makes production costs less expensive. Technology improves efficiency, and efficiency allows
producers to use their raw materials with lower opportunity costs. The supply curve for oil would shift to the right, and oil
would become cheaper because of a surplus.
5. A Change in the Price of Other Goods If a supplier made cakes and sweets and the price of sweets rose as a result of an increase in
demand, the supplier could choose to make fewer cakes and more sweets.
6. The Number of Suppliers When more suppliers enter the market, the supply for that particular good increases (depending on
how easy it is to enter the market). When the supply increases, the supply curve shifts to the right.
7. Government Any change in taxes or subsidies can make it easier or more difficult for producers to make their
product. If a firm is producing a product that yields a high social cost, then the government can
choose to limit the firm’s supply by increasing taxes. The opposite can happen if a firm is producing
a product with a high social benefit: the government can either lower taxes or increase subsidies to
the firm, thereby increasing the firm’s supply.
Review Questions 1. Which one of the following is not a determinant of supply?
A. Income
B. Input costs
C. Number of suppliers
D. Supplier expectations
E. Government
2. The law of supply states that:

A. As prices rise, so does demand.
B. As prices rise, supply falls.
C. Supply increases as demand increases.
D. As prices rise, quantity supplied rises.
E. Prices have nothing to do with supply
3. On a supply curve, prices and quantity are:
A. Inversely related
B. Not related
C. Not shown
D. Positively related
E. Independent variables
Answers to Review Questions
1. A. Income is not a factor that determines supply. Income is a term used for consumers, not
producers.
2. D. The law of supply states that as prices rise, the quantity supplied rises. When producers raise
their prices, they can afford to increase their supply by paying more for their input costs, thereby
increasing their quantity of the product.
3. D. A positive relationship between prices and quantity means that as one rises, the other follows.
Producers increase supply by raising their price.

FOUR- Market Equilibrium and Elasticity The point at which supply and demand curves intersect is called market equilibrium. The word
equilibrium means balance, a point of harmony, where supply and demand meet. It is when the
quantity demanded equals the quantity supplied. Equilibrium prices are all around us. When you visit
a store, every price you see for a product is an equilibrium price. It is important to remember that
equilibrium prices are not fixed; they fluctuate with the forces of supply and demand. When there is
too much demand (shortage) or too much supply (surplus), we have what economists refer to as
disequilibrium.
When a producer finds itself in disequilibrium, it has two choices: either adjust the price to meet
demand, or adjust output to meet demand. If adjustments are not made in a timely manner, the firm
will no longer be able to produce enough revenue to cover its costs.
Elasticity Elasticity is a measure of how a price responds to a change in either supply or demand. Economists
use elasticity to gauge the effectiveness of a price change for a good or service. If the price of a good
or service does not change as a result of supply or demand, it is said to be inelastic.
The law of demand tells us that consumers will buy more of a product at a lower price and less of a
product at a higher price. Elasticity tells us just how much or more the consumer will buy at each
price level. This amount varies from product to product because people take different variables into
consideration when purchasing a good. Firms value elasticity because it tells them just how much of
an impact their price change will actually have.
The Price Elasticity of Demand

Price elasticity of demand indicates the responsiveness of the quantity demanded to
price changes. Here are the steps for calculating elasticity of demand:
1. Determine the percentage change in price and the percentage change in quantity demanded:
a. Original number – new number Original number
b. Multiply by 100
2. Calculate the elasticity:
a. Percentage change in quantity demanded
Percentage change in price
b. Multiply by 100
3. If the answer is 1 or greater, the good is elastic. If the answer is lower than 1, the
good is inelastic.
For example, suppose that a 10-percent increase normal good causes the amount demanded to fall by 20 percent. We calculate elasticity of demand as
The Price Elasticity of Supply Price elasticity also applies to supply. It measures the relative responsiveness to price
changes by producers. The formula for price elasticity of supply is similar to that of
demand, except you substitute the percentage change in demand for the percentage
change in supply.
The steps for calculating price elasticity of supply are:
1. Find the percentage change in price and quantity supplied:
a. Original number – New Number
Original Number
b. Multiply by 100
2. Calculate the elasticity:
a. Percentage change in quantity supplied Percentage change in price
b. Multiply by 100
3. If the answer is 1 or greater, the good is elastic in supply. If the answer is less than
1, the good is inelastic in supply.
Cross-Elasticity While price elasticises measure the quantity demanded or supplied , cross-elasticity
measures the consumer purchases in one product when there is a price change in
another product. The impact one product’s price makes on another product’s demand
is valuable information to a producer.
Cross-elasticity = Percentage change in Quantity demanded for good 1
Percentage change in price of product 2
Substitute goods: If in the previous equation we get a positive number, it is safe to
assume that the two goods are substitutes.
Complementary goods: If in the equation we get a negative number, it is safe to
assume that the two goods are complements.

Independent goods: If the answer to the equation is a zero or near zero answer, the
two goods are independent or unrelated.
The Income Elasticity of Demand This type of elasticity measures how or if a change in income produces a change in
consumption. When changes in income occur, consumers may or may not react with
an increase in consumption. Typically, consumers spend more as they make more;
however, how much more do they spend?
Income elasticity of demand = Percentage change in quantity demanded
Percentage change in income
Normal goods: When you have a positive relationship between an increase in income
and consumption (as one rises, the other rises), you have what is called a normal
good. A normal good is anything that increases in demand when income increases.
Typical normal goods are gourmet meals and luxury cars.
Inferior goods: A negative or inverse relationship (as one rises, the other falls)
between income and consumption designates an inferior good. Inferior goods are
products you buy less of when your income increases as bread
When a demand curve is perfectly vertical (on the price or income axis), the demand
for that good is inelastic. If the demand curve is horizontal (to the price or income
axis), then the product is elastic in demand. Review Questions 1. If price increased by 5 percent and quantity supplied increased by 7 percent:
A. Supply is elastic.
B. Demand is elastic.
C. Supply is inelastic.
D. Demand is inelastic.
E. Supply is unitary.
2. When income and consumption have a positive relationship, which of the following is true?
A. The good is inferior.
B. The good is normal.
C. The good is complementary.
D. The good is a substitute.
E. None of the above.
3. When cross-elasticity of demand is positive, what are the goods in question?
A. Substitutes
B. Rivals
C. Inferior
D. Negative
E. Complements
4. What happens to a product’s price if a close substitute is developed?
A. The price rises.
B. There is no change in price.
C. The price of the substitute product rises.
D. The price falls.
E. None of the above.
5. Which one of the following best illustrates a determinant of supply?

A. A new machine has been developed to increase the production of oil.
B. Firms profits increase by 25 percent.
C. Consumer spending falls by 50 percent.
D. Consumers prefer apples over oranges.
E. Average consumer income rises by 10 percent.
Answers to Review Questions 1. A. After taking the percentage change in supply and dividing it by the percentage change in price,
the answer 1.4 is elastic. Anything at or above 1.0 is elastic in demand.
2. B. Normal goods are consumed more when income rises. Inferior goods are goods that are
consumed less as income rises. The good isn’t a substitute because the demand for another product is
not being affected.
3. E. Cross-elasticity refers to the impact one good’s price has on another good’s demand. If the
cross-elasticity answer is a positive number, the goods are complements.
4. D. If a close substitute is developed for a product, the price of that product will fall because of an
increase in competition. An increase in competition will force the two producers to become more
efficient, and prices will fall.
5. A. Improvements in technology provide lower production costs for producers, thereby increasing
their supply. Technology is a determinant of supply.

FIVE- Diminishing Marginal Utility
Diminishing marginal utility describes the lessening of utility or satisfaction as each additional unit is
consumed.
Marginal utility is the change in total utility that occurs because one more unit of a good is
consumed:
Marginal utility= Change in total utility
Change in quantity
According to the law of diminishing marginal utility, the more units consumed, the less satisfaction
additional units
Consumer Surplus Consumer surplus is the difference between what a consumer is willing and able to pay for a
good or service and the market price for that good or service.
Review Questions 1. What is marginal utility?
A. The extra unit of production that results from added units of labor
B. The relationship between quantity supplied and prices
C. The concept that satisfaction rises as more goods are consumed
D. A term that explains the extra satisfaction gained by consuming one more unit
E. Both A and B
2. What is utility?
A. The usefulness of a product
B. The satisfaction a product brings to an individual
C. The time it takes to consume a product
D. The durability of a product
E. The price of a product
3.What impact will a surplus have on the quantity and price of goods?
A. Quantity will rise and price will rise
B. Quantity will fall and price will fall
C. Quantity will rise and price will fall
D. A surplus has no impact on quantity and price of a good
E. Surpluses will cause quantity and prices to act independent of each other
Answers to Review Questions 1. D. Marginal utility explains the extra satisfaction one derives from consuming an extra unit.
2. B. Utility is the satisfaction the unit brings to an individual. Again, it is not to be confused with
usefulness. A picture on the wall is not useful; however, it may bring plenty of satisfaction to
someone.
3. C. Surpluses are a rise in the inventories of goods. When this occurs, quantity rises and prices fall.
Prices act as an incentive for consumers.

SIX-Revenues and Costs
Revenue (or Return) for Firms Revenue is calculated by multiplying the price of a product by the number of units sold.
Marginal revenue, much like marginal cost, is the difference in revenue when producing one more
unit. The marginal revenue should rise as more units are produced.
A firm’s profit is determined by subtracting all costs (implicit and explicit) from revenue:
Profit = total revenue – total costduction Costs
Diminishing Marginal Returns The relationship between quantities of a variable resource and quantities of output is called the law of
diminishing marginal returns. According to this law, when successive equal amounts of a variable
resource are combined with a fixed amount of another resource, output will initially accelerate, then
decelerate, and eventually decline.
Implicit and Explicit Costs Explicit costs are monetary payments a firm makes for its costs. Labour, raw materials, rent, and
power are all explicit costs. Firms make these payments for resources owned by another person or
entity. Although explicit costs are used to determine a profit, they are not the only costs to be
considered.
Implicit costs are trade-offs and opportunity costs that arise from a firm’s decision to pay for its own
resources. When firms have implicit costs, they forgo resources owned by other entities. The decision
to use self-employed resources creates a trade-off. Implicit costs are anything external resources
could have generated in monetary and nonmonetary value.
Average fixed cost is calculated by dividing total fixed cost by the quantity of output:
Average fixed cost = Total fixed cost / output
Total fixed cost is the same regardless of output, but average fixed cost declines as output increases.
Average fixed costs decline as output increases because the quantity of output minimizes the
monetary impact of fixed costs as it rises.
Average variable cost is calculated by dividing the total variable cost by quantity. As resources are
added, average variable costs decline at first, then reach a low point, and then begin to increase. The
average variable costs curve is U-shaped and reflects this pattern.
Average total cost is calculated by dividing total cost by quantity. You can find this cost by adding
the average variable cost to the average fixed cost. Total cost invariably means the total sum of the
fixed costs and the variable costs.
The marginal-cost curve includes the additional cost of producing one more unit. To derive the
marginal cost, you must divide the change in total cost by the change in quantity:
Marginal cost = Change in total cost / change in quantity
Marginal Cost and Marginal Product Remember that the marginal cost curve indicates what occurs when more workers are hired. In the
beginning, the added units of labour may decrease the cost of output; however, as more units of
labour are added, the cost of output rises. When diminishing marginal returns set in, the cost of
output begins to rise, and firms would be wise not to add units of labour. Marginal cost is the change
in cost caused by a change in output.
Marginal Cost, Average Variable Cost, Average Total Cost When the amount added of marginal cost to total cost is less than the current average total cost, the
average total cost falls. The marginal cost that is less than the average total cost brings down the cost

of output. On the other hand, when the marginal cost is more than the average total cost, the average
total cost rises. As long as the marginal cost curve is below the average total cost, the average total
cost will continue to fall, and whenever the marginal cost curve is above the average total cost curve,
the average total cost will increase.
Cost Curve Changes When a firm experiences changes in resource prices or technology costs, the firm’s cost curves will
shift. If the fixed increase, the average fixed cost curve and the average total cost curve shift upward.
However, if the price of a variable cost (such as labour) increases, then the marginal cost curve,
average variable cost curve, and average total cost curve will all shift upward.
Production Costs in the Long Run In the long run, firms can adjust the resources they use to take advantage of more efficient means of
production. Firms can change the amount of all inputs used, alter the building size, or change the
machinery capabilities. Improvements in technology make production costs cheaper in the long run.
■ Total product: The total quantity of a good produced
■ Marginal product: The added unit of a variable resource to the production process
Marginal product = Change in total product / Change in labour input
■ Average Product: The output per worker
Average product = Total product / Units of labour
Review Questions
1. Which one of the following best describes why the marginal cost decreases and then increases?
A. Increasing, then decreasing marginal returns
B. Increasing, then decreasing marginal utility
C. Diminishing product of labour
D. Constant marginal revenue
E. None of the above
2. How are total costs calculated?
A. By adding marginal costs and variable costs
B. By adding marginal revenue to total revenue
C. By adding fixed costs to variable costs
D. By adding average fixed costs to total fixed costs
E. By adding average marginal cost to total variable costs
3. What is the main difference between variable costs and fixed costs?
A. Fixed costs are steady with output and variable costs are not.
B. Variable costs are steady with output and fixed costs are not.
C. Variable costs rise with output and so do fixed costs.
D. Fixed costs follow what variable costs do; variable costs do not follow fixed costs.
E. Fixed costs are usually more expensive than variable costs.
Answers to Review Questions 1. A. Increasing, then decreasing marginal returns.
2. C. Total costs are calculated by adding fixed costs to variable costs. When the two are added, firms
can see what their total output costs will be.
3. A. Fixed costs are steady with output and variable costs are not. Variable costs fluctuate with
different levels of output.

SEVEN-Scale Economies
Economies of scale mean that higher production translates into lower average production costs.
The more firms choose to produce, the less costly production of units becomes. A firm’s ability to
decrease its inputs in order to adjust costs is what makes it cheaper for the firm to produce in the long
run.
Constant returns to scale is the area where all inputs are increased by the same percentage to
maintain the lowest possible per-unit cost. This area is located at the bottom of the long-run average
total cost curve.
Diseconomies of scale mean that an increase in production yields a higher average cost of
production. It refers to the average cost-per-unit increases in the long run despite fixed inputs.
Diseconomies of scale occur when firms become too large to operate efficiently. Decision-making
problems, inefficient use of resources, and bureaucracy are all examples of factors that could lead to
diseconomies of scale.
Reasons for Economies of Scale It is important for a firm to specialize as it grows larger because specialization improves the firm’s
chances of realizing economies of scale. Economies of scale may also result from the use of larger
machines that are more efficient than smaller ones. Larger machines can produce in mass quantity
and sometimes use less power or fuel than a smaller machine while creating the same number of
units. Large electrical power generators are more efficient than smaller ones because they provide
more output per quantity of resource.
Size does not automatically improve efficiency. The specialization that comes with large size often
requires the addition of specialized managers. Each level of supervision requires additional labour
inputs, and before you know it, your costs are soaring. A firm can achieve economies of scale by
increasing quantities of output while keeping costs at a minimum.
The long run is referred to as a planning horizon because the firm has not committed to a fixed
quantity of any resources and has all options available to it. In determining the size or scale to select,
the firm must look at expected demand and expected costs of production, and then select the size that
appears to be most profitable.
Here are two key points to remember:
■ The long-run average total cost curve is U-shaped because of economies and diseconomies of
scale. Short-run cost curves get their U shape from diminishing marginal returns.
■ Economies of scale can result from technology and specialization. Diseconomies of scale may
occur because of coordination and communication problems that result from the firm’s growth.
Review Questions 1. Which of the following is true regarding marginal product?
A. It is the measure of impact an added unit of input has on output.
B. It is the measure of how outputs affect inputs.
C. It lets producers know how much a product is going to cost.
D. It describes the relationship between average total cost and marginal cost.
E. None of the above.
2. Which of the following best describes average variable costs?
A. Variable cost multiplied by quantity
B. Variable costs multiplied by fixed costs

C. Variable costs divided by quantity
D. Variable costs divided by fixed costs
E. Variable costs divided by marginal costs
3. Which of the following best describes average total cost?
A. The relationship between marginal cost and fixed costs
B. Fixed costs divided by quantity
C. Variable costs divided by quantity
D. Marginal product divided by quantity
E. Average costs divided by fixed costs
4. Which of the following best describes pure profit?
A. The difference between variable and fixed costs
B. Total revenue minus total quantity
C. Total revenue minus implicit and explicit costs
D. The revenue generated as a result of economies of scale
E. The revenue generated as a result of quantity sold
5. Why are long-run cost curves U-shaped?
A. Because they reveal an increasing cost followed by decreasing costs.
B. Because they describe the impact of economies of scale.
C. Because as resource prices increase, so does production.
D. Because resource prices are too cheap.
E. Both A and C.
Answers to Review Questions 1. A. Marginal product is the measure of impact an additional unit of input has on output.
2. C. To derive average variable costs, you must divide variable costs by quantity.
3. A. Average total cost is a measure of the impact an additional input has on output.
4. C. Pure profit is total revenue minus implicit and explicit costs.
5. B. Economies of scale explain why long-run cost curves are U-shaped. When the firm initially
produces a large quantity, there are economies of scale. As the firm continues to increase its average
total cost, there are no returns to scale.

EIGHT-– Market Systems (1)- Competition
Criteria for Market Structures In analyzing the behaviours of firms, economists have created categories to explain the
relationship firms have with prices, competition, products, and entrepreneurship. It is important to
realize that not every industry fits perfectly into a particular category. The groupings merely
represent an effort to consolidate firms to help us understand the market structure. The four
categories are perfect or pure competition, monopoly, oligopoly, and monopolistic competition.
The market structure in which a firm produces and sells its product is defined by five characteristics:
■ Number of firms
■ Type of product Cost
■ Price control
■ Conditions of entry
■ Non-price competition
Pure Competition/Perfect Competition Perfect competition is a market structure characterized in a distinct way:
■ Number of firms: There are many perfectly competitive firms. A large number of these firms act
independently of one another. These organizations offer their products domestically as well as
internationally. Agricultural businesses are one example.
■ Type of product: Perfectly competitive firms produce an identical or homogeneous product. As
long as prices are the same as their competitors, consumers will have no preferences for a product or
a firm. Consumers view perfectly competitive firms as perfect substitutes for one another because
they all make the same product. Perfectly competitive firms make no attempt to differentiate their
products or compete in any fashion because of the existence of a market price.
■ Price control: Perfectly competitive firms have absolutely no price control. They are referred to
as price takers.
A price-taking firm enters the market accepting the market price rather than setting its own price. If a
perfectly competitive firm attempts to set its own price, it will soon fail as a business. Asking a
higher-than-market price would not be in the best interest of the firm because consumers would
quickly substitute. There would be no reason for the firm to ask for lower than the market price
because the firm is already selling all its quantities at the market price. Asking for a lower price
would deprive the firm of revenue.
■ Conditions of entry: The conditions of entry for a perfectly competitive firm are free and easy.
A new firm can join the market without barriers or obstacles. New firms can freely enter the market,
while old firms can leave without much difficulty in liquidating their assets. No significant monetary,
legal, or technological hurdles stand in the way of a perfectly competitive firm.
■ Non-price competition: In a perfectly competitive market, non-price competition does not exist.
Firms are content with the market price and quantities offered.
Review Questions 1. Which of the following is a characteristic of a perfect competition?
A. Few firms in the industry
B. Many firms in the market
C. Great degree of price control

D. Plenty of profit
E. Many substitutes
2. What is the role of profit in a perfectly competitive firm?
A. There is never profit.
B. There is profit in the beginning and no profit in the long run.
C. There is always profit.
D. Depending on the firm’s ability to set its prices, there will be profit.
E. There is no profit in the beginning but there is a profit in the long run.
3. How do perfectly competitive firms compete?
A. They engage in non-price competition.
B. They engage in price competition.
C. There is no competition between firms.
D. They compete through a mix of non-price and price competition.
E. None of the above.
Answers to Review Questions 1. B. The existence of many firms in the market is a characteristic of a perfectly competitive firm.
2. B. Profit exists in the short run and disappears in the long run because other firms enter the
market.
3. C. There is no competition between firms in a perfectly competitive market.

NINE-Market Systems (2)-Monopoly; A monopoly is when a single seller is the market and has no close substitutes. This is how a
monopoly fits into the market structure:
■ Number of firms: There is only one firm in a monopoly. The monopolist is the market and has
no available substitutes or competitors. The firm is the single supplier of the product.
■ Type of product: The type of product a monopolist sells is original and unique. There are no
close substitutes, and if consumers do not buy the product, they are choosing to do without it
completely.
■ Price control: Monopolists are price makers. This means that they set and control their prices for
their good or service. They also control the quantity supplied in the market. The demand curve still
slopes downward for a monopolist; however, it has the freedom to manipulate the curve by changing
quantities.
Price Discrimination Price discrimination is when a monopolist charges different prices for a product to different buyers
even though the production and transaction costs remain unchanged. To price-discriminate, a firm
must have market power. Price discrimination can take place only when certain conditions are met:
■ A monopolist has to have power: The seller must have outright monopoly power or, at the very
least, possess an original product or idea to be able to control output and price.
■ Separation of market must be attainable: The monopolist must be able to sway buyers into
becoming dependent on its product. Elasticities of consumers will vary, but all consumers in the
monopolist’s market will need to rely on the monopolist’s product.
■ Redistribution of product must be forbidden: When buyers purchase the product from a
monopolist, they must not be able to resell the product or service. The reselling of the product or
service compromises the power of the monopolist, and it undermines the strategy of cornering the
market.
Monopolistic Competition Monopolistic competition is a little like a monopoly in that each firm in this market organization
produces a somewhat unique product. This uniqueness gives the monopolistically competitive firm a
“mini-monopoly” over its competitor. So, like a monopolist, the monopolistically competitive firm
has a downward-sloping demand curve. Marginal revenue for this type of firm is below the demand
curve, and price is greater than marginal cost. The main distinguishing point between monopolistic
competition and a monopoly is the ease of entry. Anytime firms in a monopolistic competition are
earning above normal profit, ease of entry continues until the profit level returns to normal in the
long run.
Oligopolies Oligopolies are interdependent, meaning that each firm takes into account and reacts to what its
rivals are doing.
Review Questions
1. Which of the following is a characteristic of an oligopoly?
A. The existence of many firms in the market

B. Only one firm in the market
C. Strategic competition
D. No long-run profits
E. No competition
2. What is the main similarity between a monopolistically competitive firm and a monopoly?
A. They both have one firm in the market.
B. They both have extreme price control.
C. They both have a downward-sloping demand curve.
D. They both have no competitors.
E. They both have many competitors.
3. Which of the following is a characteristic of an oligopoly?
A. A kinked supply curve
B. No product differentiation
C. No competition
D. Existence of many firms E. Strategic competition
Answers to Review Questions
P 1. C. Strategic competition is a characteristic of oligopolies. Firms speculate on their rivals’ next
move.
2. C. The main similarity between a monopolistically competitive firm and a monopoly is that they
both have a downward-sloping demand curve. The law of demand applies to both markets, at
separate price ranges.
3. E. Strategic competition is a characteristic of oligopolies. When an oligopoly makes a decision, it
is usually based on what its competitors are going to do in reaction to that decision. Oligopolies are
dependent on one another because of the strategic competition that is present among firms.
Recommended


![[Varian] Microeconomic Analysis](https://img.dokumen.tips/doc/110x75/5695d4011a28ab9b029fee27/varian-microeconomic-analysis-56c73dc9c2d65.jpg)