Lauro André Ribeiro
MICROALGAE AS FEEDSTOCK FOR ADVANCED
BIOFUELS: SUSTAINABILITY AND POLICY
ASSESSMENT
Doctoral Thesis in Sustainable Energy Systems, supervised by Professor Patricia Carla
Gama Pinto Pereira Silva Vasconcelos Correia and Professor Stephen Connors,
submitted to the Department of Mechanical Engineering, Faculty of Sciences and
Technology of the University of Coimbra
September, 2014


MICROALGAE AS FEEDSTOCK FOR ADVANCED BIOFUELS: MICROALGAE AS FEEDSTOCK FOR ADVANCED BIOFUELS: MICROALGAE AS FEEDSTOCK FOR ADVANCED BIOFUELS: MICROALGAE AS FEEDSTOCK FOR ADVANCED BIOFUELS:
SUSTAINABILITY AND POLICY ASSESSMENTSUSTAINABILITY AND POLICY ASSESSMENTSUSTAINABILITY AND POLICY ASSESSMENTSUSTAINABILITY AND POLICY ASSESSMENT
PhD Thesis in Sustainable Energy SystemsEnergy for Sustainability (EfS / MIT Portugal Program
Doctoral Thesis in Sustainable Energy SysEngineering, Faculty of Sciences and Technology of the University of Coimbra to obtain the
Professor Doutor Patricia Carla Gama Pinto Pereira Silva Vasconcelos Correia
Main financial support: CAPES (Ref
i
MICROALGAE AS FEEDSTOCK FOR ADVANCED BIOFUELS: MICROALGAE AS FEEDSTOCK FOR ADVANCED BIOFUELS: MICROALGAE AS FEEDSTOCK FOR ADVANCED BIOFUELS: MICROALGAE AS FEEDSTOCK FOR ADVANCED BIOFUELS:
SUSTAINABILITY AND POLICY ASSESSMENTSUSTAINABILITY AND POLICY ASSESSMENTSUSTAINABILITY AND POLICY ASSESSMENTSUSTAINABILITY AND POLICY ASSESSMENT
Lauro André Ribeiro
PhD Thesis in Sustainable Energy SystemsEnergy for Sustainability (EfS / MIT Portugal Program)
Thesis in Sustainable Energy Systems, submitted to the Department of Mechanical
Engineering, Faculty of Sciences and Technology of the University of Coimbra to obtain the Doctor degree
Supervisors:
Professor Doutor Patricia Carla Gama Pinto Pereira Silva Vasconcelos Correia
Professor Stephen Connors
Coimbra, September 2014
CAPES (Ref. 5621-10-0)
ACKNOWLEDGEMENTS
MICROALGAE AS FEEDSTOCK FOR ADVANCED BIOFUELS: MICROALGAE AS FEEDSTOCK FOR ADVANCED BIOFUELS: MICROALGAE AS FEEDSTOCK FOR ADVANCED BIOFUELS: MICROALGAE AS FEEDSTOCK FOR ADVANCED BIOFUELS:
SUSTAINABILITY AND POLICY ASSESSMENTSUSTAINABILITY AND POLICY ASSESSMENTSUSTAINABILITY AND POLICY ASSESSMENTSUSTAINABILITY AND POLICY ASSESSMENT
PhD Thesis in Sustainable Energy Systems
tems, submitted to the Department of Mechanical Engineering, Faculty of Sciences and Technology of the University of Coimbra to obtain the
Professor Doutor Patricia Carla Gama Pinto Pereira Silva Vasconcelos Correia
ACKNOWLEDGEMENTS
ii
ACKNOWLEDGEMENTS
I would like to acknowledge the Brazilian National Council for the
Improvement of Higher Education (CAPES) for the main financial support of this
doctorate (Ref. 5621-10-0). I also thank the Energy for Sustainability Initiative of the
University of Coimbra, namely its coordinator, Professor António Gomes Martins, the
R&D Project EMSURE Energy and Mobility for Sustainable Regions (CENTRO 07 0224
FEDER 002004) for co-founding costs for participating in some conferences.
I would like to thank my supervisor Professor Patricia Pereira Silva for the
strong support in all my journey here in Portugal. Since the beginning, and through these
five years of studies, she provided great guidance and granted me the freedom to pursue
my own ideas. I am really grateful to have had her as my supervisor.
To my co-supervisor Professor Stephen Connors, I would like to thank all the
valuable suggestions and contributions during my research, even in difficult times. I would
also like to thank Professor António Areosa Martins for his interest and for introducing me
to the algae cultivation world.
A special thanks to Professors Leila Ribeiro and Fernando Luis Dotti who
helped enthusiastically with my model and mathematics. It would have been much more
difficult without your readily support.
I express my gratitude to all colleagues, friends and staff that somehow helped
me in this journey. In particular, to Maria Lídia Cardoso for her huge heart and for giving
me an opportunity in a difficult moment; to Ana Ramos who patiently answered to all my
enquiries; to Luis Felipe Machado do Nascimento who always enlightens me with his
wisdom; and to Patrícia Dias for her friendship.
Finally I would like to thank my family to whom this thesis is dedicated, for all
the support and encouragement. To my loving mother, who gives me strength in all times
and is always positive and cheerful. To my sisters, for all their love, support and guidance,
and to Thaísa for her wonderful friendship and companionship. I feel that what we both
have learned about life in these years strengthened our commitment and affection to each
other to live life to the fullest. Thank you.

ABSTRACT
iii
ABSTRACT
Due to the dwindling of the global oil reserves, that are becoming harder and
more expensive to explore, and the current efforts to reduce greenhouse emissions from
fossil fuels consumption, new and renewable energy sources, in particular, must be
developed and implemented. Therefore, the proposed study aims to analyze the use of
microalgae as an advanced biofuel feedstock with an emphasis in its sustainability, and
assess the economical, technological and political factors that can be critical to the success
of this technology. The methods used to analyze the prospects of using microalgae as a
feedstock for biofuels and to develop future diffusion pathways of emerging biofuels were
a combination of a qualitative Delphi Survey with experts and modeling future scenarios
using Stochastic Automata Networks. In this way, it was possible to draw several
conclusions related to the potential development for microalgae commercialization in the
biofuel market and to demonstrate the effectiveness of some public policies in the
dissemination of advanced biofuels in the future.
Keywords: Biofuel, Microalgae, Policies, Economy, Emerging Technologies, Advanced Biofuels, Scenarios, Assessment, Sustainability, Market Diffusion, Model, Delphi, Stochastic Automata Network.
RESUMO
iv
RESUMO
Devido à diminuição das reservas mundiais de petróleo, que estão tornando-se
mais complexas e caras para exploração, e os esforços atuais para reduzir as emissões de
gases relacionados ao consumo de combustíveis fósseis, novas fontes de energia
renováveis precisam ser desenvolvidas e implementadas. Portanto, este estudo tem como
objetivo analisar o uso de microalgas como matéria-prima para biocombustíveis
avançados, com ênfase em sua sustentabilidade, e avaliar os fatores econômicos,
tecnológicos e políticos que podem ser cruciais para o sucesso desta tecnologia. Os
métodos utilizados para analisar as perspectivas do uso de microalgas como matéria-prima
para biocombustíveis e desenvolver futuros caminhos para a difusão destes
biocombustíveis emergentes foram uma combinação de uma pesquisa qualitativa com
especialistas com o método Delphi e modelagem de cenários futuros, utilizando Redes de
Autômatos Estocásticos. Desta forma, foi possível tirar várias conclusões relacionadas com
o potencial de cultivo e comercialização de microalgas no mercado de biocombustíveis e
demonstrar a eficácia de algumas políticas públicas na disseminação de biocombustíveis
avançados no futuro.
Palavras-chave: Biocombustível, Microalgas, Políticas, Economia, Tecnologias Emergentes, Biocombustíveis Avançados, Cenários, Avaliação, Sustentabilidade, Difusão no Mercado, Modelo, Deplhi, Redes de Autômatos Estocásticos.
CONTENTS
v
CONTENTS
ACKNOWLEDGEMENTS .............................................................................................................................. ii
ABSTRACT ..................................................................................................................................................... iii
RESUMO ......................................................................................................................................................... iv
CONTENTS ...................................................................................................................................................... v
LIST OF FIGURES ......................................................................................................................................... vii
LIST OF TABLES ........................................................................................................................................... ix
ABBREVIATIONS ........................................................................................................................................... x
1. INTRODUCTION ................................................................................................................................. 13
1.1. Background and Motivation ......................................................................................................... 13 1.2. Definition of the problem and research questions ........................................................................ 15 1.3. Methodology ................................................................................................................................ 15 1.4. Significance of the study .............................................................................................................. 17 1.5. Thesis overview ............................................................................................................................ 18
2. LITERATURE REVIEW: MICROALGAE AS A BIOFUEL FEEDSTOCK ...................................... 19
2.1. Algae cultivation techniques ........................................................................................................ 19 2.1.1. Comparing open ponds and photobioreactors systems .......................................................... 21 2.1.2. Harvesting methods ............................................................................................................... 22 2.1.3. Extraction of algae oil ........................................................................................................... 23
2.2. Products and processes ................................................................................................................. 24 2.2.1. Human and animal products .................................................................................................. 25 2.2.2. Energetic products ................................................................................................................. 26 2.2.3. Other products ....................................................................................................................... 29 2.2.4. Processes schematics ............................................................................................................. 29 2.2.5. Productivity and lipid content ............................................................................................... 34
2.3. Sustainability of algae biofuels .................................................................................................... 35 2.3.1. Environmental assessment .................................................................................................... 36 2.3.2. Economical assessment ......................................................................................................... 46 2.3.3. Social assessment .................................................................................................................. 54 2.3.4. Comparing feedstocks for biofuel ......................................................................................... 55 2.3.5. Challenges of algae-based biofuels ....................................................................................... 57
3. BIOFUEL MARKET DIFFUSION AND POLICIES ........................................................................... 59
3.1. Market diffusion ........................................................................................................................... 59 3.2. United States policies ................................................................................................................... 60 3.3. European Union policies .............................................................................................................. 64
4. WORLD EXPERTS VISIONS THROUGH A DELPHI SURVEY ...................................................... 67
4.1. Methodology ................................................................................................................................ 68 4.2. Results and discussion .................................................................................................................. 70
5. MODELING POLICIES IMPACTS ON BIOFUELS MARKET DIFFUSION ................................... 79
5.1. Stochastic Automata Network ...................................................................................................... 79 5.1.1. Comparing SAN with other modeling techniques ................................................................. 80
5.2. Modeling policies ......................................................................................................................... 84
CONTENTS
vi
5.2.1. Model assumptions ................................................................................................................ 85 5.2.2. Modeling each year ............................................................................................................... 90 5.2.3. Modeling a scenario .............................................................................................................. 93 5.2.4. Calibrating and validating the model .................................................................................... 93
5.3. Results and analysis...................................................................................................................... 98
6. CONCLUSIONS ................................................................................................................................. 115
6.1. Limitations and recommendations for future research ............................................................... 118 6.2. Contributions .............................................................................................................................. 118
7. REFERENCES .................................................................................................................................... 121
APPENDIX A ............................................................................................................................................... 130
APPENDIX B ............................................................................................................................................... 131
APPENDIX C: .............................................................................................................................................. 135
APPENDIX D ............................................................................................................................................... 174
APPENDIX E ................................................................................................................................................ 180
LIST OF FIGURES
vii
LIST OF FIGURES
Figure 1: Three studied categories in the algal biofuels market ...................................................................... 16
Figure 2: Algae biofuel requirements and simple production process............................................................. 20
Figure 3: Petroleum and bio-based transportation fuels (Demirbas and Demirbas, 2010). ............................. 30
Figure 4: Overview of conversion processes of plant biomass feedstocks into biofuels (Demirbas and Demirbas, 2010). ............................................................................................................................................. 31
Figure 5: Biorefinery concept (Demirbas and Demirbas, 2010).. .................................................................... 32
Figure 6: Algae biofuel possible processes (U.S. DOE, 2010). ....................................................................... 33
Figure 7: Algae biofuel possible process options and co-products (U.S. DOE, 2010). ................................... 33
Figure 8: Sustainability Triple Bottom Line .................................................................................................... 35
Figure 9: Hectares of land needed to produce 1000 GJ of raw energy (Miller, 2010). ................................... 37
Figure 10: Life cycle use of nutrients in freshwater medium with/without harvest water recycling (left) and life cycle use of nutrients in sea and wastewater medium with 100% harvest water recycling (right). (Yang et al., 2011) .......................................................................................................................................................... 41
Figure 11: The EROI ratio and GHG emissions/MJ of (a) algae-derived diesel and (b) algae-derived gasoline produced using HTL (Liu et al.,2013). ............................................................................................................ 42
Figure 12: Survey experts’ fields of work. ...................................................................................................... 70
Figure 13: Delphi survey results about the future of microalgae biofuels. ...................................................... 77
Figure 14: Automaton Users Of Petrol ............................................................................................................ 90
Figure 15: Synchronized Events ...................................................................................................................... 91
Figure 16: U.S. Transportation market share diffusion reference scenario (a) and a graphic zoom in non-petrol fuels (b). ................................................................................................................................................ 98
Figure 17: U.S. Transportation market share diffusion of reference scenario with low investment in R&D and 10% (a), 25% (b) and 50% (c) Advanced Biofuels price subsidy. .................................................................. 99
Figure 18: U.S. Transportation market share diffusion reference scenario with medium Advanced Biofuels R&D investment (a) and a graphic zoom in non-petrol fuels (b). ................................................................. 100
Figure 19: U.S. Transportation market share diffusion of reference scenario with medium investment in R&D and 10% (a), 25% (b) and 50% (c) Advanced Biofuels price subsidy. .......................................................... 101
Figure 20: U.S. Transportation market share diffusion reference scenario with high Advanced Biofuels R&D investment (a) and a graphic zoom in non-petrol fuels (b). ........................................................................... 102
Figure 21: U.S. Transportation market share diffusion of reference scenario with high investment in R&D and 10% (a) and 25% (b) Advanced Biofuels price subsidy. ........................................................................ 103
Figure 22: U.S. Transportation market share diffusion reference scenario with high R&D investment and 50% price subsidy for Advanced Biofuels. ................................................................................................... 104
Figure 23: U.S. Transportation market share diffusion of reference scenario with low investment in R&D, 10% Advanced Biofuels subsidy and 10% Petrol tax (a) and a graphic zoom in non-petrol fuels (b). ......... 105
Figure 24: U.S. Transportation market share diffusion graphic zoom in non-petrol fuels of reference scenario with 10% Advanced Biofuels subsidy, 10% Petrol tax and medium (a) and high (b) investment in R&D. .. 106
LIST OF FIGURES
viii
Figure 25: U.S. Transportation market share diffusion of reference scenario with medium investment in R&D, 50% Advanced Biofuels subsidy and 25% Petrol tax (a); and 25% Advanced Biofuels subsidy, 50% Petrol tax (b). ................................................................................................................................................. 108
Figure 26: U.S. Transportation market share diffusion of reference scenario with low investment in R&D and Advanced Biofuel Mandates based on RFS2(a); and a graphic zoom in non-petrol fuels (b). ...................... 110
Figure 27: U.S. Transportation market share diffusion of reference scenario with low investment in R&D and revised RFS2 Advanced Biofuel Mandates based on U.S. EIA (2013)(a); and a graphic zoom in non-petrol fuels (b). ........................................................................................................................................................ 112
LIST OF TABLES
ix
LIST OF TABLES
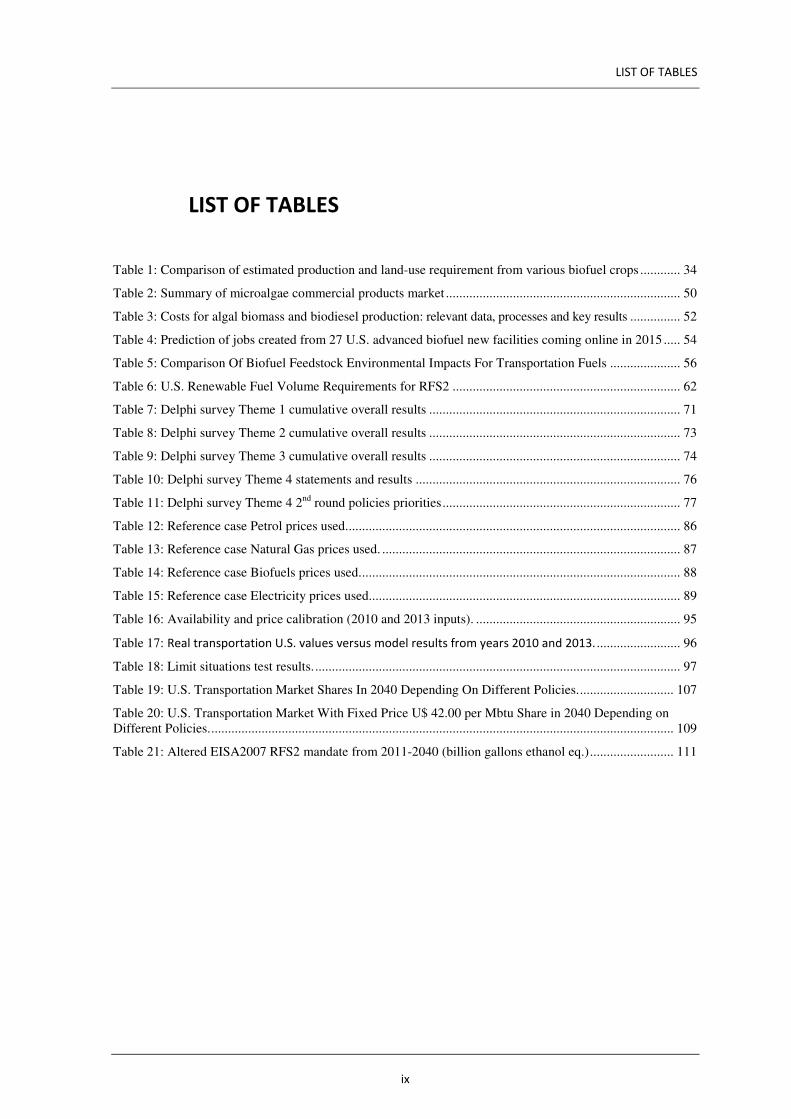
Table 1: Comparison of estimated production and land-use requirement from various biofuel crops ............ 34
Table 2: Summary of microalgae commercial products market ...................................................................... 50
Table 3: Costs for algal biomass and biodiesel production: relevant data, processes and key results ............... 52
Table 4: Prediction of jobs created from 27 U.S. advanced biofuel new facilities coming online in 2015 ..... 54
Table 5: Comparison Of Biofuel Feedstock Environmental Impacts For Transportation Fuels ..................... 56
Table 6: U.S. Renewable Fuel Volume Requirements for RFS2 .................................................................... 62
Table 7: Delphi survey Theme 1 cumulative overall results ........................................................................... 71
Table 8: Delphi survey Theme 2 cumulative overall results ........................................................................... 73
Table 9: Delphi survey Theme 3 cumulative overall results ........................................................................... 74
Table 10: Delphi survey Theme 4 statements and results ............................................................................... 76
Table 11: Delphi survey Theme 4 2nd round policies priorities ....................................................................... 77
Table 12: Reference case Petrol prices used. ................................................................................................... 86
Table 13: Reference case Natural Gas prices used. ......................................................................................... 87
Table 14: Reference case Biofuels prices used. ............................................................................................... 88
Table 15: Reference case Electricity prices used............................................................................................. 89
Table 16: Availability and price calibration (2010 and 2013 inputs). ............................................................. 95
Table 17: Real transportation U.S. values versus model results from years 2010 and 2013. ......................... 96
Table 18: Limit situations test results. ............................................................................................................. 97
Table 19: U.S. Transportation Market Shares In 2040 Depending On Different Policies. ............................ 107
Table 20: U.S. Transportation Market With Fixed Price U$ 42.00 per Mbtu Share in 2040 Depending on Different Policies. .......................................................................................................................................... 109
Table 21: Altered EISA2007 RFS2 mandate from 2011-2040 (billion gallons ethanol eq.) ......................... 111
ABBREVIATIONS
x
ABBREVIATIONS
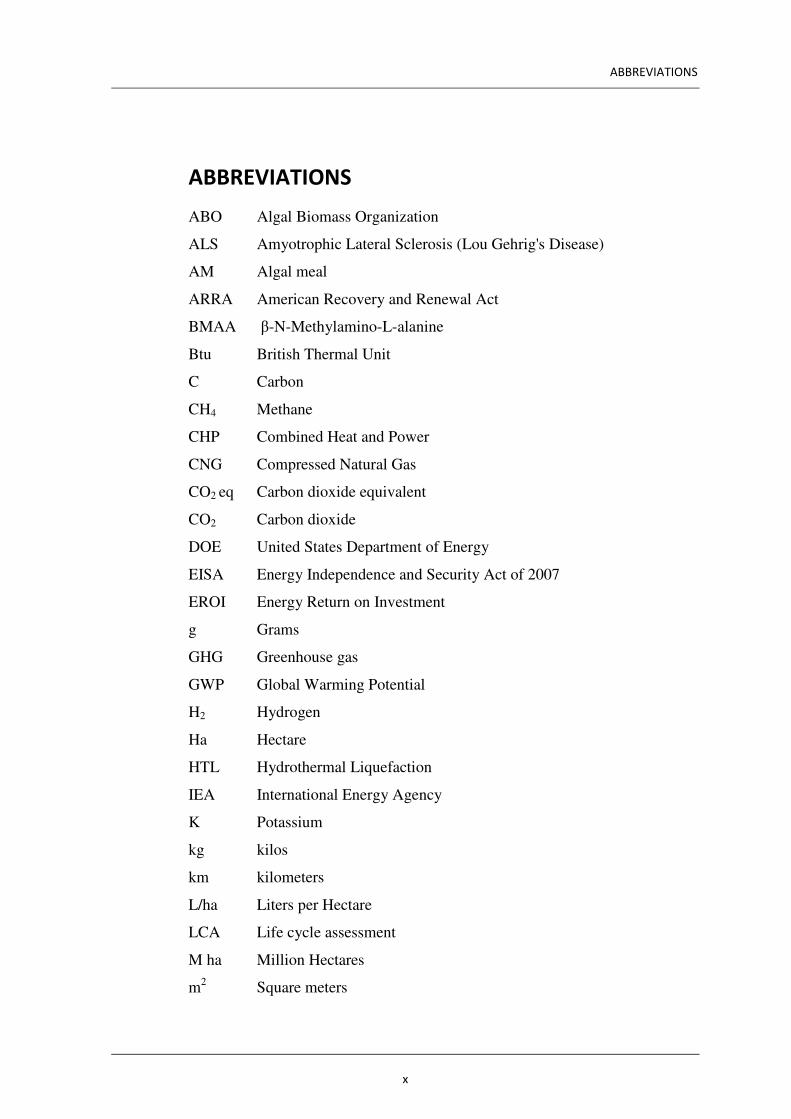
ABO Algal Biomass Organization
ALS Amyotrophic Lateral Sclerosis (Lou Gehrig's Disease)
AM Algal meal
ARRA American Recovery and Renewal Act
BMAA β-N-Methylamino-L-alanine
Btu British Thermal Unit
C Carbon
CH4 Methane
CHP Combined Heat and Power
CNG Compressed Natural Gas
CO2 eq Carbon dioxide equivalent
CO2 Carbon dioxide
DOE United States Department of Energy
EISA Energy Independence and Security Act of 2007
EROI Energy Return on Investment
g Grams
GHG Greenhouse gas
GWP Global Warming Potential
H2 Hydrogen
Ha Hectare
HTL Hydrothermal Liquefaction
IEA International Energy Agency
K Potassium
kg kilos
km kilometers
L/ha Liters per Hectare
LCA Life cycle assessment
M ha Million Hectares
m2 Square meters

ABBREVIATIONS
xi
MABEL Meta-Model of Algae Bio-Energy Life Cycles
MBtu one thousand BTUs
Mg Magnesium
MIT Massachusetts Institute of Technology
MJ Mega Joule
N Nitrogen
NER Net Energy Ratio
NOx Nitrogen oxides
NREL National Renewable Energy Laboratory
NUMA Non-uniform Memory Access
O&M Operations and Management
O3FA omega-3 fatty acids
P Phosphorous
PBR Photobioreactor
R&D Research and Development
RFS Renewable Fuel Standard program
RFS2 Revised Renewable Fuel Standard
S Sulfur
SAN Stochastic Automata Network
SET Strategic Energy Technology Plan
SOx Sulfur oxides
T Metric Tonne
TIMES The Integrated MARKAL-EFOM System
TAG triacylglycerol
UG Users of Natural Gas
UP Users of Petrol
WFP Water Footprint
wt Weight

INTRODUCTION
13
1. INTRODUCTION
1.1. Background and Motivation
Sustainability is currently a fundamental principle in environmental resources
management (U.N., 1987; Daly, 2007). Currently it is increasingly clearer to society that the
continued use of fossil fuels for energetic purposes is unsustainable. The dwindling of current
global oil reserves, increased difficulties and costs in its explorations, and the need to reduce
the emissions of greenhouse gases associated with their use are placing constraints in the
usage of fossil fuels. In this context, biofuels are particularly important since they can be used
in today automobiles with little or no modifications of engines and as an option for means of
transportation that lack other fuel options (especially trucks, ships and aircrafts).
Alternative energy sources derived from terrestrial crops such as sugarcane,
soybeans, maize, rapeseed, among others, inflict a lot of pressure on the global food markets,
contribute to water scarcity and precipitate the destruction of forests. Therefore, other
innovative technologies and sources of energy must be developed to replace fossil fuels. The
overall sustainability of biofuels will depend on the development of viable, sustainable,
advanced technologies that do not appear to be yet commercially viable.
In this perspective, algal biofuels are generating substantial awareness in many
countries. Several studies have been conducted on the technical feasibility of growing algae
for biofuel production in the laboratory (Tao and Aden, 2009; Chisti, 2007; Brennan and
Owende, 2010; Carvalho et al, 2006; Hirano et al. 1997; Ono and Cuello, 2006; Pulz, 2001;
Pulz and Gross, 2004; Sheehan et al., 1998; Spolaore et al., 2006; Terry and Raymond, 1985;
Ugwu et al, 2008), which have proved the absence of many of the major drawbacks associated
with current biofuels. However, not much information can be found concerning the
production of biofuels from microalgae in a commercial scale because this is still an immature
technology. Though several companies that grow algae on a large scale and produce biofuels
INTRODUCTION
14
from them emerged in recent years, the price of this biofuel still appears to be too high to be
competitive when compared to currently used fuels, even renewable ones.
The current economic situation appears to be that large-scale production of algae
biodiesel is not yet viable as a solution to displace petroleum-based fuels (Ribeiro and Silva,
2013). The technology to efficiently produce biofuels from microalgae seems to remain not
yet competitive with more advanced and emerging renewable technologies such as wind,
solar, geothermal, and other forms of biofuels. However, with policy support and incentives,
the algal biofuel industry could continue to develop and assuming that this technology follows
renewable energy cost trends, costs would decrease to eventually reach economic viability.
(Pienkos and Darzins, 2009). This development is already happening with other renewable
energy sources, such as wind and solar power to generate electricity due to advances in
technology and policy support, a pathway that can be pursued by microalgae as feedstock for
biofuels.
By assessing the viability of algae projects from a market perspective, it is clearly
apparent that total installed costs, operational and maintenance costs will be a major hurdle to
future commercialization. According to Mcgraw (2009), current technologies should be
improved, or even new ones invented, to reduce costs and increase yields. This can be
accomplished through focused, comprehensive, and well-funded Research and Development
(R&D) programs, at the international, national and even regional levels, with the participation
of all relevant stakeholders, in particular companies.
Public policies could also perform a great boost in this area lowering the costs of
renewable energy sources to support the development of renewable technologies, either
through direct means such as government-sponsored R&D, or by enacting policies that
support the production of renewable technologies (Popp et al., 2011). In the United States, for
example, they may contribute to achieve the biofuel production targets set by the Energy
Independence and Security Act of 2007. Likewise, in the European Union, they may assist to
the achievement of goals established in the recent Renewables Directive, that concerning
transportation sector fuels, states that each member state should reach a minimum 10% share
of renewable energy by 2020 (E.U., 2009). In order to address the technical-economic barriers
INTRODUCTION
15
to the further development of this type of bio-energy, it is thus necessary to contribute with a
study that incorporates biomass feedstock availability assessment, sustainability and
feasibility of production, diffusion pathways, possible policies and use it in support of the
scaling up of this promising technology if it is the general interest to do so.
1.2. Definition of the problem and research questions
The question addressed in this thesis is not whether biofuels from algae are
technically possible, but rather focuses on the issue of whether they can be produced with an
economical viability and at a scale sufficient to help contribute to the world’s fuel demand.
Moreover, the overall sustainability (environmental, economical and social) of the algae
biofuels produced is of great importance. Therefore, the first step of this work is to investigate
the current status and prospects of using microalgae for biofuels production. Afterwards, the
first research question arises: 1) What are the main drivers that influence the overall
sustainability of microalgae biofuels, considering economic, social and environmental
impacts?
After analyzing these key aspects for the future development of such technology,
there is a need to analyze the present policy situation of cultivating microalgae for biofuel
production, to evaluate possible opportunities and weaknesses and to forecast ways to
enhance the diffusion of algae biofuels in the market. This leads to addition objectives to be
attended: 2) Which policies currently affect microalgae biofuels industry? and 3) What
policies could enhance the diffusion of microalgae in the transportation market share in
the future?
1.3. Methodology
In order to make the intersection of three major areas of knowledge: the economic
policies that handle the regulation of the biofuel energy industry (with analysis of the
incentives, regulatory constraints and taxes), with processes of technological diffusion and

INTRODUCTION
16
performance evaluation (Figure 1), these three major groups of knowledge were separated in
three different categories. One category handles with economic policies, the second focuses
on processes of technological diffusion of emerging technologies; and the final category
assesses the economical evaluation analysis of this technology.
Figure 1: Three studied categories in the algal biofuels market
For the economic policies category, an examination was created to point out the
main differences between policies around the world concerning algae biofuels and other
biofuels that could substitute fossil fuels, and how they have developed during the last years.
As this is an emerging energy market and, so far, there is no reliable and consistent data on
the performance of the microalgae industry, a policy review of biofuels was carried out to
point out some of the most efficient policies and technologies so far.
As for the technological evaluation analysis of microalgae biofuels, a qualitative
Deplhi Survey research was applied within an universe of worldwide algae biofuel experts.
The key objective of our Delphi study was to determine the prospects of using microalgae for
biofuels production within a time scale extending to 2030 and to identify the experts'
consensus pros and cons of this emerging technology. This method is especially suitable in
Processes of Technological
Diffusion
Technology Evaluation
Economic Policies
INTRODUCTION
17
judgment and long-range forecasting (20-30 years) situations, when expert opinions are often
the only source of information available, as is the case of this emergent industry, due to a lack
of appropriate historical, economic or technical data (Gupta and Clark, 1996).
Strictly linked with the previous categories, the subsequent category of this study
targeted to provide information regarding to the technology diffusion of recently found
energetic pathways, in particular to assess how they are developing and which are or were the
main barriers found along their diffusion. Besides a first stage of data collection, the methods
used to develop future diffusion pathways of emerging biofuels were a combination of the
Delphi Survey with experts and modeling future scenarios using Stochastic Automata
Networks (SANs).
For the scenario modeling, it was required widen levelized costs estimates that
represent the fundamental assumptions, so that biofuel cost estimates can be usefully
compared across technologies, taking into account the market value of the power generated
and the associated externalities. In this way, it was possible to draw several conclusions
related to the most effective public policies implemented so far and to present possible
scenarios that could demonstrate the dissemination of this emerging technology in the future.
1.4. Significance of the study
The focus of using renewable energy in the transport sector leads to reduced
dependence on oil, and consequently a reduction of the external trade deficit balance. Also,
the usage of biofuels based on algae or other crops oils could lead to reductions in the CO2
emissions, thereby contributing to tackle climate change by reducing greenhouse gases
emissions (IEA, 2012). Moreover, diversification of supply sources has the ambition to
increase security of supply by the endogenous production of fuels, essential to the transport
sector.
This is where the algal biofuels can really make a contribution to the future world
sustainability, since most studies confirmed the technical and biological feasibility to produce
biofuels in large quantities from microalgae. However, the research so far in this area is more

INTRODUCTION
18
scientific than technical, often related to areas such as biology or chemistry, pointing the need
to investigate in other spheres (namely, economical, social, environmental, technical and
practical implementation of new or improved technologies, and policies), so that policy
makers, industries or entrepreneurs can make the decision whether, or not, to invest in this
technology.
The study herein offered targets to fill-in, at least partially, the above-mentioned
gap by considering different categories of scenarios that exemplify some key drivers that may
have been restraining this technology successful path. Thus, this work could support, not only
private companies so that they could decide on the adequate method of cultivation/production
to explore, but would also benefit governments when deciding what policies to adopt to
enhance the diffusion of such technology.
1.5. Thesis overview
This thesis is organized in 6 Chapters. In this first Chapter, the introduction,
background, and definition of the problem, methodology and significance of the study were
presented. Afterwards, a literature review of microalgae as a feedstock for biofuels is
developed in Chapter 2. Biofuels diffusion and policies are discussed in Chapter 3. The
performed Delphi survey method and results are described in Chapter 4, while the diffusion
scenarios methods, results and discussion are presented in Chapter 5. Finally, conclusions are
drawn in Chapter 6.
LITERATURE REVIEW
19
2. LITERATURE REVIEW: MICROALGAE AS A BIOFUEL
FEEDSTOCK
This section gives an overview of algae, details the attributes of producing algae
biomass and describes the process of cultivating, harvesting and producing biomass. This
chapter also aims to provide a literature review of the relevant economic, environmental and
social assessments.
2.1. Algae cultivation techniques
Microalgae are photosynthetic organisms that can grow in a wide variety of
environments and conditions, including fresh, salty and brackish water (Benemann, 2012).
Their mechanism of photosynthesis is similar to higher plants, with the difference that the
conversion of solar energy is generally more efficient because of their simplified cellular
structure and more efficient access to water, CO2, and other nutrients.
“Its uniqueness that separates them from other microorganisms is due to presence of chlorophyll and having photosynthetic ability in a single algal cell, therefore allowing easy operation for biomass generation and effective genetic and metabolic research in a much shorter time period than conventional plants”.(Singh and Sharma, 2012; p.2348).
In addition, the cultivation requirements are quite small, as most species only need
water, CO2, and some essential nutrients such as nitrates and phosphates and potassium,
without needing the use of pesticides or fertilizers (Groom et al., 2008; Singh and Sharma,
2012). Microalgae can produce lipids, proteins and carbohydrates in large amounts over short
periods of time. For these reasons, microalgae are capable of producing 30 times as much oil
per unit of land area when compared to terrestrial oilseed (Sheehan et al., 1998). And this oil
can be processed into both biofuels and valuable co-products (Singh and Sharma, 2012).
The microalgae cultivation can be either heterotrophic or autotrophic. The
heterotrophic method is a biochemical conversion that relies on input feedstock derived from
an upstream photosynthetic source. This approach uses closed bioreactor systems in a
biochemical conversion process without light inputs. This dark fermentation process is based
on the consumption of simple organic carbon compounds, like sugars or acetate. The
cultivation of algae using cellulosic sugars produced from wood and agricultural wastes or
purpose grown energy crops is an area of active research and development (Buford et al.
2012).
On the other hand, the autotrophic cultivation requires only inorganic c
such as CO2, salts and a source of light energy for their growth. This photosynthetic
conversion involves two main methods: open ponds and closed photobioreactors
biomass produced in these autotrophic processes include lipids that can
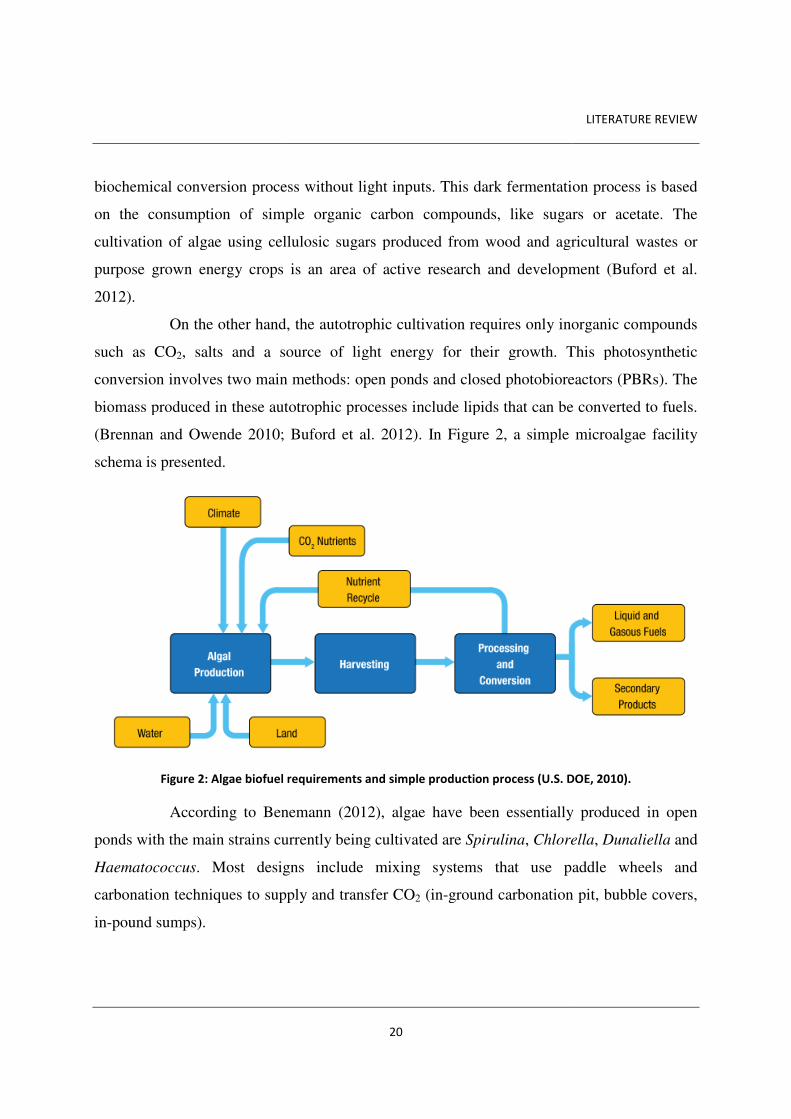
(Brennan and Owende 2010; Buford et al. 2012).
schema is presented.
Figure 2: Algae biofuel requirements and simple production process
According to Benemann (2012), algae have been essentially produced in open
ponds with the main strains currently being cultivated
Haematococcus. Most designs include mixing systems that use paddle wh
carbonation techniques to supply and transfer CO
in-pound sumps).
20
biochemical conversion process without light inputs. This dark fermentation process is based
on the consumption of simple organic carbon compounds, like sugars or acetate. The
tivation of algae using cellulosic sugars produced from wood and agricultural wastes or
purpose grown energy crops is an area of active research and development (Buford et al.
the other hand, the autotrophic cultivation requires only inorganic c
, salts and a source of light energy for their growth. This photosynthetic
conversion involves two main methods: open ponds and closed photobioreactors
biomass produced in these autotrophic processes include lipids that can be converted to fuels.
(Brennan and Owende 2010; Buford et al. 2012). In Figure 2, a simple microalgae facility
: Algae biofuel requirements and simple production process (U.S. DOE
According to Benemann (2012), algae have been essentially produced in open
ponds with the main strains currently being cultivated are Spirulina, Chlorella
. Most designs include mixing systems that use paddle wh
carbonation techniques to supply and transfer CO2 (in-ground carbonation pit, bubble covers,
LITERATURE REVIEW
biochemical conversion process without light inputs. This dark fermentation process is based
on the consumption of simple organic carbon compounds, like sugars or acetate. The
tivation of algae using cellulosic sugars produced from wood and agricultural wastes or
purpose grown energy crops is an area of active research and development (Buford et al.
the other hand, the autotrophic cultivation requires only inorganic compounds
, salts and a source of light energy for their growth. This photosynthetic
conversion involves two main methods: open ponds and closed photobioreactors (PBRs). The
be converted to fuels.
le microalgae facility
.S. DOE, 2010).
According to Benemann (2012), algae have been essentially produced in open
Chlorella, Dunaliella and
. Most designs include mixing systems that use paddle wheels and
ground carbonation pit, bubble covers,
LITERATURE REVIEW
21
Microalgae are also grown in tanks and small-scale photobioreactors (PBRs), in
hundreds of different systems around the world, producing from small amounts to huge sums
of biomass annually. In this closed autotrophic approach, algae grow with sunlight or artificial
lighting (Benemann, 2012; Buford et al., 2012). Different types of photobioreactors have been
designed and developed for cultivating algae, that can be horizontal, vertical, tubular, flat, etc.
(Benemann, 2012; Singh and Sharma, 2012). Each of these photobioreactors has their own
advantages and disadvantages. Several studies are being developed which may overcome their
limitations in the years to come (Singh and Sharma, 2012).
2.1.1. Comparing open ponds and photobioreactors systems
Commercial algae production facilities employ both open and closed cultivation
systems. Each of these present advantages and disadvantages, but both require high capital
input (Pienkos and Darzins, 2009). Open ponds are cheaper than closed systems because it
demands relatively high capital and operations and management (O&M) costs associated with
installation and operation of PBRs (Benemann, 2012; Buford et al., 2012).
Lower costs and the possibility to scale up to several hectares turn open ponds the
main choice for algae commercial production (Benemann, 2012). However, open pond
cultures suffer from many limitations that can disrupt algal productivity during unexpected
environmental events. Another challenge for this system includes having access to an
adequate supply of water for growth due to continuing loss of water through evaporation.
Therefore, open ponds must be in a geographic setting that has a fairly near source of water
and a relatively flat terrain to avoid costly earthworks (Buford et al., 2012). Moreover, the
open systems are susceptible to wind-born biological agents that can affect the cultivation,
such as grazers, infectious fungi, lytic bacteria, viruses, other algae, etc., and also lower
temperatures in colder climates (Benemann, 2012).
These open pond limitations stimulate PBRs development, however, only a few
commercial plants use closed PBRs, mainly due to high costs as abovementioned. Nowadays,
according to Benemann (2012) microalgae cannot be grown in PBRs for biofuels and are not
even successful for high value products. However, PBRs can be used for seed culture

LITERATURE REVIEW
22
production, though only for ~0.1% of the biomass. Closed photobioreactors are significantly
more expensive to construct, but have not been engineered to the extent of other reactors in
commercial practice, and so there may be opportunities for significant cost reductions.
Neither open ponds nor closed photobioreactors are mature technologies.
Therefore, until large-scale systems are built and operated over a number of years, many
uncertainties will remain. Cultivation issues for both open and closed systems, such as reactor
construction materials, mixing, optimal cultivation scale, heating/cooling, evaporation, O2
build-up, and CO2 administration, have been considered and explored to some degree, but
more definitive answers await detailed and expansive scale-up evaluations (Pienkos and
Darzins, 2009).
Concerning the various algal species and strains, they vary from study to study,
depending on location and culture techniques. For that reason it is not yet possible to predict
what species or strain will be the best suited for commercial biofuel production, but it is most
likely that it will differ from case to case, depending on the location, cultivation techniques
chosen, processing technologies available, nutrients source, local climacteric conditions,
among other potential factors.
2.1.2. Harvesting methods
The algal biomass production process requires one or more solid-liquid separation
steps. Generally, first stage involves a separation of biomass from the bulk suspension
(including flocculation, flotation or gravity sedimentation). The second stage (thickening)
raises the concentration of the slurry through techniques such as centrifugation, filtration and
ultrasonic aggregation; hence, it is generally a more energy intensive step than bulk
harvesting (Brennan and Owende, 2010).
The flocculation is the first (preparatory) stage that is intended to aggregate the
microalgae cells in order to increase the effective ‘‘particle’’ size. Unlike flocculation,
flotation methods are based on the trapping of algae cells, using dispersed micro-air bubbles.
Gravity and centrifugation sedimentation methods are based on characteristics of suspended
solids and are determined by density and radius of algae cells and sedimentation velocity. It is

LITERATURE REVIEW
23
the most common harvesting technique for algae biomass in wastewater treatment because of
the large volumes treated and the low value of the biomass generated. The filtration process is
better suited for harvesting relatively large (>70mm) microalgae such as Coelastrum and
Spirulina. The membrane microfiltration and ultra-filtration (hydrostatic pressure) are viable
alternatives to recovery of biomass from smaller algae cells (<30mm), like Dunaliella and
Chlorella (Brennan and Owende, 2010). Some species are much easier to harvest, considering
algae densities and size. The strain characteristics, cost and energy efficiency are the main
factors to select harvesting technology (Brennan and Owende 2010).
2.1.3. Extraction of algae oil
The common techniques for oil extraction are mechanical pressing, the usage of
solvents and supercritical fluid extraction. Each of these different methods presents its own
advantages and disadvantages. The oil extraction method can be divided into expression and
ultrasonic-assisted extraction and the efficiency normally ranges from 70 to 75% (Rengel,
2008). The main drawback of this method is that it generally requires drying the algae
beforehand, which is an energy intensive step.
Using solvents such as n-hexane, benzene, ethanol, chloroform and diethyl ether
can efficiently extract the fatty acids from algae cells. However, the use of chemicals in the
process could present environmental, safety and health issues. In many cases, manufacturers
of algae oil use a combination of mechanical pressing and chemical solvents in extracting oil
to improve efficiency (around 95%).
Supercritical extraction requires high-pressure equipment that is both expensive
and energy intensive. In this process, carbon dioxide is heated and compressed until it reaches
a liquid-gas state. Then, it is applied to the harvested algae and acts like a solvent (Mendes et
al., 1995; Ferreira et al., 2013).
Apart from these, there are some other more expensive and less known and
utilized methods which are enzymatic extraction that uses enzymes to degrade the cell walls
with water acting as the solvent; and osmotic shock, that is a sudden reduction in osmotic
pressure that can cause cells in a solution to rupture.

LITERATURE REVIEW
24
Once the oil is extracted through these methods it is referred to as "green crude".
However, it is not ready to be used as biofuel until it undergoes a process
called transesterification. This step is a chemical reaction in which triglycerides of the oil
react with methanol or ethanol to produce (m)ethyl esters and glycerol (Rengel, 2008). This
reaction creates a mix of biodiesel and glycerol that is further processed to be separated and
leaves ready to use biodiesel.
Direct conversions from a non-dry state are being studied and some possibilities
that may play an important role in offsetting the costs and improve oil extraction efficiency
are arising. Among these, it is important to highlight in situ transesterification and
hydrothermal liquefaction (Chen et al., 2009; Patil et al., 2008). Nevertheless, due to limited
level information in these processes for algae, more research in these subjects is still
desirable.
Meanwhile, work is being made to reduce energy input and costs of extraction
processes. Many industries claim they have come up with cost-effective methods in this area,
however, until large scale facilities are deployed it is hard to tell which one will work in a
large scale basis.
The whole algae, bio oil or the residues from oil extraction are excellent feedstock
for making other fuels and products via different processes. Some of these products will be
presented in the next section.
2.2. Products and processes
Microalgae have been studied for many years for production of goods and special
human foods and animal feeds. Moreover, algae can generate a wide range of biofuels,
including biohydrogen, methane, oils (triglycerides and hydrocarbons, convertible to
biodiesel, jet fuels, etc.), and, to a lesser extent, bioethanol. Meanwhile, these products
creation involves different processes such as biochemical and thermochemical conversions or
chemical separation or a direct combustion (Huesemann et al., 2010). Like a refinery, it is still
LITERATURE REVIEW
25
possible to obtain other non-energy products in the cultivation of microalgae, such as
cosmetics, animal feed, nutraceuticals, among others.
Subhadra and Edwards (2011) analyzed algal biorefinery-based integrated
industrial sector that produce primary biofuel (biodiesel) and co-products such as algal meal
(AM), omega-3 fatty acids (O3FA) and glycerin. They demonstrated that biorefineries have a
clear market for AM and O3FA up to a certain level, thereafter, diversification for other co-
products is desirable. However, co-product market analysis and water footprint (WFP) of
algal biorefineries need to be studied before large scale deployment and adoption. In addition,
Benemann (2012) argued that saying that "animal feeds could be readily co-produced with
algae biofuels are incorrect”; because there are significant differences in the processes focus,
quantities production, volume and market values, comparing co-products with biofuels.
However, algal biofuel can be integrated with aquaculture to treat the wastes.
2.2.1. Human and animal products
The commercial potential for microalgae represents a largely untapped resource,
once there is a huge number of algae species. Some microalgae are mainly used to human
nutrition, but are suitable for preparation of animal feed supplements. Like a biorefinery, it is
possible to produce from biofuel and co-products (especially glycerin) to pigments and
nutraceuticals.
The production of microalgae started in the early 1960s with the culture of
Chlorella as a food additive and had expanded in others countries (Japan, USA, India, Israel,
and Australia) until 1980s (Brennan and Owende, 2010). The oil (triglycerides) extract from
microalgae Chlorella, produced by dark fermentation, has high nutrient value and protein
content, and their omega-3 fatty acid – DHA has been used as an ingredient in infant formulas
(Brennan and Owende, 2010; Benemann, 2012). D. salina, is exploited for its b-carotene
content. Many strains of cyanobacteria (e.g. Spirulina) have been studied to “produce the
neurotoxin β-N-Methylamino-L-alanine (BMAA) that is linked to Amyotrophic Lateral
Sclerosis (Lou Gehrig's Disease) (ALS) and Alzheimer’s disease.” (Brennan and Owende,
2010 p. 572). The human consumption of microalgae biomass is restricted to very few species
LITERATURE REVIEW
26
(Chlorella, Spirulina and Dunaliella species dominate the market) due to the strict food safety
regulations, commercial factors, market demand and specific preparation. According to
Subhadra and Edwards (2011; p.3520),
“a market survey of global algal producers indicated that more companies are planning to grow algae and extract the O3FA to market to consumers […] an immediate market of 0.2– 0.4 million ton can be foreseen for algal based O3FA. A small portion can be further refined for marketing as human nutraceuticals and a significant portion for fortifying the AM produced as a co-product by algal biofuel refineries.”
In the end of biodiesel production, it is possible to obtain a significant amount of
glycerin that has a clear existing market from many industries such as paint and
pharmaceuticals. Some studies “have also shown that glycerin in turn can be effectively
utilized to grow more algal biomass, another viable method of using glycerin in algal biofuel
industry” (Subhadra and Edwards, 2011; p.3520).
Although the microalgae biomass is being produced essentially to human
nutritional products, perhaps it is most attractive as animal feeds (Benemann, 2012). Algae
are the natural food source of aquaculture species such as molluscs, shrimps and fish. In
addition, it assists the stabilization, improvement and enhancement of the immune systems of
these cultures (Brennan and Owende, 2010). They possess high protein rate (typical 50%) and
energy content (~20 MJ/kg) and high concentrations of astaxanthin (used in salmon feed) and
valuable carotenoids (e.g. lutein - used in chicken feed). Microalgae has also a long-chain of
omega-3 fatty acids to replace fish meal/oil (Benemann, 2012).
2.2.2. Energetic products
As stated before, like in a refinery, it is still possible to obtain other products in
the cultivation of microalgae, such as methane, biohydrogen and ethanol. Some examples of
these possibilities are presented as follows.
2.2.2.1. Methane
Since early studies on microalgae biofuels the production of methane biogas
production by anaerobic digestion of biomass was a main focus (Benemann, 2012). This
microbial conversion (of organic matter into biogas) produces a mixture of methane, CO2,
LITERATURE REVIEW
27
water vapor, small amounts hydrogen sulfide and sometimes hydrogen (Gunaseelan, 1997
apud Huesemann et. al., 2010). This process has been successfully and economically viable
despite the recalcitrance of some algal species to biodegradation and inhibition of the
conversion process by ammonia released from the biomass (Benemann, 2012; Huesemann et.
al., 2010). According to Huesemann et al. (2010; p.169):
“Methane generation by anaerobic digestion can be considered to be the default energy conversion process for microalgal biomass, including algal biomass produced during wastewater treatment and for the conversion of residuals remaining after oil extraction or fermentation to produce more valuable liquid fuels. ”
2.2.2.2. Hydrogen
There are three main processes to produce hydrogen from microalgae: dark
fermentation; photo-fermentation and biophotolysis. The first involves anaerobic conversion
of reduced substrates from algae, such as starch, glycogen, or glycerol into hydrogen,
solvents, and mixed acids. Secondly, these organic acids “can be converted into hydrogen
using nitrogen-fixing photosynthetic bacteria in a process called photofermentation.” The
latter, biophotolysis processes use microalgae to catalyze the conversion of solar energy and
water into hydrogen fuel, with oxygen as a byproduct (Huesemann et. al., 2010). Although
these mechanisms were successfully proven in laboratory scale, they have not yet been
developed as a practical commercial process to produce hydrogen from algae (Huesemann et
al., 2010; Ferreira et al., 2013).
2.2.2.3. Ethanol
On the other hand, ethanol can be generated from two alternative processes:
storage carbohydrates (fermented with yeast) or endogenous algal enzymes (Benemann, 2012;
Huesemann et. al., 2010). The main process is “yeast fermentation of carbohydrate storage
products, such as starch in green algae, glycogen in cyanobacteria, or even glycerol
accumulated at high salinities by Dunaliella” (Sayadi et al., 2011). A self-fermentation by
endogenous algal enzymes induced in the absence of oxygen has been reported for
Chlamydomonas. Against the very low ethanol yield from fermentation, several private
companies are now reported to be developing ethanol fermentations.
LITERATURE REVIEW
28
2.2.2.4. Electricity and Gasification
The microalgae biomass can be dried and combusted to generate electricity, but
the drying process is fairly expensive even if solar drying is employed. The combustion and
thermal process can destroy the nitrogen fertilizer content of the biomass and generate
elevated emissions of NOx. In addition, the combustion process competes with coal and wood
biomass that are cheaper than microalgae biomass (Huesemann et al., 2010). Although
expensive, this can be a key factor for algae to achieve energetic balance and improve its
sustainability as presented in the "environmental assessment" section. Effusive research is
being carried in new and more effective drying techniques in order to reduce costs and
impacts.
2.2.2.5. Oil
The significant quantities of neutral lipids, primarily as triacylglycerols, can be
extracted from the biomass (green algae and diatoms) and converted into biodiesel or green
diesel as substitutes for petroleum-derived transportation fuels. “Lipid biosynthesis is
typically triggered under conditions when cellular growth is limited, such as by a nutrient
deficiency, but metabolic energy supply via photosynthesis is not” (Roessler, 1990 apud
Huesemann, et. al., 2010; p.170).
The biodiesel produced from algal oil has physical and chemical properties
similar to diesel from petroleum, to 1st generation biodiesel produced from crops, and
compares favorably with the International Biodiesel Standard for Vehicles (EN14214) and
other national and international norms (Brennan and Owende, 2010).
Algal biocrude could also be produced and mixed with fossil oil in existing oil
refineries. When compared to petroleum-derived fuels, algal biocrude can offer several
advantages due to its elemental composition, low sulfur content, and relative lack of heavy
metals (Liu et al., 2013).
LITERATURE REVIEW
29
2.2.3. Other products
There are several other products that can be produced from microalgae
cultivation. From them, special attention should be given to Glycerol (1,2,3-propanetriol or
glycerin) that is a byproduct obtained during the production of biodiesel (Demirbas and
Demirbas, 2010). Crude glycerol is the principal byproduct of biodiesel production, which
accounts for about 10 wt% of vegetable oil. For every 9 kg of biodiesel produced, about 1 kg
of a crude glycerol byproduct is formed (Dasari et al., 2005).
Jet fuels can also be made from microalgae, making it very interesting for the air
transportation lack of biofuel options so far. In the same manner, algae biofuel can be made
for marine engines and have already been tested in both industries with positive results
(Stratton, Wong and Hileman, 2010). Other possibilities of production are biopolymers, P-
series fuels, Dimethyl ethers, biofertilizers, among others.
2.2.4. Processes schematics
The main petroleum-based fuels are gasoline and diesel. When biomass is used in
the production of biofuels, using different processes, different products can be obtained, such
as sugar ethanol, cellulosic ethanol, grain ethanol, biodiesel, pyrolysis liquids, green diesel,
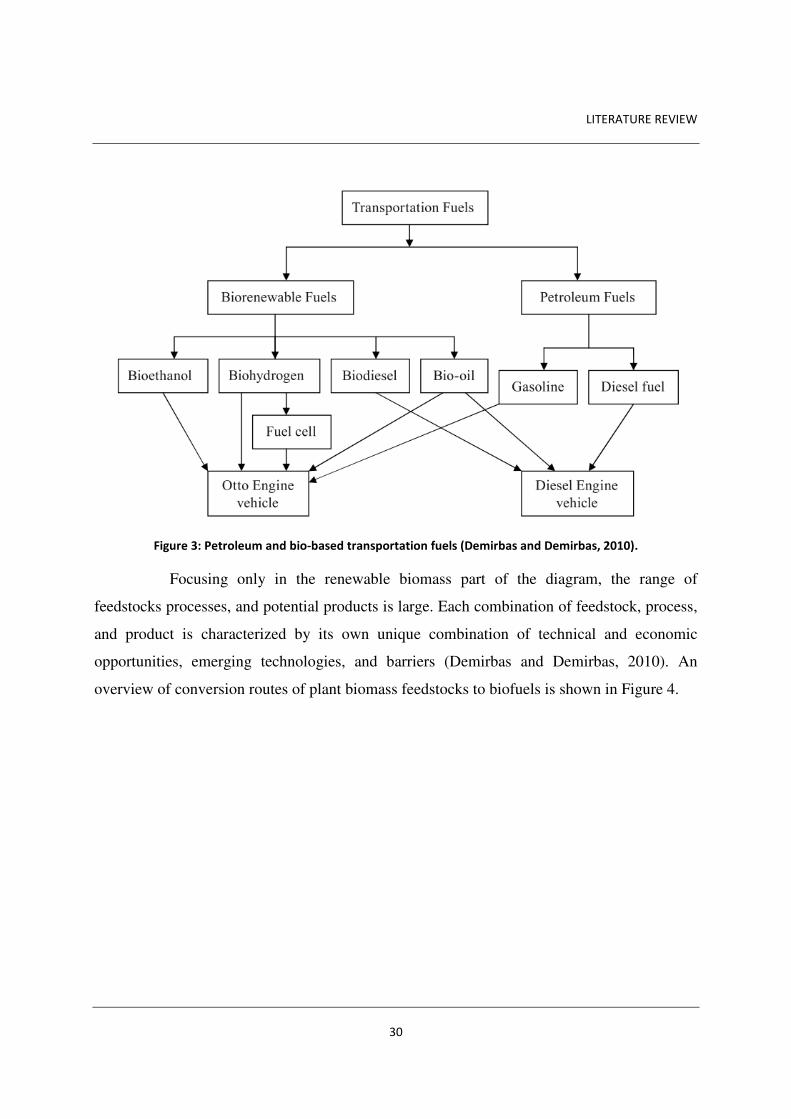
green gasoline, butanol, methanol, syngas liquids, biohydrogen, algae diesel, algae jet fuel,
and hydrocarbons (Demirbas and Demirbas, 2010). Petroleum-based and bio-based
transportation fuels are presented in Figure 3.
LITERATURE REVIEW
30
Figure 3: Petroleum and bio-based transportation fuels (Demirbas and Demirbas, 2010).
Focusing only in the renewable biomass part of the diagram, the range of
feedstocks processes, and potential products is large. Each combination of feedstock, process,
and product is characterized by its own unique combination of technical and economic
opportunities, emerging technologies, and barriers (Demirbas and Demirbas, 2010). An
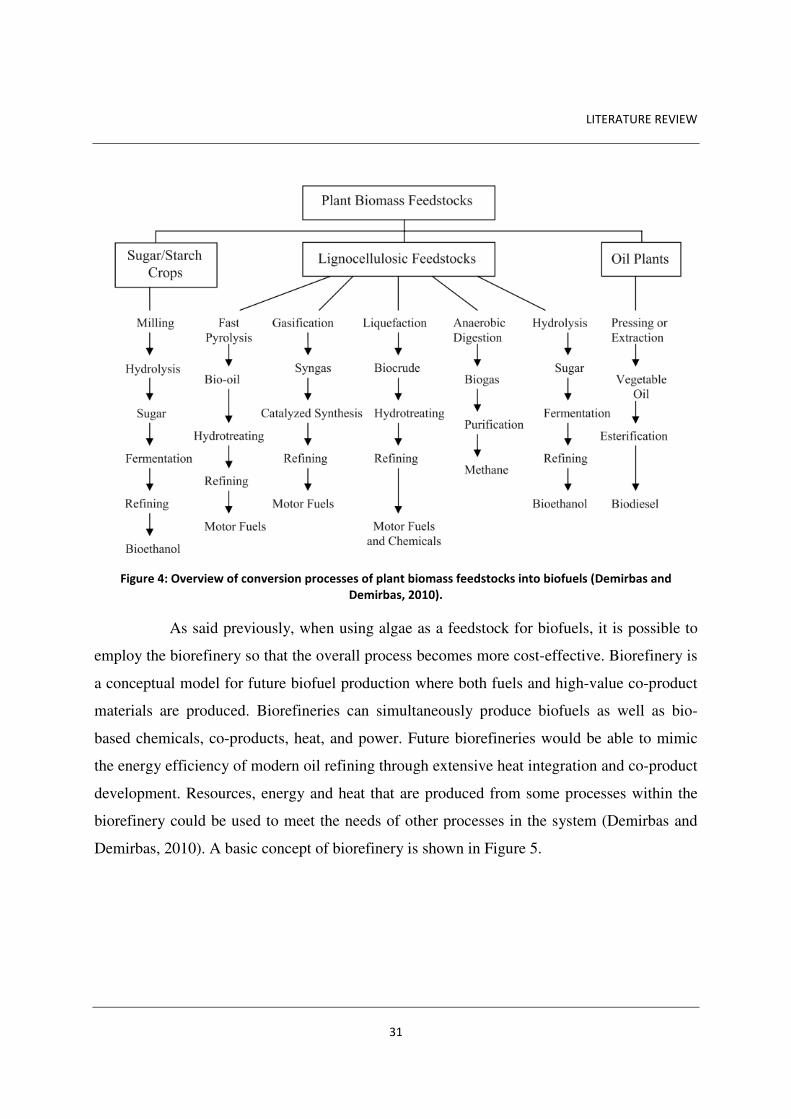
overview of conversion routes of plant biomass feedstocks to biofuels is shown in Figure 4.
LITERATURE REVIEW
31
Figure 4: Overview of conversion processes of plant biomass feedstocks into biofuels (Demirbas and
Demirbas, 2010).
As said previously, when using algae as a feedstock for biofuels, it is possible to
employ the biorefinery so that the overall process becomes more cost-effective. Biorefinery is
a conceptual model for future biofuel production where both fuels and high-value co-product
materials are produced. Biorefineries can simultaneously produce biofuels as well as bio-
based chemicals, co-products, heat, and power. Future biorefineries would be able to mimic
the energy efficiency of modern oil refining through extensive heat integration and co-product
development. Resources, energy and heat that are produced from some processes within the
biorefinery could be used to meet the needs of other processes in the system (Demirbas and
Demirbas, 2010). A basic concept of biorefinery is shown in Figure 5.
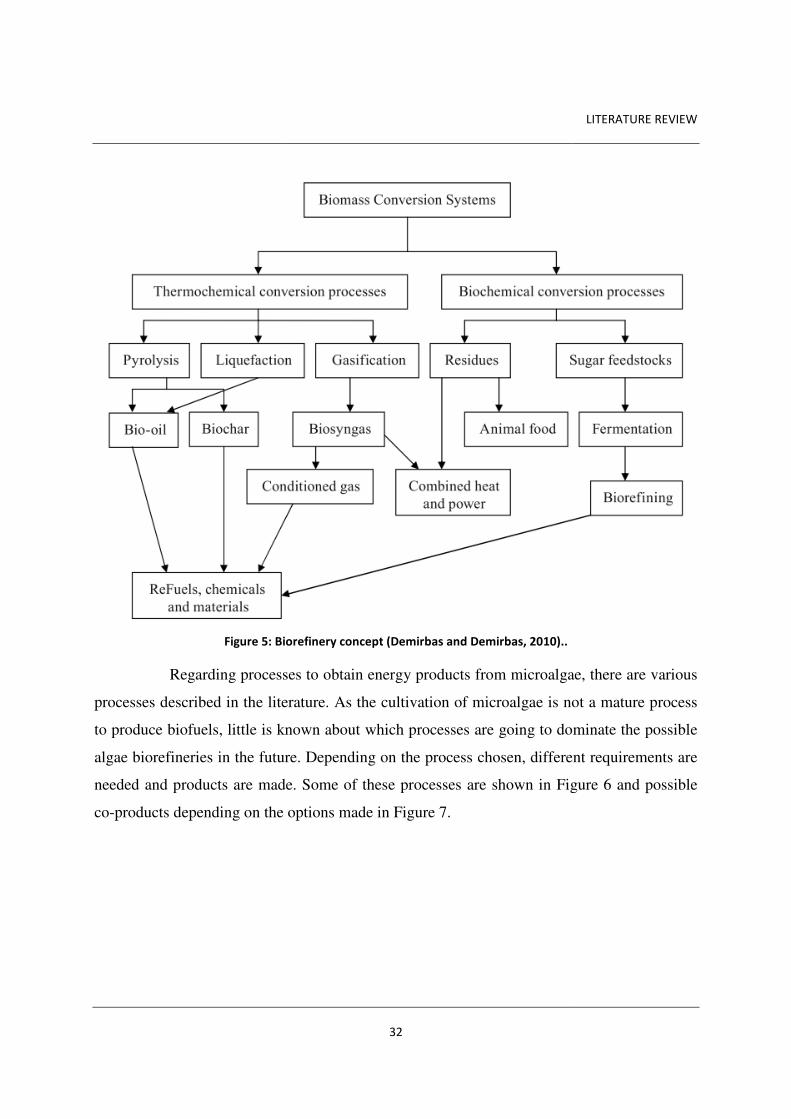
Figure 5: Biorefinery concept
Regarding processes to obtain energy products from m
processes described in the literature. As the cultivation of microalgae is not a mature process
to produce biofuels, little is known about which processes are going to dominate the possible
algae biorefineries in the future. De
needed and products are made. Some of these processes are shown in
co-products depending on the options made in
32
: Biorefinery concept (Demirbas and Demirbas, 2010)..
Regarding processes to obtain energy products from microalgae, there are various
processes described in the literature. As the cultivation of microalgae is not a mature process
to produce biofuels, little is known about which processes are going to dominate the possible
algae biorefineries in the future. Depending on the process chosen, different requirements are
needed and products are made. Some of these processes are shown in Figure
products depending on the options made in Figure 7.
LITERATURE REVIEW
icroalgae, there are various
processes described in the literature. As the cultivation of microalgae is not a mature process
to produce biofuels, little is known about which processes are going to dominate the possible
pending on the process chosen, different requirements are
Figure 6 and possible
LITERATURE REVIEW
33
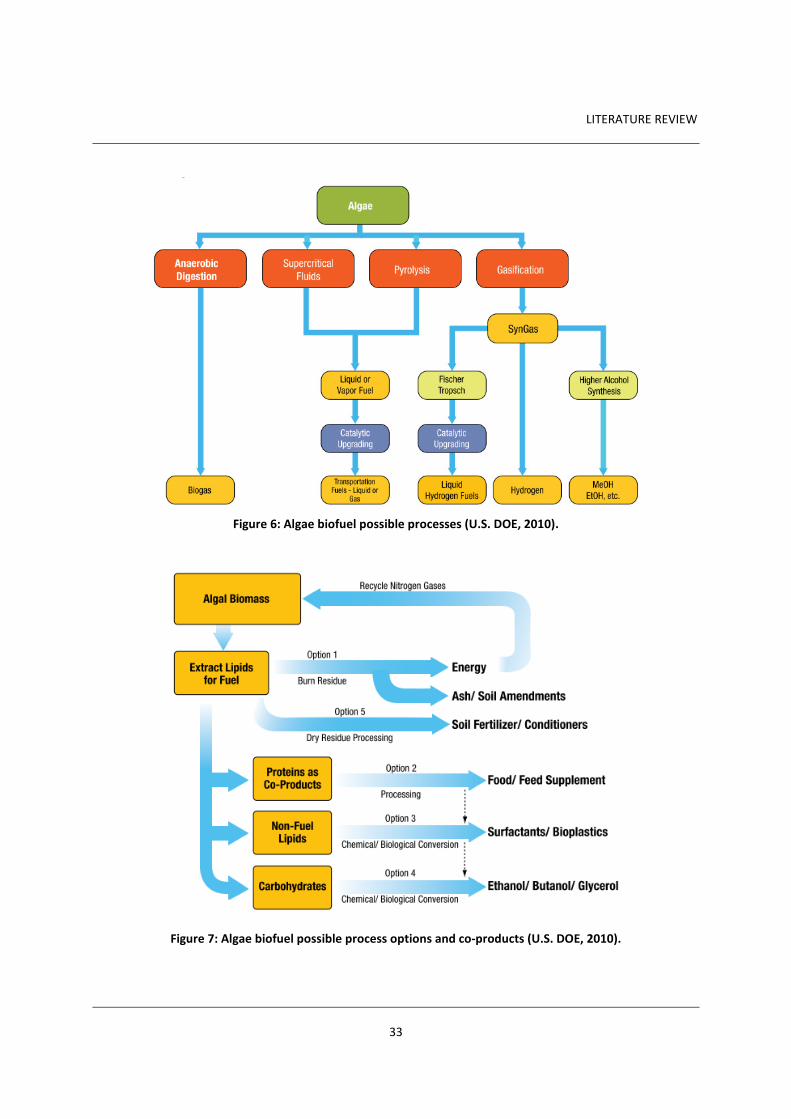
Figure 6: Algae biofuel possible processes (U.S. DOE, 2010).
Figure 7: Algae biofuel possible process options and co-products (U.S. DOE, 2010).
LITERATURE REVIEW
34
A lot of research is been carried in many of these processes so that the overall
efficiency in terms of productivity, economical feasibility and environmental impact are
enhanced. Unfortunately, so far it is difficult to predict which processes and co-products are
going to be the chosen ones in order to maximize the algae biofuel potential.
2.2.5. Productivity and lipid content
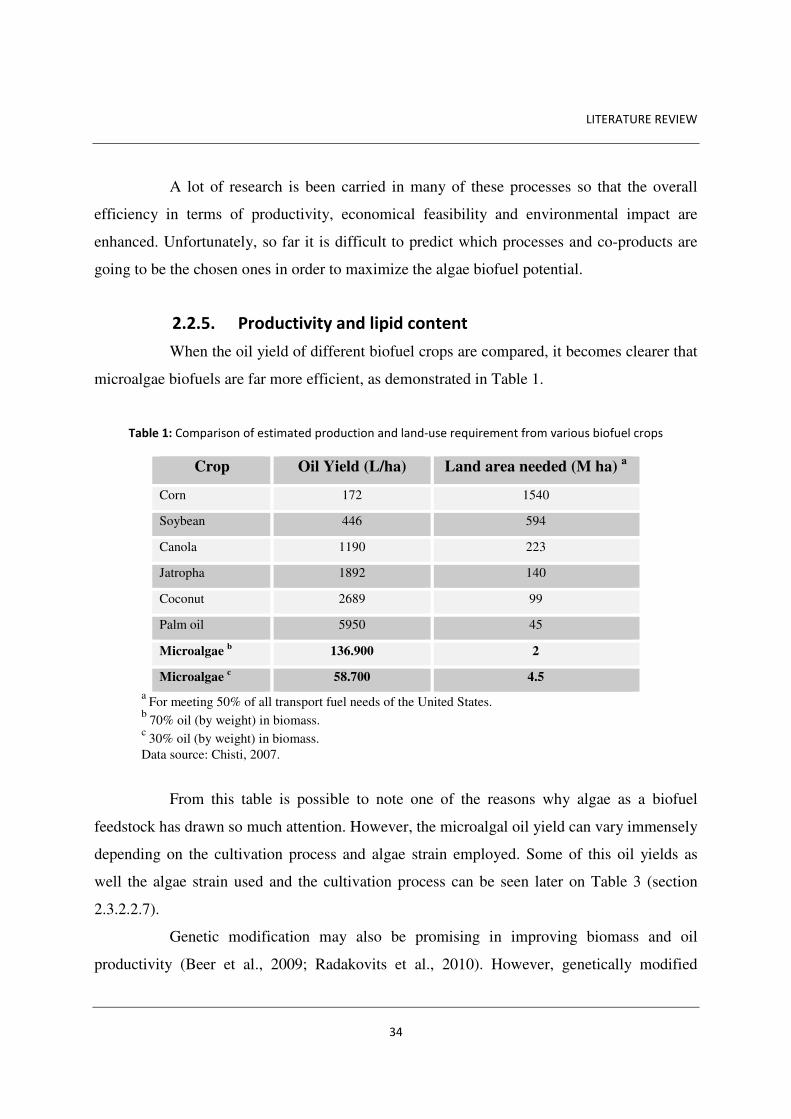
When the oil yield of different biofuel crops are compared, it becomes clearer that
microalgae biofuels are far more efficient, as demonstrated in Table 1.
Table 1: Comparison of estimated production and land-use requirement from various biofuel crops
Crop Oil Yield (L/ha) Land area needed (M ha) a Corn 172 1540
Soybean 446 594
Canola 1190 223
Jatropha 1892 140
Coconut 2689 99
Palm oil 5950 45
Microalgae b 136.900 2
Microalgae c 58.700 4.5
a For meeting 50% of all transport fuel needs of the United States.
b 70% oil (by weight) in biomass.
c 30% oil (by weight) in biomass.
Data source: Chisti, 2007.
From this table is possible to note one of the reasons why algae as a biofuel
feedstock has drawn so much attention. However, the microalgal oil yield can vary immensely
depending on the cultivation process and algae strain employed. Some of this oil yields as
well the algae strain used and the cultivation process can be seen later on Table 3 (section
2.3.2.2.7).
Genetic modification may also be promising in improving biomass and oil
productivity (Beer et al., 2009; Radakovits et al., 2010). However, genetically modified
LITERATURE REVIEW
35
highly resilient algae species could have very important and negative impacts on native algal
species and to marine and freshwater ecosystems in general (Passell et al., 2013). The overall
sustainability of algae biofuels is presented in the succeeding section.
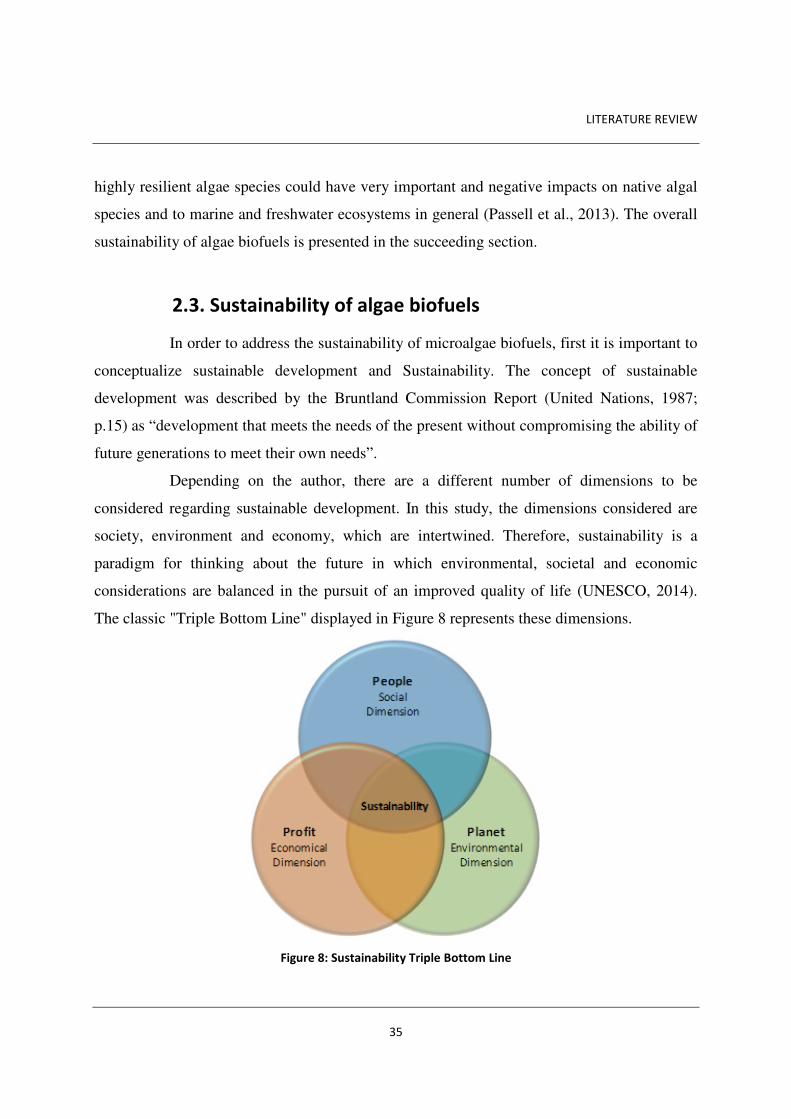
2.3. Sustainability of algae biofuels
In order to address the sustainability of microalgae biofuels, first it is important to
conceptualize sustainable development and Sustainability. The concept of sustainable
development was described by the Bruntland Commission Report (United Nations, 1987;
p.15) as “development that meets the needs of the present without compromising the ability of
future generations to meet their own needs”.
Depending on the author, there are a different number of dimensions to be
considered regarding sustainable development. In this study, the dimensions considered are
society, environment and economy, which are intertwined. Therefore, sustainability is a
paradigm for thinking about the future in which environmental, societal and economic
considerations are balanced in the pursuit of an improved quality of life (UNESCO, 2014).
The classic "Triple Bottom Line" displayed in Figure 8 represents these dimensions.
Figure 8: Sustainability Triple Bottom Line
LITERATURE REVIEW
36
In the next sections the three dimensions abovementioned are discussed having
microalgae biofuels in line.
2.3.1. Environmental assessment
This section gathers a comprehensive literature review of the main findings from
algae-based biofuels production environmental impacts. Life cycle assessments (LCAs) of
published scientific papers and reports were used in the development of the subsequent
sections.
2.3.1.1. Land
The production of 1st generation biofuels being based on agricultural products,
where land is the main input, represents a shift in land use away from food production and
poses a global dilemma: the need to feed humanity versus the greater monetary returns to
farmers from agro-energy (Azar, 2003). This shift of land use increases food prices and
decrease stocks of food products, with respective decline of exports (Rathmann et al., 2010).
The increased pressure on arable land could also lead to severe food shortages, in a world
where already 842 million people suffer from hunger and malnutrition (FAO, 2013).
As opposed to first generation land-based biofuels produced from agricultural
feedstocks, cultivation of algae for biofuel does not necessarily use fertile agricultural land
(Iersel and Flammini, 2010; Pittman et al., 2011). Thus, if non-arable land is used in the
production of emerging biofuels, all the dire effects just mentioned will not occur. This is said
to be one of the main advantages of algae biofuels cultivation and production.
However, emerging biofuel technologies could become unsustainable if they
compete with food crops for available land. In this scenario, their sustainability would depend
on whether producers comply with criteria such as minimum lifecycle Greenhouse Gas
(GHG) reductions, including land use change and social standards (Eisentraut, 2010).
Another important requirement for cultivation is flat land, due to higher costs
associated with soil excavation and water pumping (Davis et al., 2012). Just to cite an
LITERATURE REVIEW
37
example of feasible land normally considered in algal biofuel studies, Davis et al. (2012; p.15)
from an Argonne and RNEL study characterize the usable land as
“From the suitable slope areas, only non-agricultural, undeveloped, or low-density developed, non-sensitive, generally non-competitive land was considered for microalgal culture facilities. Specifically, this excludes open water, urban areas, airports, cultivated cropland and orchards, federal and state protected areas such as national and state parks, wilderness areas, wildlife refuges, wetlands, and other areas that are deemed environmentally sensitive.”
With the possibility to use non-arable land, microalgae biofuel production has the
potential to provide benefits such as making use of abandoned land, promote rural
development and improve economic conditions in emerging and developing regions (Singh et
al., 2011). This could benefit vast regions in the globe that are not proper for agricultural
purposes and, in the present day, are not economically attractive.
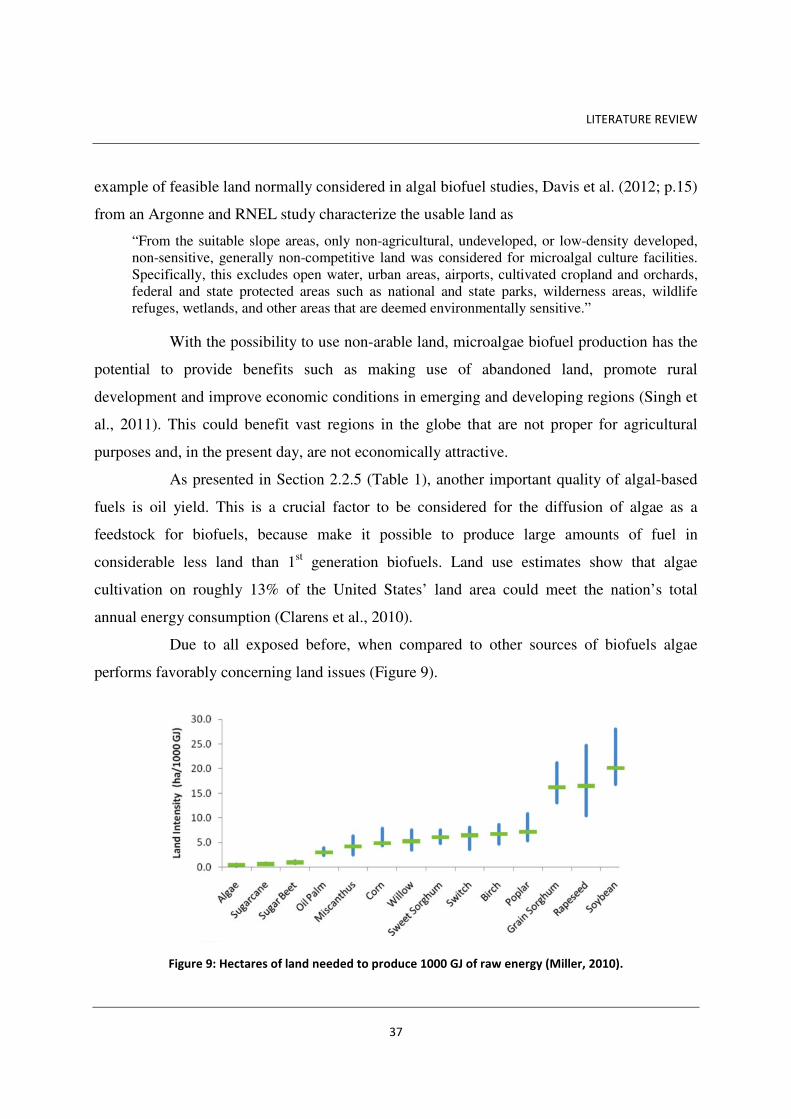
As presented in Section 2.2.5 (Table 1), another important quality of algal-based
fuels is oil yield. This is a crucial factor to be considered for the diffusion of algae as a
feedstock for biofuels, because make it possible to produce large amounts of fuel in
considerable less land than 1st generation biofuels. Land use estimates show that algae
cultivation on roughly 13% of the United States’ land area could meet the nation’s total
annual energy consumption (Clarens et al., 2010).
Due to all exposed before, when compared to other sources of biofuels algae
performs favorably concerning land issues (Figure 9).
Figure 9: Hectares of land needed to produce 1000 GJ of raw energy (Miller, 2010).
LITERATURE REVIEW
38
Regarding where are the best places to establish an algae biofuel facility, it is
important to take into account the easiness of source of water. Topic that will be discussed in
the next section.
2.3.1.2. Water
Water utilization is a key factor on the cultivation of microalgae where a regular
source of water supply is fundamental for this process of producing biofuels. As fresh water is
a natural resource with a highest consumption rate and increasingly scarce, it can be addressed
as a significant environmental concern in the development of algal biofuels, as water is the
essential medium of algae growth and many of the world’s aquifers are dealing with an
unsustainable level of water extraction (Mcgraw, 2009).
It is estimated that algae biofuel production will necessitate a significant amount
of annual water utilization. Pienkos (2007) has estimated that in order to displace the entire
U.S. diesel demand, which is more than 60 billion gallons per year, the water requirement
would be within the range of 16 – 120 trillion gallons of water per year, depending on the
efficiency of cultivation and production. Just for comparative purposes, around 5000 trillion
gallons of fresh water is used to irrigate the U.S. corn crops, main feedstock of current U.S.
biofuel industry (Barton and Clark, 2014).
Although the water issue could become a problem for the cultivation of algae
biofuels, one of the advantages of microalgae is that they can be effectively grown in
conditions which require minimal freshwater input, thus making the process potentially
sustainable with regard to pre-serving freshwater resources (Pittman et al., 2011). The main
reason for that is that many algae strains can be cultivated in saline or brackish water. For
example, microalgae could be cultivated near to the sea to utilize saline or brackish water and
minimize the use of freshwater. For this purpose, there has therefore been significant interest
in the growth of microalgae for biofuels under saline conditions (e.g. Rodolfi et al., 2009;
Takagi et al., 2006).
However, the need for high amounts of salt water could also generate some
concerns, as Mcgraw (2009; p.24) states:
LITERATURE REVIEW
39
“Salt water aquifers would, in this case, be the entities under threat resulting in the possible competition and dispute over a previously nearly untouched resource. Coastal operations present problems in coastal management as highly productive ecosystems are typical of coastal regions. Coastlines are naturally dynamic entities and movement will be artificially maintained through the construction of permanent structures under algal biofuels development. These issues can be managed to reduce changes to natural systems, but proper precaution is required.”
Even considering the above-mentioned issues, just the possibility of using saline
water instead of freshwater, like most of other agricultural-based biofuels, is an advance in the
biofuels industry. Nonetheless, the implementation of wide large-scale algae farming for
biofuel would raise new questions and concerns regarding saline water resources that need to
be addressed in the development this technology.
Ideally, most of algae farms would be located somewhere near (less than 50 km) a
saline source of water that would be used in cultivation. Since it is generally not desirable to
have to transport the water over long distances as costs will increase sharply in addition to
environmental and social impacts that may arise from implementing long distance pipelines
(Mcgraw, 2009).
Besides saline water, another great potential in the cultivation of microalgae is the
possibility to use wastewater (sewer) as a medium of cultivation and to recycle the water that
was used. These opportunities will be handled in the next section as they are closely related to
the nutrients that are needed for the algae cultivation.
2.3.1.3. Nutrients
Microalgae cultivation requires a constant supply of several inorganic nutrients,
such as nitrogen (N), phosphorous (P), and potassium (K) to maintain high algae yields. One
of the concerns regarding future algae large-scale cultivation is the high requirement of
nitrogen. Depending on how the cultivation process is managed, this high nitrogen
requirement can either have positive or negative impacts on the nitrogen cycle, as nitrogen
can be recycled and/or supplied by a waste source (Miller, 2010).
In this context, not only nitrogen requirements take advantage from using wastes,
as using municipal wastewaters (sewer) for making up for water and nutrients (C, N, P, etc.)
in the cultivation phase can be of great importance in the overall environmental sustainability
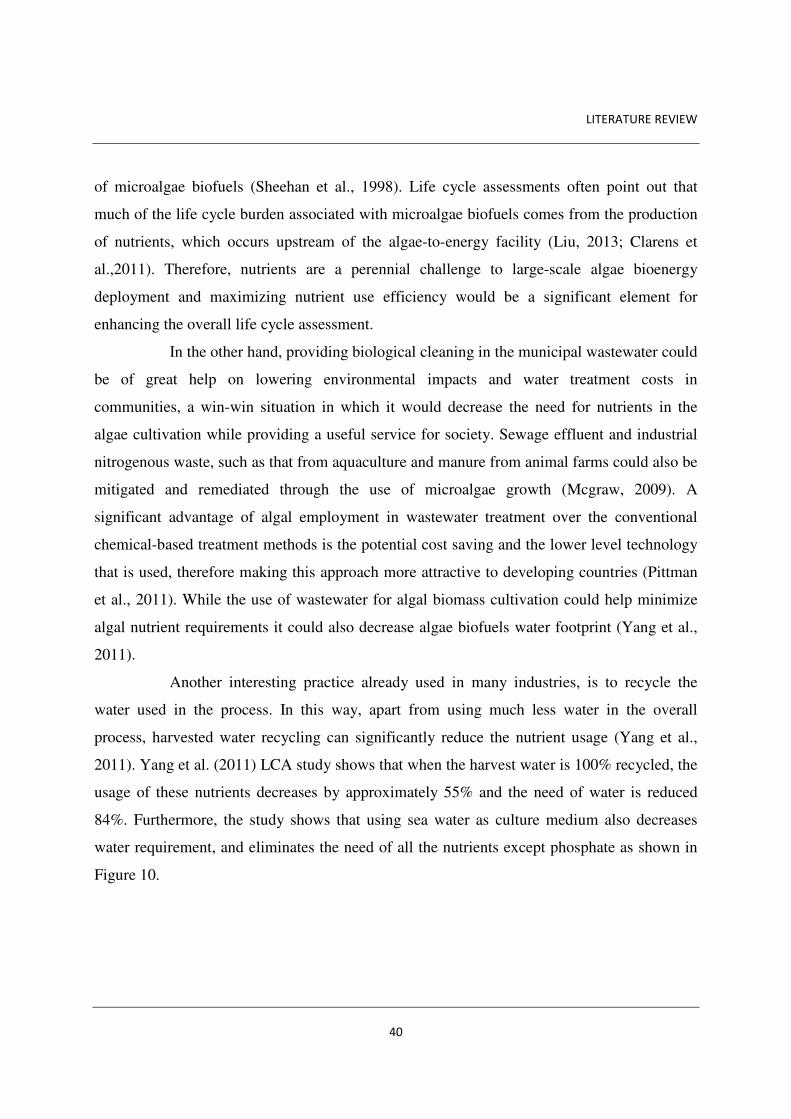
LITERATURE REVIEW
40
of microalgae biofuels (Sheehan et al., 1998). Life cycle assessments often point out that
much of the life cycle burden associated with microalgae biofuels comes from the production
of nutrients, which occurs upstream of the algae-to-energy facility (Liu, 2013; Clarens et
al.,2011). Therefore, nutrients are a perennial challenge to large-scale algae bioenergy
deployment and maximizing nutrient use efficiency would be a significant element for
enhancing the overall life cycle assessment.
In the other hand, providing biological cleaning in the municipal wastewater could
be of great help on lowering environmental impacts and water treatment costs in
communities, a win-win situation in which it would decrease the need for nutrients in the
algae cultivation while providing a useful service for society. Sewage effluent and industrial
nitrogenous waste, such as that from aquaculture and manure from animal farms could also be
mitigated and remediated through the use of microalgae growth (Mcgraw, 2009). A
significant advantage of algal employment in wastewater treatment over the conventional
chemical-based treatment methods is the potential cost saving and the lower level technology
that is used, therefore making this approach more attractive to developing countries (Pittman
et al., 2011). While the use of wastewater for algal biomass cultivation could help minimize
algal nutrient requirements it could also decrease algae biofuels water footprint (Yang et al.,
2011).
Another interesting practice already used in many industries, is to recycle the
water used in the process. In this way, apart from using much less water in the overall
process, harvested water recycling can significantly reduce the nutrient usage (Yang et al.,
2011). Yang et al. (2011) LCA study shows that when the harvest water is 100% recycled, the
usage of these nutrients decreases by approximately 55% and the need of water is reduced
84%. Furthermore, the study shows that using sea water as culture medium also decreases
water requirement, and eliminates the need of all the nutrients except phosphate as shown in
Figure 10.
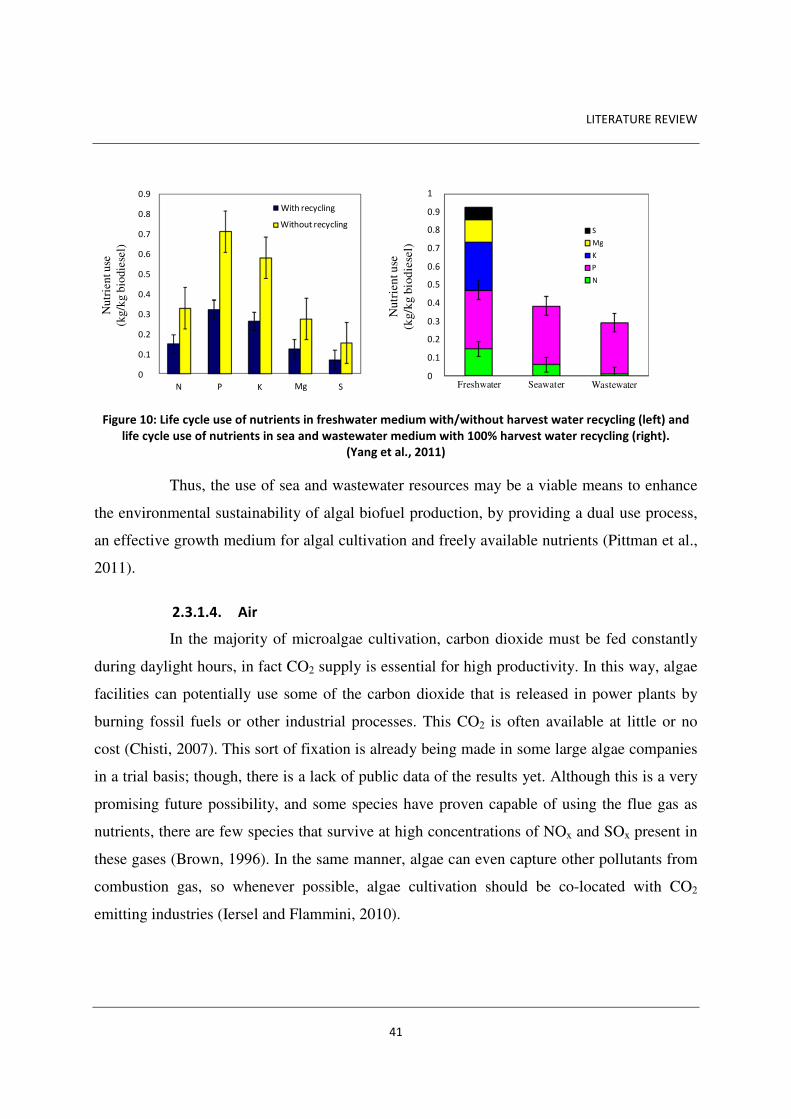
LITERATURE REVIEW
41
Figure 10: Life cycle use of nutrients in freshwater medium with/without harvest water recycling (left) and
life cycle use of nutrients in sea and wastewater medium with 100% harvest water recycling (right).
(Yang et al., 2011)
Thus, the use of sea and wastewater resources may be a viable means to enhance
the environmental sustainability of algal biofuel production, by providing a dual use process,
an effective growth medium for algal cultivation and freely available nutrients (Pittman et al.,
2011).
2.3.1.4. Air
In the majority of microalgae cultivation, carbon dioxide must be fed constantly
during daylight hours, in fact CO2 supply is essential for high productivity. In this way, algae
facilities can potentially use some of the carbon dioxide that is released in power plants by
burning fossil fuels or other industrial processes. This CO2 is often available at little or no
cost (Chisti, 2007). This sort of fixation is already being made in some large algae companies
in a trial basis; though, there is a lack of public data of the results yet. Although this is a very
promising future possibility, and some species have proven capable of using the flue gas as
nutrients, there are few species that survive at high concentrations of NOx and SOx present in
these gases (Brown, 1996). In the same manner, algae can even capture other pollutants from
combustion gas, so whenever possible, algae cultivation should be co-located with CO2
emitting industries (Iersel and Flammini, 2010).
SMgKPN
With recycling
Without recycling
0.9
0.8
0.7
0.6
0.5
0.4
0.3
0.2
0.1
0
Nu
trie
nt u
se
(kg
/kg
bio
die
sel)
Freshwater Seawater Wastewater
S
Mg
K
P
N
Nutr
ien
t use
(kg/k
g b
iod
iese
l)
1
0.9
0.8
0.7
0.6
0.5
0.4
0.3
0.2
0.1
0

LITERATURE REVIEW
42
Considering recent LCA studies, Liu et al. (2013) presented promising results
concerning the overall GHG emissions and Energy Return on Investment (EROI)
performance of producing biofuels from algae. This study is based on the results of a
hydrothermal liquefaction (HTL) pilot-scale facility in which they also presented lab scale
and a future full scale results. This study is of great importance because it was based on pilot-
scale data, while most of algae research so far are based on laboratory-scale research and
theoretical studies.
Liu et al. (2013) results demonstrate that the deployed algae-to-energy production
processes in the pilot-scale scenario have energy burdens and GHG emission profiles that are
comparable to or better than conventional biofuels, cellulosic ethanol and soybean biodiesel.
The GHG emissions comparison with other algae fuels processes are also lower than other
existing algae-to-energy processes based on transesterification as captured in the Meta-Model
of Algae Bio-Energy Life Cycles (MABEL) (Liu et al., 2013). Their results are shown in
Figure 11.
Figure 11: The EROI ratio and GHG emissions/MJ of (a) algae-derived diesel and (b) algae-derived gasoline
produced using HTL (Liu et al.,2013).
The results are benchmarked against commercialized biodiesel or bioethanol as well as petroleum-derived versions of the drop-in fuels. Better outcomes are in the upper left hand corner of the plots (i.e., high EROI, low GHG emissions). Error bars correspond to 90% confidence intervals from the Monte Carlo simulations carried out here. The estimates came from (Hill et al., 2006) for soybean biodiesel; (California Air Resources Board, 2009; Wang, 2009) for cellulosic ethanol; (Frank et al., 2011; Wang, 2009; Farrell et al., 2006) for corn ethanol; and (Liu et al.,2012) for MABEL.
For analyzing the graph, the lower the life cycle GHG emissions the better and the
higher the EROI the better, making it desirable fuels that appear in the top left hand side of
LITERATURE REVIEW
43
both graphs. A separate analysis of the presented results show that the pilot-scale EROI is
approximately 1, however, with the increase in efficiency and scale the full-scale scenario
could reach an EROI between 2.5 and 3, using the described technology. Nonetheless, it is
important to stress that EROI metrics ignores market factors that would make some energy
outputs (e.g., liquid fuels) more desirable than others (e.g., CH4) (Liu et al., 2013).
It is also important to notice that the soybean biodiesel results presented does not
incorporate indirect land use effects, which are important factors influencing the carbon
accounting of 1st generation biofuels. Although, these effects were also not considered for
algae, it is expected that algae’s indirect land use carbon impacts will be much smaller than
those of other crops because algae can be cultivated on marginal land as already discussed in
Section 2.3.1.1.
Others LCAs accounted for microalgae biofuels production GHG emissions and
EROI, with different results. Regarding GHG emissions, in Zaimes and Khanna (2013)
results, life cycle GHG emissions accounted for -46.2 to 48.9 g CO2 eq/MJ-biomass, while
Campbell et al. (2011) GHG emissions ranged from -27.6 to 18.2 g CO2 eq/MJ-biomass.
Batan et al. (2010), considering a pond-to-pump system boundary, found net GHG emissions
comparable to the net GHG emissions for soy biodiesel, and much more favorable than the
net GHG emissions for conventional diesel. Sander and Murthy (2010) also using the pond-
to- pump system boundary, found GHG emissions both greater and lesser than those for
conventional gasoline depending on different algae processing steps. Clarens et al. (2010)
base case found that GHG emissions were much greater than canola, corn, and switchgrass
feedstocks, although cultivation using waste CO2 and wastewater nutrients could reduce those
burdens. Passell et al. (2013) results for the base case and the future case show a Global
Warming Potential (GWP) of 2.9 and 0.18 kg CO2-equivalent, respectively. In comparison,
petroleum diesel and soy diesel and GWP of 0.12 and 0.025, respectively. Frank et al. (2012)
results from the baseline scenario produced 55400g CO2 equivalent per MBtu of algae
biodiesel compared to 101000g for low-sulfur petroleum diesel. Their analysis considered the
potential for greenhouse gas emissions from anaerobic digestion processes commonly used in
algal biofuel models.
LITERATURE REVIEW
44
Regarding energy use, Clarens et al. (2010) found that energy use were much
higher when compared to canola, corn, and switchgrass feedstocks. However, Clarens et al.
(2011) built upon their earlier study and found a net positive energy balance for various
combinations of algae biodiesel production coupled with use of waste CO2 and wastewater
nutrients when compared to terrestrial feedstocks. Zaimes and Khanna (2013) EROI results
for microalgae biomass vary from 0.38 to 1.08. Jorquera et al. (2010) analyzed algae biomass
production (but not extraction, separation, or conversion to biodiesel) and found positive
energy balances for production in both flat plate photo-bioreactors and open ponds. Frank et
al. (2012) study shows a total energy use for algal biodiesel three times higher than petroleum
low-sulfur diesel.
Another metric to analyze the energy performance is the use of the cumulative Net
Energy Ratio (NER), and is defined as the energy in algal biofuel divided by the cumulative
energy demand of the process. It is a common tool used to show how ‘efficient’ that
technology is in terms of providing energy to society. The greater the Net Energy Ratio
(NER), the better.
Batan et al. (2010) results of NER for microalgae biodiesel were less than 0.93.
Lardon et al. (2009) provide NER values of 1.96, 1.04, 1.47, and 0.74 depending on the
production and oil extraction processes. Frank et al. (2011) provide an NER of 2.58. Sander
and Murthy (2010) found NERs greater than 1 across a range of analyses, depending on
different algae processing steps. Vasudevan et al. (2012) NERs are 0.3 and 2.5, depending on
the extraction process.
As seen so far, the processes used to cultivate and produce the biofuels is
determinant to the overall environmental performance of microalgae biofuels. In the same
way, Stephenson et al. (2010) compared open raceway ponds with closed air-lift tubular
bioreactors for producing biodiesel regarding to environmental impacts. Their study has
shown that open ponds would have a GWP ~80% lower than fossil-derived diesel (on the
basis of the net energy content), and if compared to bioreactors, the GWP would be ~273%
higher than the energetically equivalent amount of fossil-derived diesel. The energy results
also has shown that open cultivation performs better, 85% lower energy requirements than
LITERATURE REVIEW
45
fossil-derived diesel; where with closed PBRs there is 362% higher energy needs. In their
study, raceways would be energetically self-sufficient, with the heat and power requirement
of the process being provided by combusting the methane generated from the anaerobic
digestion of the residual algal biomass (Stephenson et al., 2010).
Taking into account all exposed in this section, a discussion about all the
possibilities and environmental impacts is presented in the next section.
2.3.1.5. Discussion
From all the aspects presented, so far it is not possible to say that using
microalgae as a feedstock for producing biofuels is environmentally sustainable. It is plausible
to state that it can be environmentally sustainable, depending on which cultivation processes
are chosen. Microalgae’s life cycle energy balance and GHG impacts are highly dependent on
cultivation and harvesting parameters.
In order to reach the ideal scenario, a high level of logistics must be taken place.
Therefore, the location of the algae farm facility must take into account a somewhat near
source of saline water, non-agricultural land, a source of wastewater and a source of available
CO2. Moreover, the employment of processes comparable to the use of biogas for both heat
and electricity via a combined heat and power (CHP) system would reduce GHG and are also
where biggest attractiveness lies. Apart from that, new technologies, which require less
energy, need to be explored to enable the overall process to be more energy efficient.
CO2 supply is an important upstream burden that influences the overall life cycle
of algae cultivation. Microalgae facilities could significantly improve their overall GHG
footprint if they could switch from using industrial CO2 (i.e., produced via natural gas
scrubbing or from dedicated wells) to newer CO2 capture technologies (e.g., capture from the
air or as a byproduct of other industrial processes). Anyway, a lot of CO2 sources are
available and algal ponds could be co-located with CO2 sources, or even vice-versa (Sheehan
et al., 1998).
Regarding water requirements, many wastewater and saline water resources may
be available and suitable for microalgae production, while compensating for the input of

LITERATURE REVIEW
46
many nutrients. Wastewater use could offset nutrient and CO2 demands and enhance the
environmental assessment of algal biofuels. In the same manner, non-agricultural land is
hardly a limitation, making resource limitations not a feasible argument against microalgae
biofuel systems.
Another very important topic is oil yields, since the environmental performance of
microalgal biodiesel is highly sensitive to the oil content, esterification rate and drying rate.
The amount of GHG decreases when the microalgae yield increases, therefore, it is important
to achieve high yields of biomass and oil in the cultivation plant (Yanfen, Zehao and
Xiaoqian, 2012).
However, finding strains of algae that could perform well within all the processes
described above is not a straightforward task. Thus, the utilization of genetic modified
organisms may represent a potential field to be studied, although it may generate undesired
problems in the diffusion acceptance and in the overall environmental sustainability.
Moreover, even though the Energy Return on Investment (EROI) ratios of algae-
to-energy production are not as favorable as petroleum fuels today, improvements in the short
term tend to make algae liquid fuels competitive on an energy basis (Liu et al., 2013). In
addition, projections suggest that algae-based biofuels are set to surpass advanced biofuels
(e.g., cellulosic ethanol) in terms of both EROI and GHG emissions.
As far as our concern, using microalgae as a feedstock for biofuels can reach
significantly GHG reductions in relation to fossil and other bio-based fuels and reach a better
EROI with the use of appropriate technology and processes options. Therefore being a
environmentally sustainable biofuel.
2.3.2. Economical assessment
This section presents the main findings from a comprehensive literature review
carried out on algae-based biofuels production costs throughout the world. The search was
conducted with a focus on available scientific papers to gather studies that have been
published during the last two decades containing detailed information on the methodology,
assumptions and data used.

LITERATURE REVIEW
47
2.3.2.1. Methods
The chosen papers were the ones that shared common characteristics, namely
providing simultaneous information about the 9 elected costs and technical specific indicators.
The selected studies main results are summarized in Table 3. Several other articles, although
equally relevant, were withdrawn from our sample because they did not comply with our
current data systematization and others were excluded due to lack of transparency or
sufficient quantitative information. It is also important to notice that not all studies deliver the
cost of production values in the same manner. Some present the costs of producing algal
biomass and others deliver the costs of producing oil, as illustrated in Table 3. For some
surveyed studies, the original outcomes were further calculated to express the results in
dollars, kg and liters. A dataset was built accordingly to the above-mentioned methodology
and comprised specific cost related indexes (Ribeiro and Silva, 2013), presented and analyzed
in the next section.
2.3.2.2. Analysis of surveyed studies
2.3.2.2.1. Oil by Weight
Microalgae produce storage lipids in the form of triacylglycerols (TAGs). The
percentage of lipids is strongly related to the species or on how the cultivation process is
made, as many microalgae species can be induced to accumulate substantial quantities of
lipids. In this study, not all reviewed studies expressed the percentage of oil by weight of
biomass, but analyzing those that provide these numbers, it is clear the wide range of values
that can be achieved. The percentages of oil by weight varied from 10% to 60% and there was
not a clear correlation between price and oil by weight in the selected studies.
2.3.2.2.2. Oil Yield
Similarly, significant variations were verified among oil yields from different
authors. This was an expected outcome due to the utilization of different species and
cultivating techniques. In spite of being an expected result, it is an important data when
comparing species, techniques and costs among the studies, for example to select the more
LITERATURE REVIEW
48
adequate species for cultivation. On the other hand, these comparisons have to be made
carefully, due to different units in which the results are presented.
2.3.2.2.3. Cost per liter of oil
This item is one of the main issues of algae biofuel nowadays, if not the most
important one. Every effort is being made to reduce this figure, so that algae biofuel can be
more competitive and can be a viable alternative in of transportation fuels market. The data
vary widely from study to study, with conclusions stating that it is economically feasible or
impossible to be competitive. The prices shown are not normalized for today prices, as they
represent what authors found at that point of time. The economical feasibility of microalgae is
one of the main drawbacks of this technology for producing biofuels. Algal biofuels have to
be cheap to compete with other biofuels and also with the currently dominant fossil fuels.
Given the long-term uptrend in crude oil prices, the real competitive price level for algal
biofuels can be far higher and it could be nearer than predicted, although it is impossible to
predict exactly when that will happen.
2.3.2.2.4. Cost per kg of dry algae biomass
The cost per kg of dry algae biomass is an alternative measure for evaluating the
economically feasibility of this technology, as it is the raw material from where the oils are
going to be extracted. Likewise to the cost per liter of oil, it was verified significant variations
among different studies, depending on the processes and procedures used to obtain it.
2.3.2.2.5. Type of production and culture
The types of production found were open ponds, photobioreactors (PBRs) and
using fermentors. Concerning the various algal species and strains, they vary from study to
study, depending on location and culture techniques. For that reason it is not yet possible to
predict what species or strain will be the best suited for commercial biofuel production, but it
is most likely that it will differ from case to case, depending on the location, cultivation
techniques chosen, processing technologies available, nutrients source, local climacteric
conditions, among other potential factors.
LITERATURE REVIEW
49
2.3.2.2.6. Co-products
Many of the authors refer the possibility of commercializing co-products
generated in the production of algae biofuels. As stated before, algae can also produce
valuable co-products, such as proteins, natural colorants, and biomass after oil extraction, that
can be used as animal feed, as medicines or as fertilizers (Brennan and Owende, 2010;
Spolaore et al., 2006), or, additionally, can be fermented to produce ethanol, methane or other
biofuels (Hirano et al., 1997). Although this possibility is widely reported, just a few studies
(Benemann and Oswald, 1996; Moheimani, 2005; van Harmelen and Oonk, 2006; Dmitrov,
2007; Alabi et al., 2009; Williams and Laurens, 2010) looked deeply tino this issue and
provided financial calculations on the feasibility of producing biofuel and co-products
together. This could be a promising opportunity to make algae biofuel more economically
feasible. With the production of many products in algae cultivation (as it is done in a
petrochemical refinery for fossil), technical and in particular economical efficiency can arise
in the joint production of two or more products. If the cost of producing two products by one
firm is less than the cost of producing the same two products by two firms, the production
process exhibits economies of scope (Rothwell, 2000). Thus, it is expected a reduction in the
price of algae biofuels in the coming years, if this approach is followed. In Table 2, a broad
analysis of some possible commercial markets is presented.
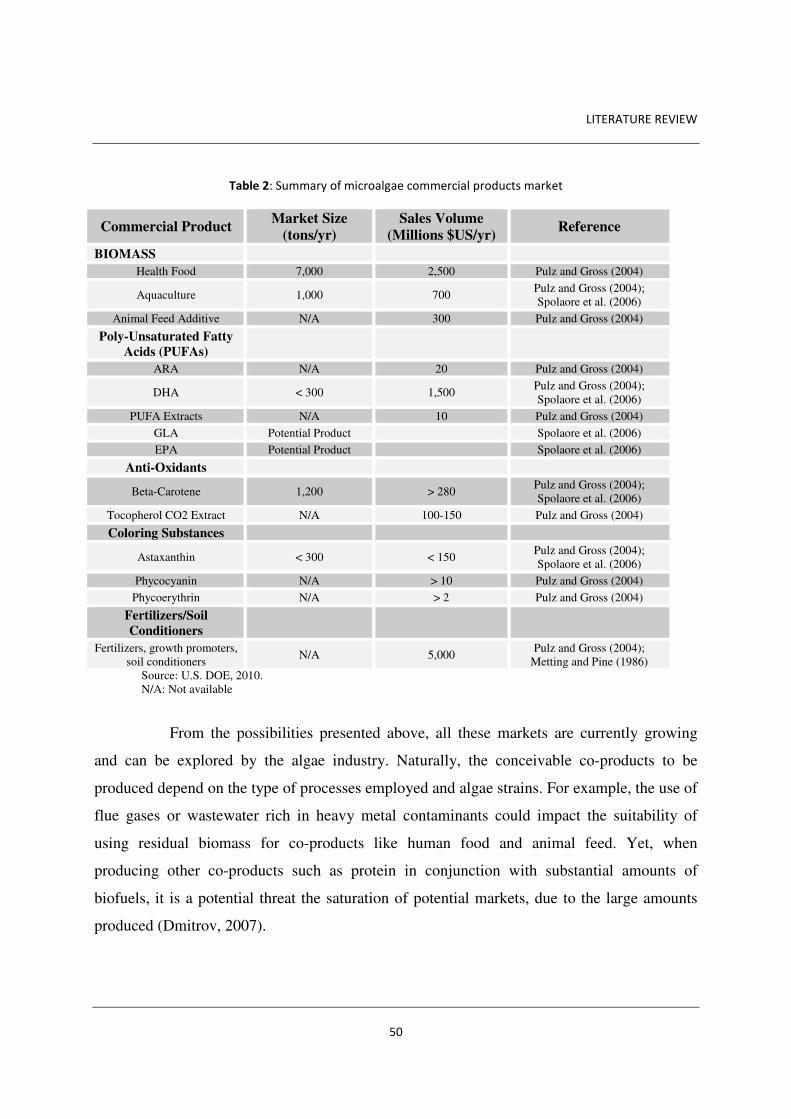
LITERATURE REVIEW
50
Table 2: Summary of microalgae commercial products market
Commercial Product Market Size
(tons/yr) Sales Volume
(Millions $US/yr) Reference
BIOMASS
Health Food 7,000 2,500 Pulz and Gross (2004)
Aquaculture 1,000 700 Pulz and Gross (2004); Spolaore et al. (2006)
Animal Feed Additive N/A 300 Pulz and Gross (2004)
Poly-Unsaturated Fatty Acids (PUFAs)
ARA N/A 20 Pulz and Gross (2004)
DHA < 300 1,500 Pulz and Gross (2004); Spolaore et al. (2006)
PUFA Extracts N/A 10 Pulz and Gross (2004)
GLA Potential Product Spolaore et al. (2006)
EPA Potential Product Spolaore et al. (2006)
Anti-Oxidants
Beta-Carotene 1,200 > 280 Pulz and Gross (2004); Spolaore et al. (2006)
Tocopherol CO2 Extract N/A 100-150 Pulz and Gross (2004)
Coloring Substances
Astaxanthin < 300 < 150 Pulz and Gross (2004); Spolaore et al. (2006)
Phycocyanin N/A > 10 Pulz and Gross (2004)
Phycoerythrin N/A > 2 Pulz and Gross (2004)
Fertilizers/Soil Conditioners
Fertilizers, growth promoters, soil conditioners
N/A 5,000 Pulz and Gross (2004);
Metting and Pine (1986) Source: U.S. DOE, 2010. N/A: Not available
From the possibilities presented above, all these markets are currently growing
and can be explored by the algae industry. Naturally, the conceivable co-products to be
produced depend on the type of processes employed and algae strains. For example, the use of
flue gases or wastewater rich in heavy metal contaminants could impact the suitability of
using residual biomass for co-products like human food and animal feed. Yet, when
producing other co-products such as protein in conjunction with substantial amounts of
biofuels, it is a potential threat the saturation of potential markets, due to the large amounts
produced (Dmitrov, 2007).
LITERATURE REVIEW
51
2.3.2.2.7. CO2 paid/free/revenue
The input of CO2 needed for most of the processes could be provided for free,
with no financial counterpart, it could be bought (paid) or some company that produces a
considerable amount of CO2 could pay the algae biofuel producer to process this CO2. So far,
this last option is just a possibility for future financial calculations, as all the studies surveyed
or accounted CO2 for free or paid for this gas. The existing and future Carbon Markets,
coupled with more stringent limits of the emissions, may lead to companies increasingly
paying to dispose off of their CO2 emissions, and this may represent a reduction in the
productions costs, resulting in lower microalgae fuel prices. Thus, the fixation of the waste
CO2 of other sorts of business could represent another source of income to the algae industry.
2.3.2.2.8. Commercial
Most of the studies available in the open literature are based on small-scale
laboratory experiments, not commercial facilities already selling algae biomass and/or
biofuels. As most of the algae biofuel production so far was made in experimental facilities
with low capacity of fuel production, and with many companies expanding their facilities, it is
expected that this will lead to economies of scale, now that production is increasing and
average costs of cultivating algae are falling (and marginal costs are below average cost)
(Alabi et al., 2009). In this context, it is also expected that the efficiency of such companies
rise. In this regard it is possible to differentiate “technical efficiency” and “economical
efficiency”. Technical efficiency implies that the maximum output has been produced with a
given set of inputs, giving that the most adequate technologies and processes are used.
Economical efficiency implies that the maximum output has been produced at a given
(opportunity) cost, or that a minimum (opportunity) cost has been achieved for a given level
of output (Alabi et al., 2009). With a large set of alternatives of inputs and outputs within a
developing market such as the algae one, it can be complex and hard to achieve the technical
and economical efficiency in the near future, but as the time goes by and the technology
matures, better trends in production will arise.
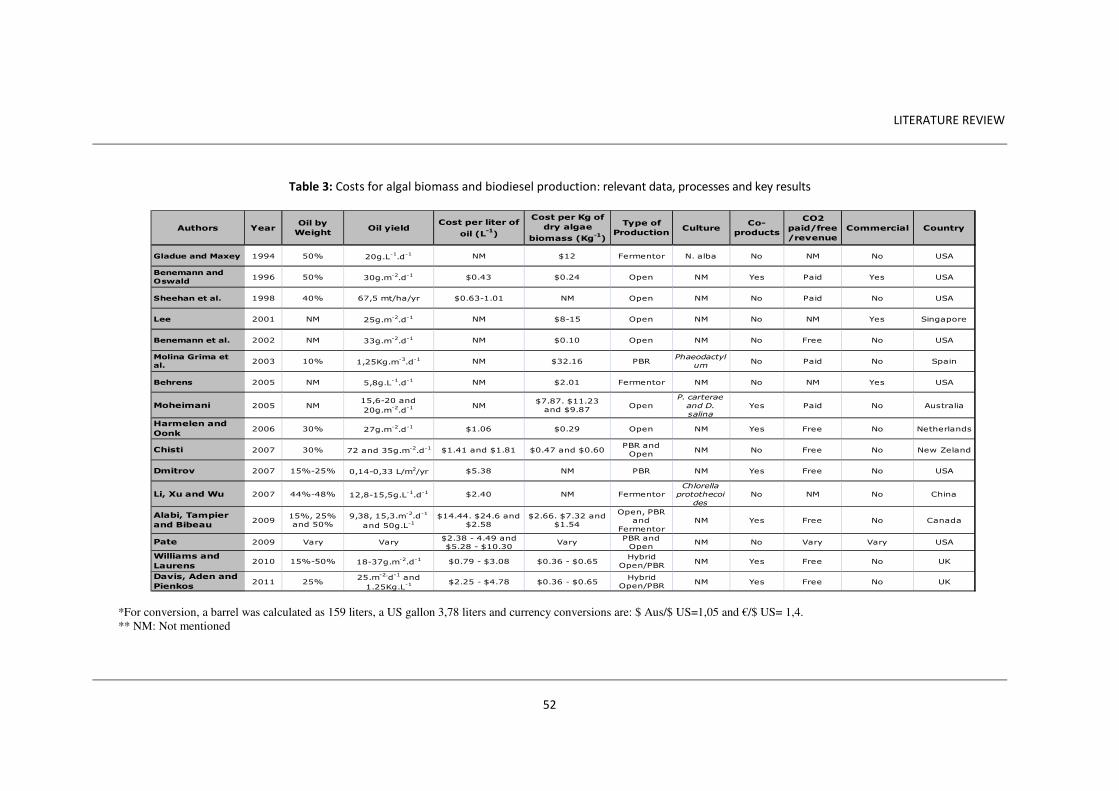
LITERATURE REVIEW
52
Table 3: Costs for algal biomass and biodiesel production: relevant data, processes and key results
*For conversion, a barrel was calculated as 159 liters, a US gallon 3,78 liters and currency conversions are: $ Aus/$ US=1,05 and €/$ US= 1,4. ** NM: Not mentioned
Authors YearOil by
WeightOil yield
Cost per liter of
oil (L-1)
Cost per Kg of
dry algae
biomass (Kg-1)
Type of
ProductionCulture
Co-
products
CO2
paid/free
/revenue
Commercial Country
Gladue and Maxey 1994 50% 20g.L-1.d-1 NM $12 Fermentor N. alba No NM No USA
Benemann and
Oswald1996 50% 30g.m
-2.d-1 $0.43 $0.24 Open NM Yes Paid Yes USA
Sheehan et al. 1998 40% 67,5 mt/ha/yr $0.63-1.01 NM Open NM No Paid No USA
Lee 2001 NM 25g.m-2.d-1 NM $8-15 Open NM No NM Yes Singapore
Benemann et al. 2002 NM 33g.m-2.d-1 NM $0.10 Open NM No Free No USA
Molina Grima et
al.2003 10% 1,25Kg.m
-3.d-1 NM $32.16 PBR
Phaeodactyl
umNo Paid No Spain
Behrens 2005 NM 5,8g.L-1.d-1 NM $2.01 Fermentor NM No NM Yes USA
Moheimani 2005 NM15,6-20 and
20g.m-2.d-1 NM
$7.87. $11.23
and $9.87Open
P. carterae
and D.
salina
Yes Paid No Australia
Harmelen and
Oonk2006 30% 27g.m
-2.d-1 $1.06 $0.29 Open NM Yes Free No Netherlands
Chisti 2007 30% 72 and 35g.m-2.d-1 $1.41 and $1.81 $0.47 and $0.60
PBR and
OpenNM No Free No New Zeland
Dmitrov 2007 15%-25% 0,14-0,33 L/m2/yr $5.38 NM PBR NM Yes Free No USA
Li, Xu and Wu 2007 44%-48% 12,8-15,5g.L-1.d-1 $2.40 NM Fermentor
Chlorella
protothecoi
des
No NM No China
Alabi, Tampier
and Bibeau2009
15%, 25%
and 50%
9,38, 15,3.m-2.d-1
and 50g.L-1
$14.44. $24.6 and
$2.58
$2.66. $7.32 and
$1.54
Open, PBR
and
Fermentor
NM Yes Free No Canada
Pate 2009 Vary Vary$2.38 - 4.49 and
$5.28 - $10.30Vary
PBR and
OpenNM No Vary Vary USA
Williams and
Laurens2010 15%-50% 18-37g.m
-2.d-1 $0.79 - $3.08 $0.36 - $0.65
Hybrid
Open/PBRNM Yes Free No UK
Davis, Aden and
Pienkos2011 25%
25.m-2.d-1 and
1.25Kg.L-1 $2.25 - $4.78 $0.36 - $0.65
Hybrid
Open/PBRNM Yes Free No UK
LITERATURE REVIEW
53
The sample of surveyed results was displayed chronologically, in order to
assess the existence of any type of progress in the indicators values over a time frame of
almost 20 years. However, there is no evident evolution in the outcomes along the years,
what reinforces the need for more research focused in the economical aspects of
microalgae production. Few cost estimates are also available, what justifies the apparent
shortness of our database. However, it can be concluded that to reach commercial viability,
costs will need to be substantially reduced. Given the early stage of this technology and its
rapid development, cost reductions may indeed be possible.
2.3.2.3. Discussion
The basic economic motivation for biofuels resides in the fact that they are a
convenient, low-priced, domestically producible and a substitute for oil. In the presented
survey it became clear that algae are now being intensively researched as a potential
biofuel feedstock. Although many testing and start-up companies are in operation in
several countries, cost information is scarce.
The problems concerning large-scale production of biofuels from algal farms
include inconsistent and insufficient algal productivities, uncertain capital and operating
costs, volatile market prices and unknown levels of government support. This survey
permits to conclude that although intensive work is being done on many technological
issues, economic studies and respective data are scattered, incomplete and divergent. Also,
this paper provided both, a chronological perspective and an updated analysis of the
production and economic conditions that are certainly going to have a profound effect on
the success of this important alternative fuel production process. From our assembly of
nine elected indicators, cost per liter of oil clearly appears to be a key determinant for
eventual market success, in spite of the discrepancy of its proposed values and no clear
trend of findings over time.
By assessing the costs of different algae cultivation techniques, it is apparent
that the current economic situation standpoint towards large-scale production of algae
biodiesel has not yet seemed to be viable as a solution to displace petroleum-based fuels. In
the present situation, the technology to efficiently produce biodiesel from microalgae is not
competitive with more advanced and emerging renewable technologies. However, the
currently fast rate of development of algae biofuel technology and the actual rising of
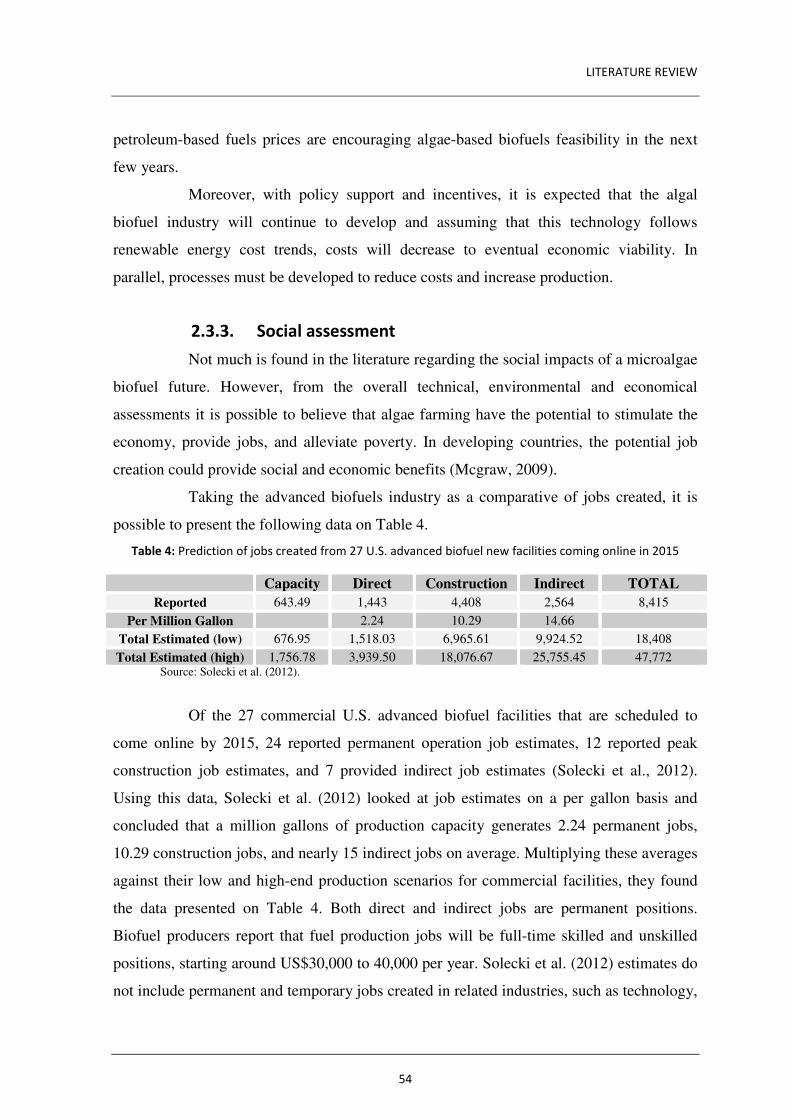
LITERATURE REVIEW
54
petroleum-based fuels prices are encouraging algae-based biofuels feasibility in the next
few years.
Moreover, with policy support and incentives, it is expected that the algal
biofuel industry will continue to develop and assuming that this technology follows
renewable energy cost trends, costs will decrease to eventual economic viability. In
parallel, processes must be developed to reduce costs and increase production.
2.3.3. Social assessment
Not much is found in the literature regarding the social impacts of a microalgae
biofuel future. However, from the overall technical, environmental and economical
assessments it is possible to believe that algae farming have the potential to stimulate the
economy, provide jobs, and alleviate poverty. In developing countries, the potential job
creation could provide social and economic benefits (Mcgraw, 2009).
Taking the advanced biofuels industry as a comparative of jobs created, it is
possible to present the following data on Table 4.
Table 4: Prediction of jobs created from 27 U.S. advanced biofuel new facilities coming online in 2015
Capacity Direct Construction Indirect TOTAL
Reported 643.49 1,443 4,408 2,564 8,415
Per Million Gallon 2.24 10.29 14.66
Total Estimated (low) 676.95 1,518.03 6,965.61 9,924.52 18,408
Total Estimated (high) 1,756.78 3,939.50 18,076.67 25,755.45 47,772 Source: Solecki et al. (2012).
Of the 27 commercial U.S. advanced biofuel facilities that are scheduled to
come online by 2015, 24 reported permanent operation job estimates, 12 reported peak
construction job estimates, and 7 provided indirect job estimates (Solecki et al., 2012).
Using this data, Solecki et al. (2012) looked at job estimates on a per gallon basis and
concluded that a million gallons of production capacity generates 2.24 permanent jobs,
10.29 construction jobs, and nearly 15 indirect jobs on average. Multiplying these averages
against their low and high-end production scenarios for commercial facilities, they found
the data presented on Table 4. Both direct and indirect jobs are permanent positions.
Biofuel producers report that fuel production jobs will be full-time skilled and unskilled
positions, starting around US$30,000 to 40,000 per year. Solecki et al. (2012) estimates do
not include permanent and temporary jobs created in related industries, such as technology,
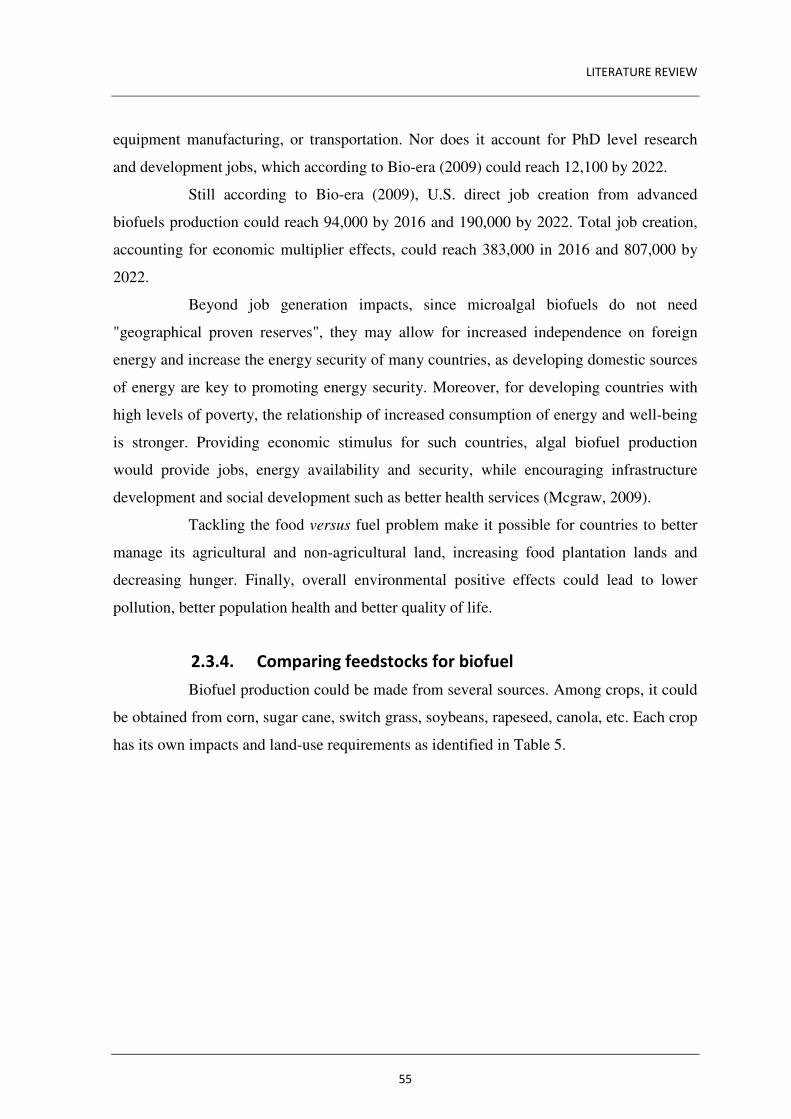
LITERATURE REVIEW
55
equipment manufacturing, or transportation. Nor does it account for PhD level research
and development jobs, which according to Bio-era (2009) could reach 12,100 by 2022.
Still according to Bio-era (2009), U.S. direct job creation from advanced
biofuels production could reach 94,000 by 2016 and 190,000 by 2022. Total job creation,
accounting for economic multiplier effects, could reach 383,000 in 2016 and 807,000 by
2022.
Beyond job generation impacts, since microalgal biofuels do not need
"geographical proven reserves", they may allow for increased independence on foreign
energy and increase the energy security of many countries, as developing domestic sources
of energy are key to promoting energy security. Moreover, for developing countries with
high levels of poverty, the relationship of increased consumption of energy and well-being
is stronger. Providing economic stimulus for such countries, algal biofuel production
would provide jobs, energy availability and security, while encouraging infrastructure
development and social development such as better health services (Mcgraw, 2009).
Tackling the food versus fuel problem make it possible for countries to better
manage its agricultural and non-agricultural land, increasing food plantation lands and
decreasing hunger. Finally, overall environmental positive effects could lead to lower
pollution, better population health and better quality of life.
2.3.4. Comparing feedstocks for biofuel
Biofuel production could be made from several sources. Among crops, it could
be obtained from corn, sugar cane, switch grass, soybeans, rapeseed, canola, etc. Each crop
has its own impacts and land-use requirements as identified in Table 5.
LITERATURE REVIEW
56
Table 5: Comparison Of Biofuel Feedstock Environmental Impacts For Transportation Fuels
Crop type Used to Produce
Use of resources during growing, harvesting and refining of fuel Pros & Cons
Water Fertilizer Pesticide Energy
Corn Ethanol High High High High Technology ready and relatively cheap; reduces food supply.
Sugar cane Ethanol High High Med Med Technology ready; limited as to where it will grow; reduces food supply.
Switch grass Ethanol Med-low Low Low Low It will not compete with food crops; technology not fully ready.
Wood residue
Ethanol, Biodiesel
Med Low Low Low Technology ready; reduces food supply.
Soybean Biodiesel High Low-med Med Med-low Technology ready; reduces food supply.
Rapeseed, Canola
Biodiesel High Med Med Med-low Technology ready; reduces food supply.
Algae
Biodiesel, Ethanol, Gasoline, Bio-oil
Med Low Low Med-High Potential for huge production levels; technology not fully ready for scale up.
Data source: Adapted from Groom et al., 2007.
Comparing to other sources of feedstock to produce biofuels, algae-based
biofuels have several advantages. These advantages are: (1) microalgae are capable of
producing oil during all year long, therefore the oil productivity of microalgae is higher
when compared to the most efficient crops; (2) microalgae can be produced in brackish
(salt) water and on not arable land (Searchinger et al., 2008); not affecting food supply or
the use of soil for other purposes (Chisti, 2007); (3) microalgae have a fast growing
potential and several species have 20 to 50% of oil content by weight of dry biomass
(Chisti, 2007); (4) Regarding air quality, production of microalgae biomass can fix carbon
dioxide (1 kg of algal biomass fixes roughly 1.83 kg of CO2) (Chisti, 2007); (5) Nutrients
for the cultivation of microalgae can be obtained from sewage, therefore there is a
possibility to assist the municipal wastewater treatment (Cantrell et al., 2008); (6) Growing
algae do not need the use of herbicides or pesticides (Rodolfi et al., 2009); (7) Algae can
also produce valuable co-products, as proteins and biomass after oil extraction, that can be
used as animal feed, medicines or fertilizers (Spolaore et al., 2006; Brennan and Owende,
2010), or fermented to produce ethanol or methane (Hirano et al., 1997); (8) Biochemical
composition of algal biomass can be modulated by different growth conditions, so the oil
yield can be significantly improved (Qin, 2005); (9) microalgae are capable of performing
the photobiological production of "biohydrogen" (Ghirardi et al., 2000) and (10) Low
LITERATURE REVIEW
57
sulfur and relative heavy metals-free algal biocrude could also be produced and mixed with
fossil oil in existing oil refineries (Liu et al., 2013).
The above combination of the potential for biofuel production, CO2 fixation,
wastewater treatment and the possibility of production of biocrude highlight the potential
applications of the microalgae cultivation. Compared to other biofuel technologies, the
most favorable factors for the cultivation of microalgae for the production of biofuels is
that they can be grown in brackish water, on non-fertile land and the oil yield production is
far superior.
2.3.5. Challenges of algae-based biofuels
Despite its vocation as a potential source of biofuels, many challenges have
hindered the development of biofuels technology from microalgae to become
commercially viable. Among them, and based on recent literature, we elect as the most
important: (1) the selection of species must balance the requirements for biofuel production
and extraction of valuable by-products (Ono and Cuello, 2006) and still reach
environmental and economical sustainability; (2) achieve greater photosynthetic efficiency
through the continuous development of production systems (Pulz and Scheinbenbogan,
1998); (3) develop techniques for growing a single species, reducing evaporation losses
and diffusion of CO2 (Ugwu et al. 2008); (4) few commercial cultivating "farms", so
there is a lack of data on large-scale cultivation (Pulz, 2001) and standard processes; (5)
impossibility of introducing flue gas at high concentrations, due to the presence of toxic
compounds such as NOx and SOx (Brown, 1996); (6) choosing algae strains that require
fresh water to grow can be unsustainable for operations on a large scale and exacerbate
fresh water scarcity (Mcgraw, 2009); (7) price is still too high to compete with fossil fuels;
(8) Current harvest and dewatering are still too energy intensive (Chen et al., 2009); (9)
Some recent life cycle analyses project algae biofuels as having poor energy or greenhouse
gas benefits (Clarens et al., 2010); (10) Depending on the processes, PBR systems can
consume more energy than they produce (Slade and Bauen, 2013); (11) Possible scarcity of
sites with favorable climate, land, water, and CO2 resources, all required in one place
(Benemann, 2012; Clarens et al., 2010; Slade and Bauen, 2013); (12) CO2 supply is
relatively expensive, due to high capital and operational costs for piping CO2 to, and
transferring it into, the ponds (Benemann, 2012) and (13) Large-scale cultivation of algal
LITERATURE REVIEW
58
biomass will require a lot of nitrogen and phosphorus; recycling nutrients from wastewater
and seawater could potentially provide some of the nutrients required (Slade and Bauen,
2013).
Although, as often mentioned throughout this work, there are multiple
challenges related to the development of microalgae biofuels technology, many policies are
being prepared focusing on this new source of feedstock for biofuels as it is stated in the
chapter 3.
BIOFUEL MARKET DIFFUSION AND POLICIES
59
3. BIOFUEL MARKET DIFFUSION AND POLICIES
Up to now it has been shown that it is scientifically and technically possible to
derive energy products from algae in the laboratory. Economic feasibility is believed to be
currently the main hurdle to overcome for this technology. Current costs associated to both
the state of the science and technologies are sizeable and represent a main factor working
against development.
This characteristic is not unique for algae biofuels as high costs often prevent
the market diffusion of novel and efficient energy technologies. As microalgae biofuel is
not a mature technology, it becomes important to provide a revision of technological
innovation and diffusion aspects to enlighten some available options that may help
overpass the barriers found by innovative technologies. Thus, this chapter stresses the
importance of public policies in the diffusion of emerging technologies.
3.1. Market diffusion
The current economic situation points towards large-scale production of algae
biofuel not being viable as a solution to displace petroleum-based fuels (Ribeiro and Silva,
2013). The technology to efficiently produce and disseminate biofuels from microalgae is
not yet competitive with more mature transportation energy options, and the high costs
prevent the market diffusion of novel energy technologies.
It is widely recognized that modern economic analysis of technological
innovation originates fundamentally from the work of Joseph Schumpeter (1934), who
stressed the existence of three necessary conditions for the successful deployment of a new
technology: invention, innovation and diffusion. Each of these keywords represents
different aspects, in particular: invention includes the conception of new ideas; innovation
involves the development of new ideas into marketable products and processes; and
diffusion, in which the new products and processes spread across the potential market.
Emergent technologies are relatively expensive at the point of market
introduction but eventually become cheaper due to mechanisms such as learning-by-doing,
technological innovation and/or optimization, and economies of scale. The combined
effects of these mechanisms are commonly referred to as technological learning. Over the
BIOFUEL MARKET DIFFUSION AND POLICIES
60
last decades, learning theories combination with evolutionary economics have led to the
innovation systems theory that expands the analysis of technological innovation, covering
the entire innovation system in which a technology is embedded. In particular, “An
innovation system is thereby defined as the network of institutions and actors that directly
affect rate and direction of technological change in society” (Junginger et al., 2008; p.39).
In the emerging energy technologies field, there is a strong need to influence
both the speed and the direction of the innovation and technological change. With that in
mind, policymakers are putting their efforts on lowering the costs of renewable energy
sources to support the development of renewable technologies, either through direct means
such as government-sponsored research and development (R&D), or by enacting policies
that support the production of renewable technologies. It is well documented (Johnstone et
al. 2010; Popp, 2002) that both higher energy prices and changes in energy policies
increase inventive activity on renewable energy technologies. As noted by Popp et al.
(2011), the higher costs of renewable energy technologies suggest that policy intervention
is necessary to encourage investment. The impact of the lack of public policies favoring
the development of renewable energy is that production costs remain too high and
renewable energy does not represent an option in replacing fossil fuels.
Policies to foster innovation should not only focus on the creation and supply
of new technologies and innovations, but also on the diffusion and take-up of green
innovations in the market place. Such policies need to be well designed to ensure that they
support and do not distort the market formation, and should be aligned with competition
policies and international commitments (OECD, 2011). With this purpose, several
government policies have been introduced in the energy markets worldwide in an effort to
reduce costs and accelerate the market penetration of renewables (U.S. DOE, 2010).
In Section 3.2, some of the U.S. policies that could enhance the development of
microalgae biofuels are, therefore, revised.
3.2. United States policies
In this section, special focus is devoted to biofuels policies, because they
include major drivers for biofuel technology deployment. The U.S. policies were chosen
due to its representative share of algal biofuel producing companies. The United States
BIOFUEL MARKET DIFFUSION AND POLICIES
61
show a level of 78% of all algal biofuel producing companies around the world (Singh and
Gu, 2010).
There are many objective aims in U.S. biofuels policies (De Gorter and Just,
2010). Firstly, there is a strong desire to decrease the dependence of the United States on
foreign oil. The 2008 spike of fossil fuel prices is a lively reminder that fluctuations in
such levels can have sizeable impacts on U.S. welfare. In addition, there is an increasing
motivation in developing alternative, environmentally friendly and more secure energy
sources. The idea is that using biofuels might alleviate the environmental impacts of oil
energy consumption. At last, increasing biofuels production has the added implication of
increasing the demand for agricultural production and thus is consistent with a long-
standing U.S. commitment to support its farm sector (Lapan and Moschini, 2012).
In order to boost the adoption and development of biofuels, the key instruments
widely adopted have been mandatory blending targets, tax exemptions and subsidies.
Supplementary to those, governments have intervened on the production chain by
supporting intermediate inputs (feedstock crops), subsidizing value-adding factors (labor,
capital, and land) or granting incentives that target end-products. Import tariffs have also
played a significant role by protecting national industries from external competition (Sorda
et al., 2010).
A vivid example of the utilization of these policies is the steeply rise of the
U.S. corn-based ethanol production, going from 1.62 billion gallons in 2000 to 13.31
billion gallons in 2013 (U.S. EIA, 2014). It is clear that this expansion of ethanol
production owes much to the implementation of critical support policies. The corn ethanol
industry has received a great share of subsidies over the past 20 years. Through federal tax
credits, loan guarantees, grants and other subsidies, billions of dollars have been invested
in this industry. While the biofuels industry as a whole was intended to help achieve
American energy independence, reduce greenhouse gas emissions, and spur rural economic
development, the corn ethanol industry has fallen short of achieving these goals and
generated unintended consequences and long-term liabilities (Yang et al., 2012; Pimentel,
2003).
Regarding emerging biofuels, the U.S. Environmental Protection Agency
suggested revisions to the National Renewable Fuel Standard program (RFS). The
proposed rules intended to address changes to the RFS program as required by the Energy

BIOFUEL MARKET DIFFUSION AND POLICIES
62
Independence and Security Act of 2007 (EISA). The revised statutory requirements
establish new specific volume standards for cellulosic biofuel, biomass-based diesel,
advanced biofuel, and total renewable fuel that must be used in transportation fuel each
year. The regulatory requirements for RFS will apply to domestic and foreign producers
and importers of renewable fuel (U.S. EPA, 2010). This rule proposes to establish the
revised annual renewable fuel standard (RFS2) and to make the necessary program
modifications as set forth in EISA. The required volume modifications made under RFS2
are shown in Table 6, eventually reaching 36 billion gallons by 2022.
Table 6: U.S. Renewable Fuel Volume Requirements for RFS2
Year Cellulosic biofuel
Biomass-based diesel
Advanced biofuel
Total renewable fuel
2008 n/a n/a n/a 9.0
2009 n/a 0.5 0.6 11.1
2010 0.1 0.65 0.95 12.95
2011 6.6* 0.80 1.35 13.95
2012 8.65* 1.00 2.0 15.2
2013 6.0* 1.28 2.75 16.55
2014** 17.0* 1.28 2.2*** 18.15
2015 3.0 a 5.5 20.5
2016 4.25 a 7.25 22.25
2017 5.5 a 9.0 24.0
2018 7.0 a 11.0 26.0
2019 8.5 a 13.0 28.0
2020 10.5 a 15.0 30.0
2021 13.5 a 18.0 33.0
2022 16.0 a 21.0 36.0
2023+ b b b b Volumes in billion gallons, unless otherwise stated. Source: U.S. EPA, 2010. a: To be determined by EPA through a future rulemaking, but no less than 1.0 billion gallons. b. To be determined by EPA through a future rulemaking. * Million Gallons ** Proposed Rule (U.S. EPA, 2013). *** Reduced from 3.75 billion gallons. (U.S. EPA, 2013).
Based on the table above for all renewable fuel categories, the applicable
standards for 2010 onwards were proposed, each representing the fraction of a refiner's or
importer's gasoline and diesel volume which must be renewable fuel.
The proposed specific targets for 2014 in the U.S. include 0.010% from
cellulosic biofuel, 1.16% from biomass-related diesel, 1.33% from advanced biofuel, and
9.20% from total renewable fuels. As defined by the Energy Independence and Security
Act of 2007 (p.28),
“advanced biofuels are renewable fuels, other than ethanol derived from corn starch, that
BIOFUEL MARKET DIFFUSION AND POLICIES
63
have lifecycle greenhouse gas emissions that achieve at least a 50 percent reduction over baseline lifecycle greenhouse gas emissions. Advanced biofuels may include ethanol derived from cellulose or lignin, sugar or starch (other than corn starch), or waste material, including crop residue, other vegetative waste material, animal waste, and food waste and yard waste; biomass-based diesel; biogas produced through the conversion of organic matter from renewable biomass; butanol or other alcohols produced through the conversion of organic matter from renewable biomass; and other fuel derived from cellulosic biomass.”
While cellulosic ethanol is expected to play a large role in meeting the 2007
EISA goals, a number of next generation biofuels, especially those with higher-energy
density than ethanol, show significant promise in helping to achieve the 36 billion gallon
goal. Of these candidates, biofuels derived from algae, particularly microalgae, have the
potential to help the U.S. meet the new RFS while at the same time moving the nation ever
closer to energy independence (U.S. DOE, 2010). Algae-based fuels could be considered
under the advanced biofuel or bio-based diesel portion of the RFS, according to the
proposed rule (U.S. EPA, 2013).
To accelerate the deployment of biofuels produced from algae, President
Obama and Secretary of Energy Steven Chu announced on May 5th, 2009 the investment
of US$800 Millions new research on biofuels in the American Recovery and Renewal Act
(ARRA). This announcement included funds for the Department of Energy Biomass
Program to invest in the research, development, and deployment of commercial algal
biofuel processes (U.S. DOE, 2010).
Meanwhile, the Algal Biomass Organization (ABO) are focusing its efforts on
achieving three main goals for the algae biofuels technology: (1) Financial parity: Algae
Fuels must receive the same tax incentives, subsidies and other financial benefits that are
currently accorded to other biofuel feedstocks. (2) Regulatory parity: Algae must be
recognized as an effective medium for the “beneficial reuse” of carbon dioxide, and a
significant part of the solution to the American overall carbon reduction strategy. Federal
agencies should develop regulations that treat algae’s growth and production similarly to
other biofuel feedstocks and carbon sequestering technologies. (3) RFS parity: Because
algae are not cellulosic, low-carbon algae-based fuels were not counted towards the 16
billion gallon cellulosic biofuel carve-out within the RFS’s advanced biofuel mandate.
Consequently, all non-cellulosic biofuels, including algae-based fuels, were left to compete
among themselves to meet the threshold within the mandate (ABO, 2014). However, in the
Family and Business Tax Cut Certainty Act of 2012 bill, the definition of qualified
BIOFUEL MARKET DIFFUSION AND POLICIES
64
cellulosic biofuel production was expanded to include algae-based fuel (U.S. Senate,
2012). The bill would also extend the cellulosic biofuel tax credit to algae-based fuel for
the first time.
As the main region so far for algae biofuel production, The U.S. is leading
policies concerning this technology. Although it is expected much more advances in this
field in the next few years, research on the welfare economics of renewable energy policy
is still in its infancy and the economic effects of biofuel policies are not only complex and
difficult to understand, but are ultimately ambiguous in theory (De Gorter and Just, 2010).
In the next section, the European policies are presented since EU presents 13%
of all algal biofuel producing companies around the world (Singh and Gu, 2010).
3.3. European Union policies
In order to promote the use of energy from renewable sources, The European
Parliament published on April 2009, the Directive 2009/28/EC which
“establishes a common framework for the promotion of energy from renewable sources. It sets mandatory national targets for the overall share of energy from renewable sources in gross final consumption of energy and for the share of energy from renewable sources in transport. It lays down rules relating to statistical transfers between Member States, joint projects between Member States and with third countries, guarantees of origin, administrative procedures, information and training, and access to the electricity grid for energy from renewable sources. It establishes sustainability criteria for biofuels and bioliquids.” (E.U., 2009, p.27).
The Directive 2009/28/EC also establishes in its Article 4 that each Member
State shall adopt a national renewable energy action plan. In a nutshell, the national
renewable energy action plans shall set out Member States’ national targets for the share of
energy from renewable sources consumed in 2020 and the policies and measures adopted
to achieve those targets.
Concerning energy from biofuels, the Directive 2009/28/EC establishes in its
Article 17, the sustainability criteria for these fuels, stating that biofuels that do not fulfil
the sustainability criteria set out in this article shall not be taken into account. The main
criteria are: (1) The greenhouse gas emission saving from the use of biofuels taken into
account shall be at least 35 %. From January 2017, the greenhouse gas emission saving
shall be at least 50 % and from January 2018 shall be at least 60%. (2) Biofuels shall not be
BIOFUEL MARKET DIFFUSION AND POLICIES
65
made from raw material obtained from land with high biodiversity value, (3) from land
with high carbon stock, (4) or from land that was peatland in January 2008, unless
evidence is provided that the cultivation and harvesting of that raw material does not
involve drainage of previously undrained soil.
By the end of 2010, a communication from the European Parliament has set the
strategy for competitive, sustainable and secure energy by 2020. The Strategic Energy
Technology (SET) Plan sets out a medium term strategy valid across all sectors. Yet
development and demonstration projects for the main technologies (e.g. second generation
biofuels) must be speeded up (E.U., 2007).
The European SET-Plan lists several energy technologies, which will be
required to bring together economic growth and a vision of a decarbonized society. It states
that advanced biofuels, namely microalgae, are supposed to play a significant role. EU
energy policy aims to represents a green “new deal”, which will hopefully enhance the
competitiveness of EU industry in an increasingly carbon-constrained world (E.U., 2007).
Among the projects to be launched, the €9 billion European Industrial
Bioenergy Initiative aims to ensure quick market uptake of sustainable second-generation
biofuels. Since implementing large-scale sustainable biofuel production is one of the
targets to be achieved.
After reviewing some of the policies focused on this new source of feedstock
for biofuels, chapter 4 presents what are the visions of microalgae experts for its future.

WORLD EXPERTS VISIONS THROUGH A DEPLHI SURVEY
67
4. WORLD EXPERTS VISIONS THROUGH A DELPHI SURVEY
Currently, much experimental and even theoretical/simulation work is being
done to ensure that biofuels from microalgae become a reality in the short to medium term.
Some aspects were already identified as significant for the overall competiveness, such as:
the microalgae should have high biomass and lipids productivities (Singh and Gu, 2010;
Sander and Murthy, 2010; Pittman et al., 2011); the processing system should be highly
efficient and integrated with other processes following the biorefinery concept (Pokoo-
Atkins, 2010); there must be markets or valorization potential for the process byproducts or
other high value products that may be obtained (Resurreccion et al, 2012); waste streams
and/or remaining nutrients should be used to reduce operating costs and increase the
process sustainability (Pittman et al., 2011); among others. Each of the previous
possibilities have a positive impact on the competiveness of using microalgae as a
feedstock for biofuels, but there is a lot of discussion in which one should focus efforts of
research and development.
To fulfill this gap, this chapter presents a study based on the Delphi method to
obtain more concrete information and predictions on how this area should be further
developed. This way it will be possible to better define which lines of research should be
supported, and what policy and funding instruments are more adequate. To the authors’
awareness, no study can be found in the literature addressing these questions with this
methodology, involving the usage of microalgae as feedstock for biofuels.
A related work is the National Algal Biofuels Technology Roadmap (U.S.
DOE, 2010), the result of a two day workshop that brought together specialists from
various areas, including engineers, scientists, policy makers, financiers, and others, to
discuss the present and future of microalgae as a feedstock for biofuel production. The
final document was intended to serve as a revision of the current state of the art in the area,
and to identify which are the key challenges that must be considered to achieve a
commercial scale production, serving as a guide to ongoing efforts. The study is rather
comprehensive and extensive but fails to highlight which are the areas and aspects that are
considered to be more important and should be considered first, from a cost-benefit point
of view.
WORLD EXPERTS VISIONS THROUGH A DEPLHI SURVEY
68
Also related, the EurEnDel project was a European wide Delphi study on the
future developments in the energy sector, with a time horizon of 2030 based on the
situation up to 2003. Its main goal was to provide advice on energy R&D activities in this
key area. Hundreds of responses from experts in a wide range of topics were gathered,
several future scenarios were developed, and in which concerns biofuels, there is a short-
term need for new production processes and an increase in their market share (Wehnert et
al, 2004 and 2007).
In 2009, a Delphi study was published dealing with the potential of biofuels in
Alabama (Guthrie, 2009). The information gathered supported the idea that there are no
simple and unique technology answers for the commercial implementation, and that local
questions and an array of technologies and feedstocks is the most adequate strategy.
Similar conclusions were reached by Celitkas and Kocar (2010) in their Delphi study of the
renewable energy sector in Turkey, and by Lubieniechi and Smyth (2011) in their work on
the barriers to biofuels in Canada.
4.1. Methodology
The Delphi method is a qualitative research aiming to support strategic future-
oriented action, such as policy making in the areas of science and technology. It typically
entails two or more survey rounds in which the participating experts are provided with the
results of the previous rounds. The panel of experts is used as the source of information,
and the questionnaires act as the medium of interaction. The key characteristics of a
traditional Delphi study are iteration, participant and response anonymity, controlled
feedback, and group statistical response. It is especially suitable in judgment and long-
range forecasting (20-30 years) situations, when expert opinions are often the only source
of information available, due to a lack of appropriate historical, economic or technical data
(Blind et al., 2001; McLeod and Childs, 2007; Rowe and Wright, 1999).
The key objective of our Delphi study is to determine the prospects of using
microalgae for biofuels production within a time scale extending to 2030. Before initiating
the Delphi study, a brainstorming was organized by four microalgae specialists. In the
brainstorming, the participants identified factors affecting production and competition of

WORLD EXPERTS VISIONS THROUGH A DEPLHI SURVEY
69
microalgae biofuels. Subsequently, the factors were categorized into sentences as presented
in the Delphi study later on. The brainstorming participants also suggested panelists for the
Delphi survey. Based on this meeting, the statements for the first Delphi survey round were
formed by the researchers. The questionnaires were sent to the Delphi experts via e-mail,
enquiring about their willingness to participate in the study. In the first Delphi survey
round, all statements were presented to the panelists at the same time. In the second survey
round, the respondents similarly had the opportunity to comment on the critical factors
voted on in the first round (Ribeiro et al., 2014).
Our Delphi study included three survey rounds (the workshop and two Delphi
rounds), which made it possible to understand the features that may develop or hold back
this technology in the future. All three rounds were carried out during three months (from
May 2012 to July 2012). From all the experts inquired, there were 55 respondents in the
first round, reaching a response rate of 36.7 %, and, in the second round, when only were
questioned those 55 experts that answered the first round, the response rate was 54.5 %.
The Delphi participants were selected based on their expertise on the subject matter, as it is
required in-depth knowledge about the microalgae biofuel markets and processes from all
the experts (Ribeiro et al., 2014).
Overall, the panelists represented 10 countries (United States, Portugal, the
Netherlands, Italy, Norway, United Kingdom, Spain, Uruguay, Brazil and Australia). The
experts can be categorized into three groups based on the field they represented: Academy
(38.5 %), Government (23.1 %), Business (28.8 %), Academy/Business (7.7 %) and
Academy/Business/Government (1.9 %) (Figure 12). The main focus of this Delphi study
was to gather insights from specialists that symbolized distinctive fields, and not
specifically the strategies of each country.
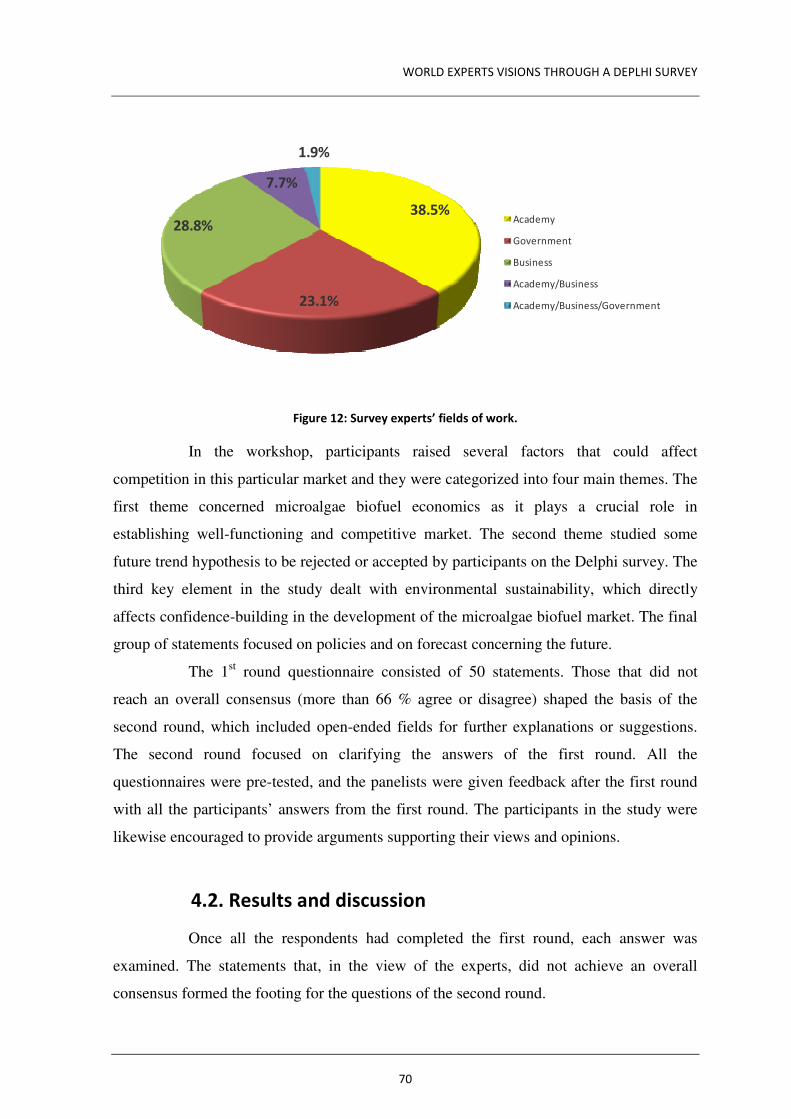
WORLD EXPERTS VISIONS THROUGH A DEPLHI SURVEY
70
Figure 12: Survey experts’ fields of work.
In the workshop, participants raised several factors that could affect
competition in this particular market and they were categorized into four main themes. The
first theme concerned microalgae biofuel economics as it plays a crucial role in
establishing well-functioning and competitive market. The second theme studied some
future trend hypothesis to be rejected or accepted by participants on the Delphi survey. The
third key element in the study dealt with environmental sustainability, which directly
affects confidence-building in the development of the microalgae biofuel market. The final
group of statements focused on policies and on forecast concerning the future.
The 1st round questionnaire consisted of 50 statements. Those that did not
reach an overall consensus (more than 66 % agree or disagree) shaped the basis of the
second round, which included open-ended fields for further explanations or suggestions.
The second round focused on clarifying the answers of the first round. All the
questionnaires were pre-tested, and the panelists were given feedback after the first round
with all the participants’ answers from the first round. The participants in the study were
likewise encouraged to provide arguments supporting their views and opinions.
4.2. Results and discussion
Once all the respondents had completed the first round, each answer was
examined. The statements that, in the view of the experts, did not achieve an overall
consensus formed the footing for the questions of the second round.
38.5%
23.1%
28.8%
7.7%
1.9%
Academy
Government
Business
Academy/Business
Academy/Business/Government
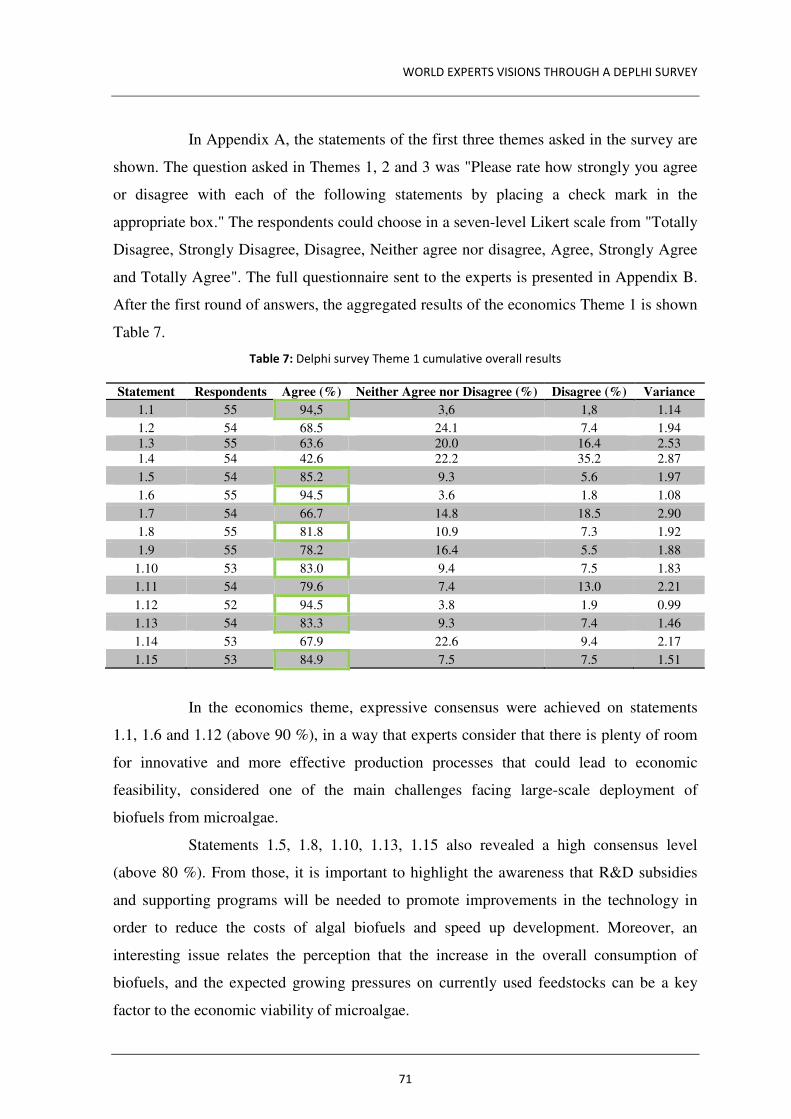
WORLD EXPERTS VISIONS THROUGH A DEPLHI SURVEY
71
In Appendix A, the statements of the first three themes asked in the survey are
shown. The question asked in Themes 1, 2 and 3 was "Please rate how strongly you agree
or disagree with each of the following statements by placing a check mark in the
appropriate box." The respondents could choose in a seven-level Likert scale from "Totally
Disagree, Strongly Disagree, Disagree, Neither agree nor disagree, Agree, Strongly Agree
and Totally Agree". The full questionnaire sent to the experts is presented in Appendix B.
After the first round of answers, the aggregated results of the economics Theme 1 is shown
Table 7.
Table 7: Delphi survey Theme 1 cumulative overall results
Statement Respondents Agree (%) Neither Agree nor Disagree (%) Disagree (%) Variance
1.1 55 94,5 3,6 1,8 1.14
1.2 54 68.5 24.1 7.4 1.94 1.3 55 63.6 20.0 16.4 2.53 1.4 54 42.6 22.2 35.2 2.87
1.5 54 85.2 9.3 5.6 1.97
1.6 55 94.5 3.6 1.8 1.08
1.7 54 66.7 14.8 18.5 2.90
1.8 55 81.8 10.9 7.3 1.92
1.9 55 78.2 16.4 5.5 1.88
1.10 53 83.0 9.4 7.5 1.83
1.11 54 79.6 7.4 13.0 2.21
1.12 52 94.5 3.8 1.9 0.99
1.13 54 83.3 9.3 7.4 1.46
1.14 53 67.9 22.6 9.4 2.17
1.15 53 84.9 7.5 7.5 1.51
In the economics theme, expressive consensus were achieved on statements
1.1, 1.6 and 1.12 (above 90 %), in a way that experts consider that there is plenty of room
for innovative and more effective production processes that could lead to economic
feasibility, considered one of the main challenges facing large-scale deployment of
biofuels from microalgae.
Statements 1.5, 1.8, 1.10, 1.13, 1.15 also revealed a high consensus level
(above 80 %). From those, it is important to highlight the awareness that R&D subsidies
and supporting programs will be needed to promote improvements in the technology in
order to reduce the costs of algal biofuels and speed up development. Moreover, an
interesting issue relates the perception that the increase in the overall consumption of
biofuels, and the expected growing pressures on currently used feedstocks can be a key
factor to the economic viability of microalgae.
WORLD EXPERTS VISIONS THROUGH A DEPLHI SURVEY
72
The experts also reached an agreed consensus on statements 1.2, 1.7, 1.9, 1.11
and 1.14, but with less intensity (from 66 % to 80 % agree) of which, it is important to
highlight the interest in other co-products outside the transportation sector, such as
nutraceuticals and compounds for the pharmaceutical and/or fine chemistry industries. The
commercialization of theses co-products could assist industries to reach economic
feasibility of microalgae biofuel.
Questions 1.3 and 1.4 did not reach a clear consensus and were asked again in
the 2nd round for further analysis. From the results, 1.3 has a clear tendency on agreement
(63.6% agree), however, we could not conclude a clear overall consensus, since the sample
that agreed now (69.0 %) had already agreed on the 1st round (70.0 %). Some of the
experts' answers are presented as follows and could lead to an understanding why this
statement did not achieve a consensus.
Statement 1.3: "Microalgae biofuel will become a co-product of future large-
scale facilities, where other high-value products are generated."
"High-value products may be co-products of any successfully large-scale biofuel
production from algae, but co-products may not be possible at the scale of biofuels, which will
be huge" (Strongly Disagree).
"This is akin to a petrochemical complex, generates less residues, and ensures that
there is a lower risk in the microalgae base industry as there is less dependence on just one
product" (Strongly Agree).
"Depends on the commercialization strategy of the facility; a near-term, "1st of a
kind" facility may rely primarily on other high-value products to generate required revenue
with algal oil/biofuel as a co-product, and could transition to a larger emphasis on algal biofuel
as a principal product as the technology matures" (Neither Agree nor Disagree).
On the other hand, Statement 1.4 did not reach any consensus (26.7 % disagree
/ 33.3 % neither agree nor disagree / 40.0 % agree).
In Theme 2 (Table 8), expressive consensus was reached only on statement 2.8,
which reached 92.2 % of agreement. Therefore, experts strongly agree that no single
microalgae strain will be the dominant one, and that different strains of microalgae will be
used depending on the nutrients and/or waste streams available, and particular local
climatic and water availability conditions.
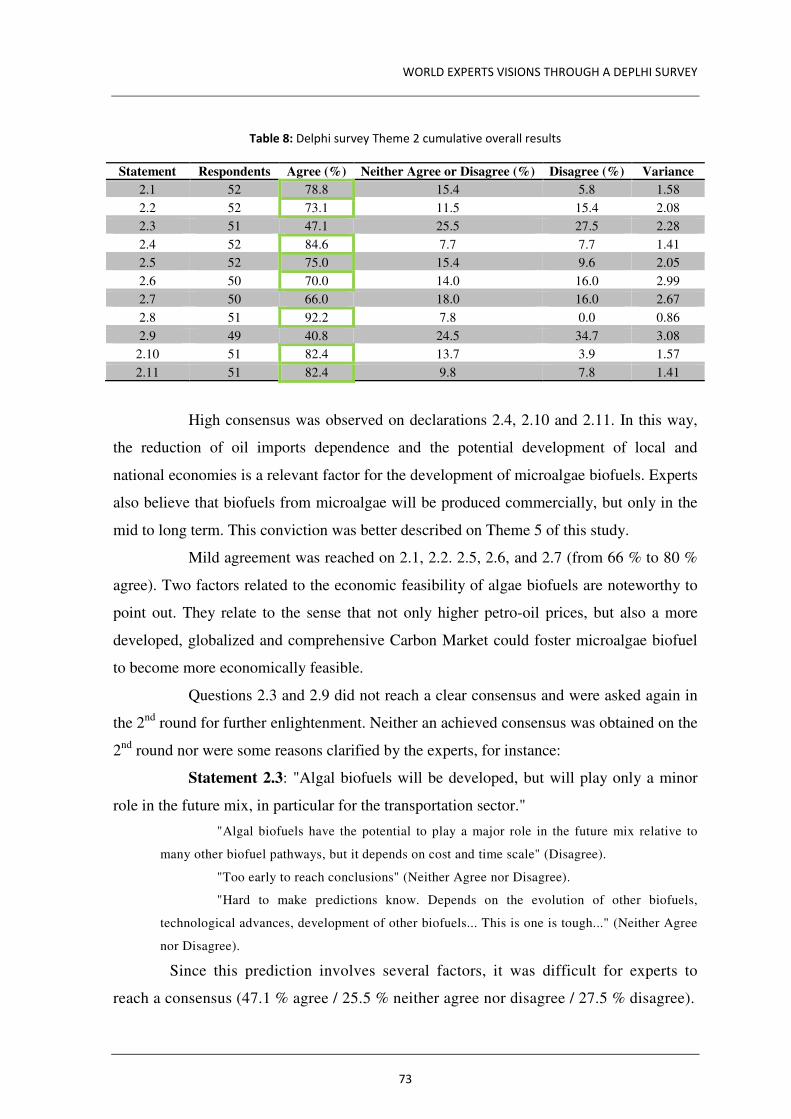
WORLD EXPERTS VISIONS THROUGH A DEPLHI SURVEY
73
Table 8: Delphi survey Theme 2 cumulative overall results
Statement Respondents Agree (%) Neither Agree or Disagree (%) Disagree (%) Variance
2.1 52 78.8 15.4 5.8 1.58
2.2 52 73.1 11.5 15.4 2.08
2.3 51 47.1 25.5 27.5 2.28
2.4 52 84.6 7.7 7.7 1.41
2.5 52 75.0 15.4 9.6 2.05
2.6 50 70.0 14.0 16.0 2.99
2.7 50 66.0 18.0 16.0 2.67
2.8 51 92.2 7.8 0.0 0.86
2.9 49 40.8 24.5 34.7 3.08
2.10 51 82.4 13.7 3.9 1.57
2.11 51 82.4 9.8 7.8 1.41
High consensus was observed on declarations 2.4, 2.10 and 2.11. In this way,
the reduction of oil imports dependence and the potential development of local and
national economies is a relevant factor for the development of microalgae biofuels. Experts
also believe that biofuels from microalgae will be produced commercially, but only in the
mid to long term. This conviction was better described on Theme 5 of this study.
Mild agreement was reached on 2.1, 2.2. 2.5, 2.6, and 2.7 (from 66 % to 80 %
agree). Two factors related to the economic feasibility of algae biofuels are noteworthy to
point out. They relate to the sense that not only higher petro-oil prices, but also a more
developed, globalized and comprehensive Carbon Market could foster microalgae biofuel
to become more economically feasible.
Questions 2.3 and 2.9 did not reach a clear consensus and were asked again in
the 2nd round for further enlightenment. Neither an achieved consensus was obtained on the
2nd round nor were some reasons clarified by the experts, for instance:
Statement 2.3: "Algal biofuels will be developed, but will play only a minor
role in the future mix, in particular for the transportation sector."
"Algal biofuels have the potential to play a major role in the future mix relative to
many other biofuel pathways, but it depends on cost and time scale" (Disagree).
"Too early to reach conclusions" (Neither Agree nor Disagree).
"Hard to make predictions know. Depends on the evolution of other biofuels,
technological advances, development of other biofuels... This is one is tough..." (Neither Agree
nor Disagree).
Since this prediction involves several factors, it was difficult for experts to
reach a consensus (47.1 % agree / 25.5 % neither agree nor disagree / 27.5 % disagree).
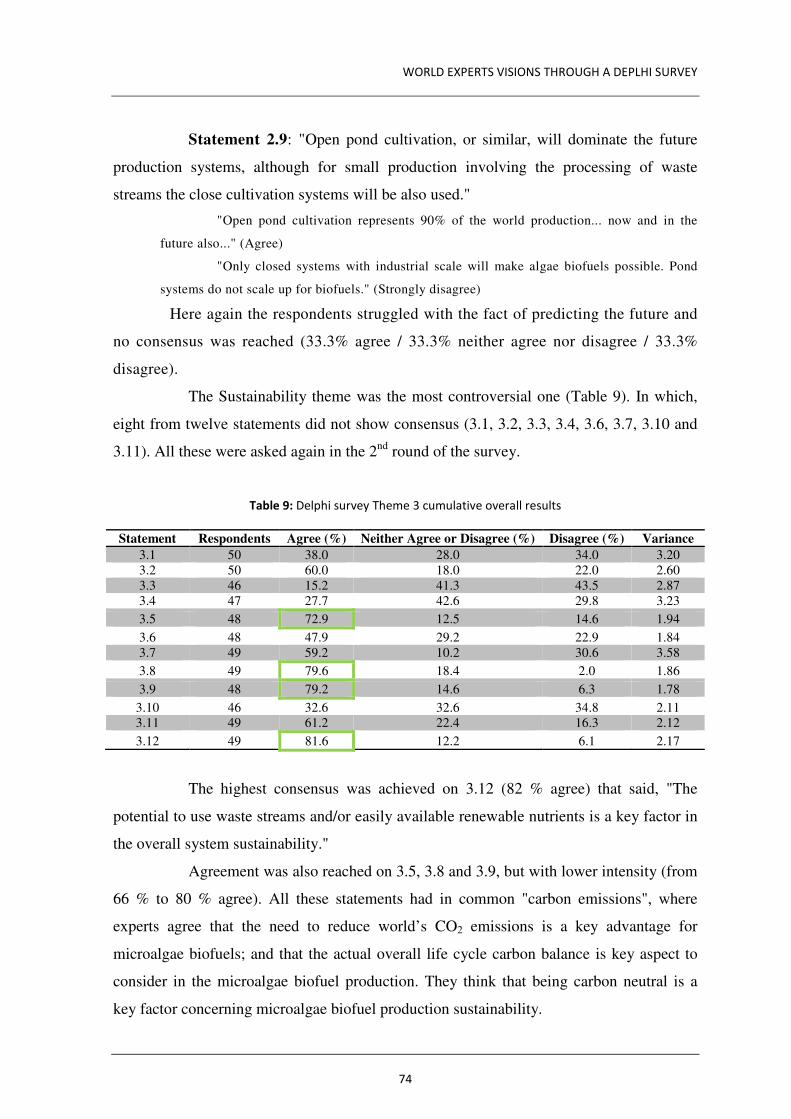
WORLD EXPERTS VISIONS THROUGH A DEPLHI SURVEY
74
Statement 2.9: "Open pond cultivation, or similar, will dominate the future
production systems, although for small production involving the processing of waste
streams the close cultivation systems will be also used."
"Open pond cultivation represents 90% of the world production... now and in the
future also..." (Agree)
"Only closed systems with industrial scale will make algae biofuels possible. Pond
systems do not scale up for biofuels." (Strongly disagree)
Here again the respondents struggled with the fact of predicting the future and
no consensus was reached (33.3% agree / 33.3% neither agree nor disagree / 33.3%
disagree).
The Sustainability theme was the most controversial one (Table 9). In which,
eight from twelve statements did not show consensus (3.1, 3.2, 3.3, 3.4, 3.6, 3.7, 3.10 and
3.11). All these were asked again in the 2nd round of the survey.
Table 9: Delphi survey Theme 3 cumulative overall results
Statement Respondents Agree (%) Neither Agree or Disagree (%) Disagree (%) Variance
3.1 50 38.0 28.0 34.0 3.20 3.2 50 60.0 18.0 22.0 2.60 3.3 46 15.2 41.3 43.5 2.87 3.4 47 27.7 42.6 29.8 3.23
3.5 48 72.9 12.5 14.6 1.94
3.6 48 47.9 29.2 22.9 1.84 3.7 49 59.2 10.2 30.6 3.58
3.8 49 79.6 18.4 2.0 1.86
3.9 48 79.2 14.6 6.3 1.78
3.10 46 32.6 32.6 34.8 2.11 3.11 49 61.2 22.4 16.3 2.12
3.12 49 81.6 12.2 6.1 2.17
The highest consensus was achieved on 3.12 (82 % agree) that said, "The
potential to use waste streams and/or easily available renewable nutrients is a key factor in
the overall system sustainability."
Agreement was also reached on 3.5, 3.8 and 3.9, but with lower intensity (from
66 % to 80 % agree). All these statements had in common "carbon emissions", where
experts agree that the need to reduce world’s CO2 emissions is a key advantage for
microalgae biofuels; and that the actual overall life cycle carbon balance is key aspect to
consider in the microalgae biofuel production. They think that being carbon neutral is a
key factor concerning microalgae biofuel production sustainability.
WORLD EXPERTS VISIONS THROUGH A DEPLHI SURVEY
75
From the ones asked on the 2nd round, it is interesting to highlight that because
biofuels of this origin do not have a well-known industrial process (there are different
methods for producing them) and microalgae are not yet being cultivated commercially for
this purpose, it was difficult for the experts to answer questions related to sustainability.
Some of the comments to these questions were:
Statement 3.3: "Open pond cultivation is more environmentally friendly
than PBRs cultivation."
"More information and practical data is needed to answer this one." (Neither agree
nor disagree).
"There is not sufficient evidence in the literature to support or negate this statement."
(Neither agree nor disagree).
"That depends on the nutrient source, direct and indirect land use and other issues
specific to each site." (Disagree).
Although there is a tendency on disagreement, no clear consensus was reached
(10.3% agree / 34.5% neither agree nor disagree / 55.2% disagree),
Statement 3.6: "The production of algae biofuels in large scale could generate
potential impacts on local ecosystems from new algal species."
"All these statements are dependent on other factors, therefore difficult to respond
with just a simple agree/disagree."; (Disagree)
"The "potential" is certainly there for affecting local ecosystems; the issue comes
down to containment and safety contingency planning." (Agree)
"if genetically modified organisms are used, that could be an issue." (Agree)
No consensus was reached (34.5% agree / 31.0% neither agree nor disagree /
34.5% disagree).
Statement 3.10: "Some potential undesired environmental aspects may
arise from microalgae cultivation, as for example, increased emissions of NOx and/or
methane."
"Depends on the processes utilized for product and co-products generation/use."
(Neither agree nor disagree)
"Possible situation, in particular if the cultivation systems are not well designed or
adjusted." (Agree)
"Only if actions to minimize/restrict those impacts are not taken." (Disagree).
No consensus was reached (20.7% agree / 37.9% neither agree nor disagree /
34.5% disagree).

WORLD EXPERTS VISIONS THROUGH A DEPLHI SURVEY
76
Theme 4 concerned "Policies", where several prospects of policies were
presented and the respondents were asked to choose "How important is each policy below
to the success of microalgae biofuels?" The answers were presented in a seven-level Likert
scale ranging from "Unimportant" to "Extremely Important". The policies presented are
displayed in Table 10.
Table 10: Delphi survey Theme 4 statements and results
Theme 4: POLICIES
Mean
4.1 Mandatory country objectives; 5.52 4.2 Sustainability standards (Emissions, production, etc.); 5.70 4.3 Public Investment in R&D; 6.09 4.4 Tax incentives and subsidies; 5.71
4.5 Certification schemes, in particular those concerning raw materials or the entire fuel life cycle;
5.48
4.6 Specific legislation or international agreements (such as European Directives) aimed specifically to biofuels or to specific environmental questions (such as carbon emissions) where biofuels have a pivotal role;
5.70
4.7 Development strategies aimed to renewable resources, either research, utilization and integration in existing systems.
5.91
All policies were seen by experts as important, in which the sum of
"Important", "Very Important" and "Extremely Important" in all items were above 80% of
valid responses. In an attempt to rank, which were the most important ones, values were set
from 1 to 7 to "Unimportant" through "Extremely Important". Consequently, it was
possible to estimate the most important policies in the view of the experts interviewed. For
that purpose, an overall mean was computed for each policy and is presented in Table 10.
Analyzing this data, experts believe that "Public Investment in R&D" is the most important
mechanism to develop microalgae biofuels. However, the other mechanisms were also
important for this purpose and it is a sum of efforts that makes the development to go on.
In order to better specify which policies were the most important ones, in the
2nd round the same set of policies were given, but this time, the respondents were asked to
rank them (from 1-most important to 7-least important) without repeating numbers. The
results were similar to the ones from the first survey: public investment in R&D was
elected as the most important one, with a statistic mode of 1 (most important) chosen by
34.5% of the respondents and ranked in the top 3 to other 27.6% of the respondents. This
policy was followed by "developing strategies aimed to renewable resources, either
research, utilization and integration in existing systems"; "tax incentives and subsidies";
and "mandatory country objectives", subsequently. The results from Theme 4 in the 2nd
round are presented in Table 11.
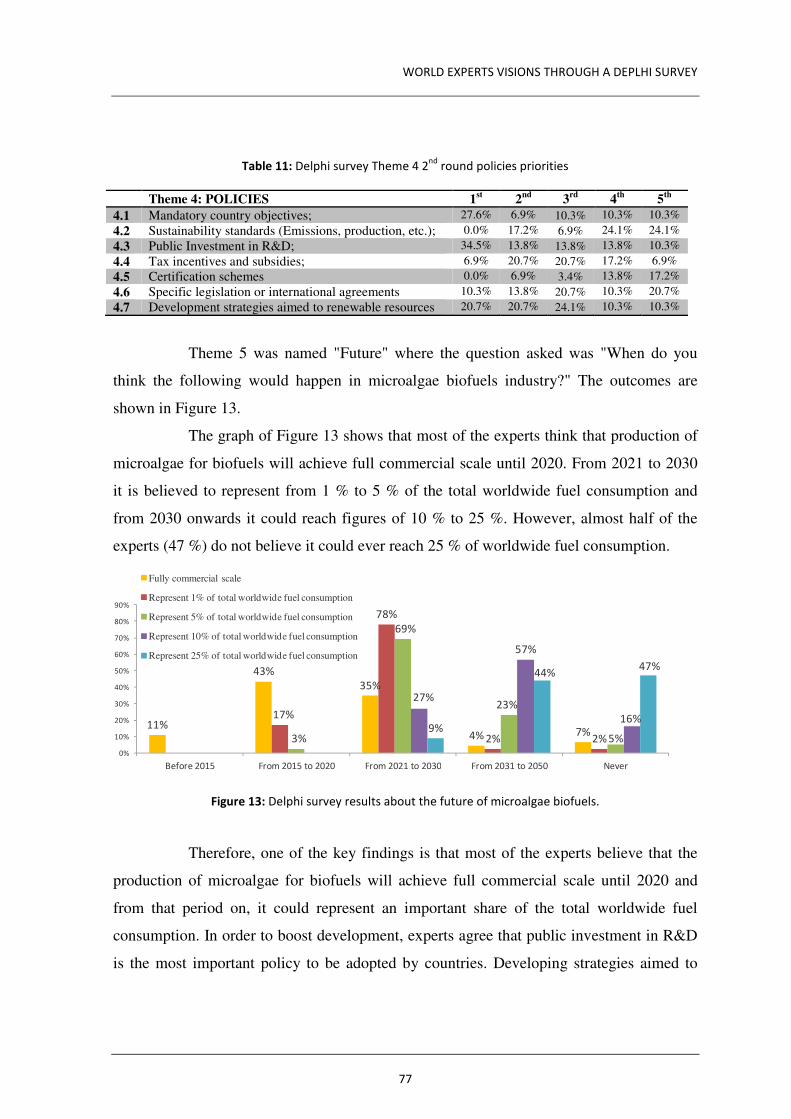
WORLD EXPERTS VISIONS THROUGH A DEPLHI SURVEY
77
Table 11: Delphi survey Theme 4 2nd
round policies priorities
Theme 4: POLICIES 1st 2nd 3rd 4th 5th
4.1 Mandatory country objectives; 27.6% 6.9% 10.3% 10.3% 10.3%
4.2 Sustainability standards (Emissions, production, etc.); 0.0% 17.2% 6.9% 24.1% 24.1%
4.3 Public Investment in R&D; 34.5% 13.8% 13.8% 13.8% 10.3%
4.4 Tax incentives and subsidies; 6.9% 20.7% 20.7% 17.2% 6.9%
4.5 Certification schemes 0.0% 6.9% 3.4% 13.8% 17.2%
4.6 Specific legislation or international agreements 10.3% 13.8% 20.7% 10.3% 20.7%
4.7 Development strategies aimed to renewable resources 20.7% 20.7% 24.1% 10.3% 10.3%
Theme 5 was named "Future" where the question asked was "When do you
think the following would happen in microalgae biofuels industry?" The outcomes are
shown in Figure 13.
The graph of Figure 13 shows that most of the experts think that production of
microalgae for biofuels will achieve full commercial scale until 2020. From 2021 to 2030
it is believed to represent from 1 % to 5 % of the total worldwide fuel consumption and
from 2030 onwards it could reach figures of 10 % to 25 %. However, almost half of the
experts (47 %) do not believe it could ever reach 25 % of worldwide fuel consumption.
Figure 13: Delphi survey results about the future of microalgae biofuels.
Therefore, one of the key findings is that most of the experts believe that the
production of microalgae for biofuels will achieve full commercial scale until 2020 and
from that period on, it could represent an important share of the total worldwide fuel
consumption. In order to boost development, experts agree that public investment in R&D
is the most important policy to be adopted by countries. Developing strategies aimed to
11%
43%
35%
4% 7%
17%
78%
2% 2%3%
69%
23%
5%
27%
57%
16%9%
44%47%
0%
10%
20%
30%
40%
50%
60%
70%
80%
90%
Before 2015 From 2015 to 2020 From 2021 to 2030 From 2031 to 2050 Never
Fully commercial scale
Represent 1% of total worldwide fuel consumption
Represent 5% of total worldwide fuel consumption
Represent 10% of total worldwide fuel consumption
Represent 25% of total worldwide fuel consumption
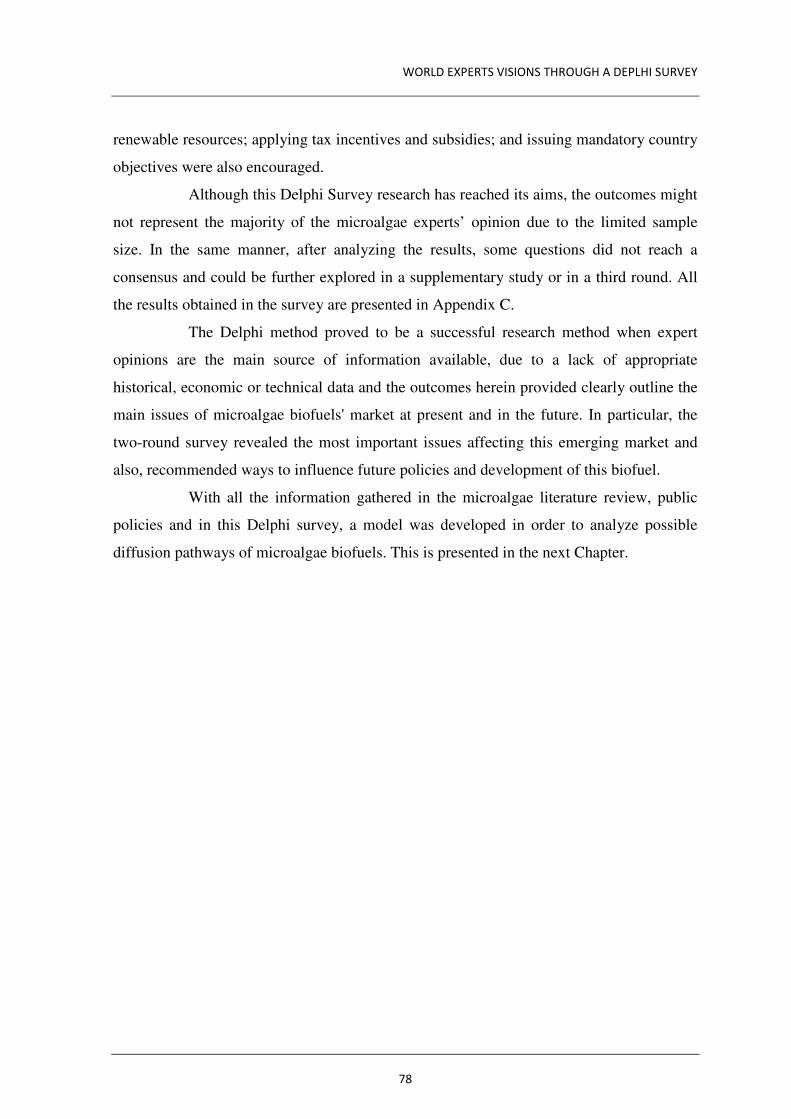
WORLD EXPERTS VISIONS THROUGH A DEPLHI SURVEY
78
renewable resources; applying tax incentives and subsidies; and issuing mandatory country
objectives were also encouraged.
Although this Delphi Survey research has reached its aims, the outcomes might
not represent the majority of the microalgae experts’ opinion due to the limited sample
size. In the same manner, after analyzing the results, some questions did not reach a
consensus and could be further explored in a supplementary study or in a third round. All
the results obtained in the survey are presented in Appendix C.
The Delphi method proved to be a successful research method when expert
opinions are the main source of information available, due to a lack of appropriate
historical, economic or technical data and the outcomes herein provided clearly outline the
main issues of microalgae biofuels' market at present and in the future. In particular, the
two-round survey revealed the most important issues affecting this emerging market and
also, recommended ways to influence future policies and development of this biofuel.
With all the information gathered in the microalgae literature review, public
policies and in this Delphi survey, a model was developed in order to analyze possible
diffusion pathways of microalgae biofuels. This is presented in the next Chapter.
MODELING POLICIES IMPACTS ON BIOFUELS MARKET DIFFUSION
79
5. MODELING POLICIES IMPACTS ON BIOFUELS
MARKET DIFFUSION
To analyze the impact of different policies in the transportation fuel market
share, a computational model using Stochastic Automata Networks (SANs) was built.
First, a basic model reflecting the scenario without policies was constructed and then
different policies were added. The objective was not only to investigate the effect of each
specific policy alone, but also the interplay among the different policies. The basic model
is parameterized by the prices of fuels and their availability (taking into account not only
the availability of the fuel itself for end-consumers, but also of vehicles using this fuel).
The policies model is an extension of the basic model including 4 different policies that
tackle: subsidies, taxes, R&D investments and mandates. Diverse U.S. transportation
scenarios were analyzed in the period from 2010 to 2040. The analysis consists of
searching for the equilibrium state (steady state) in each scenario. This equilibrium state
represents the market share that results from the given parameters of the scenario.
In the following, after a short introduction to SANs, the construction of the
basic and policy models are presented, and then the results of the analysis of some
scenarios are discussed.
5.1. Stochastic Automata Network
In the Stochastic Automata Network (SAN) formalism (Plateau, 1985; Baldo et
al., 2005), a system is modeled by interacting subsystems, which are represented by
automata. An automaton is composed by states and transitions labeled with event names.
These automata may evolve independently with local events (that may affect only the local
state of the automata participating in this event), or by synchronizing events that are used
to model joint evolution of two or more automata. With the association of distribution
probabilities to the events, the labeled transition system generated by a SAN gives rise to a
Markov Chain and it is possible to calculate the steady state probability of each state of a
SAN. More precisely, to each event there is an occurrence rate associated. The inverse of
MODELING POLICIES IMPACTS ON BIOFUELS MARKET DIFFUSION
80
the occurrence rate is the mean value of the exponential distribution function that regulates
the time interval between two occurrences of the event.
A SAN defines the set of events that are used to synchronize the different
automata during the execution. The state changes of SANs are possible when all different
automata that may be engaged in some event are in some state in which a transition labeled
with this event is possible. Note that since there may be different transitions labeled with
the same event, there may be different reachable states starting with the same state and
executing the same event.
SAN has been employed to flexibly model and analyze different kinds of
systems, such as: prediction of geological stratal stacking patterns (Assunção et al., 2013);
performance evaluation of software development teams (Fernandes et al., 2011); process
scheduling for NUMA machines (Chanin et al., 2006); master/slave parallel programs
(Baldo et al., 2005); ad hoc wireless networks (Dotti et al., 2005); production line
(Fernandes et al., 2013); quality of service assessment in multi-tier web services (Czekster
et al., 2011); spatial distribution of mobile nodes (physical mobility models) (Dotti et al.,
2011), to cite a few.
5.1.1. Comparing SAN with other modeling techniques
This section presents a comparison of recent studies analyzing the impacts and
consequences of biofuel policies using different model generators techniques. Some of
these techniques are: TIMES-MARKAL, ESIM, AGLINK-COSIMO, CAPRI, IMPACT
and GTAP models (Loulou et al., 2005; Taheripour, et al., 2008; Banse et al., 2010;
OECD, 2006; Britz and Witzke, 2012; Rosegrant et al., 2012). The purpose of this review
is to illustrate the variety of output that could be obtained from such techniques, to discuss
the pros and cons of the different models, and to provide some insights that may be useful
when comparing the results reported later in this study. It is to mention, that the selection
of techniques is not comprehensive. The main selection criteria are that the study involving
the technology should be recent, and that its objective should be relevant to that of the
current study.
There are many ways in which a mathematical model can be built to describe
the reality to be studied. A fundamental difference among modeling techniques is whether
the model is constructed based on an external or on an internal perspective. External means
MODELING POLICIES IMPACTS ON BIOFUELS MARKET DIFFUSION
81
that the result of observations gives rise to the model. Typically, such model captures
relations among the variables that are relevant to the system (like e.g. equations), and are
called analytical models. Having an internal perspective means that the way the system
behaves is captured by the model, that is, the cause/effect relation is used to build the
model. These are termed computational models. The emphasis here resides not only to
model that some relationship among inputs and results are obtained, but rather on why they
are obtained. Building a computational model requires thus a deeper understanding of the
system being modeled. But, once there is a computational model that closely describes a
reality, it is possible not only to analyze which equilibrium states are reached (like it is the
case of analytical methods), but also to reason about the process of reaching such states. In
many situations, understanding the process may be even more important than knowing the
result of the process. Synthesizing, a computational method emphasizes the process being
modeled, whereas analytical methods emphasize the result of this process.
An example of computational model is the agent-based computational
economics (ACE), which is the computational study of economies modeled as evolving
systems of autonomous interacting agents (Tesfatsion, 2002). An important characteristic
of ACE is interactions of autonomous agents, as described by Tesfatsion (2002; p.23):
“The dynamics of the ensuing economic process are governed by agent-agent interactions, not by exogenously imposed systems of equations, and the state of the economy at each point in time is given by the internal attributes of the individual agents that currently populate the economy. ”
The SAN model presented in the next sections can be described as a partial
equilibrium model governed by agent-agent interactions, where the agents are the users of
fuels that compose the U.S. transportation market. But, unlike a pure agent system, a
network of automata is used allowing the computation of equilibrium states (steady states).
Regarding other model generators, a well-known system that is often used for
modeling energy scenarios is TIMES (The Integrated MARKAL-EFOM System). TIMES
is an analytical model whereas SAN is a computational model. This means that in TIMES
the reality is described by some of its properties (in TIMES, the equations of the linear
programming model). Finding an equilibrium in TIMES means to find values for the
interest variables of the equations, such that they are all satisfied in an optimum way
(Loulou et al., 2005). This equilibrium is in terms of variables that denote consumers and
producers (or, said in another way, in terms of prices and quantities). In a computational
MODELING POLICIES IMPACTS ON BIOFUELS MARKET DIFFUSION
82
model, like SANs, a system is described by its behavior, that is, by the actions or events
that may take place. A SAN typically models a complex system as a set of different
subsystems that may interact and influence each other. If, at some moment in time, more
than different future is possible, this can be modeled in SANs by giving different rates to
transitions denoting these different evolutions of the system. These rates may vary over
time since they may depend on the state of the system. An equilibrium state in a SAN
(called steady state) describes that the modeled system converges to situation in which the
relationships among all its subsystems is constant. This equilibrium state may be found
analyzing all possible states of the system (this is performed by solving a Markov model,
in SANs the solution is optimized such that it is not necessary to consider states that would
never be reached).
SAN is a general purpose modeling formalism and, as such, it could be
possible to construct many different SAN models to describe different aspects of a system.
Here, a model that describes the behavior of consumers (users of transportation) is built,
given different kinds of energy and their corresponding prices and availabilities of different
energy sources. The aim is not to find the prices of fuel that would bring a system to some
equilibrium, but rather to understand how the users may move from one fuel to another,
given as input the prices and availabilities. The result of a run of the model is the market
share induced by these inputs. Policies may alter prices and/or availability of items, thus
they may be given as inputs as well, and will influence the market share by making it more
or less likely that users opt for some kind of fuel.
In both models, calibration of the reference model is crucial, and means, in the
case of TIMES, to find the right values of the parameters to build the equations that model
reality, and in the case of SANs, finding the right rates for the transitions that make the
system evolve.
TIMES is a very sophisticated tool to model energy systems, taking into
account hundreds of different parameters. This is necessary because analytical models
describe a system by its observations and thus the more parameters and equations we have,
the more accurate the model will be. However, this may make models very large and
difficult to fully understand. Moreover, the fact that non-commercial immature
technologies do not have a well-known process of production makes it difficult to insert all
the inputs needed for an accurate model.
MODELING POLICIES IMPACTS ON BIOFUELS MARKET DIFFUSION
83
SANs model reality in a simpler way, but knowledge on the intrinsic behavior
of the system is required. For each transition that the system may perform, it is necessary
to exactly state what is the situation that triggers the transition and what its effect is.
Moreover, in a stochastic model, the probability that this transition happens must also be
given. This means that a deeper understanding of the system is needed to build a SAN. But
if it is possible to construct and calibrate a SAN to depict some reality, the analysis that can
be done is far richer because we can analyze not only the final state but the whole process
(for example, we may investigate not only the final state of the system, but analyze how
this state can be reached). Moreover, by having an explicit behavior model the results can
be better understood and explained.
There coexist also additional analytical representations that were used to model
policies in the scope of biofuels. They possess many similarities to TIMES and thus, the
comparison with SANs is analogous. The main difficulty to use these modeling techniques
resides in the facts that it is not possible to include microalgae biofuels or advanced
biofuels, since most of them already come with a fixed set of possible biofuel feedstocks in
the system. In the following paragraph, some of these modeling tools are described.
GTAP is a multiregional, multisectoral, computable general equilibrium model
with perfect competition (Taheripour, et al., 2008). One of the latest versions of GTAP,
known as GTAP-E, has been extended to deal with substitution between biofuels and fossil
fuel for transport use and climate change policies. However, only three different feedstock
for biofuels are explicitly modeled: maize-based ethanol, sugar-cane-based ethanol and
biodiesel. Advanced Biofuels are not supported (Taheripour, et al., 2008; Fonseca et al.,
2010).
The ESIM model is a partial equilibrium multi-country model of the
agricultural sector (Banse et al., 2010). Since it is mainly designed to simulate agricultural
markets in the EU, policies are modeled only for these countries. Concerning biofuels, it
only contains explicit supply and demand functions for biodiesel and ethanol (Banse et al.,
2010; Fonseca et al, 2010).
Similar to ESIM model, AGLINK-COSIMO (OECD, 2006), CAPRI (Britz and
Witzke, 2012) and IMPACT (Rosegrant et al., 2012) are economic models for the
agricultural sector. They incorporate a wide range of agricultural and trade policies for
several countries and regions. They are mainly used for food market related issues,
MODELING POLICIES IMPACTS ON BIOFUELS MARKET DIFFUSION
84
measuring alternative futures for global food supply, demand, trade, prices, and food
security (Britz and Witzke, 2012; Rosegrant et al., 2012; OECD, 2006). They possess 1st
generation feedstocks for biofuels production. Microalgae are not supported as a feedstock.
Analyzing all these modeling tools, the main drawback related to microalgae
biofuels or advanced biofuels is that they are closed systems and these emerging
technologies cannot be inserted easily. Apart from that, they were not tailored to model
energy sources, but instead food markets (with the exception of TIMES), and this could
mislead the focus of the research.
The TIMES model was the only one among them in which it was possible to
insert new technologies, such as microalgae as a feedstock for biofuels, and much more
emphasis was given to this possibility. However, to insert a new technology, a production
process has to be given, with all the inputs related to this process. Complex data regarding
the inputs characterization, quantities, emissions and costs are necessary. It would be
possible to choose one microalgae process and fulfill these requirements. Yet, as
abovementioned, cultivating microalgae is still an immature technology and there are
hundreds of pathways to produce different types of fuels and co-products. These distinctive
processes generate diverse emissions, quantities of biofuels and can possess very different
costs. Therefore, it would be misleading to choose one single microalgae process for
producing biofuel and use it for modeling different policies. A simpler model without the
need of these complex inputs would be a superior choice for the purposes of this thesis.
With this in mind, a SAN-based model with this autonomy was developed from scratch, in
order to model this emerging technology without the need of fixing a production process
that is yet not well established for the case of microalgae fuel.
5.2. Modeling policies
The United States transportation market was chosen due to its representative
share of algal biofuel producing companies nowadays and because of the potential for
future growth. Therefore, all the results presented in this chapter rely on the U.S.
transportation sector.
In order to develop a full scenario (from 2010 to 2040), each year inputs have
to be defined and ran separately using the software SAN Lite Solver, and then the results
MODELING POLICIES IMPACTS ON BIOFUELS MARKET DIFFUSION
85
of each year are aggregated to build a curve. The inputs and basic assumptions are
presented in the next section.
5.2.1. Model assumptions
In order to reduce the uncertainty and simplify the model, the Advanced
Biofuels share is considered as a sum of cellulosic biofuel, biomass-based diesel and
advanced biofuel shares of the RFS2. This basic assumption was made due to the difficulty
to analyze each of these emerging biofuels separately, and forecast their market diffusion.
The reference scenario considered the years from 2010 to 2040 and the only
policy used was 1st generation biofuels mandate, because it already affects the market share
greatly. Since in this study Biofuels, Gasoline/Diesel and Advanced Biofuels are expressed
in units that have the same energy content (MBtu per gallon), we are assuming that these
fuels are perfect substitutes. The main variables that need to be set for each year and for
each of the energy sources are price, availability and policies. An energy-equivalent price
was computed relying on EIA reference prices (U.S. EIA, 2013). The availability ranges
from 0 to 100, as 0 being no availability and 100 being total availability. This variable
takes into account the availability of resource, fueling stations and vehicles that run with
that energy source. The availability and change costs are described as follows but were
defined through a rigorous step of calibration presented in Section 5.2.4.
The model consists of 5 automata representing the users of each considered
energy source: Petrol, Gas, Biofuels, Advanced Biofuels and Electricity. The basic
assumptions made for each of these automata are described as follows.
5.2.1.1. Petrol Share
Gasoline and Diesel together represent the Petrol share of the model. Aviation
fuels and other petrol derivatives were not considered in this study. Future prices of
Gasoline were based on EIA reference case study (U.S. EIA, 2013) and converted to an
energy-equivalent basis (Dollars per MBtu). The Petrol prices used as inputs for each year
in the model are presented in Table 12. Diesel prices were not taken into account.
Concerning Petrol availability, it was set to a maximum (100) because it is widely
available in gas stations all over the U.S. and it is quite easy acquire a car that runs on
gasoline or diesel.
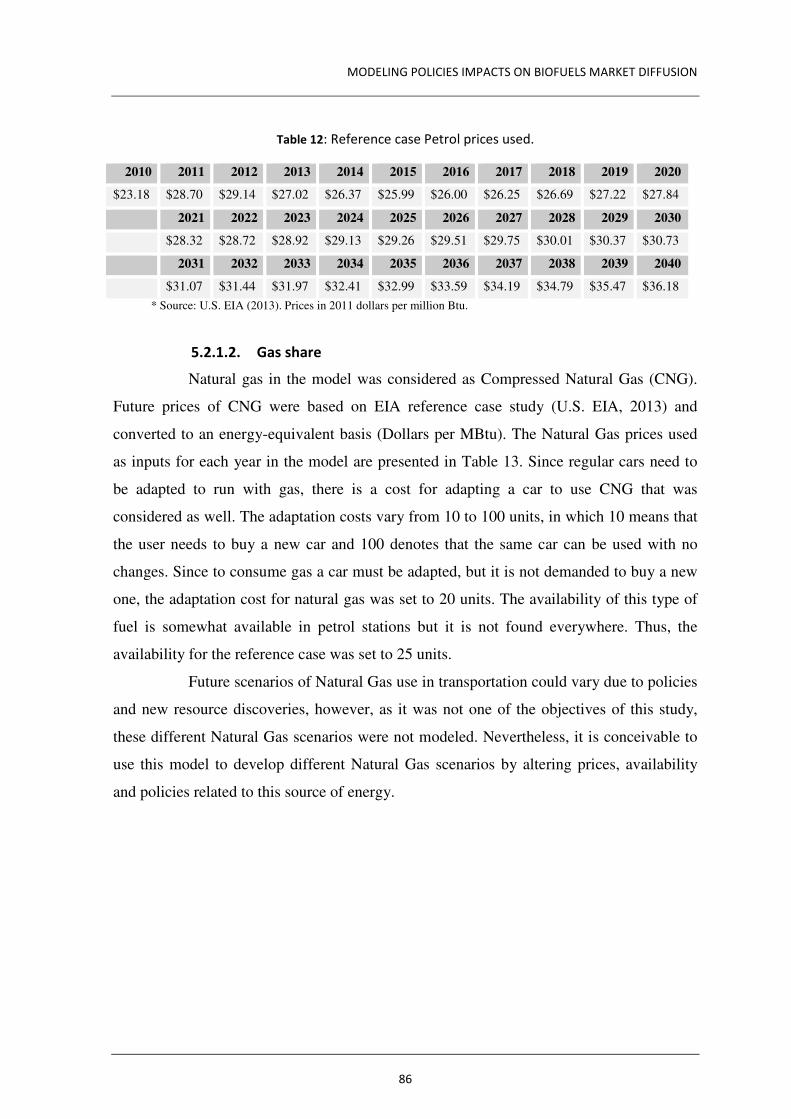
MODELING POLICIES IMPACTS ON BIOFUELS MARKET DIFFUSION
86
Table 12: Reference case Petrol prices used.
2010 2011 2012 2013 2014 2015 2016 2017 2018 2019 2020
$23.18 $28.70 $29.14 $27.02 $26.37 $25.99 $26.00 $26.25 $26.69 $27.22 $27.84
2021 2022 2023 2024 2025 2026 2027 2028 2029 2030
$28.32 $28.72 $28.92 $29.13 $29.26 $29.51 $29.75 $30.01 $30.37 $30.73
2031 2032 2033 2034 2035 2036 2037 2038 2039 2040
$31.07 $31.44 $31.97 $32.41 $32.99 $33.59 $34.19 $34.79 $35.47 $36.18
* Source: U.S. EIA (2013). Prices in 2011 dollars per million Btu.
5.2.1.2. Gas share
Natural gas in the model was considered as Compressed Natural Gas (CNG).
Future prices of CNG were based on EIA reference case study (U.S. EIA, 2013) and
converted to an energy-equivalent basis (Dollars per MBtu). The Natural Gas prices used
as inputs for each year in the model are presented in Table 13. Since regular cars need to
be adapted to run with gas, there is a cost for adapting a car to use CNG that was
considered as well. The adaptation costs vary from 10 to 100 units, in which 10 means that
the user needs to buy a new car and 100 denotes that the same car can be used with no
changes. Since to consume gas a car must be adapted, but it is not demanded to buy a new
one, the adaptation cost for natural gas was set to 20 units. The availability of this type of
fuel is somewhat available in petrol stations but it is not found everywhere. Thus, the
availability for the reference case was set to 25 units.
Future scenarios of Natural Gas use in transportation could vary due to policies
and new resource discoveries, however, as it was not one of the objectives of this study,
these different Natural Gas scenarios were not modeled. Nevertheless, it is conceivable to
use this model to develop different Natural Gas scenarios by altering prices, availability
and policies related to this source of energy.
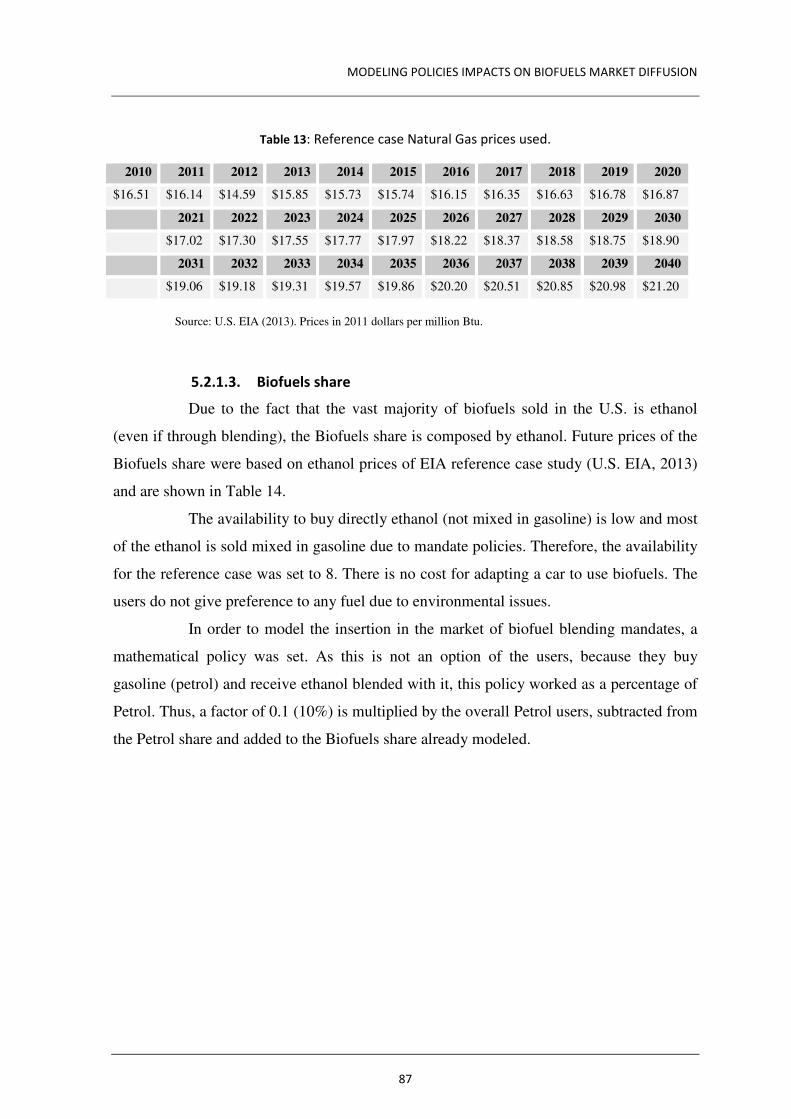
MODELING POLICIES IMPACTS ON BIOFUELS MARKET DIFFUSION
87
Table 13: Reference case Natural Gas prices used.
2010 2011 2012 2013 2014 2015 2016 2017 2018 2019 2020
$16.51 $16.14 $14.59 $15.85 $15.73 $15.74 $16.15 $16.35 $16.63 $16.78 $16.87
2021 2022 2023 2024 2025 2026 2027 2028 2029 2030
$17.02 $17.30 $17.55 $17.77 $17.97 $18.22 $18.37 $18.58 $18.75 $18.90
2031 2032 2033 2034 2035 2036 2037 2038 2039 2040
$19.06 $19.18 $19.31 $19.57 $19.86 $20.20 $20.51 $20.85 $20.98 $21.20
Source: U.S. EIA (2013). Prices in 2011 dollars per million Btu.
5.2.1.3. Biofuels share
Due to the fact that the vast majority of biofuels sold in the U.S. is ethanol
(even if through blending), the Biofuels share is composed by ethanol. Future prices of the
Biofuels share were based on ethanol prices of EIA reference case study (U.S. EIA, 2013)
and are shown in Table 14.
The availability to buy directly ethanol (not mixed in gasoline) is low and most
of the ethanol is sold mixed in gasoline due to mandate policies. Therefore, the availability
for the reference case was set to 8. There is no cost for adapting a car to use biofuels. The
users do not give preference to any fuel due to environmental issues.
In order to model the insertion in the market of biofuel blending mandates, a
mathematical policy was set. As this is not an option of the users, because they buy
gasoline (petrol) and receive ethanol blended with it, this policy worked as a percentage of
Petrol. Thus, a factor of 0.1 (10%) is multiplied by the overall Petrol users, subtracted from
the Petrol share and added to the Biofuels share already modeled.
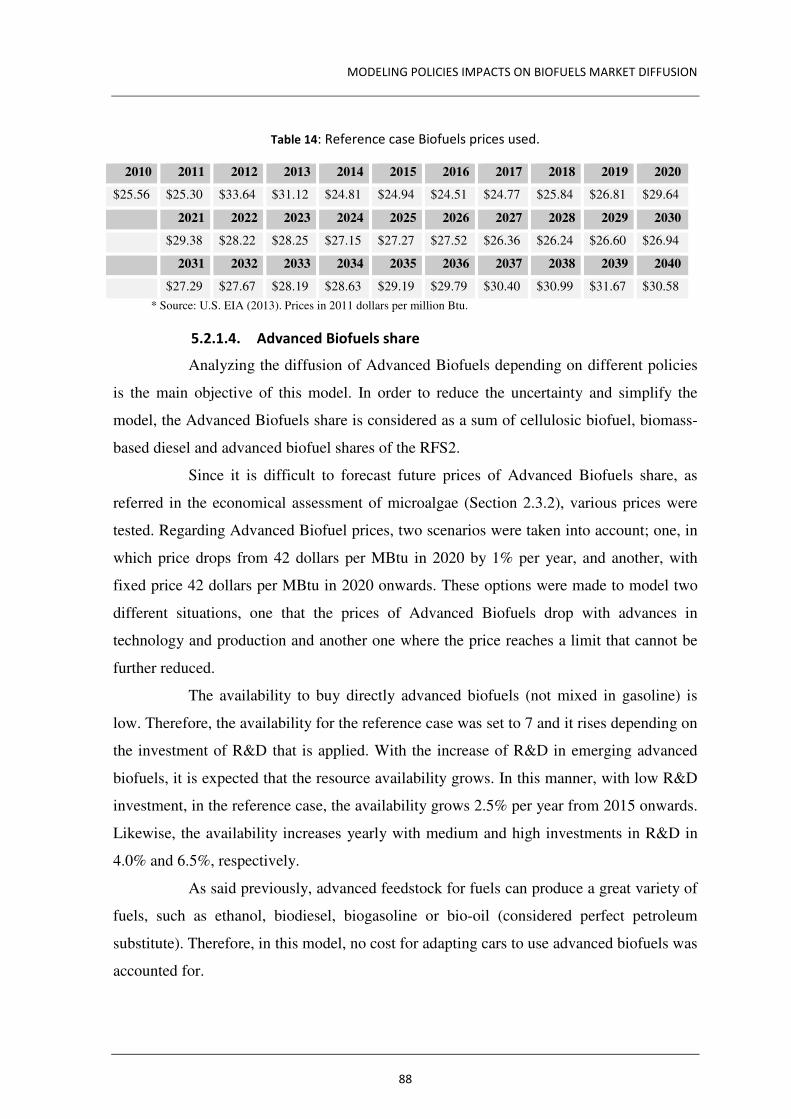
MODELING POLICIES IMPACTS ON BIOFUELS MARKET DIFFUSION
88
Table 14: Reference case Biofuels prices used.
2010 2011 2012 2013 2014 2015 2016 2017 2018 2019 2020
$25.56 $25.30 $33.64 $31.12 $24.81 $24.94 $24.51 $24.77 $25.84 $26.81 $29.64
2021 2022 2023 2024 2025 2026 2027 2028 2029 2030
$29.38 $28.22 $28.25 $27.15 $27.27 $27.52 $26.36 $26.24 $26.60 $26.94
2031 2032 2033 2034 2035 2036 2037 2038 2039 2040
$27.29 $27.67 $28.19 $28.63 $29.19 $29.79 $30.40 $30.99 $31.67 $30.58
* Source: U.S. EIA (2013). Prices in 2011 dollars per million Btu.
5.2.1.4. Advanced Biofuels share
Analyzing the diffusion of Advanced Biofuels depending on different policies
is the main objective of this model. In order to reduce the uncertainty and simplify the
model, the Advanced Biofuels share is considered as a sum of cellulosic biofuel, biomass-
based diesel and advanced biofuel shares of the RFS2.
Since it is difficult to forecast future prices of Advanced Biofuels share, as
referred in the economical assessment of microalgae (Section 2.3.2), various prices were
tested. Regarding Advanced Biofuel prices, two scenarios were taken into account; one, in
which price drops from 42 dollars per MBtu in 2020 by 1% per year, and another, with
fixed price 42 dollars per MBtu in 2020 onwards. These options were made to model two
different situations, one that the prices of Advanced Biofuels drop with advances in
technology and production and another one where the price reaches a limit that cannot be
further reduced.
The availability to buy directly advanced biofuels (not mixed in gasoline) is
low. Therefore, the availability for the reference case was set to 7 and it rises depending on
the investment of R&D that is applied. With the increase of R&D in emerging advanced
biofuels, it is expected that the resource availability grows. In this manner, with low R&D
investment, in the reference case, the availability grows 2.5% per year from 2015 onwards.
Likewise, the availability increases yearly with medium and high investments in R&D in
4.0% and 6.5%, respectively.
As said previously, advanced feedstock for fuels can produce a great variety of
fuels, such as ethanol, biodiesel, biogasoline or bio-oil (considered perfect petroleum
substitute). Therefore, in this model, no cost for adapting cars to use advanced biofuels was
accounted for.
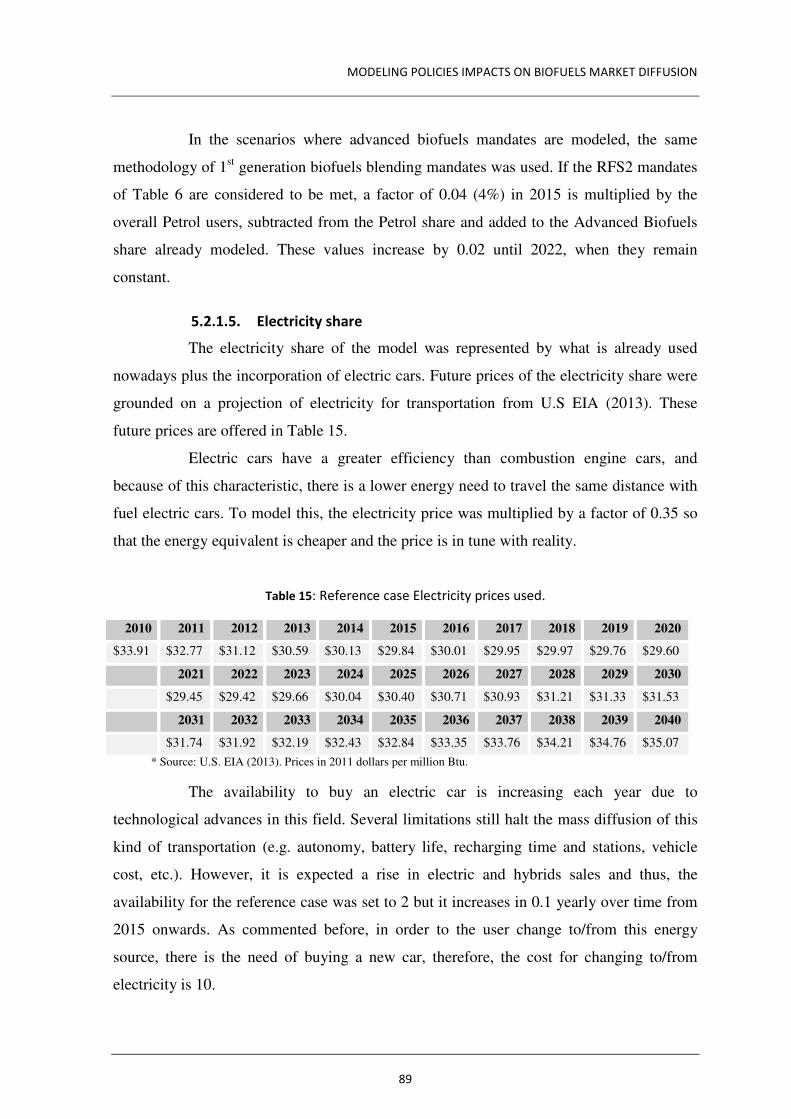
MODELING POLICIES IMPACTS ON BIOFUELS MARKET DIFFUSION
89
In the scenarios where advanced biofuels mandates are modeled, the same
methodology of 1st generation biofuels blending mandates was used. If the RFS2 mandates
of Table 6 are considered to be met, a factor of 0.04 (4%) in 2015 is multiplied by the
overall Petrol users, subtracted from the Petrol share and added to the Advanced Biofuels
share already modeled. These values increase by 0.02 until 2022, when they remain
constant.
5.2.1.5. Electricity share
The electricity share of the model was represented by what is already used
nowadays plus the incorporation of electric cars. Future prices of the electricity share were
grounded on a projection of electricity for transportation from U.S EIA (2013). These
future prices are offered in Table 15.
Electric cars have a greater efficiency than combustion engine cars, and
because of this characteristic, there is a lower energy need to travel the same distance with
fuel electric cars. To model this, the electricity price was multiplied by a factor of 0.35 so
that the energy equivalent is cheaper and the price is in tune with reality.
Table 15: Reference case Electricity prices used.
2010 2011 2012 2013 2014 2015 2016 2017 2018 2019 2020
$33.91 $32.77 $31.12 $30.59 $30.13 $29.84 $30.01 $29.95 $29.97 $29.76 $29.60
2021 2022 2023 2024 2025 2026 2027 2028 2029 2030
$29.45 $29.42 $29.66 $30.04 $30.40 $30.71 $30.93 $31.21 $31.33 $31.53
2031 2032 2033 2034 2035 2036 2037 2038 2039 2040
$31.74 $31.92 $32.19 $32.43 $32.84 $33.35 $33.76 $34.21 $34.76 $35.07
* Source: U.S. EIA (2013). Prices in 2011 dollars per million Btu.
The availability to buy an electric car is increasing each year due to
technological advances in this field. Several limitations still halt the mass diffusion of this
kind of transportation (e.g. autonomy, battery life, recharging time and stations, vehicle
cost, etc.). However, it is expected a rise in electric and hybrids sales and thus, the
availability for the reference case was set to 2 but it increases in 0.1 yearly over time from
2015 onwards. As commented before, in order to the user change to/from this energy
source, there is the need of buying a new car, therefore, the cost for changing to/from
electricity is 10.

MODELING POLICIES IMPACTS ON BIOFUELS MARKET DIFFUSION
90
Similarly to natural gas, many different scenarios could be modeled regarding
different future paths for electric cars. However, since electric cars are not the main
objective of this study, just one pathway was considered. The reference baseline for hybrid
and electric cars was based on EIA (2013), and set to 20 million cars on the market in 2040
(accounting for cars and light trucks). These numbers contrast to 240 million conventional
cars and light trucks in 2040 in the U.S. using gasoline and diesel (EIA, 2013). Therefore,
in this scenario, it is not expected elevated electricity consumption and diffusion of the
Electricity Share of the model. As stated earlier, another reason for this low level of
diffusion is that electric cars are more efficient than conventional cars and will use less
energy to travel the same distance, and the overall transportation market diffusion of this
model is presented in an energy unit basis. More optimistic assumptions regarding electric
vehicles market diffusion in the future of transportation can be modeled by changing
prices, availability and change costs for this energy source.
With all the assumptions presented, in the next section it is described how each
year was modeled and the equations that were used.
5.2.2. Modeling each year
The model consists of 5 automata representing the users of each considered
energy source (Petrol, Gas, Electricity, Biofuels and Advanced biofuels). The structure of
automata are analogous (Figure 14).
Figure 14: Automaton Users Of Petrol
Automaton UP (Users of Petrol) has 51 states, each representing a range of 2%
of users. For example, if this automaton is in state 1, there is 1 to 2% of users of Petrol, if it
is in state 49, users of Petrol are 97 to 98% of the total users of transport energy fuels. The
increase/decrease of the number of users of Petrol occurs according to the transitions.
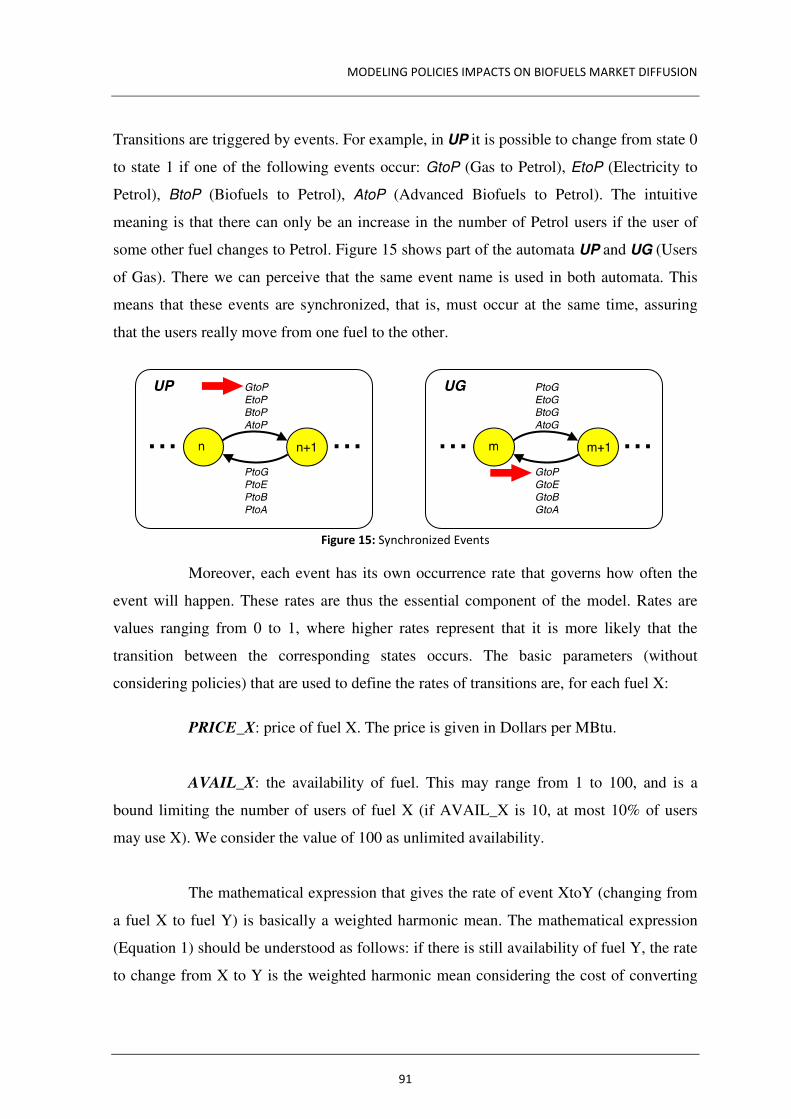
MODELING POLICIES IMPACTS ON BIOFUELS MARKET DIFFUSION
91
Transitions are triggered by events. For example, in UP it is possible to change from state 0
to state 1 if one of the following events occur: GtoP (Gas to Petrol), EtoP (Electricity to
Petrol), BtoP (Biofuels to Petrol), AtoP (Advanced Biofuels to Petrol). The intuitive
meaning is that there can only be an increase in the number of Petrol users if the user of
some other fuel changes to Petrol. Figure 15 shows part of the automata UP and UG (Users
of Gas). There we can perceive that the same event name is used in both automata. This
means that these events are synchronized, that is, must occur at the same time, assuring
that the users really move from one fuel to the other.
Figure 15: Synchronized Events
Moreover, each event has its own occurrence rate that governs how often the
event will happen. These rates are thus the essential component of the model. Rates are
values ranging from 0 to 1, where higher rates represent that it is more likely that the
transition between the corresponding states occurs. The basic parameters (without
considering policies) that are used to define the rates of transitions are, for each fuel X:
PRICE_X: price of fuel X. The price is given in Dollars per MBtu.
AVAIL_X: the availability of fuel. This may range from 1 to 100, and is a
bound limiting the number of users of fuel X (if AVAIL_X is 10, at most 10% of users
may use X). We consider the value of 100 as unlimited availability.
The mathematical expression that gives the rate of event XtoY (changing from
a fuel X to fuel Y) is basically a weighted harmonic mean. The mathematical expression
(Equation 1) should be understood as follows: if there is still availability of fuel Y, the rate
to change from X to Y is the weighted harmonic mean considering the cost of converting
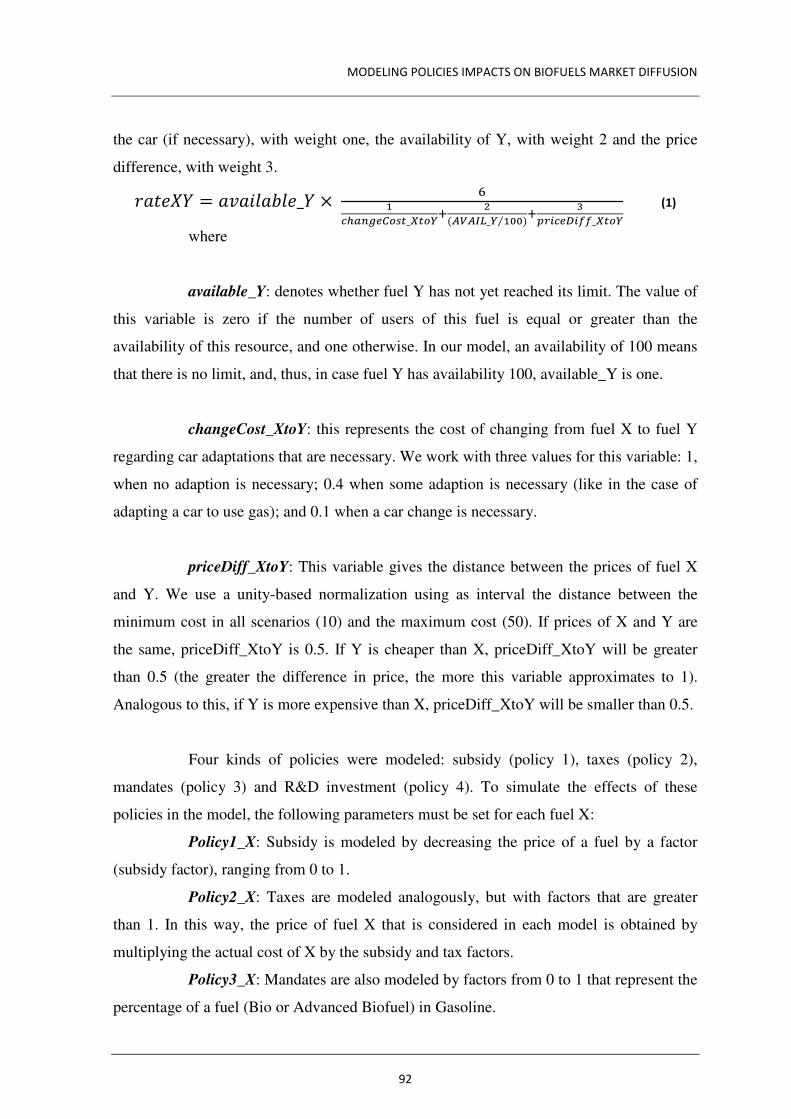
MODELING POLICIES IMPACTS ON BIOFUELS MARKET DIFFUSION
92
the car (if necessary), with weight one, the availability of Y, with weight 2 and the price
difference, with weight 3.
������ = ������_� �
�
����������_�����
�
( ! "#_� �$$)⁄�
'
()*��+*,,_����
(1)
where
available_Y: denotes whether fuel Y has not yet reached its limit. The value of
this variable is zero if the number of users of this fuel is equal or greater than the
availability of this resource, and one otherwise. In our model, an availability of 100 means
that there is no limit, and, thus, in case fuel Y has availability 100, available_Y is one.
changeCost_XtoY: this represents the cost of changing from fuel X to fuel Y
regarding car adaptations that are necessary. We work with three values for this variable: 1,
when no adaption is necessary; 0.4 when some adaption is necessary (like in the case of
adapting a car to use gas); and 0.1 when a car change is necessary.
priceDiff_XtoY: This variable gives the distance between the prices of fuel X
and Y. We use a unity-based normalization using as interval the distance between the
minimum cost in all scenarios (10) and the maximum cost (50). If prices of X and Y are
the same, priceDiff_XtoY is 0.5. If Y is cheaper than X, priceDiff_XtoY will be greater
than 0.5 (the greater the difference in price, the more this variable approximates to 1).
Analogous to this, if Y is more expensive than X, priceDiff_XtoY will be smaller than 0.5.
Four kinds of policies were modeled: subsidy (policy 1), taxes (policy 2),
mandates (policy 3) and R&D investment (policy 4). To simulate the effects of these
policies in the model, the following parameters must be set for each fuel X:
Policy1_X: Subsidy is modeled by decreasing the price of a fuel by a factor
(subsidy factor), ranging from 0 to 1.
Policy2_X: Taxes are modeled analogously, but with factors that are greater
than 1. In this way, the price of fuel X that is considered in each model is obtained by
multiplying the actual cost of X by the subsidy and tax factors.
Policy3_X: Mandates are also modeled by factors from 0 to 1 that represent the
percentage of a fuel (Bio or Advanced Biofuel) in Gasoline.
MODELING POLICIES IMPACTS ON BIOFUELS MARKET DIFFUSION
93
R&D investment (policy 4) was modeled by increasing the availability of the
resource, since the expected medium to long term effect of such investment is to improve
the efficiency of the technology for production and use of these biofuels.
By solving the Markov chain associated to each scenario we find the
equilibrium state, that is the distribution of users in states to which the system would
converge. In this way, altering all the inputs and running in the SAN Lite Solver it is
possible to model one year. The model template of the source code developed is presented
in Appendix D. With the yearly results a scenario can be modeled. This step is presented in
following section.
5.2.3. Modeling a scenario
The time span to be modeled is divided into 31 periods of equal length,
corresponding to the years of 2010 through 2040. Since the change in energetic sources
take a long time to reach penetration, such time horizons tend to cover several decades,
being in this study until 2040.
In order to make a scenario, each individual year must be ran as described
previously and the results compiled together, so that a curve can be attained. For example,
Figure 16 (in section 5.2.4) is created from 31 "dots" arising from each energy source,
representing their respective each year market shares based on the parameters established
for each year. In this way, depending on prices fluctuations, availability changes or policies
employed, the equilibrium state and the distribution of users of each year will be different,
and the overall scenario will differ as well.
So, it was possible to create different scenarios to represent the future of
transportation fuels in the U.S. depending on the policies adopted. However, for this model
to represent realistic scenarios, it had to be calibrated and validated. More information
about these steps is presented in the subsequent section.
5.2.4. Calibrating and validating the model
The challenge was to calibrate this model to make it a realistic representation
of the U.S. transportation market shares, such that it would be worthwhile to use it to
perform analysis of future scenarios. The calibration involved the choices of harmonic
MODELING POLICIES IMPACTS ON BIOFUELS MARKET DIFFUSION
94
mean, weights of the harmonic mean components, factors of change cost, unity based
normalization for price differences, and availability values of resources.
The choice for weighted harmonic mean was made to penalize low values. In
this way, if a fuel is very cheap but has no availability, it will never achieve high market
share, only if it increases its availability. Similarly, if a fuel is widely available but the
price is too high, the weighted harmonic mean penalizes this fuel, as occurs in reality.
The factors of changing from an energy source to another were based on the
reality whereas there is no change in infrastructure to change from gasoline/diesel to
ethanol/biodiesel. Although ethanol is not recommended for older cars (prior to 2001) with
gasoline engines, newer ones can use up to 15% (E15) of ethanol blended in their gasoline.
Newer flex fuel cars are already been sold and can even use E100. In this way, changing
costs for Petrol fuels to Biofuels and Advanced Biofuels were set to 100 (none). On the
other hand, natural gas car adaptations were set to 40 and the purchase of an electric car set
to 10. These numbers were achieved in the calibration process whereas the right set of
inputs was needed so that the real transportation market shares were reached, as described
further.
Regarding energy price differences, a unity-based normalization using as
interval the distance between the minimum cost in all scenarios ($10.00) and the maximum
cost ($50.00) was applied. Setting these parameters was necessary to achieve values
ranging from 0 to 1, without having inaccuracies due to possible differences among
scenarios. For example, if it were normalized solely with minimum and maximum values
within the studied scenario, given year could present a minimum price of $30.00 and a
maximum of $35.00 among all the energy sources. This would lead to a total range of only
$5.00, and the fuel costing 35.00 would be greatly penalized, although it is not much more
expensive than the others. In order to prevent these inaccuracies, all price differences were
calculated based on a maximum range of $40.00, as stated before ($50.00 minus $10.00).
Availability is one of the key parameters in the model. In order to define the
availability of each energy source, a relation with the real market was made as described in
the assumptions section. Therefore, Petrol fuels were defined as widely available (100) and
the other fuel availabilities were defined through the calibration process.
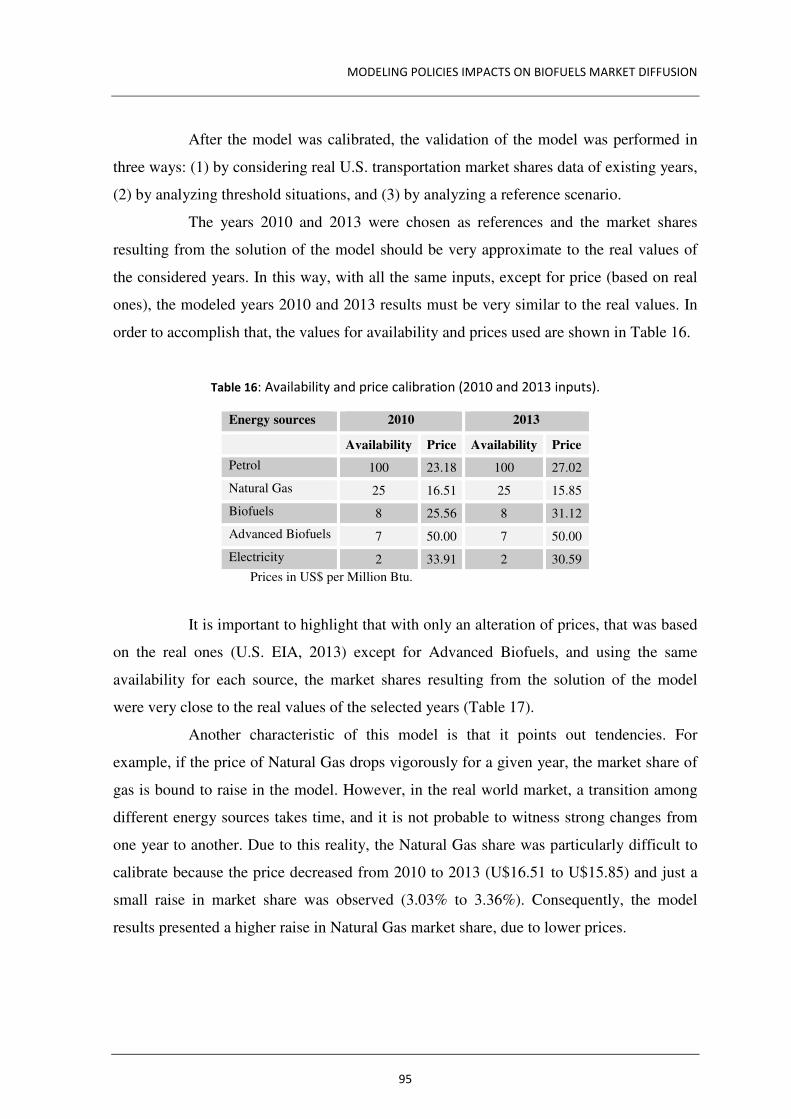
MODELING POLICIES IMPACTS ON BIOFUELS MARKET DIFFUSION
95
After the model was calibrated, the validation of the model was performed in
three ways: (1) by considering real U.S. transportation market shares data of existing years,
(2) by analyzing threshold situations, and (3) by analyzing a reference scenario.
The years 2010 and 2013 were chosen as references and the market shares
resulting from the solution of the model should be very approximate to the real values of
the considered years. In this way, with all the same inputs, except for price (based on real
ones), the modeled years 2010 and 2013 results must be very similar to the real values. In
order to accomplish that, the values for availability and prices used are shown in Table 16.
Table 16: Availability and price calibration (2010 and 2013 inputs).
Energy sources 2010 2013
Availability Price Availability Price
Petrol 100 23.18 100 27.02
Natural Gas 25 16.51 25 15.85
Biofuels 8 25.56 8 31.12
Advanced Biofuels 7 50.00 7 50.00
Electricity 2 33.91 2 30.59
Prices in US$ per Million Btu.
It is important to highlight that with only an alteration of prices, that was based
on the real ones (U.S. EIA, 2013) except for Advanced Biofuels, and using the same
availability for each source, the market shares resulting from the solution of the model
were very close to the real values of the selected years (Table 17).
Another characteristic of this model is that it points out tendencies. For
example, if the price of Natural Gas drops vigorously for a given year, the market share of
gas is bound to raise in the model. However, in the real world market, a transition among
different energy sources takes time, and it is not probable to witness strong changes from
one year to another. Due to this reality, the Natural Gas share was particularly difficult to
calibrate because the price decreased from 2010 to 2013 (U$16.51 to U$15.85) and just a
small raise in market share was observed (3.03% to 3.36%). Consequently, the model
results presented a higher raise in Natural Gas market share, due to lower prices.
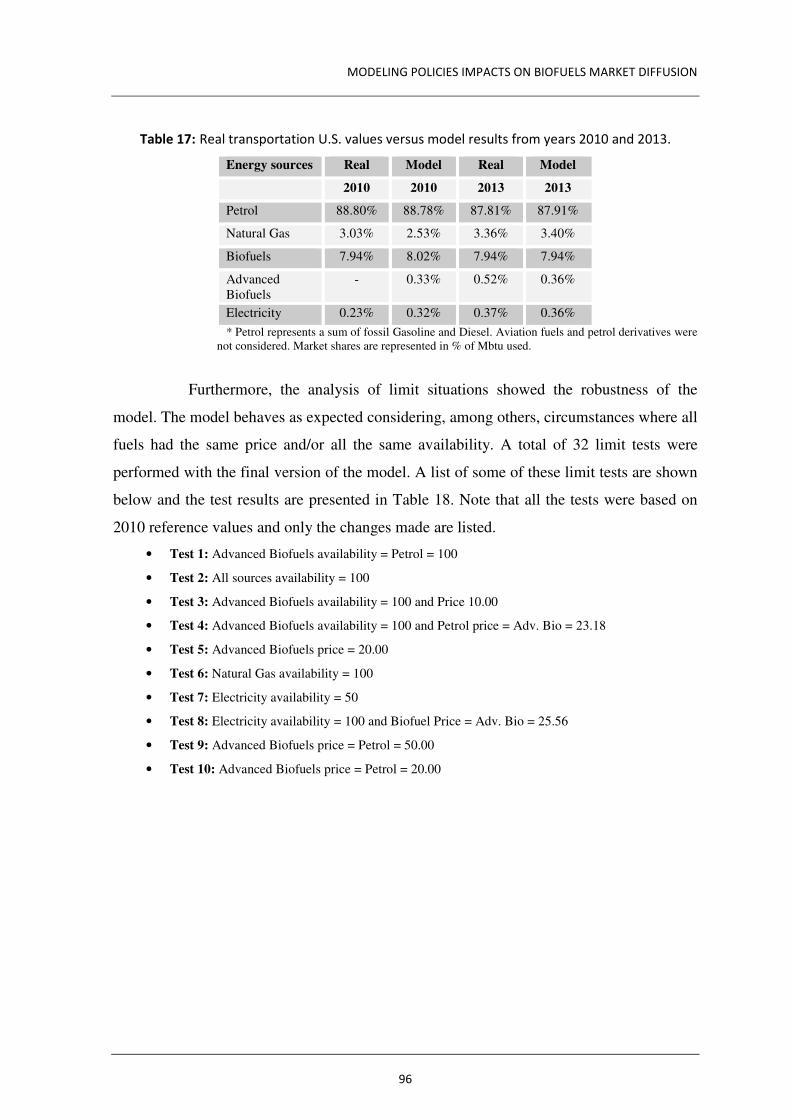
MODELING POLICIES IMPACTS ON BIOFUELS MARKET DIFFUSION
96
Table 17: Real transportation U.S. values versus model results from years 2010 and 2013.
Energy sources Real Model Real Model
2010 2010 2013 2013
Petrol 88.80% 88.78% 87.81% 87.91%
Natural Gas 3.03% 2.53% 3.36% 3.40%
Biofuels 7.94% 8.02% 7.94% 7.94%
Advanced Biofuels
- 0.33% 0.52% 0.36%
Electricity 0.23% 0.32% 0.37% 0.36%
* Petrol represents a sum of fossil Gasoline and Diesel. Aviation fuels and petrol derivatives were not considered. Market shares are represented in % of Mbtu used.
Furthermore, the analysis of limit situations showed the robustness of the
model. The model behaves as expected considering, among others, circumstances where all
fuels had the same price and/or all the same availability. A total of 32 limit tests were
performed with the final version of the model. A list of some of these limit tests are shown
below and the test results are presented in Table 18. Note that all the tests were based on
2010 reference values and only the changes made are listed.
• Test 1: Advanced Biofuels availability = Petrol = 100
• Test 2: All sources availability = 100
• Test 3: Advanced Biofuels availability = 100 and Price 10.00
• Test 4: Advanced Biofuels availability = 100 and Petrol price = Adv. Bio = 23.18
• Test 5: Advanced Biofuels price = 20.00
• Test 6: Natural Gas availability = 100
• Test 7: Electricity availability = 50
• Test 8: Electricity availability = 100 and Biofuel Price = Adv. Bio = 25.56
• Test 9: Advanced Biofuels price = Petrol = 50.00
• Test 10: Advanced Biofuels price = Petrol = 20.00
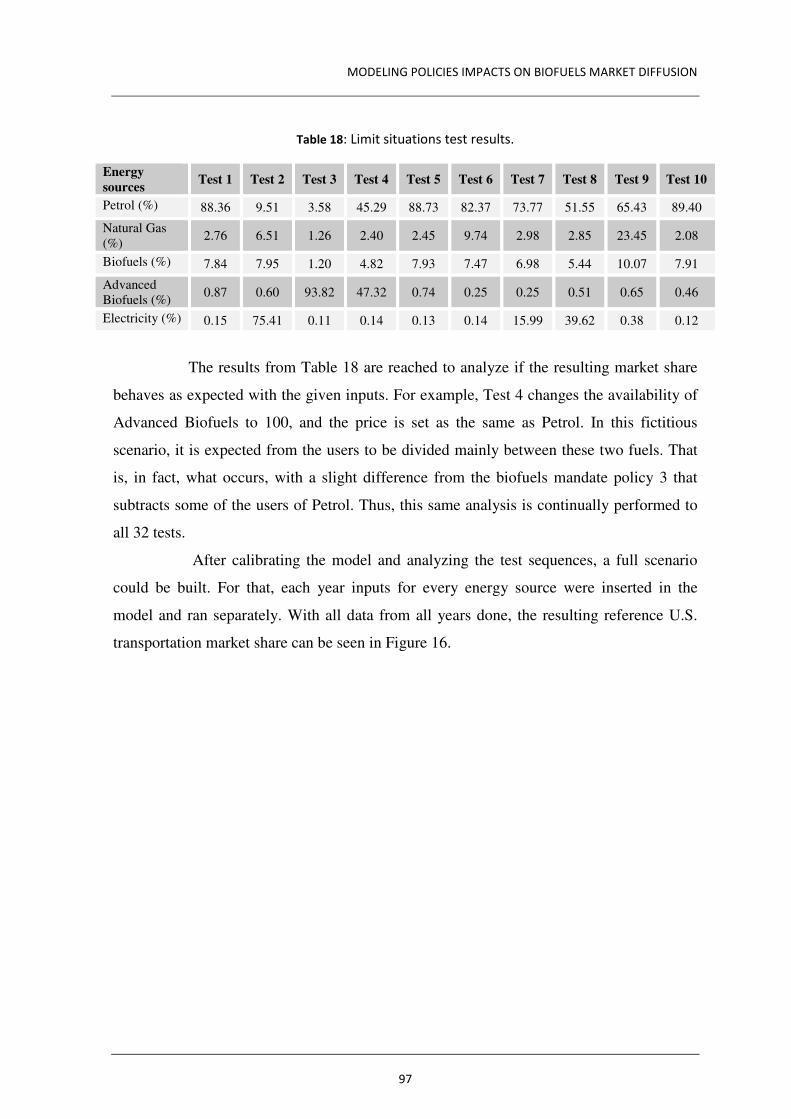
MODELING POLICIES IMPACTS ON BIOFUELS MARKET DIFFUSION
97
Table 18: Limit situations test results.
Energy sources
Test 1 Test 2 Test 3 Test 4 Test 5 Test 6 Test 7 Test 8 Test 9 Test 10
Petrol (%) 88.36 9.51 3.58 45.29 88.73 82.37 73.77 51.55 65.43 89.40
Natural Gas (%)
2.76 6.51 1.26 2.40 2.45 9.74 2.98 2.85 23.45 2.08
Biofuels (%) 7.84 7.95 1.20 4.82 7.93 7.47 6.98 5.44 10.07 7.91
Advanced Biofuels (%)
0.87 0.60 93.82 47.32 0.74 0.25 0.25 0.51 0.65 0.46
Electricity (%) 0.15 75.41 0.11 0.14 0.13 0.14 15.99 39.62 0.38 0.12
The results from Table 18 are reached to analyze if the resulting market share
behaves as expected with the given inputs. For example, Test 4 changes the availability of
Advanced Biofuels to 100, and the price is set as the same as Petrol. In this fictitious
scenario, it is expected from the users to be divided mainly between these two fuels. That
is, in fact, what occurs, with a slight difference from the biofuels mandate policy 3 that
subtracts some of the users of Petrol. Thus, this same analysis is continually performed to
all 32 tests.
After calibrating the model and analyzing the test sequences, a full scenario
could be built. For that, each year inputs for every energy source were inserted in the
model and ran separately. With all data from all years done, the resulting reference U.S.
transportation market share can be seen in Figure 16.
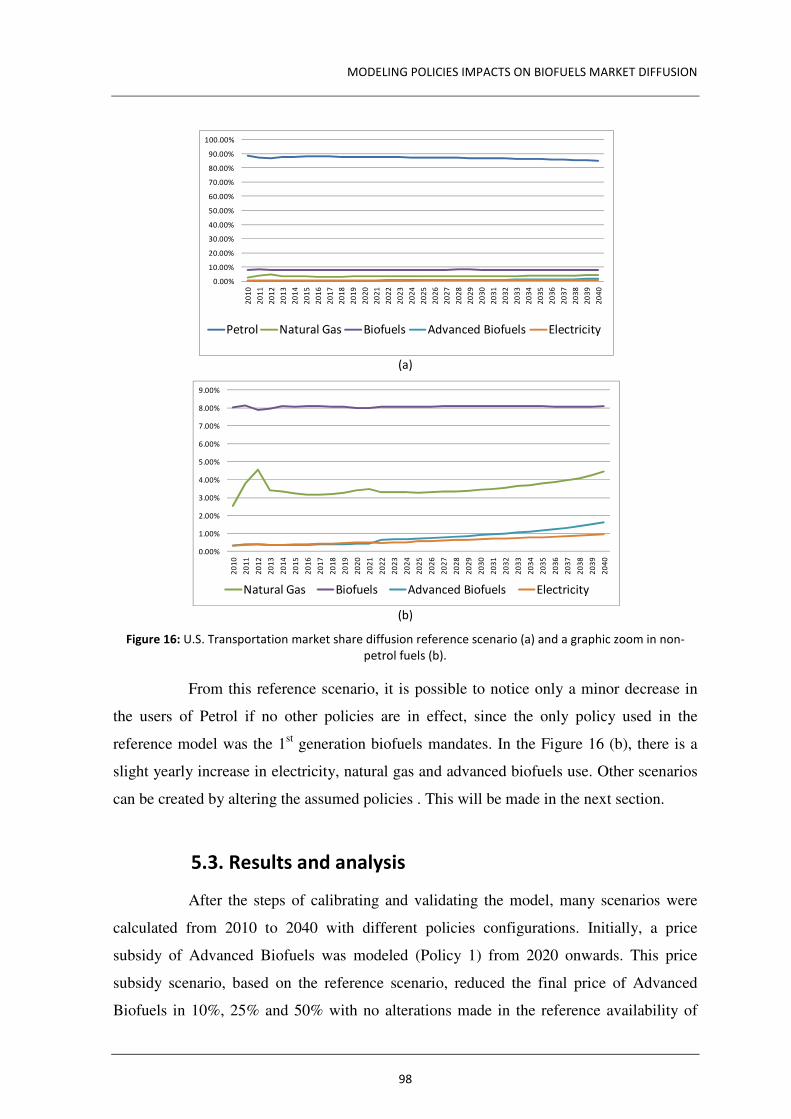
MODELING POLICIES IMPACTS ON BIOFUELS MARKET DIFFUSION
98
(a)
(b)
Figure 16: U.S. Transportation market share diffusion reference scenario (a) and a graphic zoom in non-
petrol fuels (b).
From this reference scenario, it is possible to notice only a minor decrease in
the users of Petrol if no other policies are in effect, since the only policy used in the
reference model was the 1st generation biofuels mandates. In the Figure 16 (b), there is a
slight yearly increase in electricity, natural gas and advanced biofuels use. Other scenarios
can be created by altering the assumed policies . This will be made in the next section.
5.3. Results and analysis
After the steps of calibrating and validating the model, many scenarios were
calculated from 2010 to 2040 with different policies configurations. Initially, a price
subsidy of Advanced Biofuels was modeled (Policy 1) from 2020 onwards. This price
subsidy scenario, based on the reference scenario, reduced the final price of Advanced
Biofuels in 10%, 25% and 50% with no alterations made in the reference availability of
0.00%
10.00%
20.00%
30.00%
40.00%
50.00%
60.00%
70.00%
80.00%
90.00%
100.00%
20
10
20
11
20
12
20
13
20
14
20
15
20
16
20
17
20
18
20
19
20
20
20
21
20
22
20
23
20
24
20
25
20
26
20
27
20
28
20
29
20
30
20
31
20
32
20
33
20
34
20
35
20
36
20
37
20
38
20
39
20
40
Petrol Natural Gas Biofuels Advanced Biofuels Electricity
0.00%
1.00%
2.00%
3.00%
4.00%
5.00%
6.00%
7.00%
8.00%
9.00%
20
10
20
11
20
12
20
13
20
14
20
15
20
16
20
17
20
18
20
19
20
20
20
21
20
22
20
23
20
24
20
25
20
26
20
27
20
28
20
29
20
30
20
31
20
32
20
33
20
34
20
35
20
36
20
37
20
38
20
39
20
40
Natural Gas Biofuels Advanced Biofuels Electricity
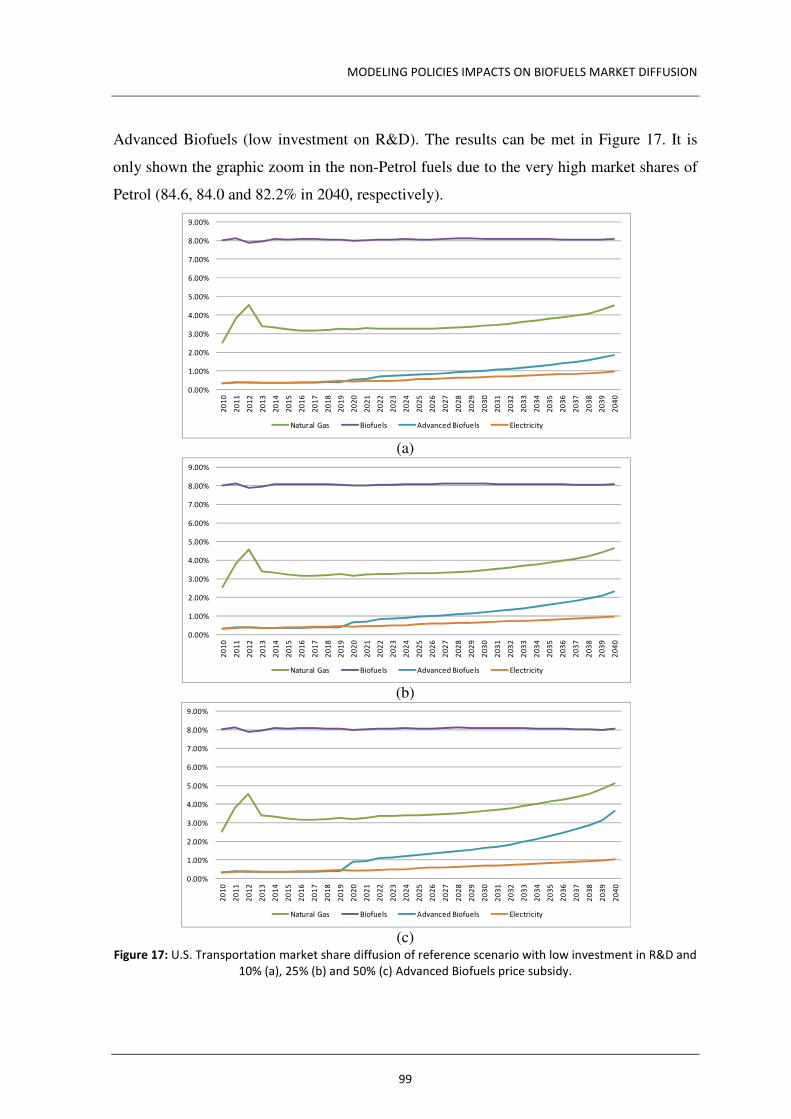
MODELING POLICIES IMPACTS ON BIOFUELS MARKET DIFFUSION
99
Advanced Biofuels (low investment on R&D). The results can be met in Figure 17. It is
only shown the graphic zoom in the non-Petrol fuels due to the very high market shares of
Petrol (84.6, 84.0 and 82.2% in 2040, respectively).
(a)
(b)
(c)
Figure 17: U.S. Transportation market share diffusion of reference scenario with low investment in R&D and
10% (a), 25% (b) and 50% (c) Advanced Biofuels price subsidy.
0.00%
1.00%
2.00%
3.00%
4.00%
5.00%
6.00%
7.00%
8.00%
9.00%2
01
0
20
11
20
12
20
13
20
14
20
15
20
16
20
17
20
18
20
19
20
20
20
21
20
22
20
23
20
24
20
25
20
26
20
27
20
28
20
29
20
30
20
31
20
32
20
33
20
34
20
35
20
36
20
37
20
38
20
39
20
40
Natural Gas Biofuels Advanced Biofuels Electricity
0.00%
1.00%
2.00%
3.00%
4.00%
5.00%
6.00%
7.00%
8.00%
9.00%
20
10
20
11
20
12
20
13
20
14
20
15
20
16
20
17
20
18
20
19
20
20
20
21
20
22
20
23
20
24
20
25
20
26
20
27
20
28
20
29
20
30
20
31
20
32
20
33
20
34
20
35
20
36
20
37
20
38
20
39
20
40
Natural Gas Biofuels Advanced Biofuels Electricity
0.00%
1.00%
2.00%
3.00%
4.00%
5.00%
6.00%
7.00%
8.00%
9.00%
20
10
20
11
20
12
20
13
20
14
20
15
20
16
20
17
20
18
20
19
20
20
20
21
20
22
20
23
20
24
20
25
20
26
20
27
20
28
20
29
20
30
20
31
20
32
20
33
20
34
20
35
20
36
20
37
20
38
20
39
20
40
Natural Gas Biofuels Advanced Biofuels Electricity
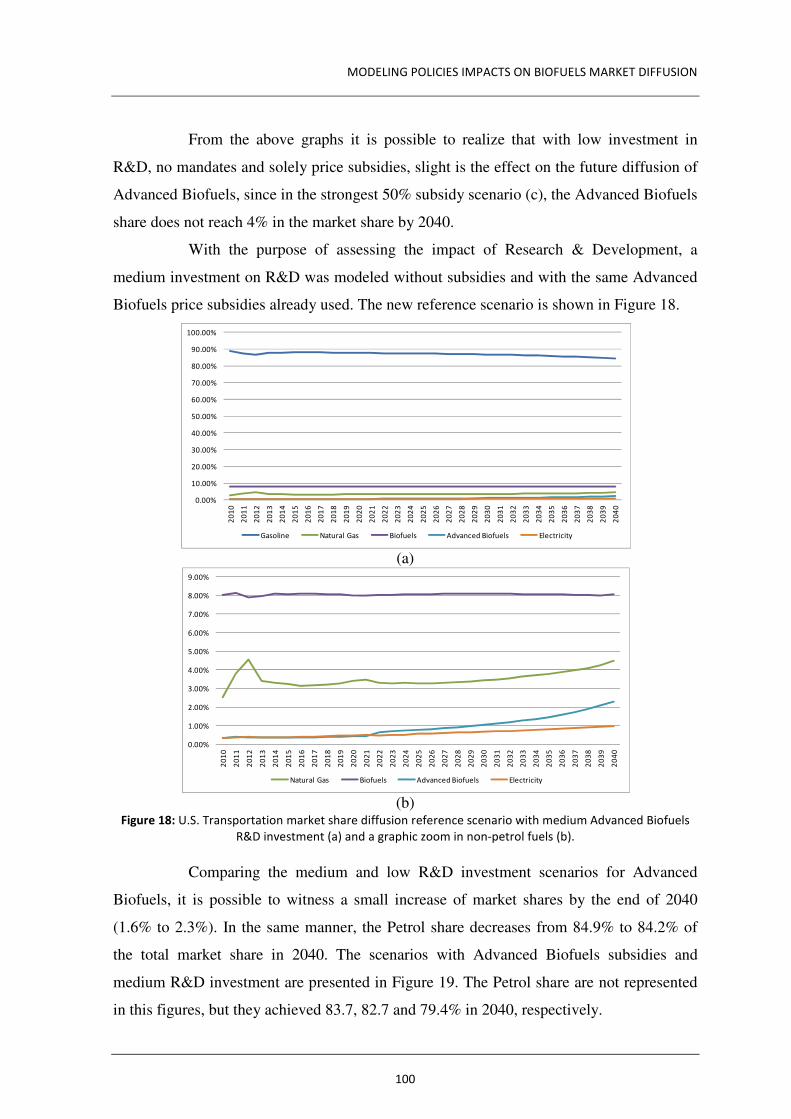
MODELING POLICIES IMPACTS ON BIOFUELS MARKET DIFFUSION
100
From the above graphs it is possible to realize that with low investment in
R&D, no mandates and solely price subsidies, slight is the effect on the future diffusion of
Advanced Biofuels, since in the strongest 50% subsidy scenario (c), the Advanced Biofuels
share does not reach 4% in the market share by 2040.
With the purpose of assessing the impact of Research & Development, a
medium investment on R&D was modeled without subsidies and with the same Advanced
Biofuels price subsidies already used. The new reference scenario is shown in Figure 18.
(a)
(b)
Figure 18: U.S. Transportation market share diffusion reference scenario with medium Advanced Biofuels
R&D investment (a) and a graphic zoom in non-petrol fuels (b).
Comparing the medium and low R&D investment scenarios for Advanced
Biofuels, it is possible to witness a small increase of market shares by the end of 2040
(1.6% to 2.3%). In the same manner, the Petrol share decreases from 84.9% to 84.2% of
the total market share in 2040. The scenarios with Advanced Biofuels subsidies and
medium R&D investment are presented in Figure 19. The Petrol share are not represented
in this figures, but they achieved 83.7, 82.7 and 79.4% in 2040, respectively.
0.00%
10.00%
20.00%
30.00%
40.00%
50.00%
60.00%
70.00%
80.00%
90.00%
100.00%
20
10
20
11
20
12
20
13
20
14
20
15
20
16
20
17
20
18
20
19
20
20
20
21
20
22
20
23
20
24
20
25
20
26
20
27
20
28
20
29
20
30
20
31
20
32
20
33
20
34
20
35
20
36
20
37
20
38
20
39
20
40
Gasoline Natural Gas Biofuels Advanced Biofuels Electricity
0.00%
1.00%
2.00%
3.00%
4.00%
5.00%
6.00%
7.00%
8.00%
9.00%
20
10
20
11
20
12
20
13
20
14
20
15
20
16
20
17
20
18
20
19
20
20
20
21
20
22
20
23
20
24
20
25
20
26
20
27
20
28
20
29
20
30
20
31
20
32
20
33
20
34
20
35
20
36
20
37
20
38
20
39
20
40
Natural Gas Biofuels Advanced Biofuels Electricity

MODELING POLICIES IMPACTS ON BIOFUELS MARKET DIFFUSION
101
(a)
(b)
(c)
Figure 19: U.S. Transportation market share diffusion of reference scenario with medium investment in
R&D and 10% (a), 25% (b) and 50% (c) Advanced Biofuels price subsidy.
Analyzing these graphs, it is interesting to point out that the market diffusion
outcomes obtained from a price subsidy coupled with a medium investment in R&D are
more effective regarding Advanced Biofuels, when compared with the low R&D
0.00%
1.00%
2.00%
3.00%
4.00%
5.00%
6.00%
7.00%
8.00%
9.00%
20
10
20
11
20
12
20
13
20
14
20
15
20
16
20
17
20
18
20
19
20
20
20
21
20
22
20
23
20
24
20
25
20
26
20
27
20
28
20
29
20
30
20
31
20
32
20
33
20
34
20
35
20
36
20
37
20
38
20
39
20
40
Natural Gas Biofuels Advanced Biofuels Electricity
0.00%
1.00%
2.00%
3.00%
4.00%
5.00%
6.00%
7.00%
8.00%
9.00%
20
10
20
11
20
12
20
13
20
14
20
15
20
16
20
17
20
18
20
19
20
20
20
21
20
22
20
23
20
24
20
25
20
26
20
27
20
28
20
29
20
30
20
31
20
32
20
33
20
34
20
35
20
36
20
37
20
38
20
39
20
40
Natural Gas Biofuels Advanced Biofuels Electricity
0.00%
1.00%
2.00%
3.00%
4.00%
5.00%
6.00%
7.00%
8.00%
9.00%
20
10
20
11
20
12
20
13
20
14
20
15
20
16
20
17
20
18
20
19
20
20
20
21
20
22
20
23
20
24
20
25
20
26
20
27
20
28
20
29
20
30
20
31
20
32
20
33
20
34
20
35
20
36
20
37
20
38
20
39
20
40
Natural Gas Biofuels Advanced Biofuels Electricity

MODELING POLICIES IMPACTS ON BIOFUELS MARKET DIFFUSION
102
investments scenarios. In Figure 19(c) it is possible to see that not only the Advanced
Biofuels share made progress in the final market share, but also the Natural Gas share
raised as well (2040 Reference Natural Gas from 4.46% to 5.21%), even if no policies or
different availabilities were applied in this energy source.
To conclude this section of R&D investments, a high investment in Advanced
Biofuels was modeled according the same pattern presented in the previous ones. The
results of the overall market diffusion with no subsidies are shown in Figure 20.
(a)
(b)
Figure 20: U.S. Transportation market share diffusion reference scenario with high Advanced Biofuels R&D
investment (a) and a graphic zoom in non-petrol fuels (b).
The Advanced Biofuels share is reasonably higher in this scenario, achieving
4.31% of the overall U.S. transportation market share in 2040. When this higher
investment in R&D is combined with price subsidies, the results are far more promising.
0.00%
10.00%
20.00%
30.00%
40.00%
50.00%
60.00%
70.00%
80.00%
90.00%
100.00%
20
10
20
11
20
12
20
13
20
14
20
15
20
16
20
17
20
18
20
19
20
20
20
21
20
22
20
23
20
24
20
25
20
26
20
27
20
28
20
29
20
30
20
31
20
32
20
33
20
34
20
35
20
36
20
37
20
38
20
39
20
40
Gasoline Natural Gas Biofuels Advanced Biofuels Electricity
0.00%
1.00%
2.00%
3.00%
4.00%
5.00%
6.00%
7.00%
8.00%
9.00%
20
10
20
11
20
12
20
13
20
14
20
15
20
16
20
17
20
18
20
19
20
20
20
21
20
22
20
23
20
24
20
25
20
26
20
27
20
28
20
29
20
30
20
31
20
32
20
33
20
34
20
35
20
36
20
37
20
38
20
39
20
40
Natural Gas Biofuels Advanced Biofuels Electricity
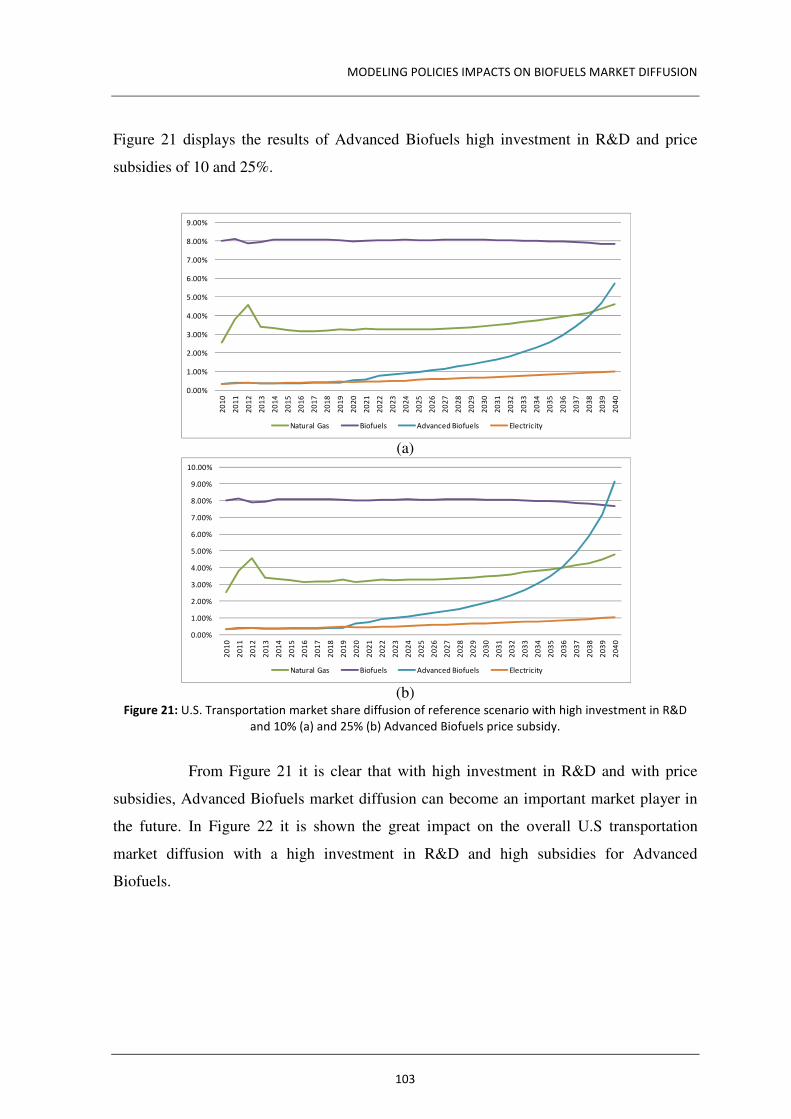
MODELING POLICIES IMPACTS ON BIOFUELS MARKET DIFFUSION
103
Figure 21 displays the results of Advanced Biofuels high investment in R&D and price
subsidies of 10 and 25%.
(a)
(b)
Figure 21: U.S. Transportation market share diffusion of reference scenario with high investment in R&D
and 10% (a) and 25% (b) Advanced Biofuels price subsidy.
From Figure 21 it is clear that with high investment in R&D and with price
subsidies, Advanced Biofuels market diffusion can become an important market player in
the future. In Figure 22 it is shown the great impact on the overall U.S transportation
market diffusion with a high investment in R&D and high subsidies for Advanced
Biofuels.
0.00%
1.00%
2.00%
3.00%
4.00%
5.00%
6.00%
7.00%
8.00%
9.00%2
01
0
20
11
20
12
20
13
20
14
20
15
20
16
20
17
20
18
20
19
20
20
20
21
20
22
20
23
20
24
20
25
20
26
20
27
20
28
20
29
20
30
20
31
20
32
20
33
20
34
20
35
20
36
20
37
20
38
20
39
20
40
Natural Gas Biofuels Advanced Biofuels Electricity
0.00%
1.00%
2.00%
3.00%
4.00%
5.00%
6.00%
7.00%
8.00%
9.00%
10.00%
20
10
20
11
20
12
20
13
20
14
20
15
20
16
20
17
20
18
20
19
20
20
20
21
20
22
20
23
20
24
20
25
20
26
20
27
20
28
20
29
20
30
20
31
20
32
20
33
20
34
20
35
20
36
20
37
20
38
20
39
20
40
Natural Gas Biofuels Advanced Biofuels Electricity
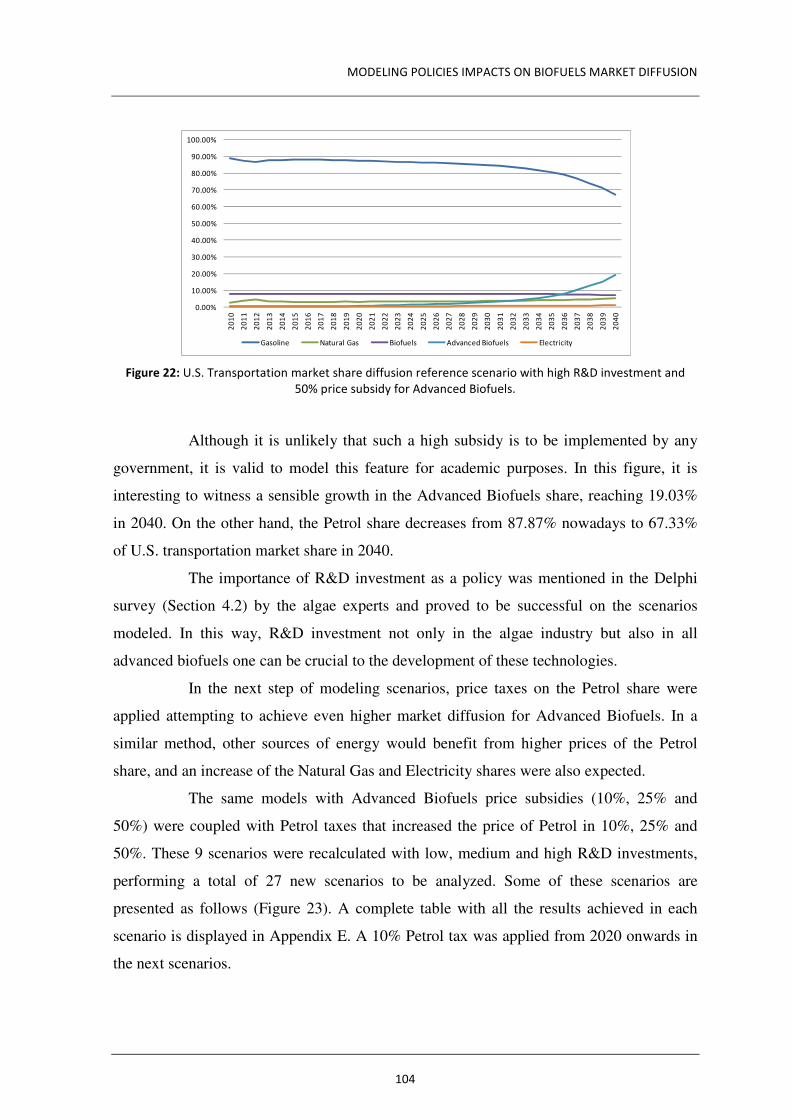
MODELING POLICIES IMPACTS ON BIOFUELS MARKET DIFFUSION
104
Figure 22: U.S. Transportation market share diffusion reference scenario with high R&D investment and
50% price subsidy for Advanced Biofuels.
Although it is unlikely that such a high subsidy is to be implemented by any
government, it is valid to model this feature for academic purposes. In this figure, it is
interesting to witness a sensible growth in the Advanced Biofuels share, reaching 19.03%
in 2040. On the other hand, the Petrol share decreases from 87.87% nowadays to 67.33%
of U.S. transportation market share in 2040.
The importance of R&D investment as a policy was mentioned in the Delphi
survey (Section 4.2) by the algae experts and proved to be successful on the scenarios
modeled. In this way, R&D investment not only in the algae industry but also in all
advanced biofuels one can be crucial to the development of these technologies.
In the next step of modeling scenarios, price taxes on the Petrol share were
applied attempting to achieve even higher market diffusion for Advanced Biofuels. In a
similar method, other sources of energy would benefit from higher prices of the Petrol
share, and an increase of the Natural Gas and Electricity shares were also expected.
The same models with Advanced Biofuels price subsidies (10%, 25% and
50%) were coupled with Petrol taxes that increased the price of Petrol in 10%, 25% and
50%. These 9 scenarios were recalculated with low, medium and high R&D investments,
performing a total of 27 new scenarios to be analyzed. Some of these scenarios are
presented as follows (Figure 23). A complete table with all the results achieved in each
scenario is displayed in Appendix E. A 10% Petrol tax was applied from 2020 onwards in
the next scenarios.
0.00%
10.00%
20.00%
30.00%
40.00%
50.00%
60.00%
70.00%
80.00%
90.00%
100.00%
20
10
20
11
20
12
20
13
20
14
20
15
20
16
20
17
20
18
20
19
20
20
20
21
20
22
20
23
20
24
20
25
20
26
20
27
20
28
20
29
20
30
20
31
20
32
20
33
20
34
20
35
20
36
20
37
20
38
20
39
20
40
Gasoline Natural Gas Biofuels Advanced Biofuels Electricity
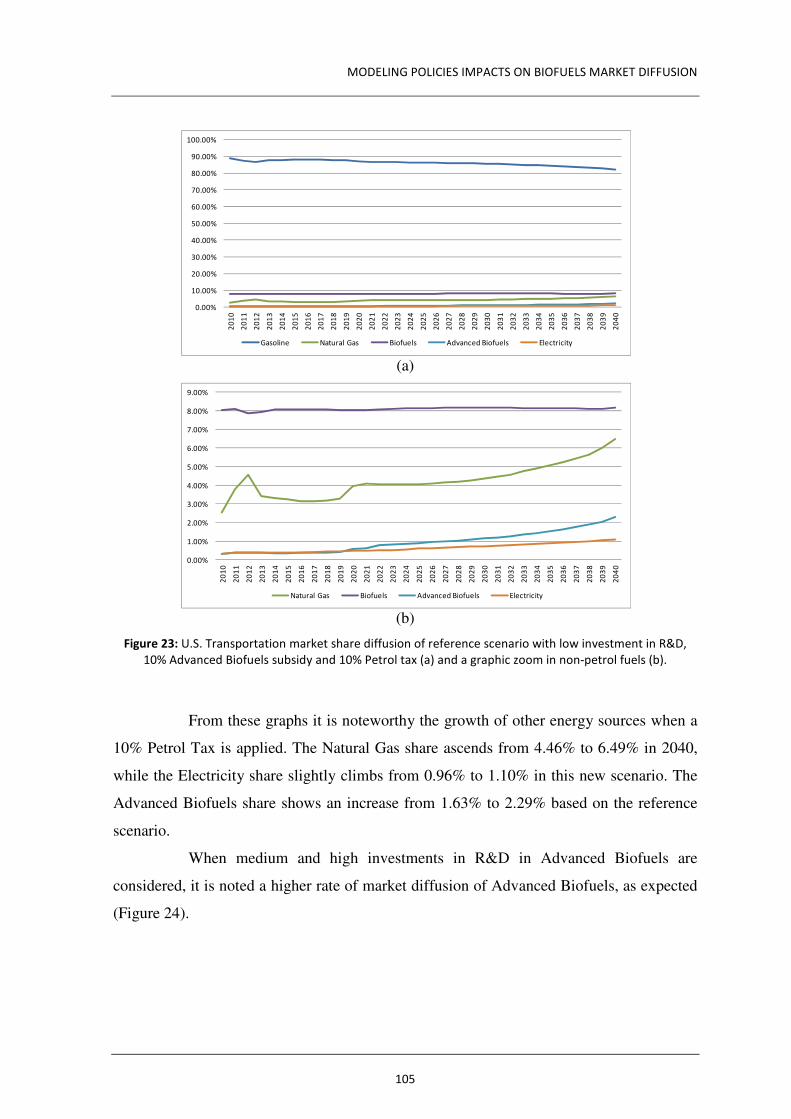
MODELING POLICIES IMPACTS ON BIOFUELS MARKET DIFFUSION
105
(a)
(b)
Figure 23: U.S. Transportation market share diffusion of reference scenario with low investment in R&D,
10% Advanced Biofuels subsidy and 10% Petrol tax (a) and a graphic zoom in non-petrol fuels (b).
From these graphs it is noteworthy the growth of other energy sources when a
10% Petrol Tax is applied. The Natural Gas share ascends from 4.46% to 6.49% in 2040,
while the Electricity share slightly climbs from 0.96% to 1.10% in this new scenario. The
Advanced Biofuels share shows an increase from 1.63% to 2.29% based on the reference
scenario.
When medium and high investments in R&D in Advanced Biofuels are
considered, it is noted a higher rate of market diffusion of Advanced Biofuels, as expected
(Figure 24).
0.00%
10.00%
20.00%
30.00%
40.00%
50.00%
60.00%
70.00%
80.00%
90.00%
100.00%
20
10
20
11
20
12
20
13
20
14
20
15
20
16
20
17
20
18
20
19
20
20
20
21
20
22
20
23
20
24
20
25
20
26
20
27
20
28
20
29
20
30
20
31
20
32
20
33
20
34
20
35
20
36
20
37
20
38
20
39
20
40
Gasoline Natural Gas Biofuels Advanced Biofuels Electricity
0.00%
1.00%
2.00%
3.00%
4.00%
5.00%
6.00%
7.00%
8.00%
9.00%
20
10
20
11
20
12
20
13
20
14
20
15
20
16
20
17
20
18
20
19
20
20
20
21
20
22
20
23
20
24
20
25
20
26
20
27
20
28
20
29
20
30
20
31
20
32
20
33
20
34
20
35
20
36
20
37
20
38
20
39
20
40
Natural Gas Biofuels Advanced Biofuels Electricity
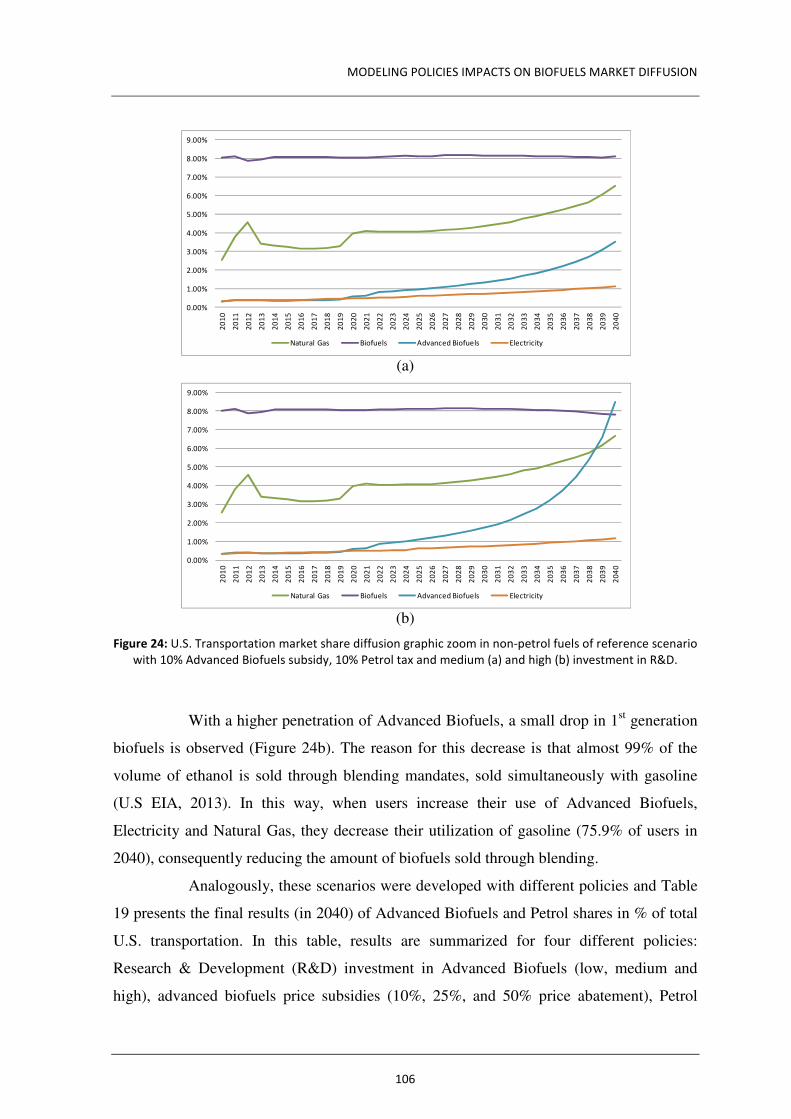
MODELING POLICIES IMPACTS ON BIOFUELS MARKET DIFFUSION
106
(a)
(b)
Figure 24: U.S. Transportation market share diffusion graphic zoom in non-petrol fuels of reference scenario
with 10% Advanced Biofuels subsidy, 10% Petrol tax and medium (a) and high (b) investment in R&D.
With a higher penetration of Advanced Biofuels, a small drop in 1st generation
biofuels is observed (Figure 24b). The reason for this decrease is that almost 99% of the
volume of ethanol is sold through blending mandates, sold simultaneously with gasoline
(U.S EIA, 2013). In this way, when users increase their use of Advanced Biofuels,
Electricity and Natural Gas, they decrease their utilization of gasoline (75.9% of users in
2040), consequently reducing the amount of biofuels sold through blending.
Analogously, these scenarios were developed with different policies and Table
19 presents the final results (in 2040) of Advanced Biofuels and Petrol shares in % of total
U.S. transportation. In this table, results are summarized for four different policies:
Research & Development (R&D) investment in Advanced Biofuels (low, medium and
high), advanced biofuels price subsidies (10%, 25%, and 50% price abatement), Petrol
0.00%
1.00%
2.00%
3.00%
4.00%
5.00%
6.00%
7.00%
8.00%
9.00%
20
10
20
11
20
12
20
13
20
14
20
15
20
16
20
17
20
18
20
19
20
20
20
21
20
22
20
23
20
24
20
25
20
26
20
27
20
28
20
29
20
30
20
31
20
32
20
33
20
34
20
35
20
36
20
37
20
38
20
39
20
40
Natural Gas Biofuels Advanced Biofuels Electricity
0.00%
1.00%
2.00%
3.00%
4.00%
5.00%
6.00%
7.00%
8.00%
9.00%
20
10
20
11
20
12
20
13
20
14
20
15
20
16
20
17
20
18
20
19
20
20
20
21
20
22
20
23
20
24
20
25
20
26
20
27
20
28
20
29
20
30
20
31
20
32
20
33
20
34
20
35
20
36
20
37
20
38
20
39
20
40
Natural Gas Biofuels Advanced Biofuels Electricity
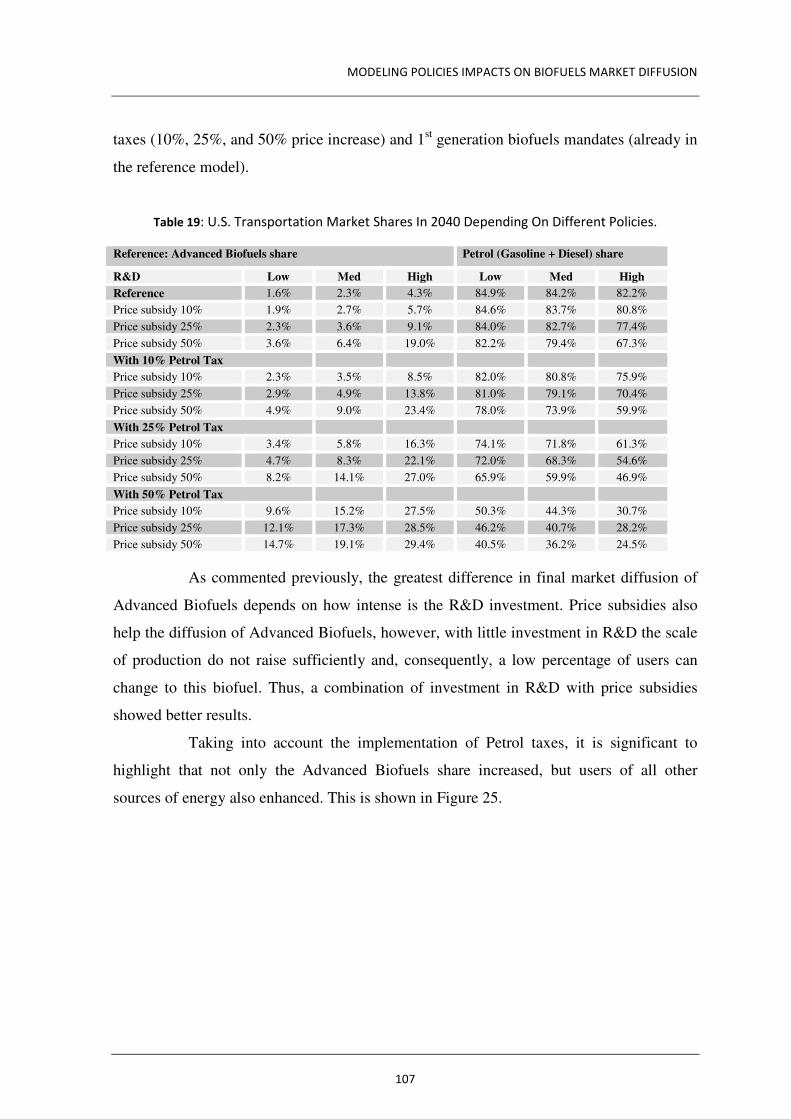
MODELING POLICIES IMPACTS ON BIOFUELS MARKET DIFFUSION
107
taxes (10%, 25%, and 50% price increase) and 1st generation biofuels mandates (already in
the reference model).
Table 19: U.S. Transportation Market Shares In 2040 Depending On Different Policies.
Reference: Advanced Biofuels share Petrol (Gasoline + Diesel) share
R&D Low Med High Low Med High
Reference 1.6% 2.3% 4.3% 84.9% 84.2% 82.2%
Price subsidy 10% 1.9% 2.7% 5.7% 84.6% 83.7% 80.8%
Price subsidy 25% 2.3% 3.6% 9.1% 84.0% 82.7% 77.4%
Price subsidy 50% 3.6% 6.4% 19.0% 82.2% 79.4% 67.3%
With 10% Petrol Tax
Price subsidy 10% 2.3% 3.5% 8.5% 82.0% 80.8% 75.9%
Price subsidy 25% 2.9% 4.9% 13.8% 81.0% 79.1% 70.4%
Price subsidy 50% 4.9% 9.0% 23.4% 78.0% 73.9% 59.9%
With 25% Petrol Tax
Price subsidy 10% 3.4% 5.8% 16.3% 74.1% 71.8% 61.3%
Price subsidy 25% 4.7% 8.3% 22.1% 72.0% 68.3% 54.6%
Price subsidy 50% 8.2% 14.1% 27.0% 65.9% 59.9% 46.9%
With 50% Petrol Tax
Price subsidy 10% 9.6% 15.2% 27.5% 50.3% 44.3% 30.7%
Price subsidy 25% 12.1% 17.3% 28.5% 46.2% 40.7% 28.2%
Price subsidy 50% 14.7% 19.1% 29.4% 40.5% 36.2% 24.5%
As commented previously, the greatest difference in final market diffusion of
Advanced Biofuels depends on how intense is the R&D investment. Price subsidies also
help the diffusion of Advanced Biofuels, however, with little investment in R&D the scale
of production do not raise sufficiently and, consequently, a low percentage of users can
change to this biofuel. Thus, a combination of investment in R&D with price subsidies
showed better results.
Taking into account the implementation of Petrol taxes, it is significant to
highlight that not only the Advanced Biofuels share increased, but users of all other
sources of energy also enhanced. This is shown in Figure 25.
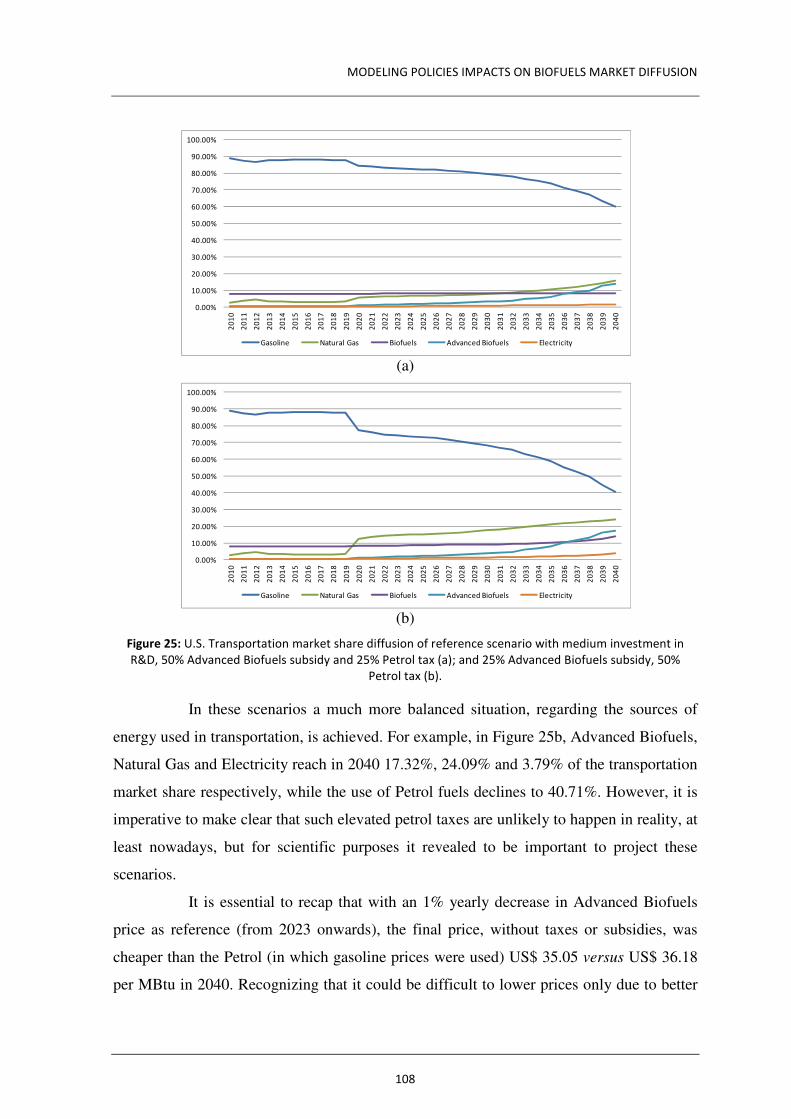
MODELING POLICIES IMPACTS ON BIOFUELS MARKET DIFFUSION
108
(a)
(b)
Figure 25: U.S. Transportation market share diffusion of reference scenario with medium investment in
R&D, 50% Advanced Biofuels subsidy and 25% Petrol tax (a); and 25% Advanced Biofuels subsidy, 50%
Petrol tax (b).
In these scenarios a much more balanced situation, regarding the sources of
energy used in transportation, is achieved. For example, in Figure 25b, Advanced Biofuels,
Natural Gas and Electricity reach in 2040 17.32%, 24.09% and 3.79% of the transportation
market share respectively, while the use of Petrol fuels declines to 40.71%. However, it is
imperative to make clear that such elevated petrol taxes are unlikely to happen in reality, at
least nowadays, but for scientific purposes it revealed to be important to project these
scenarios.
It is essential to recap that with an 1% yearly decrease in Advanced Biofuels
price as reference (from 2023 onwards), the final price, without taxes or subsidies, was
cheaper than the Petrol (in which gasoline prices were used) US$ 35.05 versus US$ 36.18
per MBtu in 2040. Recognizing that it could be difficult to lower prices only due to better
0.00%
10.00%
20.00%
30.00%
40.00%
50.00%
60.00%
70.00%
80.00%
90.00%
100.00%
20
10
20
11
20
12
20
13
20
14
20
15
20
16
20
17
20
18
20
19
20
20
20
21
20
22
20
23
20
24
20
25
20
26
20
27
20
28
20
29
20
30
20
31
20
32
20
33
20
34
20
35
20
36
20
37
20
38
20
39
20
40
Gasoline Natural Gas Biofuels Advanced Biofuels Electricity
0.00%
10.00%
20.00%
30.00%
40.00%
50.00%
60.00%
70.00%
80.00%
90.00%
100.00%
20
10
20
11
20
12
20
13
20
14
20
15
20
16
20
17
20
18
20
19
20
20
20
21
20
22
20
23
20
24
20
25
20
26
20
27
20
28
20
29
20
30
20
31
20
32
20
33
20
34
20
35
20
36
20
37
20
38
20
39
20
40
Gasoline Natural Gas Biofuels Advanced Biofuels Electricity
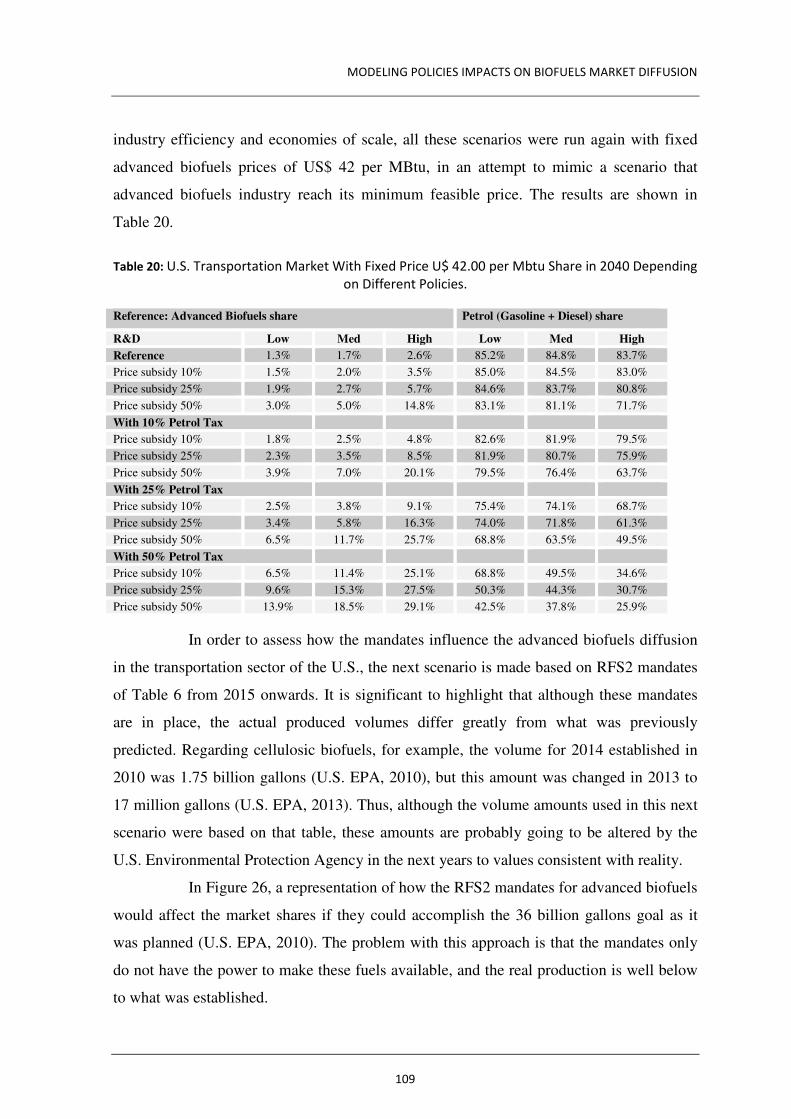
MODELING POLICIES IMPACTS ON BIOFUELS MARKET DIFFUSION
109
industry efficiency and economies of scale, all these scenarios were run again with fixed
advanced biofuels prices of US$ 42 per MBtu, in an attempt to mimic a scenario that
advanced biofuels industry reach its minimum feasible price. The results are shown in
Table 20.
Table 20: U.S. Transportation Market With Fixed Price U$ 42.00 per Mbtu Share in 2040 Depending
on Different Policies.
Reference: Advanced Biofuels share Petrol (Gasoline + Diesel) share
R&D Low Med High Low Med High
Reference 1.3% 1.7% 2.6% 85.2% 84.8% 83.7%
Price subsidy 10% 1.5% 2.0% 3.5% 85.0% 84.5% 83.0%
Price subsidy 25% 1.9% 2.7% 5.7% 84.6% 83.7% 80.8%
Price subsidy 50% 3.0% 5.0% 14.8% 83.1% 81.1% 71.7%
With 10% Petrol Tax
Price subsidy 10% 1.8% 2.5% 4.8% 82.6% 81.9% 79.5%
Price subsidy 25% 2.3% 3.5% 8.5% 81.9% 80.7% 75.9%
Price subsidy 50% 3.9% 7.0% 20.1% 79.5% 76.4% 63.7%
With 25% Petrol Tax
Price subsidy 10% 2.5% 3.8% 9.1% 75.4% 74.1% 68.7%
Price subsidy 25% 3.4% 5.8% 16.3% 74.0% 71.8% 61.3%
Price subsidy 50% 6.5% 11.7% 25.7% 68.8% 63.5% 49.5%
With 50% Petrol Tax
Price subsidy 10% 6.5% 11.4% 25.1% 68.8% 49.5% 34.6%
Price subsidy 25% 9.6% 15.3% 27.5% 50.3% 44.3% 30.7%
Price subsidy 50% 13.9% 18.5% 29.1% 42.5% 37.8% 25.9%
In order to assess how the mandates influence the advanced biofuels diffusion
in the transportation sector of the U.S., the next scenario is made based on RFS2 mandates
of Table 6 from 2015 onwards. It is significant to highlight that although these mandates
are in place, the actual produced volumes differ greatly from what was previously
predicted. Regarding cellulosic biofuels, for example, the volume for 2014 established in
2010 was 1.75 billion gallons (U.S. EPA, 2010), but this amount was changed in 2013 to
17 million gallons (U.S. EPA, 2013). Thus, although the volume amounts used in this next
scenario were based on that table, these amounts are probably going to be altered by the
U.S. Environmental Protection Agency in the next years to values consistent with reality.
In Figure 26, a representation of how the RFS2 mandates for advanced biofuels
would affect the market shares if they could accomplish the 36 billion gallons goal as it
was planned (U.S. EPA, 2010). The problem with this approach is that the mandates only
do not have the power to make these fuels available, and the real production is well below
to what was established.
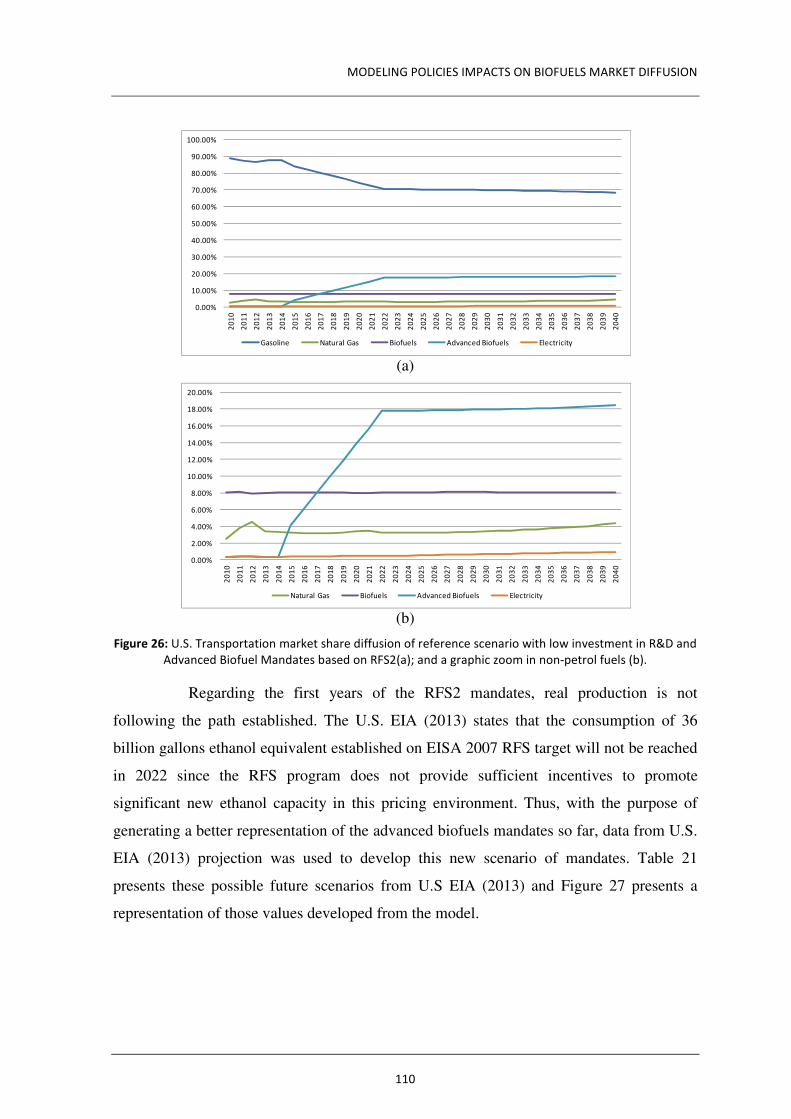
MODELING POLICIES IMPACTS ON BIOFUELS MARKET DIFFUSION
110
(a)
(b)
Figure 26: U.S. Transportation market share diffusion of reference scenario with low investment in R&D and
Advanced Biofuel Mandates based on RFS2(a); and a graphic zoom in non-petrol fuels (b).
Regarding the first years of the RFS2 mandates, real production is not
following the path established. The U.S. EIA (2013) states that the consumption of 36
billion gallons ethanol equivalent established on EISA 2007 RFS target will not be reached
in 2022 since the RFS program does not provide sufficient incentives to promote
significant new ethanol capacity in this pricing environment. Thus, with the purpose of
generating a better representation of the advanced biofuels mandates so far, data from U.S.
EIA (2013) projection was used to develop this new scenario of mandates. Table 21
presents these possible future scenarios from U.S EIA (2013) and Figure 27 presents a
representation of those values developed from the model.
0.00%
10.00%
20.00%
30.00%
40.00%
50.00%
60.00%
70.00%
80.00%
90.00%
100.00%
20
10
20
11
20
12
20
13
20
14
20
15
20
16
20
17
20
18
20
19
20
20
20
21
20
22
20
23
20
24
20
25
20
26
20
27
20
28
20
29
20
30
20
31
20
32
20
33
20
34
20
35
20
36
20
37
20
38
20
39
20
40
Gasoline Natural Gas Biofuels Advanced Biofuels Electricity
0.00%
2.00%
4.00%
6.00%
8.00%
10.00%
12.00%
14.00%
16.00%
18.00%
20.00%
20
10
20
11
20
12
20
13
20
14
20
15
20
16
20
17
20
18
20
19
20
20
20
21
20
22
20
23
20
24
20
25
20
26
20
27
20
28
20
29
20
30
20
31
20
32
20
33
20
34
20
35
20
36
20
37
20
38
20
39
20
40
Natural Gas Biofuels Advanced Biofuels Electricity
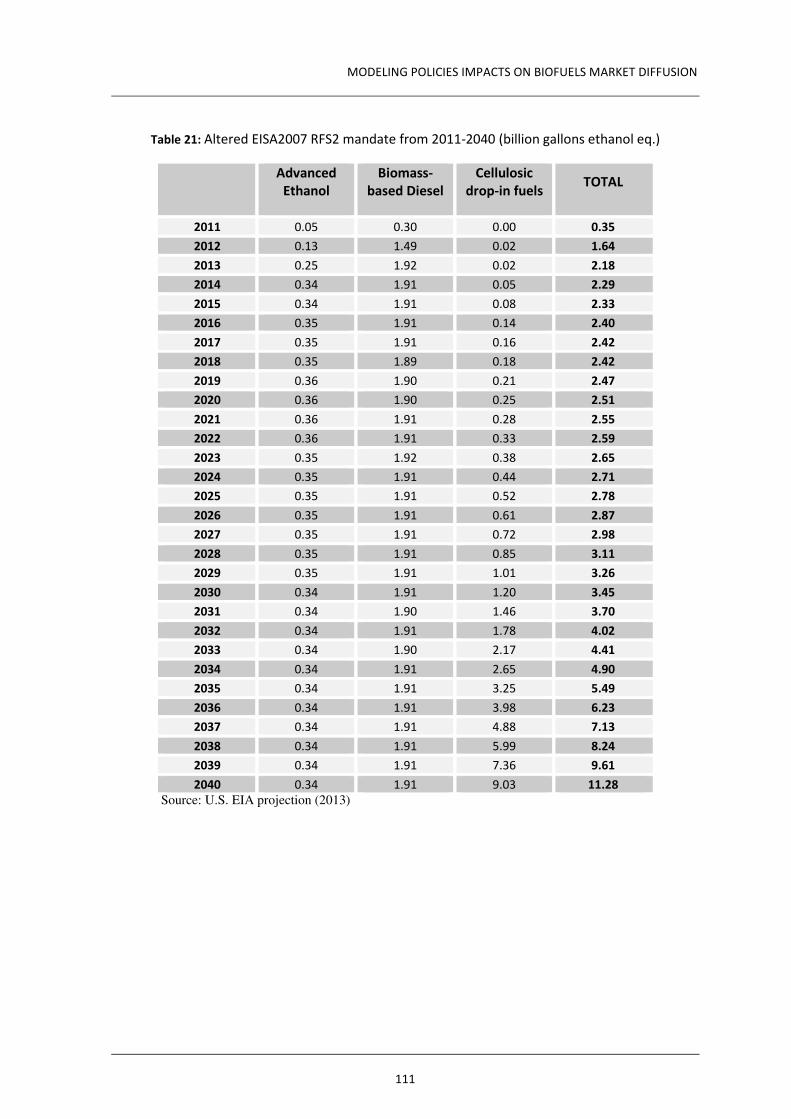
MODELING POLICIES IMPACTS ON BIOFUELS MARKET DIFFUSION
111
Table 21: Altered EISA2007 RFS2 mandate from 2011-2040 (billion gallons ethanol eq.)
Advanced
Ethanol
Biomass-
based Diesel
Cellulosic
drop-in fuels TOTAL
2011 0.05 0.30 0.00 0.35
2012 0.13 1.49 0.02 1.64
2013 0.25 1.92 0.02 2.18
2014 0.34 1.91 0.05 2.29
2015 0.34 1.91 0.08 2.33
2016 0.35 1.91 0.14 2.40
2017 0.35 1.91 0.16 2.42
2018 0.35 1.89 0.18 2.42
2019 0.36 1.90 0.21 2.47
2020 0.36 1.90 0.25 2.51
2021 0.36 1.91 0.28 2.55
2022 0.36 1.91 0.33 2.59
2023 0.35 1.92 0.38 2.65
2024 0.35 1.91 0.44 2.71
2025 0.35 1.91 0.52 2.78
2026 0.35 1.91 0.61 2.87
2027 0.35 1.91 0.72 2.98
2028 0.35 1.91 0.85 3.11
2029 0.35 1.91 1.01 3.26
2030 0.34 1.91 1.20 3.45
2031 0.34 1.90 1.46 3.70
2032 0.34 1.91 1.78 4.02
2033 0.34 1.90 2.17 4.41
2034 0.34 1.91 2.65 4.90
2035 0.34 1.91 3.25 5.49
2036 0.34 1.91 3.98 6.23
2037 0.34 1.91 4.88 7.13
2038 0.34 1.91 5.99 8.24
2039 0.34 1.91 7.36 9.61
2040 0.34 1.91 9.03 11.28
Source: U.S. EIA projection (2013)
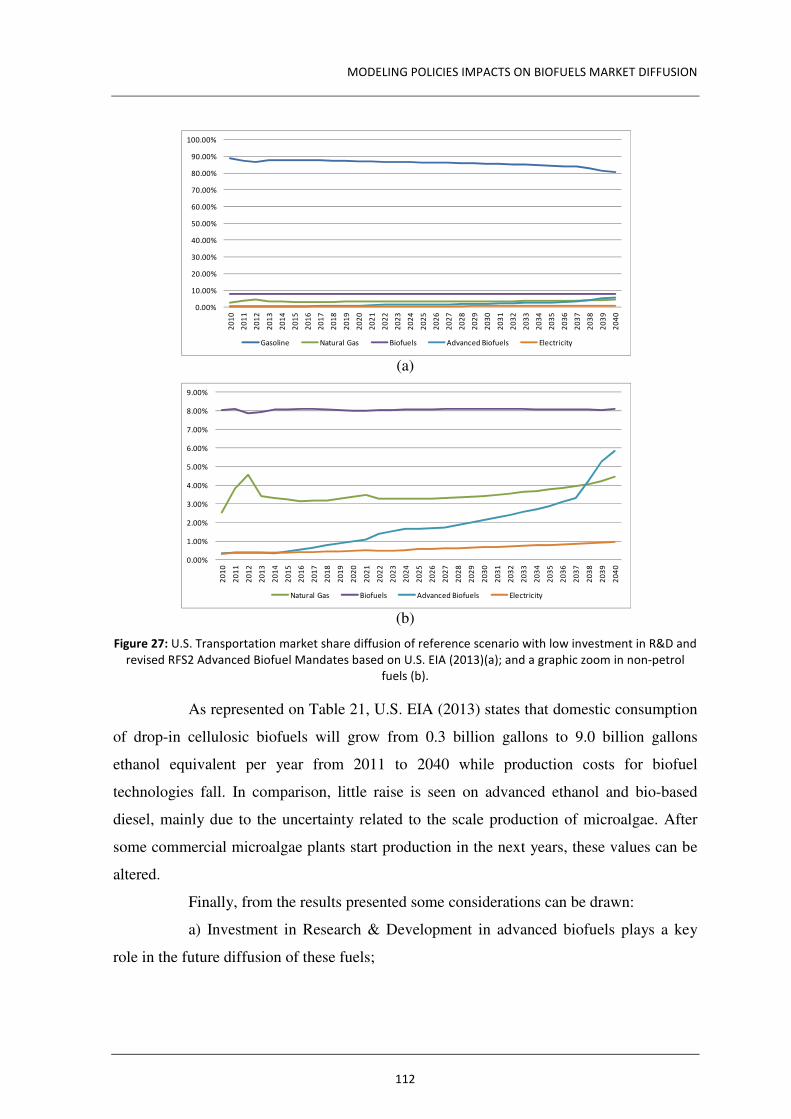
MODELING POLICIES IMPACTS ON BIOFUELS MARKET DIFFUSION
112
(a)
(b)
Figure 27: U.S. Transportation market share diffusion of reference scenario with low investment in R&D and
revised RFS2 Advanced Biofuel Mandates based on U.S. EIA (2013)(a); and a graphic zoom in non-petrol
fuels (b).
As represented on Table 21, U.S. EIA (2013) states that domestic consumption
of drop-in cellulosic biofuels will grow from 0.3 billion gallons to 9.0 billion gallons
ethanol equivalent per year from 2011 to 2040 while production costs for biofuel
technologies fall. In comparison, little raise is seen on advanced ethanol and bio-based
diesel, mainly due to the uncertainty related to the scale production of microalgae. After
some commercial microalgae plants start production in the next years, these values can be
altered.
Finally, from the results presented some considerations can be drawn:
a) Investment in Research & Development in advanced biofuels plays a key
role in the future diffusion of these fuels;
0.00%
10.00%
20.00%
30.00%
40.00%
50.00%
60.00%
70.00%
80.00%
90.00%
100.00%
20
10
20
11
20
12
20
13
20
14
20
15
20
16
20
17
20
18
20
19
20
20
20
21
20
22
20
23
20
24
20
25
20
26
20
27
20
28
20
29
20
30
20
31
20
32
20
33
20
34
20
35
20
36
20
37
20
38
20
39
20
40
Gasoline Natural Gas Biofuels Advanced Biofuels Electricity
0.00%
1.00%
2.00%
3.00%
4.00%
5.00%
6.00%
7.00%
8.00%
9.00%
20
10
20
11
20
12
20
13
20
14
20
15
20
16
20
17
20
18
20
19
20
20
20
21
20
22
20
23
20
24
20
25
20
26
20
27
20
28
20
29
20
30
20
31
20
32
20
33
20
34
20
35
20
36
20
37
20
38
20
39
20
40
Natural Gas Biofuels Advanced Biofuels Electricity
MODELING POLICIES IMPACTS ON BIOFUELS MARKET DIFFUSION
113
b) It is more interesting in terms of diffusion to create policies that enhance
research and development of advanced biofuels that would lead to increased availability
and lower future prices than to merely enable subsidies to make them readily competitive
with other fuels;
c) Enabling Petrol taxes not only enhances the diffusion of Advanced Biofuels
but also all other fuels in the market share; and if there are not enough biofuels to fulfill the
demand, natural gas and electricity become key players in the market share;
d) If no public policy is enabled to enhance the Advanced Biofuels industry, it
would play a minor role in the future of energy transportation. This scenario could
dramatically change depending on the policies adopted and
e) Given the uncertainty of long-term crude oil prices, the real competitive
price level for advanced biofuels can be far higher.
Although it is very unlikely to promote such taxation on petroleum products, it
is interesting to study how strong fiscal impacts would affect the market diffusion of all
fuels until 2040. Moreover, with policy support and incentives, the algal biofuels industry
(and advanced biofuels) will continue to develop and assuming that this technology
follows renewable energy cost trends, costs will decrease to eventual economic viability.

CONCLUSIONS
115
6. CONCLUSIONS
As several times mentioned throughout this work, the continued use of fossil
fuels for energetic purposes is gradually becoming clearer to society that is unsustainable.
Innovative technologies and sources of energy must then be developed to replace fossil
fuels. However, alternative sources of biofuel derived from terrestrial crops such as
sugarcane, soybeans, maize, rapeseed, among others, inflict a lot of pressure on the global
food markets, contribute to water scarcity and precipitate the destruction of forests.
Furthermore, many countries cannot grow most of the terrestrial crops due to climate
factors or lack of fertile cultivation areas for energetic purposes. In this context, using
microalgae as a feedstock for biofuels is strongly believed to make a contribution for the
future world sustainability.
Algae biofuel technological advances in cultivation and extraction of oil are
scientifically well known, and should continue to move forward in the coming years with
increasing investment in R&D in this area. However, as shown in this thesis, many are the
challenges for this technology to be successful and produce biofuels in a sustainable
manner. Therefore, what are the main drivers that influence the overall sustainability
of microalgae biofuels, considering economic, social and environmental impacts?
Consensus among the algae experts was reached in many of the prospects and
bottlenecks of this technology. The Delphi method proved to be a successful research
method when expert opinions are the main source of information available, due to a lack of
appropriate historical, economic or technical data. The outcomes provided a clear outline
of the main issues of microalgae biofuels' market at the present and in the future. In
particular, the two-round survey revealed the most important issues affecting this emerging
market and also, recommended ways to influence future policies and development of this
biofuel.
Environmental sustainability can be directly affected by several issues in
microalgae cultivation, such as poor energy balance, water scarcity or greenhouse gas
benefits if some processes are not adopted in the cultivation and production. Some of the
key processes are anaerobic digestion to generate energy for the process, recycling
nutrients from wastewater and seawater, and using a source of CO2 from emitting
industries. The need of finding locations with favorable climate, in non-agricultural land,
CONCLUSIONS
116
with feasible water supply and CO2 resources are also key aspects concerning
environmental sustainability of microalgae biofuels. However, as shown in the
sustainability assessment, it is possible to produce biofuels from microalgae while being
environmentally sustainable depending on the cultivation processes that are chosen.
Social equity presents a favorable panorama. The possibility to produce fuels
with no need of "proven geographical reserves" renders to this technology a strong social
characteristic, in which many countries have the possibility to produce it. This allows
increased independence on foreign energy and increase the energy security of producing
countries, as developing domestic sources of energy are key to promoting energy security.
Moreover, for developing countries with high levels of poverty, the relationship of
increased consumption of energy and well-being is stronger. Therefore, beyond job
generation impacts, providing economic stimulus for such countries, algal biofuel
production would provide energy availability and security, while encouraging
infrastructure and social development, without the dire effects of the food versus fuel issue
of 1st generation biofuels.
Economical viability still is uncertain as the cost of producing biofuels from
algae still generates divergence among experts and it is unknown, so far, if it could
compete equally with other fuels in the market. Thus, for the establishment of a credible
market, steady and with a growing demand, experts agree that microalgae biofuels need to
be stimulated, as many of the implementation stages of emerging technologies can face
limitations that can lower the possibility of success. Therefore, with policy support and
incentives, the algal biofuel industry could continue to develop and assuming that this
technology follows renewable energy cost trends, costs would decrease to eventually reach
economic viability. This leads to the second question, which policies currently affect
microalgae biofuels industry?
Although the idea of a global carbon offset is already affecting all renewables
market, concerning particularly microalgae biofuels, depending on the region different
policies are found. In the United States, the Energy Independence and Security Act of 2007
establishes annual renewable fuel standard (RFS and RFS2) and is an important
mechanism of energy sources change, aiming to reach 36 billion gallons of renewable fuel
by 2022. Besides that, investment in microalgae R&D in cultivation and deployment of
commercial processes through the American Recovery and Renewal Act (ARRA),

CONCLUSIONS
117
Department of Energy Biomass Program and the U.S Ministry of Defense are also
important measures to be highlighted.
In the European Union, the Directive 2009/28/EC sets mandatory national
targets for the overall share of energy from renewable sources in gross final consumption
of energy and for the share of energy from renewable sources in transport. Although, it
does not mention algae fuels directly, it also establishes sustainability criteria for biofuels
and bioliquids. In the other hand, the Strategic Energy Technology (SET) Plan sets out a
medium term strategy valid across all sectors stating that development and demonstration
projects for the main technologies must be speeded up. The SET-Plan lists several energy
technologies, which will be required to bring together economic growth and a vision of a
decarbonized society. It states that advanced biofuels, namely microalgae, are supposed to
play a significant role.
Although It is expected much more advances in this field in the next few years,
research on the welfare economics of renewable energy policy is still in its infancy and the
economic effects of biofuel policies are not only complex and difficult to understand, but
are ultimately ambiguous in theory. Thus, in an attempt to clarify a part of this matter the
last question emerges: What policies could enhance the diffusion of microalgae in the
transportation market share in the future?
Experts consent that public investment in R&D is the most important policy to
be adopted by countries and this was confirmed through the development of a model.
Modeling using SAN formalism proved to be an effective research method and offered
useful future scenarios regarding the advanced biofuels market. It emphasized what the
experts had already agreed upon, and also revealed the potential impact of advanced
biofuels subsidies and petrol taxes. Mandates were are also considered of great importance,
although the model failed to predict how is the real impact of such policy in the diffusion.
These results can serve as recommendations concerning public policies to be enacted
through policy makers.
Cultivating microalgae to produce biofuels has, consequently, a strong
potential in multiple domains, such as energy, food and agriculture, national security and
sustainability. The task that remains is how to disentangle the puzzle of a sustainable
(technical, economical, social and environmental) production process, with all the
obstacles that were herein presented. Nonetheless, according to our analysis, it is believed
CONCLUSIONS
118
to be feasible. It will, thus, require innovative dimensions of political will and institutional
cooperation to achieve the solution to this complex challenge.
6.1. Limitations and recommendations for future
research
Although this research has reached its aims, some tests ahead still remain. In
this section, the main limitations of this work and some recommendations for future
research are addressed.
First of all, the sample size of the Delphi survey could have been larger and,
thus, more representative in statistical terms. The author is aware that the outcomes might
not represent the majority of the microalgae experts’ opinion. In the same manner, after
analyzing the results, some questions that did not reach a consensus could be further
explored in a supplementary study or in a third round of survey. More robust statistical
calculations could have been done with the data obtained. However, due to the small
sample size, this was not possible.
Regarding the model developed, some limitations can also be highlighted. With
the current model, it was arduous to mimic the impact of policy mandates, since the real
effect of them in the market is not based in prices or quantity produced. Some studies
consider them as binding policies, but, many times, it is not what happens in the real world,
as we can see, namely, in the advanced biofuels field in the U.S.
Some other issues were not dealt with and could be interesting to develop
further studies on them. For example, the GHG emissions were not considered in the
model and with some adaptations it is possible to combine them with the current model.
Other possibilities are to account for the difference of overall energy used throughout the
years; to model the impacts of GHG policies and other pathways for natural gas and
electricity; and to develop models for other regions such as Europe or even the entire
World.
6.2. Contributions
The research presented in this thesis has lead to the following publications:

CONCLUSIONS
119
International Journal Publications:
- Ribeiro, L.A; SILVA, P.P.; Mata, T.; Martins, A.A., 2014. Prospects of Using Microalgae for
Biofuels Production: Results of a Delphi Study. In: Renewable Energy. Accepted with minor
revisions.
- RIBEIRO, L.A.; SILVA, P.P. Surveying techno-economic indicators of microalgae biofuel
technologies. In: Renewable and Sustainable Energy Reviews, Vol. 25, Set., pp. 89-96, 2013.
- FERREIRA, A.F.; RIBEIRO, L.A.; BATISTA, A.P.; MARQUES, P.A.S.S.; NOBRE, B.P.;
PALAVRA, A.M.F.; SILVA, P.P.; GOUVEIA, L.; SILVA, C. A. Biorefinery from Nannochloropsis
sp. microalga – Energy and CO2 emission and economic analyses In: Bioresource
Technology, Vol. 138, Jun. pp. 235-244, 2013.
- RIBEIRO, L.A.; SILVA, P.P. Technoeconomic Assessment on Innovative Biofuel
Technologies: The Case of Microalgae, In: ISRN Renewable Energy Vol. 2012, Article ID
173753, 2012.
- SILVA, P.P.; RIBEIRO, L.A. The role of microalgae in the deployment of biofuels: contrasting
renewable energy technologies, In: International Journal of Technology, Policy and
Management (IJTPM), Vol.12, No.2/3, pp.158-176, 2012.
Book Chapters:
- RIBEIRO, L.A.; DIAS, P.; NASCIMENTO, L.F.M.; SILVA, P.P. Technological Issues: Algae
Biofuels In: Liquid Biofuels: Emergence, Development And Prospects, Editors: Antonio D.
PADULA, Manoela S. SANTOS, Omar, B. SANTOS, and Denis BORENSTEIN (Federal
University of Rio Grande do Sul - Porto Alegre – Brazil), Vol. 24, Springer, 2014 (ISBN 978-1-
4471-6481-4).
- RIBEIRO, L.A.; SILVA, P.P. Outlook on the Upcoming of Advanced Biofuels: Inputs from a
Delphi Study In: Energy Management of the Series Energy Science & Technology, Editor: J.N.
Govil, Vol. 12, 2014. Book in press.
- RIBEIRO, L.A. Biocombustíveis de Algas? In: Sustentabilidade: resultados de pesquisas do
PPGA/EA/UFRGS, Editors: Luis Felipe NASCIMENTO and Patrícia TOMETICH – Porto
Alegre: Grupo de Pesquisa em Sustentabilidade e Inovação – GPS, 2013 (ISBN 978-85-
915531-0-5).
CONCLUSIONS
120
Conference Proceedings:
- RIBEIRO, L.A.; SILVA, P.P.; RIBEIRO, L.; DOTTI, F.L. Modeling the impacts of policies on
microalgae biofuel feedstocks diffusion, "Proceedings of the 14th IAEE European Energy
Conference on Sustainable Energy Policy and Strategies for Europe”, October 28-31th, Rome,
Italy, 2014.
- RIBEIRO, L.A.; SILVA, P.P. Technology Experts Visions for Microalgae Biofuels: A Delphi
Study, "Proceedings of the Energy for Sustainability: Sustainable Cities: Designing for people
and the planet", September 8-10th, Coimbra, Portugal, 2013.
- RIBEIRO, L.A.; SILVA, P.P.; MATA, T.M., MARTINS, A.A. Prospects on employing
microalgae into the production of biofuels: outcomes from a Delphi study, "Proceedings of the
ICEE Energy & Environment: bringing together Economics and Engineering ", May 9-10th,
Porto, Portugal, 2013.
- RIBEIRO, L.A.; SILVA, P.P.; CONNORS, S. Economical Evaluation of Emerging Biofuel
Technologies: The Microalgae Case Study, "MIT Energy Club - Energy Night", June 1st,
Lisbon, Portugal, 2012.
- RIBEIRO, L.A.; SILVA, P.P. Innovative biofuel Technologies: microalgae analysis,
"Proceedings of the 34th IAEE International Conference on Institutions, Efficiency and
Evolving Energy Technologies”, June 19-23th, Stockholm, Sweden, 2011.
- RIBEIRO, L.A.; SILVA, P.P. Policies and Challenges for Advanced Biofuel Technologies: a
look into microalgae, "Proceedings of the SDEWES2011 6th Dubrovnik Conference on
Sustainable Development of Energy, Water and Environment Systems", September 25-29th,
Dubrovnik, Croatia, 2011.
CONCLUSIONS
121
7. REFERENCES
ABO (Algal Biomass Organization), 2014. [internet]. [accessed Sept 2014] Available at: http://www.algaebiomass.org/algaeo-biomass-organization-legislative-review/.
Acién, F.G., Fernández, J.M., Magán, J.J., Molina, E., 2012. Production cost of a real microalgae production plant and strategies to reduce it. Biotechnology advances 30 (6), 1344-53.
Alabi, A.O., Tampier, M., Bibeau, E., 2009. Microalgae Technologies and Processes for Biofuels/Bioenergy Production in British Columbia: Current Technology, Suitability and Barriers to Implementation: Final Report. Victoria, British Columbia: British Columbia Innovation Council.
Assunção, J., Espindola, L., Fernandes, P., Pivel, M., Sales, A., 2013. A structured stochastic model for prediction of geological stratal stacking patterns. Electronic Notes in Theoretical Computer Science (ENTCS) 296, 27-42 .
Azar, C., 2003. Emerging scarcities: bioenergy-food competition in a carbon constrained world. In: Simpson, D., Toman, M., Ayres, R. (Eds.), Scarcity and Growth in the New Millennium. Resources for the Future. Johns Hopkins University Press, Baltimore, MD.
Baldo, L., Brenner, L., Fernandes, L.G., Fernandes, P., Sales, A., 2005. Performance Models for Master/Slave Parallel Programs. Electronic Notes In Theoretical Computer Science (ENTCS) 128 (4), 101-121.
Banse, M., Grethe, H., Deppermann, A., Nolte, S., 2010. European Simulation Model ( ESIM ): Documentation of the Model Code, Hohenheim, Brunswick.
Barton, B., Clark, S.E., 2014. Water & Climate Risks Facing U.S. Corn Production (p. 72).
Batan, L., Quinn, J., Willson, B., Bradley, T., 2010. Net energy and greenhouse gas emission evaluation of biodiesel derived from microalgae. Environmental Science and Technology 44 (20), 7975-7980.
Beer, L.L., Boyd, E.S., Peters, J.W., Posewitz, M.C., 2009. Engineering algae for biohydrogen and biofuel production. Current Opinion Biotechnology 20 (3), 264-271.
Behrens P.W. 2005. Photobioreactors and fermentors: The light and dark sides of growing algae. In: Andersen R.A. (Ed.). Algal Culturing Techniques. New York: Elsevier Academic Press. 189-204.
Benemann J.R., Van Olst J.C., Massingill M.J., Weissman J.C., Brune D.E., 2002. The controlled eutrophication process: Using microalgae for CO2 utilization and agricultural fertilizer recycling, in: Proc. Conf. on Greenhouse Gas Control Technologies, Kyoto, Japan.
Benemann, J.R., 2012. Microalgae Biofuels and Animal Feeds: An Introduction.
Benemann, J.R., Oswald, W.J. 1996. Systems and Economic Analysis of Microalgae Ponds for Conversion of CO2 to Biomass, Final Report, Pittsburgh Energy Technology Center.
Bio-era, 2009. U.S. Economic Impact of Advanced Biofuels Production: Perspectives to 2030. (http://www.cleantechsandiego.org/reports/EconomicImpactAdvancedBiofuels.pdf)
Blind, K., Cuhls, K. and Grupp, H., 2001. Personal attitudes in the assessment of the future of science and technology: a factor analysis approach. Technological Forecasting and Social Change 68 (2), 131-149.
Brennan, L., Owende, P., 2010. Biofuels from microalgae - A review of technologies for production, processing, and extractions of biofuels and co-products. Renewable and Sustainable Energy Reviews 14 (2), 557-577.
CONCLUSIONS
122
Britz, W., Witzke, P., 2012. CAPRI model documentation 2012.
Brown, L.M., 1996. Uptake of carbon dioxide from flue gas by microalgae. Energy Conversion and Management 37(6), 1363-1367.
Buford, M., DuPont, A., Widman, N., Ferrell, J., Miller, M.-B., Bastian, H., … Wight, B., 2012. Bioenergy Feedstock Best Management Practices: Summary and Research Needs. (http://www.biomassboard.gov/pdfs/bioenergy_feedstocks_bmps.pdf)
California Air Resources Board, 2009. Proposed Regulation to Implement the Low Carbon Fuel Standard, Vol. I, Staff Report: Initial Statement of Reasons, 374.
Campbell, P.K., Beer, T., Batten, D., 2011. Life cycle assessment of biodiesel production from microalgae in ponds. Bioresource Technology 102(1), 50-56.
Carvalho, A.P., Meireles, L.A., Malcata, F. X., 2006. Microalgal reactors: a review of enclosed system designs and performances. Biotechnology progress 22(6), 1490-506.
Castanheira, E.G., Silva, P.P., 2010. Governance of the emerging biofuel markets in European Union: the Portuguese context. Global Business and Economics Review 12 (3), 230-250.
Celitkas, M.S., Kocar, G., 2012. Foresight analysis of wind power in Turkey. Int. J. of Energy Res. 36, 737-748.
Chanin, R., Corrêa, M., Fernandes, P., Sales, A., Scheer, R., Zorzo, A.F., 2006. Analytical Modeling for Operating System Schedulers on NUMA Systems, Electronic Notes in Theoretical Computer Science (ENTCS) 151 (3), 131-149.
Chen, P., Min, M., Chen, Y., Wang, L., 2009. Review of biological and engineering aspects of algae to fuels approach. Int. J. Agric. & Biol Engineering 2(4), 1.
Chisti, Y., 2007. Biodiesel from microalgae. Biotechnology Advances 25 (3), 294-306.
Clarens A.F., Resurreccion E.P., White M.A., Colosi, L.M., 2010. Environmental life cycle comparison of algae to other bioenergy feedstocks. Environmental science & technology 44(5):1813-9.
Clarens, A.F., Nassau, H., Resurreccion, E.P., White, M.A., Colosi, L.M., 2011. Environmental impacts of algae-derived biodiesel and bioelectricity for transportation. Environ Sci Technol 45, 7554-7560.
Collet, P., Hélias, A., Lardon, L., Ras, M., Goy, R.-A., Steyer, J.-P., 2009. Life-cycle assessment of microalgae culture coupled to biogas production. Bioresource technology 102(1), 207-14.
Czekster, R.M., Fernandes P., Sales A., Webber, T., Zorzo, A.F., 2011. Stochastic model for QoS assessment in multi-tier web services, Electronic Notes in Theoretical Computer Science (ENTCS) 275, 53-72.
Daly, H.E., 2007. Ecological Economics and Sustainable Development: Selected Essays of Herman Daly. MPG Books Ltd, Bodmin, England.
Dasari, M.A., Kiatsimkul, P.P., Sutterlin, W.R., Suppes, G.J., 2005. Low-pressure hydrogenolysis of glycerol to propylene glycol. Appl Catal A 281, 225-231.
Davis, R., Aden, A., Pienkos, P.T., 2011. Techno-economic analysis of autotrophic microalgae for fuel production. Applied Energy 88(10), 3524-3531.
Davis, R., Fishman, D., Frank, E.D., Wigmosta, M.S., Aden, A., Coleman, A.M., … Wang, M.Q., 2012. Renewable Diesel from Algal Lipids : An Integrated Baseline for Cost, Emissions, and Resource Potential from a Harmonized Model (p. 85).
De Gorter, H., Just, D.R., 2010. The Social Costs and Benefits of Biofuels: The Intersection of Environmental, Energy and Agricultural Policy. Applied Economic Perspectives and Policy 32(1), 4-32.
CONCLUSIONS
123
Demirbas, A., Demirbas, M.F., 2010. Algae Energy - Algae as a New source of Biodiesel. Algae. Springer, London.
Dmitrov K., 2007. GreenFuel Technologies: A case study for industrial photosynthetic energy capture. Brisbane, Australia. (http://moritz.botany.ut.ee/~olli/b/Dmitrov.pdf)
Dotti, F.L., Fernandes, P., Nunes, C.M., 2011. Structured Markovian models for discrete spatial mobile node distribution, Journal of the Brazilian Computer Society 17 (1), 31-52.
Dotti, F.L., Fernandes, P., Sales, A., Santos O.M., 2005. Modular Analytical Performance Models for Ad Hoc Wireless Networks, in: 3rd Int. Symp. on Modeling and Optimization in Mobile, Ad Hoc, and Wireless Networks (WiOpt'05), Riva del Garda, Trentino, Italy, IEEE Computer Society, 164-173.
Eisentraut, A., 2010. Sustainable Production Of Second-Generation Biofuels: Potential and Perspectives in Major Economies and Developing Countries. International Energy Agency, France.
European Commission (E.C.), 2007. A European Strategic Energy Technology Plan (Set-Plan): Towards a low carbon future. Available at: http://eur-lex.europa.eu/legal-content/EN/TXT/PDF/?uri=CELEX:52007DC0723&from=EN
European Union (E.U.), 2009. Directive 2009/28/EC of the European Parliament and of the Council of 23 April 2009 on the promotion of the use of energy from renewable sources. Official Journal of the European Union.
European Union (E.U.), 2012. Proposal for a Directive of the European Parliament and of the Council, amending Directive 98/70/EC relating to the quality of petrol and diesel fuels and amending Directive 2009/28/EC on the promotion of the use of energy from renewable sources (Com. 2012/0288).
FAO, Food and Agriculture Organization, 2013. (http://www.wfp.org/hunger/who-are)
Farrell, A.E., Plevin, R.J., Turner, B.T., Jones, A.D., O’Hare, M., Kammen, D.M., 2006. Ethanol can contribute to energy and environmental goals. Science 311 (5760), 506-508.
Fernandes, P., O'Kelly, M.E.J., Papadopoulos, C.T., Sales A., 2013. Analysis of exponential reliable production lines using Kronecker descriptors, International Journal of Production Research 1, 1-18.
Fernandes, P., Sales, A., Santos, A. R., Webber, T., 2011. Performance Evaluation of Software Development Teams: a Practical Case Study. Electronic Notes in Theoretical Computer Science 275, 73-92.
Ferreira, A.F., Ribeiro, L.A., Batista, A.P., Marques, P.A.S.S., Nobre, B.P., Palavra, A.M.F., Silva, P.P.V., Gouveia, L., Silva, C. A., 2013. Biorefinery from nannochloropsis sp. Microalga – energy and CO2 emission and economic analyses. Bioresource Technology 138, 235-244.
Fonseca, M.B. et al., 2010. Impacts of the EU Biofuel Target on Agricultural Markets and Land Use A Comparative Modelling Assessment.
Frank, E.D., Han, J., Palou-Rivera, I., Elgowainy, A., Wang, M.Q., 2012. Methane and nitrous oxide emissions affect the life-cycle analysis of algal biofuels. Environmental Research Letters 7(1), 014030.
Frank, E.D., Han, J., Palou-Rivera, I., Elgowainy, A., Wang, M.Q., 2011. User Manual for algae life-cycle analysis with GREET: Version 0.0, ANL/ESD/11-7.
Ghirardi, M.L., Zhang, J.P., Lee, J.W., Flynn, T., Seibert, M., Greenbaum, E., et al., 2000. Microalgae: a green source of renewable H2.Trends Biotechnol 18, 506-11.
Gladue, R.M., Maxey, J.E., 1994. Microalgae feeds for aquaculture. J of Applied Phycology 6, 131-41.
CONCLUSIONS
124
Groom, M.J., Gray, E.M., Townsend, P., 2008. Biofuels and biodiversity: principles for creating better policies for biofuel production. Conservation biology : the journal of the Society for Conservation Biology 22 (3), 602-9.
Gunaseelan, V.N., 1997. Anaerobic digestion of biomass for methane production: A review. Biomass and Bioenergy 13(1–2), 83-114.
Gupta, U.G., Clarke, R.E., 1996. Theory and applications of the Delphi technique: A bibliography (1975-1994). Technological Forecasting and Social Change 53(2), 185-211.
Guthrie, R., 2009. Prospects for Biofuels in Alabama: A Synthesis of Expert Opinion, Alabama Agricultural Station, Auburn Universty.
Hill, J., Nelson, E., Tilman, D., Polasky, S., Tiffany, D., 2006. Environmental, economic, and energetic costs and benefits of biodiesel and ethanol biofuels. PNAS 103 (30), 11206–11210.
Hirano, A., Ueda, R., Hirayama, S., Ogushi, Y., 1997. CO2 fixation and ethanol production with microalgal photosynthesis and intracellular anaerobic fermentation. Energy 22 (2-3), 137-142.
Huesemann, M., Roesjadi, G., Benemann, J., Metting, F.B., 2010. Biofuels from Microalgae and Seaweeds. Biomass to Biofuels: Strategies for Global Industries, John Wiley and Sons, Ltd., West Sussex, U.K.
IEA World Energy Outlook, 2012. Key World Energy Statistics.
Iersel, S. van, Flammini, A., 2010. Algae-based Biofuels: Applications and Co-products. Algae. Rome, Italy: FAO Environmental and Natural Resources Service Series.
Johnstone, N., Hascic, I., Popp, D., 2010. Renewable energy policies and technological innovation: evidence based on patent counts. Environmental and Resource Economics 45, 133-55.
Jorquera, O., Kiperstok, A., Sales, E.A., Embiruçu, M., Ghirardi, M.L., 2010. Comparative energy life-cycle analyses of microalgal biomass production in open ponds and photobioreactors. Bioresource technology 101(4), 1406-13.
Junginger, H.M., Lako, P., Lensink, S., van Sark, W.G.J.H.M., Weiss, M., 2008. Technological learning in the energy sector. Netherlands: ECN, Group Science, Technology and Society, Copernicus Institute, Utrecht University Utrecht.
Lapan, H., Moschini, G., 2012. Second-best biofuel policies and the welfare effects of quantity mandates and subsidies. Journal of Environmental Economics and Management 63 (2), 224-241.
Lardon, L., Hélias, A., Sialve, B., Steyer, J.-P., Bernard, O., 2009. Life-Cycle Assessment of Biodiesel Production from Microalgae. Environmental Science & Technology 43(17), 6475-6481.
Lee, Y.K., 2001. Microalgal Mass Culture Systems and Methods: Their limitation and potential. J of Applied Phycology 13, 307-15.
Li, X., Xu, H., Wu, Q., 2007. Large-scale biodiesel production from microalga Chlorella protothecoides through heterotrophic cultivation in bioreactors. Biotechnology and Bioengineering 98, 764-71.
Liu, X., Clarens, A.F., Colosi, L.M., 2012. Algae biodiesel has potential despite inconclusive results to date. Bioresour. Technology 104, 803-806.
Liu, X., Saydah, B., Eranki, P., Colosi, L.M., Greg Mitchell, B., Rhodes, J., Clarens, A.F., 2013. Pilot-scale data provide enhanced estimates of the life cycle energy and emissions profile of algae biofuels produced via hydrothermal liquefaction. Bioresource technology 148, 163-71.
Lubieniechi, S., Smyth, S., 2011. Barriers to Biofuels in Canada: Results of an Expert Delphi Study, Communication to Conference Sustainability and the Bioeconomy, organizated by the International Consortium on Applied Bioeconomy Research (ICABR), Rome, Italy.

CONCLUSIONS
125
Mata, T.M., Martins, A.A., Caetano, N.S., 2010. Microalgae for biodiesel production and other applications. Renew. Sust. Energ. Rev. 14 (1), 217-32.
Mcgraw, L., 2009. The Ethics of Adoption and Development of Algae-based Biofuels. UNESCO, Bangkok.
McLeod, J., Childs, S., 2007. Consulting records management oracles – a Delphi in practice. Archival Science 7 (2), 147-166.
Mendes, R., Fernández, H., Coelho, J., Reis, E., Cabral, J., Novais, J., Palavra, A., 1995. Supercritical CO2, extraction of carotenoids and other lipids from Chlorella vulgaris. Food chemistry 53(1), 99-103.
Miller, S. A., 2010. Minimizing land use and nitrogen intensity of bioenergy. Environmental science & technology, 44(10), 3932-9.
Moheimani, N.R., 2005. The Culture of Coccolithophorid Algae for Carbon Dioxide Bioremediation [dissertation]. Australia: Murdoch University.
Moheimani, N.R., Borowitzka, M.A., 2007. Limits to productivity of the alga Pleurochrysis carterae (Haptophyta) grown in outdoor raceway ponds. Biotechnology and bioengineering 96(1), 27-36.
Molina Grima, E., Belarbi, E.H., Acien Fernández, F., Robles Medina A., Chisti, Y., 2003. Recovery of microalgal biomass and metabolites: process options and economics. Biotechnology Advances 20, 491-515.
OECD (Organization for Economic Co-operation and Development), 2006. OECD-FAO Agricultural Outlook, 2006-2015 (AGR/CA/APM(2006)1/FINAL).
OECD (Organization for Economic Co-operation and Development), 2011. Fostering Innovation for Green Growth. OECD Green Growth Studies, OECD Publishing.
Ono, E., Cuello, J.L., 2006. Feasibility assessment of microalgal carbon dioxide sequestration technology with photobioreactor and solar collector. Biosystems Engineering 95 (4), 597-606.
Passell, H., Dhaliwal, H., Reno, M., Wu, B., Ben Amotz, A., Ivry, E., … Ayer, N., 2013. Algae biodiesel life cycle assessment using current commercial data. Journal of environmental management 129, 103-11.
Pate, R., 2009. Techno-Economics, Siting, and Resource Use Challenges for Onshore Algal Biofuel Production, in: Proc. of Wind, Sea and Algae: International Workshop on Offshore Algae for Biofuels and Beyond, Maribo, Denmark, 2009.
Patil, V., Tran, K.-Q., Giselrød, H.R., 2008. Towards sustainable production of biofuels from microalgae. International journal of molecular sciences 9(7), 1188-95.
Pienkos, P.T., 2007. The Potential for Biofuels from Algae, in: Algae Biomass Summit. San Francisco, USA: NREL/PR-510-42414.
Pienkos, P.T., Darzins, A., 2009. The promise and challenges of microalgal-derived biofuels. Biofuels, Bioproducts and Biorefining 3(4), 431-440.
Pimentel, D., 2003. Ethanol fuels: Energy balance, economics, and environmental impacts are negative. Nat. Resour. Res 12 (2), 127-134.
Pittman, J.K., Dean, A.P., Osundeko, O., 2011. The potential of sustainable algal biofuel production using wastewater resources. Bioresource Technology 102(1), 17-25.
Plateau, B., 1985. On the stochastic structure of parallelism and synchronization models for distributed algorithms. Sigmetrics, 147-154.
CONCLUSIONS
126
Pokoo-Aikins, G., Nadim, A., El-Halwagi, M.M., Mahalec V., 2010. Design and analysis of biodiesel production from algae grown through carbon sequestration. Clean Technol. Envir. Policy 12 (3), 239-254.
Popp, D., 2002. Induced innovation and energy prices. American Economic Rev 92, 160-80.
Popp, D., Hascic, I., Medhi, N., 2011. Technology and the diffusion of renewable energy. Energy Economics 33, 648-62.
Pulz, O., 2001. Photobioreactors: production systems for phototrophic microorganisms. Applied Microbiology and Biotechnology 57 (3), 287-293.
Pulz, O., Gross, W., 2004. Valuable products from biotechnology of microalgae. Applied microbiology and biotechnology 65(6), 635-48.
Pulz, O., Scheinbenbogan, K., 1998. Photobioreactors: design and performance with respect to light energy input. Advances in Biochemical Engineering/Biotechnology 59, 123-52.
Qin, J., 2005. Bio-hydrocarbons from algae – impacts of temperature, light and salinity on algae growth. Barton, Australia: Rural Industries Research and Development Corporation.
Radakovits, R., Jinkerson, R.E., Darzins, A., Posewitz, M.C., 2010. Genetic engineering of algae for enhanced biofuel production. Eukaryotic Cell 9 (4), 486-501.
Rathmann, R., Szklo, A., Schaeffer, R., 2010. Land use competition for production of food and liquid biofuels: an analysis of the arguments in the current debate. Renew. Energy 35, 14-22.
Rengel, A., 2008. Promising technologies for biodiesel production from algae growth systems, in: 8th European IFSA Symposium (Vol. 2, 6-10). Clermont-Ferrand, France.
Resurreccion, E.P., Colosi, L.M., White, M.A. and Clarens, A.F., 2012. Comparison of algae cultivation methods for bioenergy production using a combined life cycle assessment and life cycle costing approach. Bioresour. Technol. 126, 298-306.
Ribeiro, L.A., Silva, P.P.V., 2013. Surveying techno-economic indicators of microalgae biofuel technologies. Renewable and Sustainable Energy Reviews 25, 89-96.
Ribeiro, L.A; Silva, P.P.V.; Mata, T.; Martins, A.A., 2014. Prospects of Using Microalgae for Biofuels Production: Results of a Delphi Study. In: Renewable Energy. Accepted with minor revisions.
Richardson, J., Johson, M.D., Outlaw, J.L., 2012. Economic comparison of open pond raceways to photo bio-reactors for production of microalgae for transportation fuels in the southwest. Algal Research 1, 93-100.
Rodolfi, L., Zittelli, G.C., Bassi, N., Padovani, G., Biondi, N., Bonini, G., Tredici, M.R., 2009. Microalgae for oil: strain selection, induction of lipid synthesis and outdoor mass cultivation in a low-cost photobioreactor. Biotechnol. Bioeng. 102, 100-112.
Roessler, P.G., 1990. Environmental control of glycerolipid metabolism in microalgae: commercial implications and future research directions. Journal of Phycology 26, 393-399.
Rosegrant, M.W. and the IMPACT Development Team, 2012. International Model for Policy Analysis of Agricultural Commodities and Trade (IMPACT): Model Description. International Food Policy Research Institute (IFPRI), Washington, D.C.
Rothwell, G., 2000. Electricity Economics: Regulation and deregulation., New Jersey: IEEE Press.
Rowe, G., Wright, G., 1999. The Delphi technique as a forecasting tool: issues and analysis. International Journal of Forecasting 15 (4), 353-375.
Sander, K., Murthy, G.S., 2010. Life cycle analysis of algae biodiesel. Int. J. Life Cycle Assess. 15 (7), 704-714.

CONCLUSIONS
127
Sayadi, M.H., Ghatnekar, S.D., Kavian, M.F., 2011. Algae a promising alternative for biofuel, in: Proc. of the International Academy of Ecology and Environmental Sciences 1(2), 112-124.
Schenk, P.M., Thomas-Hall, S.R., Stephens, E., Marx, U.C., Mussgnug, J.H., Posten, C., Kruse, O., et al., 2008. Second Generation Biofuels: High-Efficiency Microalgae for Biodiesel Production. BioEnergy Research 1(1), 20-43.
Schumpeter, J.A., 1934. The Theory of Economic Development: An Inquiry into Profits, Capital, Credit, Interest, and the Business Cycle. Cambridge: Harvard University Press.
Searchinger, T., Heimlich, R., Houghton, R.A., Dong, F., Elobeid, A., Fabiosa, J., et al., 2008. Use of U.S. croplands for biofuels increases greenhouse gases through emissions from land-use change, Science, 319 (5867), 1238-40.
Sheehan, J., Dunahay, T., Benemann, J., Roessler, P., 1998. A Look Back at the U.S. Department of Energy’s Aquatic Species Program - Biodiesel from Algae, National Renewable Energy Laboratory, July.
Silva, P.P., Ribeiro, L.A., 2012. The role of microalgae in the deployment of biofuels: contrasting algae and solar technologies. International Journal of Technology, Policy and Management 12 (2/3), 158-176.
Singh, A., Nigam, P.S., Murphy, J.D., 2011. Renewable fuels from algae: an answer to debatable land based fuels. Bioresource technology 102(1), 10-6.
Singh, J., Gu, S., 2010. Commercialization potential of microalgae for biofuels production. Renewable and Sustainable Energy Reviews 14(9), 2596-2610.
Singh, R.N., Sharma, S., 2012. Development of suitable photobioreactor for algae production – A review. Renewable and Sustainable Energy Reviews 16(4), 2347-2353.
Slade, R., Bauen, A., 2013. Micro-algae cultivation for biofuels: Cost, energy balance, environmental impacts and future prospects. Biomass and Bioenergy 53(0), 29-38.
Solecki, M., Dougherty, A., Epstein, B., 2012. Advanced Biofuel Market Report 2012: Meeting U.S. Fuel Standards.
Sorda, G., Banse, M., Kemfert, C., 2010. An overview of biofuel policies across the world. Energy Policy, 38(11), 6977-6988.
Spolaore, P., Joannis-Cassan, C., Duran, E., Isambert, A., 2006. Commercial applications of microalgae. Journal of bioscience and bioengineering 101(2), 87-96.
Stephenson, A.L., Kazamia, E., Dennis, J.S., Howe, C.J., Scott, S.A., Smith, A.G., 2010. Life-Cycle Assessment of Potential Algal Biodiesel Production in the United Kingdom : A Comparison of Raceways and Air-Lift Tubular Bioreactors. Energy Fuels 24, 4062-4077.
Stratton, R.W., Wong, H.M., Hileman, J.I., 2010. Life Cycle Greenhouse Gas Emissions from Alternative Jet Fuels 571.
Subhadra, B.G., Edwards, M., 2011. Coproduct market analysis and water footprint of simulated commercial algal biorefineries. Applied Energy 88, 3515-3523
Taheripour, F., Birur, D.K., Hertel, T.W., Tyner, W.E., 2008. Introducing Liquid Biofuels into the GTAP Data Base.
Takagi, M., Karseno, Yoshida, T., 2006. Effect of salt concentration on intracellular accumulation of lipids and triacylglyceride in marine microalgae Dunaliella cells. J. Biosci. Bioeng. 101, 223-226.
Tao, L., Aden, A., 2009. The economics of current and future biofuels. In Vitro Cellular & Developmental Biology - Plant, 45 (3), 199-217.
CONCLUSIONS
128
Terry, K.L., Raymond, L.P., 1985. System design for the autotrophic production of microalgae. Enzyme and Microbial Technology, 7(10), 474-487.
Tesfatsion, L., 2002. Agent-based computational economics: growing economies from the bottom up. Artificial Life, 8(1), 55-82.
U.N. (United Nations), 1987. Report of the World Commission on Environment and Development. Our Common Future. Gro Harlem Brundtland Report.
U.S. DOE (United States Department of Energy), 2010. National Algal Biofuels Technology Roadmap. U.S. Department of Energy, Office of Energy Efficiency and Renewable Energy, Biomass Program.
U.S. EIA (United States Energy Information Administration), 2013. Annual Energy Outlook 2013 (AEO2013) .
U.S. EIA (United States Energy Information Administration), 2014. Monthly Energy Review. Available at: http://www.eia.gov/totalenergy/data/monthly/pdf/mer.pdf
U.S. EISA (Energy Independence and Security Act), 2007. Senate and House Representatives of the United States of America. Available at: http://www.gpo.gov/fdsys/pkg/BILLS-110hr6enr/pdf/BILLS-110hr6enr.pdf
U.S. EPA (United States Environmental Protection Agency), 2010. EPA Finalizes Regulations for the National Renewable Fuel Standard Program for 2010 and Beyond (EPA-420-F-10-007). Available at: http://www.epa.gov/otaq/renewablefuels/420f10007.pdf
U.S. EPA (United States Environmental Protection Agency), 2013. EPA Proposes 2014 Renewable Fuel Standards (EPA-420-F-13-048). Available at: http://www.epa.gov/otaq/fuels/renewablefuels/documents/420f13048.pdf
U.S. Senate Committee on Finance, 2012. Summary of the Family and Business Tax Cut Certainty Act of 2012 as Approved by the Finance Committee. Available at: http://www.finance.senate.gov/newsroom/chairman/release/?id=e3290a69-8fa4-4a6d-8c3a-756ea03a4224
Ugwu, C.U., Aoyagi, H., Uchiyama, H., 2008. Photobioreactors for mass cultivation of algae. Bioresource Technology 99 (10), 4021-4028.
UNESCO, 2014. Sustainable Development. Available at: http://www.unesco.org/new/en/education/themes/leading-the-international-agenda/education-for-sustainable-development/sustainable-development/
van Harmelen, T., Oonk, H., 2006. Microalgae Biofixation Processes: Application and Potential Contributions to Greenhouse Gas Mitigation Options. Appeldoorn, Netherlands: TNO Built Environment and Geosciences.
Vasudevan, V., Stratton, R.W., Pearlson, M.N., Beyene, A.G., Weissman, J.C., Rubino, M., Hileman, J.I., 2012. Environmental Performance of Algal Biofuel Technology Options. Environmental Science & Technology 46, 2451-2459.
Wang, M., 2009. GREET Version 1.8b.
Wang, M.Q., 2012. Renewable Diesel from Algal Lipids : An Integrated Baseline for Cost, Emissions, and Resource Potential from a Harmonized Model. Argonne and RNEL.
Wehnert, T., Araguas, J.P.L, Bernbardini, O., Jaworski, L., Jorgensen, B., Jorss, W., Nielsen, O., Ninni, A., Poplawska, A.O., Velte, D., 2007. European Energy Futures 2030, Springer.
Wehnert, T., Poplawska, A.O., Ninni, A., Velte, D., Jorgensen, B., 2004. EurEnDel, Technology and Social Visions for Europe’s Energy Future: a Europe-wide Delphi Study – Final Report.
CONCLUSIONS
129
Williams, P.J.L.B., Laurens, L.M.L., 2010. Microalgae as biodiesel & biomass feedstocks: Review & analysis of the biochemistry, energetics & economics. Energy & Environmental Science 3(5), 554.
Yanfen, L., Zehao, H., Xiaoqian, M., 2012. Energy analysis and environmental impacts of microalgal biodiesel in China. Energy Policy 45, 142-151.
Yang, J., Xu, M., Zhang, X., Hu, Q., Sommerfeld, M., Chen, Y., 2011. Life-cycle analysis on biodiesel production from microalgae: water footprint and nutrients balance. Bioresource technology, 102(1), 159-65.
Yang, Y., Bae, J., Kim, J., & Suh, S., 2012. Replacing gasoline with corn ethanol results in significant environmental problem-shifting. Environmental science & technology, 46(7), 3671-8.
Zaimes, G.G., Khanna, V., 2013. Microalgal biomass production pathways: evaluation of life cycle environmental impacts. Biotechnology for biofuels 6(1), 88.
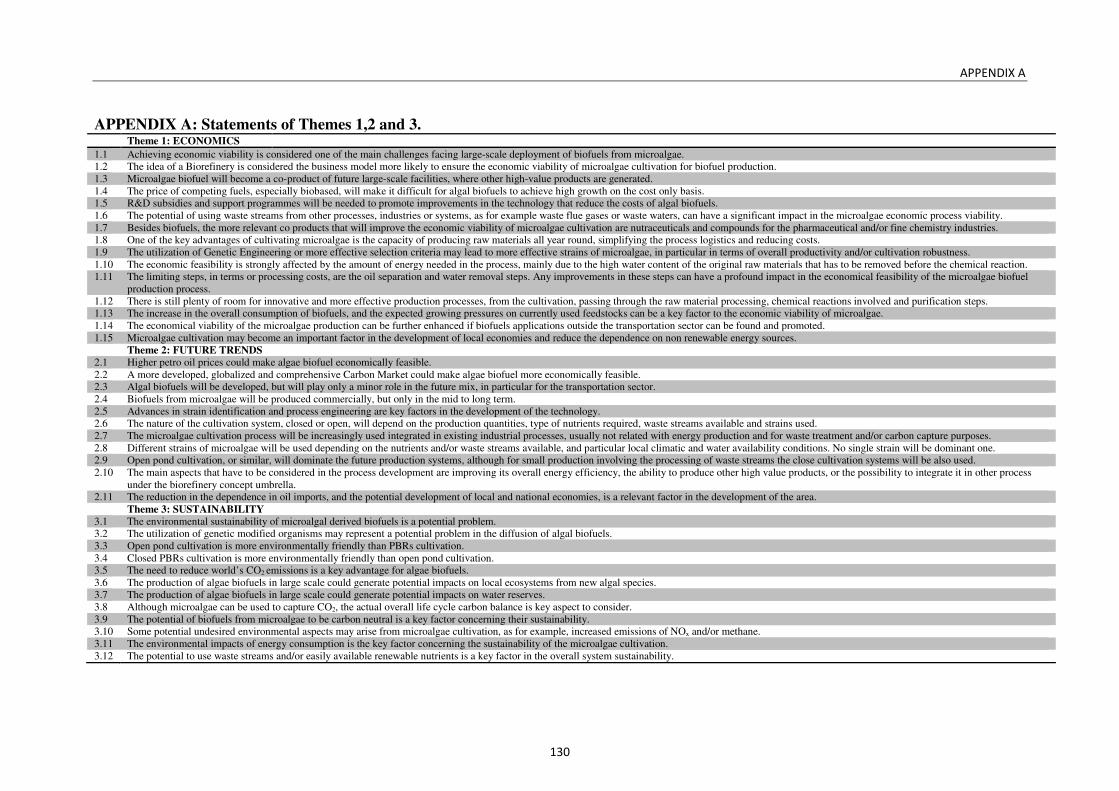
APPENDIX A
130
APPENDIX A: Statements of Themes 1,2 and 3. Theme 1: ECONOMICS
1.1 Achieving economic viability is considered one of the main challenges facing large-scale deployment of biofuels from microalgae. 1.2 The idea of a Biorefinery is considered the business model more likely to ensure the economic viability of microalgae cultivation for biofuel production. 1.3 Microalgae biofuel will become a co-product of future large-scale facilities, where other high-value products are generated. 1.4 The price of competing fuels, especially biobased, will make it difficult for algal biofuels to achieve high growth on the cost only basis. 1.5 R&D subsidies and support programmes will be needed to promote improvements in the technology that reduce the costs of algal biofuels. 1.6 The potential of using waste streams from other processes, industries or systems, as for example waste flue gases or waste waters, can have a significant impact in the microalgae economic process viability. 1.7 Besides biofuels, the more relevant co products that will improve the economic viability of microalgae cultivation are nutraceuticals and compounds for the pharmaceutical and/or fine chemistry industries. 1.8 One of the key advantages of cultivating microalgae is the capacity of producing raw materials all year round, simplifying the process logistics and reducing costs. 1.9 The utilization of Genetic Engineering or more effective selection criteria may lead to more effective strains of microalgae, in particular in terms of overall productivity and/or cultivation robustness. 1.10 The economic feasibility is strongly affected by the amount of energy needed in the process, mainly due to the high water content of the original raw materials that has to be removed before the chemical reaction. 1.11 The limiting steps, in terms or processing costs, are the oil separation and water removal steps. Any improvements in these steps can have a profound impact in the economical feasibility of the microalgae biofuel
production process. 1.12 There is still plenty of room for innovative and more effective production processes, from the cultivation, passing through the raw material processing, chemical reactions involved and purification steps. 1.13 The increase in the overall consumption of biofuels, and the expected growing pressures on currently used feedstocks can be a key factor to the economic viability of microalgae. 1.14 The economical viability of the microalgae production can be further enhanced if biofuels applications outside the transportation sector can be found and promoted. 1.15 Microalgae cultivation may become an important factor in the development of local economies and reduce the dependence on non renewable energy sources. Theme 2: FUTURE TRENDS 2.1 Higher petro oil prices could make algae biofuel economically feasible. 2.2 A more developed, globalized and comprehensive Carbon Market could make algae biofuel more economically feasible. 2.3 Algal biofuels will be developed, but will play only a minor role in the future mix, in particular for the transportation sector. 2.4 Biofuels from microalgae will be produced commercially, but only in the mid to long term. 2.5 Advances in strain identification and process engineering are key factors in the development of the technology. 2.6 The nature of the cultivation system, closed or open, will depend on the production quantities, type of nutrients required, waste streams available and strains used. 2.7 The microalgae cultivation process will be increasingly used integrated in existing industrial processes, usually not related with energy production and for waste treatment and/or carbon capture purposes. 2.8 Different strains of microalgae will be used depending on the nutrients and/or waste streams available, and particular local climatic and water availability conditions. No single strain will be dominant one. 2.9 Open pond cultivation, or similar, will dominate the future production systems, although for small production involving the processing of waste streams the close cultivation systems will be also used. 2.10 The main aspects that have to be considered in the process development are improving its overall energy efficiency, the ability to produce other high value products, or the possibility to integrate it in other process
under the biorefinery concept umbrella. 2.11 The reduction in the dependence in oil imports, and the potential development of local and national economies, is a relevant factor in the development of the area. Theme 3: SUSTAINABILITY 3.1 The environmental sustainability of microalgal derived biofuels is a potential problem. 3.2 The utilization of genetic modified organisms may represent a potential problem in the diffusion of algal biofuels. 3.3 Open pond cultivation is more environmentally friendly than PBRs cultivation. 3.4 Closed PBRs cultivation is more environmentally friendly than open pond cultivation. 3.5 The need to reduce world’s CO2 emissions is a key advantage for algae biofuels. 3.6 The production of algae biofuels in large scale could generate potential impacts on local ecosystems from new algal species. 3.7 The production of algae biofuels in large scale could generate potential impacts on water reserves. 3.8 Although microalgae can be used to capture CO2, the actual overall life cycle carbon balance is key aspect to consider. 3.9 The potential of biofuels from microalgae to be carbon neutral is a key factor concerning their sustainability. 3.10 Some potential undesired environmental aspects may arise from microalgae cultivation, as for example, increased emissions of NOx and/or methane. 3.11 The environmental impacts of energy consumption is the key factor concerning the sustainability of the microalgae cultivation. 3.12 The potential to use waste streams and/or easily available renewable nutrients is a key factor in the overall system sustainability.
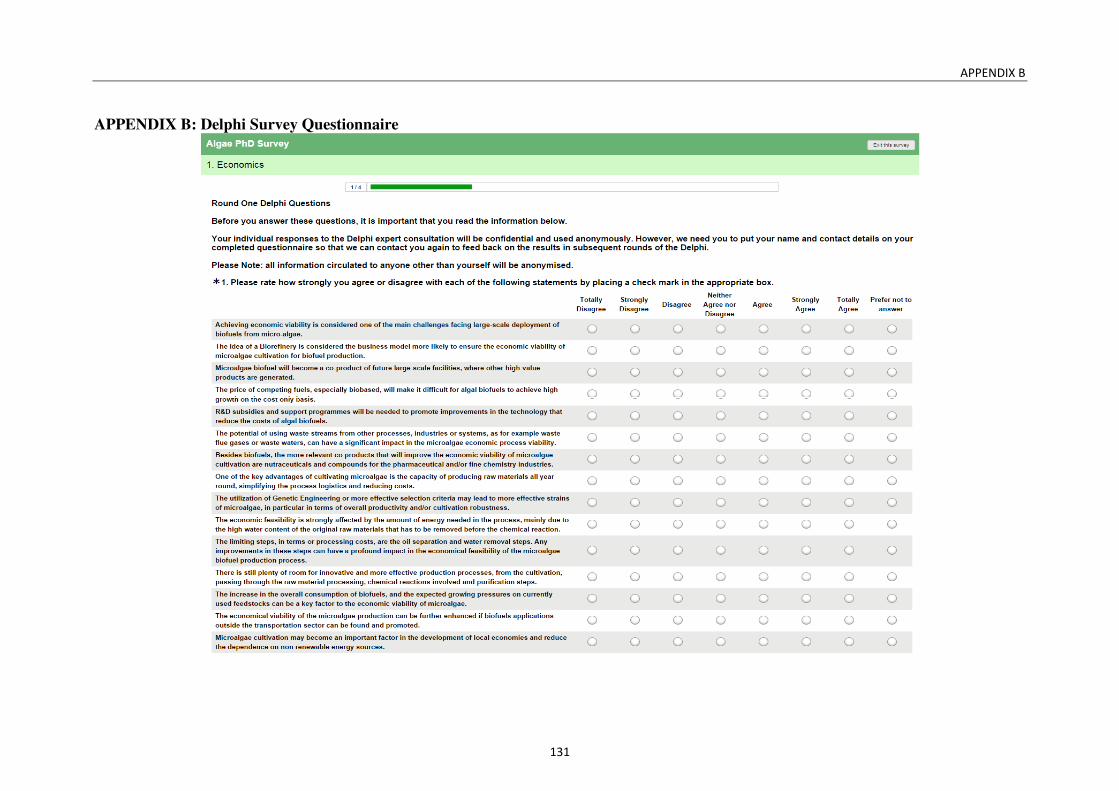
APPENDIX B
131
APPENDIX B: Delphi Survey Questionnaire

APPENDIX B
132
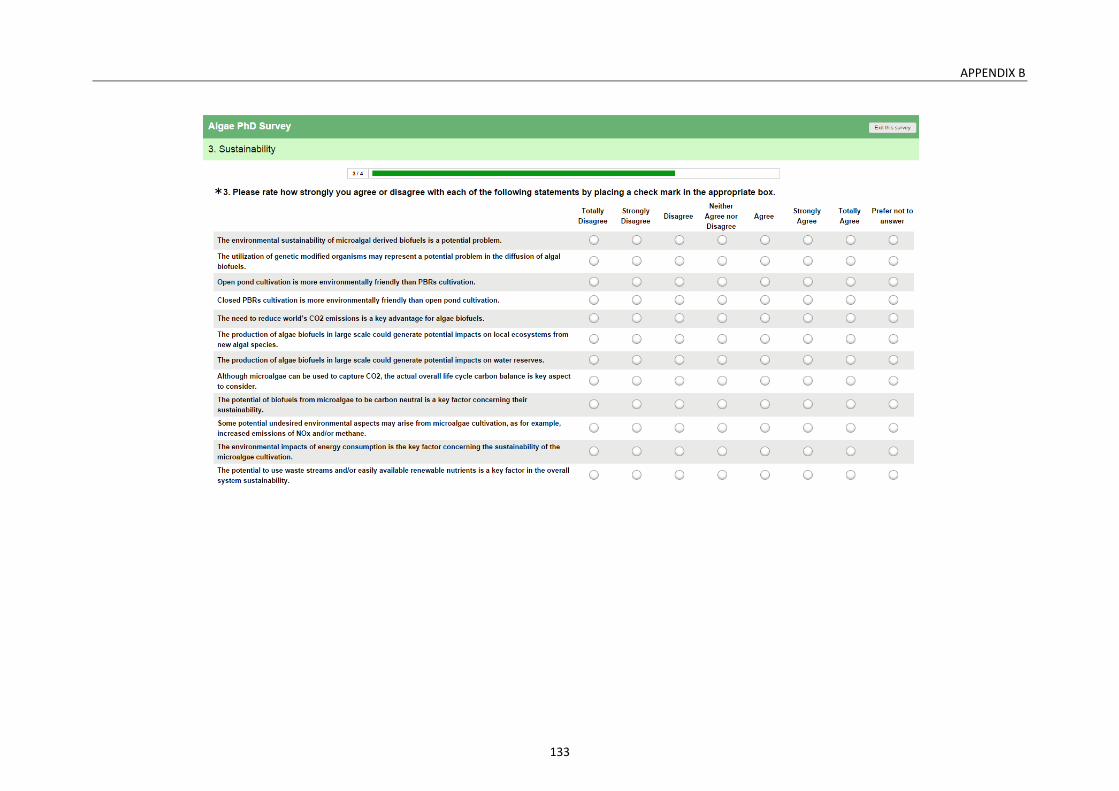
APPENDIX B
133

APPENDIX B
134
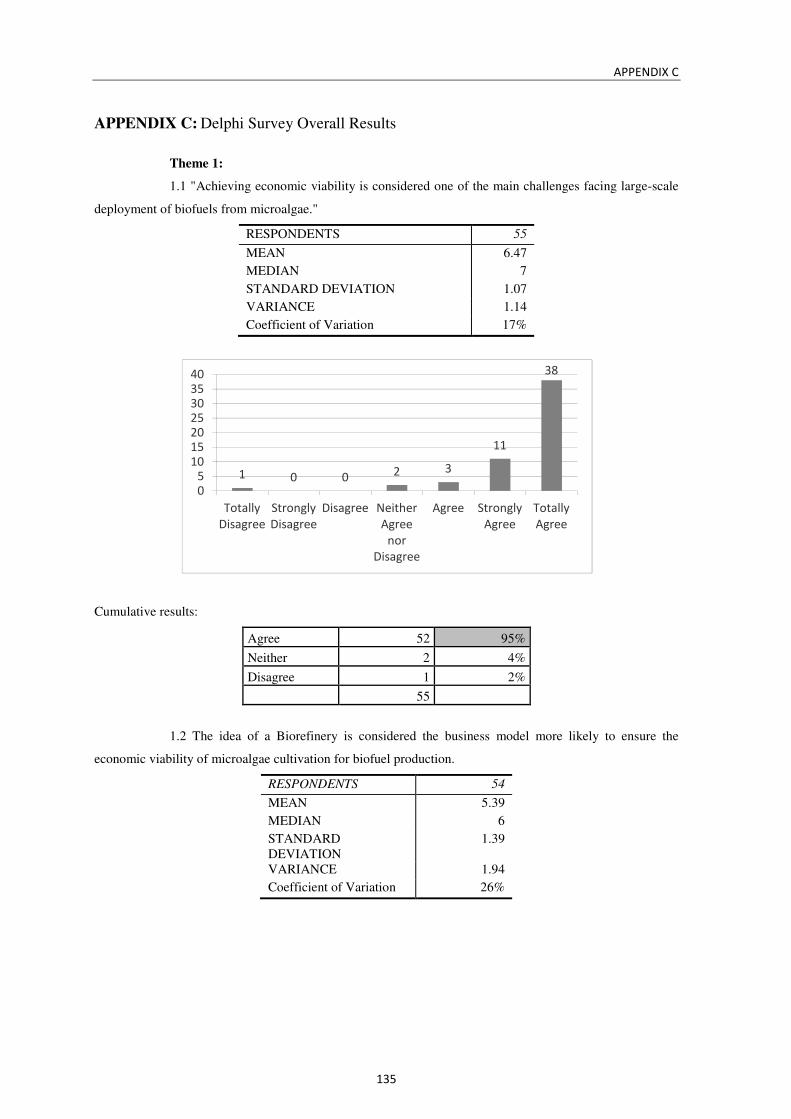
APPENDIX C
135
APPENDIX C: Delphi Survey Overall Results
Theme 1:
1.1 "Achieving economic viability is considered one of the main challenges facing large-scale
deployment of biofuels from microalgae."
RESPONDENTS 55
MEAN 6.47
MEDIAN 7
STANDARD DEVIATION 1.07
VARIANCE 1.14
Coefficient of Variation 17%
Cumulative results:
Agree 52 95%
Neither 2 4%
Disagree 1 2%
55
1.2 The idea of a Biorefinery is considered the business model more likely to ensure the
economic viability of microalgae cultivation for biofuel production.
RESPONDENTS 54
MEAN 5.39
MEDIAN 6
STANDARD DEVIATION
1.39
VARIANCE 1.94
Coefficient of Variation 26%
1 0 0 2 3
11
38
05
10152025303540
Totally
Disagree
Strongly
Disagree
Disagree Neither
Agree
nor
Disagree
Agree Strongly
Agree
Totally
Agree
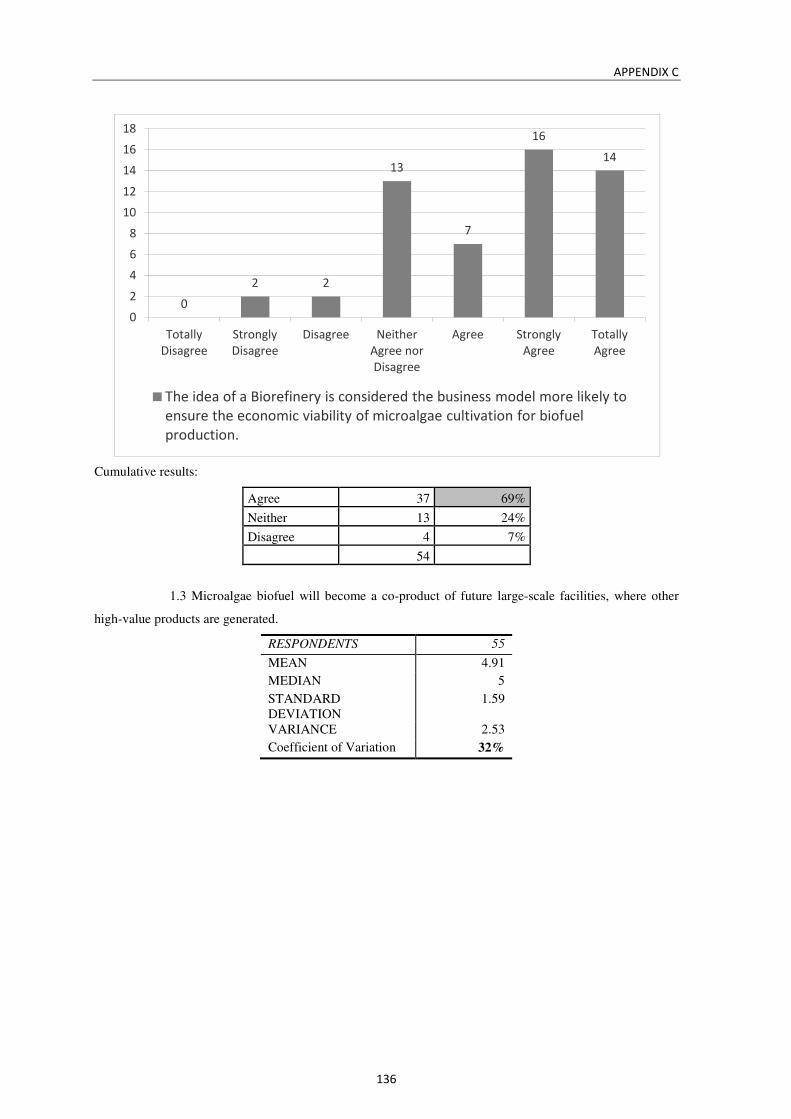
APPENDIX C
136
Cumulative results:
Agree 37 69%
Neither 13 24%
Disagree 4 7%
54
1.3 Microalgae biofuel will become a co-product of future large-scale facilities, where other
high-value products are generated.
RESPONDENTS 55
MEAN 4.91
MEDIAN 5
STANDARD DEVIATION
1.59
VARIANCE 2.53
Coefficient of Variation 32%
0
2 2
13
7
16
14
0
2
4
6
8
10
12
14
16
18
Totally
Disagree
Strongly
Disagree
Disagree Neither
Agree nor
Disagree
Agree Strongly
Agree
Totally
Agree
The idea of a Biorefinery is considered the business model more likely to
ensure the economic viability of microalgae cultivation for biofuel
production.
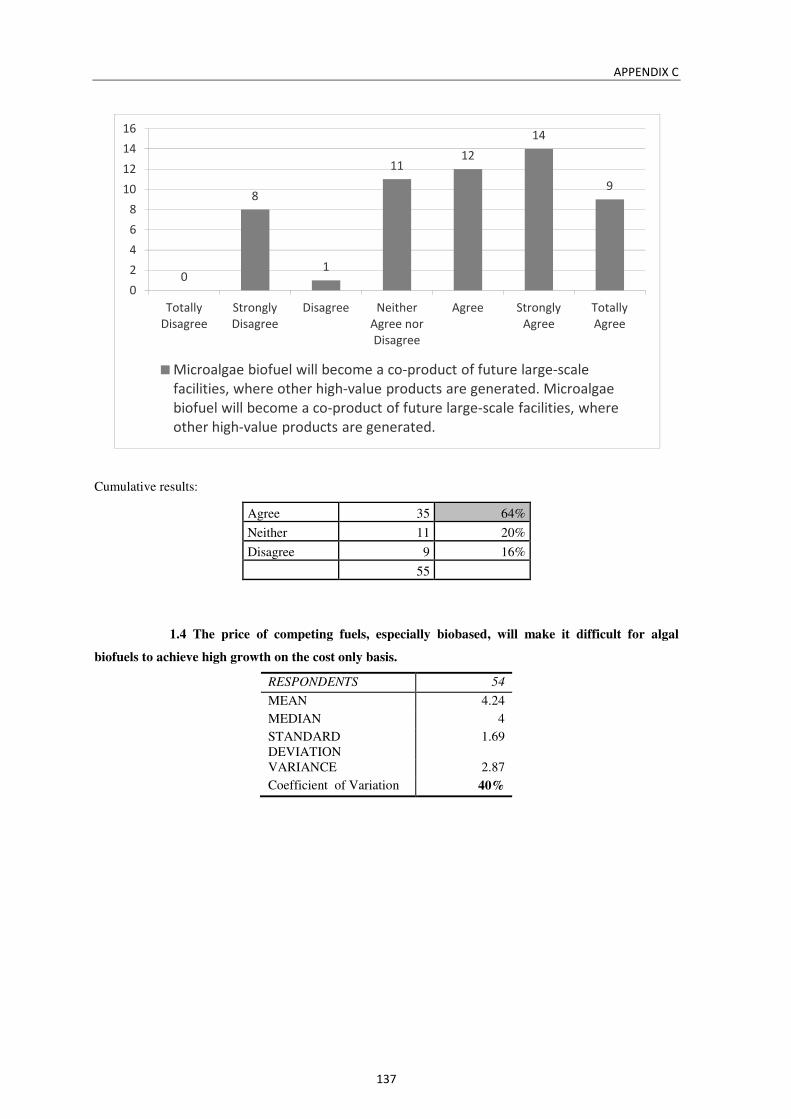
APPENDIX C
137
Cumulative results:
Agree 35 64%
Neither 11 20%
Disagree 9 16%
55
1.4 The price of competing fuels, especially biobased, will make it difficult for algal
biofuels to achieve high growth on the cost only basis.
RESPONDENTS 54
MEAN 4.24
MEDIAN 4
STANDARD DEVIATION
1.69
VARIANCE 2.87
Coefficient of Variation 40%
0
8
1
1112
14
9
0
2
4
6
8
10
12
14
16
Totally
Disagree
Strongly
Disagree
Disagree Neither
Agree nor
Disagree
Agree Strongly
Agree
Totally
Agree
Microalgae biofuel will become a co-product of future large-scale
facilities, where other high-value products are generated. Microalgae
biofuel will become a co-product of future large-scale facilities, where
other high-value products are generated.
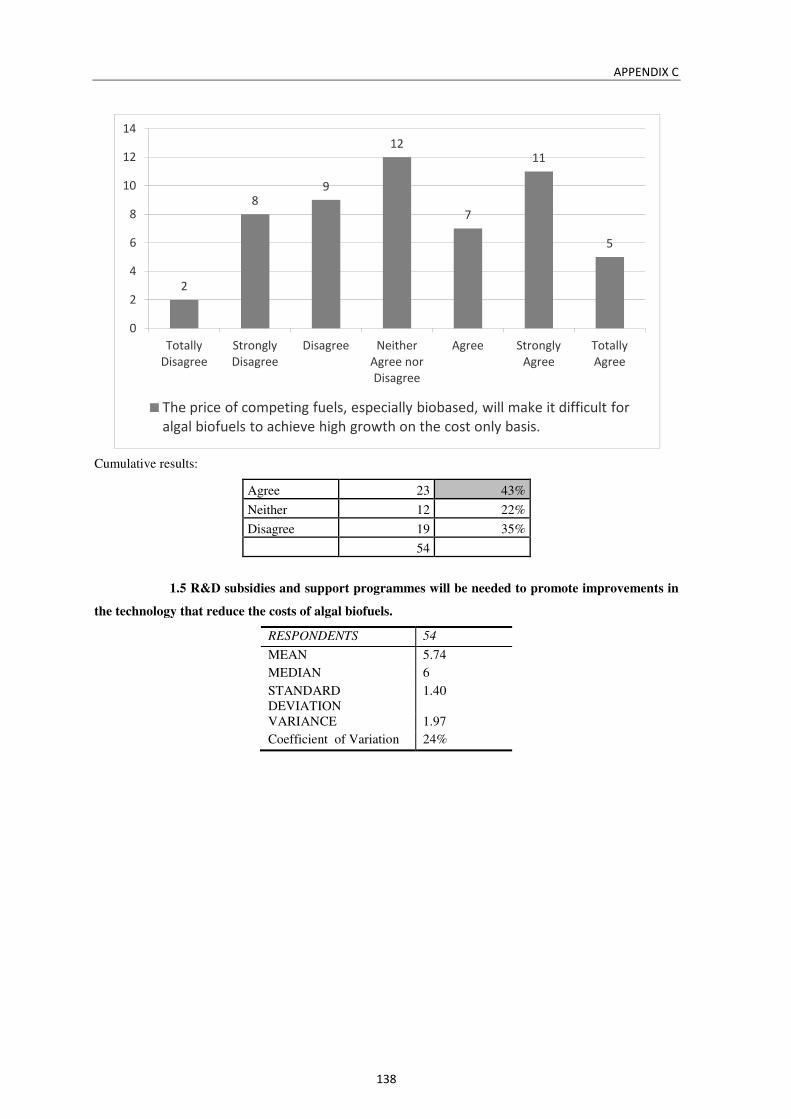
APPENDIX C
138
Cumulative results:
Agree 23 43%
Neither 12 22%
Disagree 19 35%
54
1.5 R&D subsidies and support programmes will be needed to promote improvements in
the technology that reduce the costs of algal biofuels.
RESPONDENTS 54
MEAN 5.74
MEDIAN 6
STANDARD DEVIATION
1.40
VARIANCE 1.97
Coefficient of Variation 24%
2
89
12
7
11
5
0
2
4
6
8
10
12
14
Totally
Disagree
Strongly
Disagree
Disagree Neither
Agree nor
Disagree
Agree Strongly
Agree
Totally
Agree
The price of competing fuels, especially biobased, will make it difficult for
algal biofuels to achieve high growth on the cost only basis.
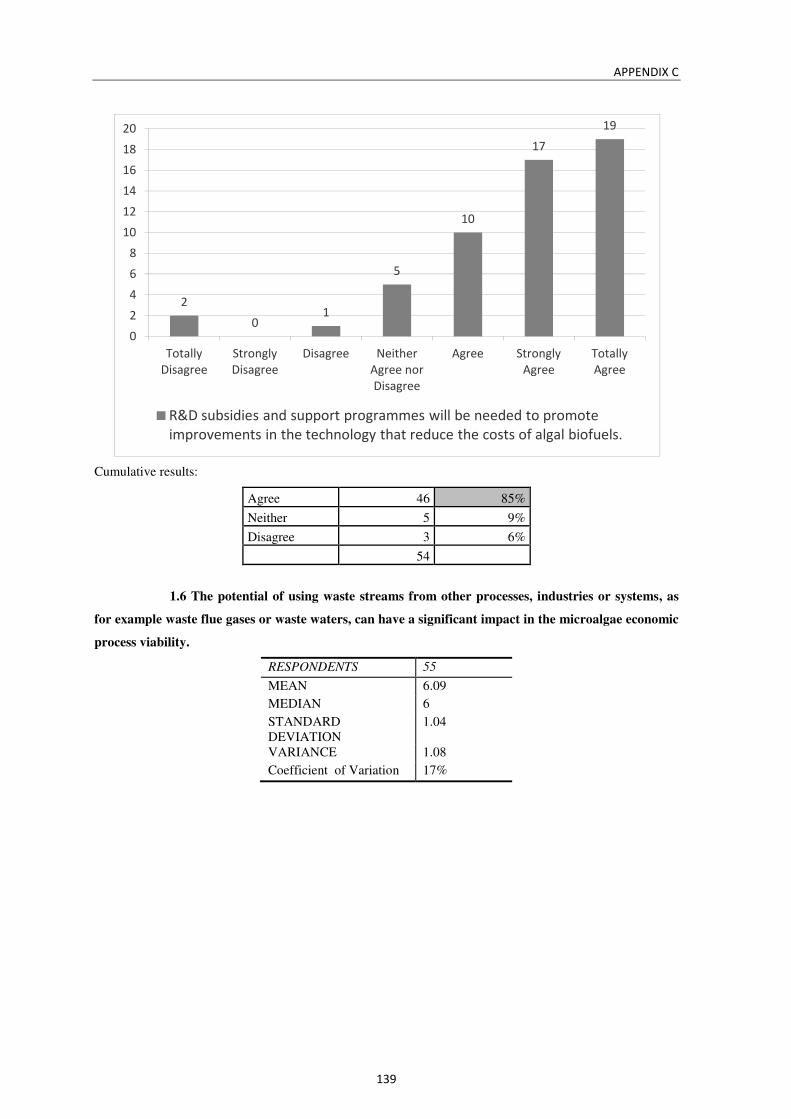
APPENDIX C
139
Cumulative results:
Agree 46 85%
Neither 5 9%
Disagree 3 6%
54
1.6 The potential of using waste streams from other processes, industries or systems, as
for example waste flue gases or waste waters, can have a significant impact in the microalgae economic
process viability.
RESPONDENTS 55
MEAN 6.09
MEDIAN 6
STANDARD DEVIATION
1.04
VARIANCE 1.08
Coefficient of Variation 17%
2
01
5
10
17
19
0
2
4
6
8
10
12
14
16
18
20
Totally
Disagree
Strongly
Disagree
Disagree Neither
Agree nor
Disagree
Agree Strongly
Agree
Totally
Agree
R&D subsidies and support programmes will be needed to promote
improvements in the technology that reduce the costs of algal biofuels.
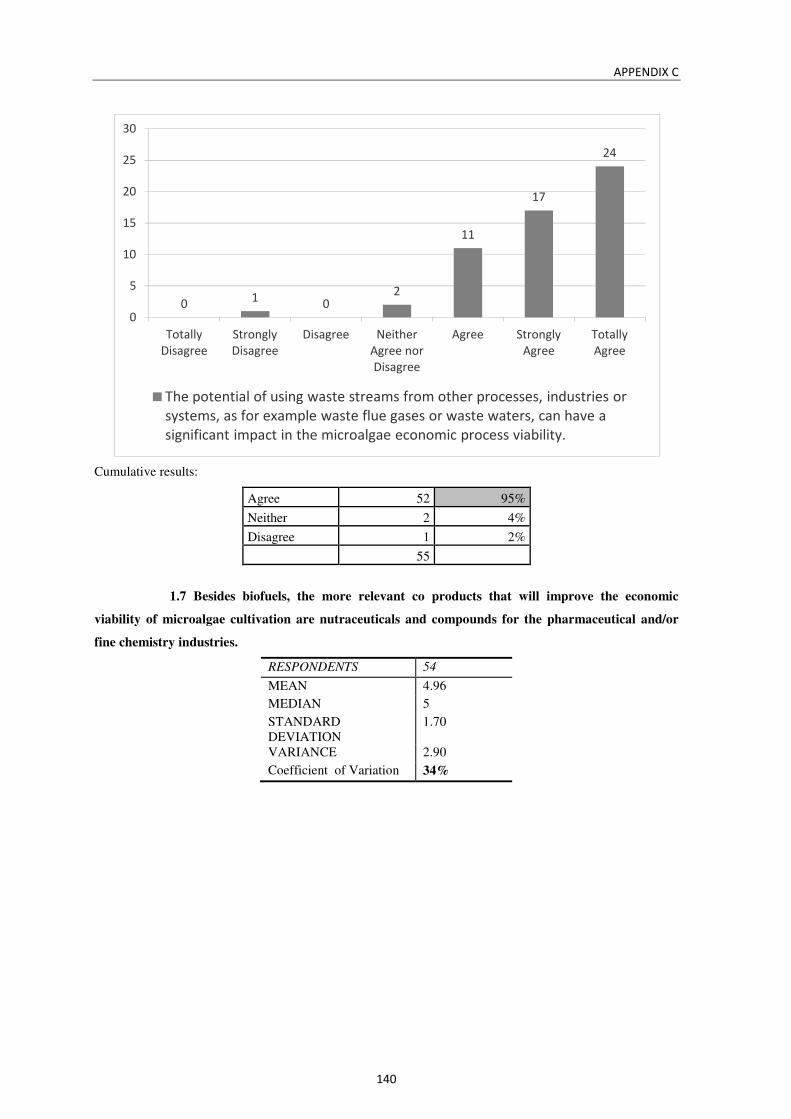
APPENDIX C
140
Cumulative results:
Agree 52 95%
Neither 2 4%
Disagree 1 2%
55
1.7 Besides biofuels, the more relevant co products that will improve the economic
viability of microalgae cultivation are nutraceuticals and compounds for the pharmaceutical and/or
fine chemistry industries.
RESPONDENTS 54
MEAN 4.96
MEDIAN 5
STANDARD DEVIATION
1.70
VARIANCE 2.90
Coefficient of Variation 34%
01
02
11
17
24
0
5
10
15
20
25
30
Totally
Disagree
Strongly
Disagree
Disagree Neither
Agree nor
Disagree
Agree Strongly
Agree
Totally
Agree
The potential of using waste streams from other processes, industries or
systems, as for example waste flue gases or waste waters, can have a
significant impact in the microalgae economic process viability.
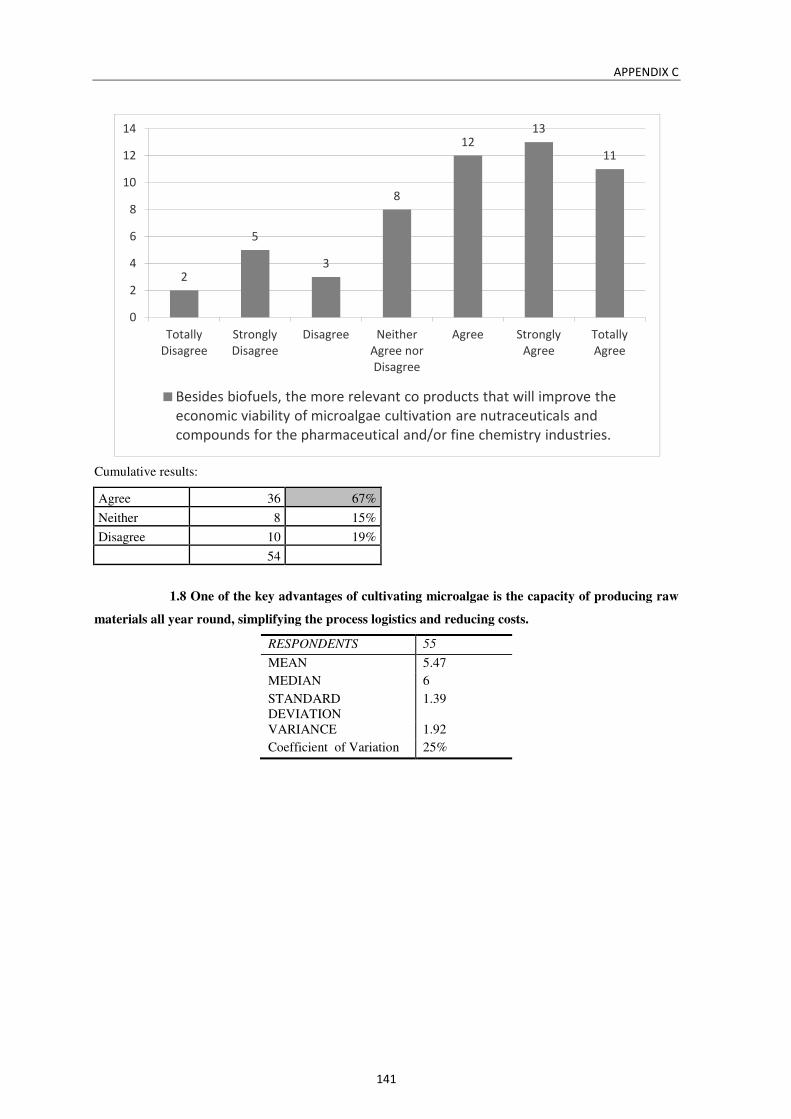
APPENDIX C
141
Cumulative results:
Agree 36 67%
Neither 8 15%
Disagree 10 19%
54
1.8 One of the key advantages of cultivating microalgae is the capacity of producing raw
materials all year round, simplifying the process logistics and reducing costs.
RESPONDENTS 55
MEAN 5.47
MEDIAN 6
STANDARD DEVIATION
1.39
VARIANCE 1.92
Coefficient of Variation 25%
2
5
3
8
1213
11
0
2
4
6
8
10
12
14
Totally
Disagree
Strongly
Disagree
Disagree Neither
Agree nor
Disagree
Agree Strongly
Agree
Totally
Agree
Besides biofuels, the more relevant co products that will improve the
economic viability of microalgae cultivation are nutraceuticals and
compounds for the pharmaceutical and/or fine chemistry industries.
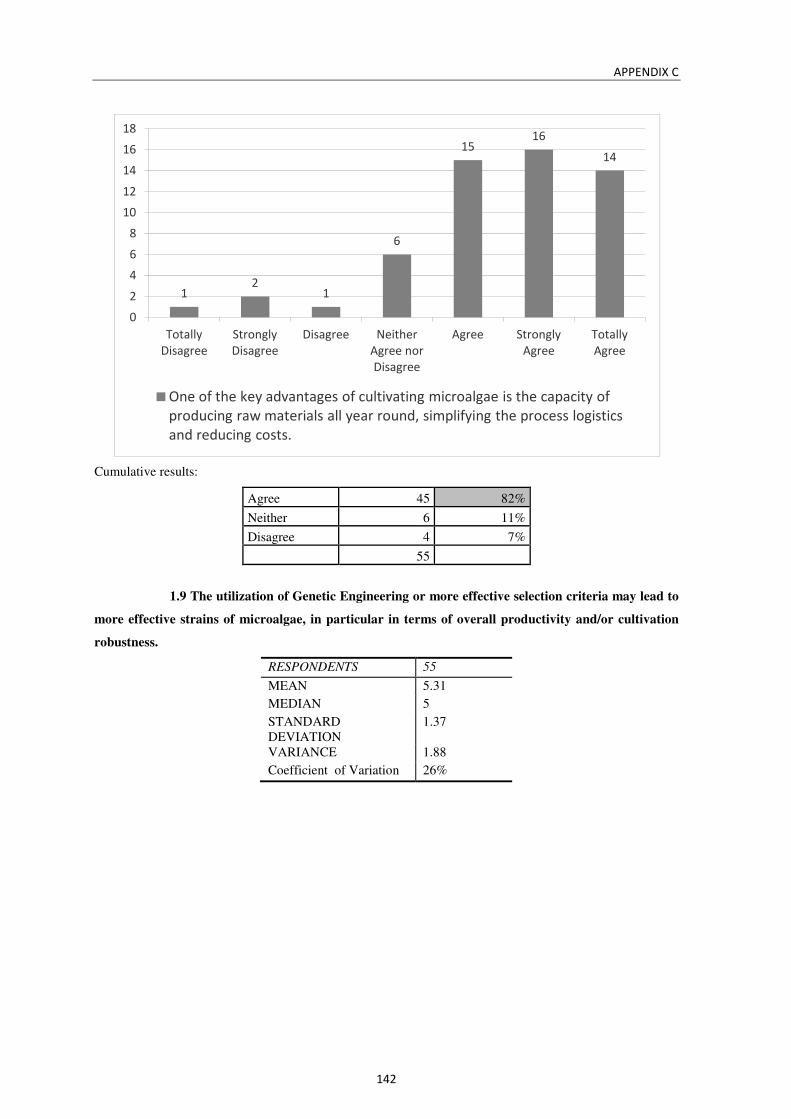
APPENDIX C
142
Cumulative results:
Agree 45 82%
Neither 6 11%
Disagree 4 7%
55
1.9 The utilization of Genetic Engineering or more effective selection criteria may lead to
more effective strains of microalgae, in particular in terms of overall productivity and/or cultivation
robustness.
RESPONDENTS 55
MEAN 5.31
MEDIAN 5
STANDARD DEVIATION
1.37
VARIANCE 1.88
Coefficient of Variation 26%
12
1
6
1516
14
0
2
4
6
8
10
12
14
16
18
Totally
Disagree
Strongly
Disagree
Disagree Neither
Agree nor
Disagree
Agree Strongly
Agree
Totally
Agree
One of the key advantages of cultivating microalgae is the capacity of
producing raw materials all year round, simplifying the process logistics
and reducing costs.
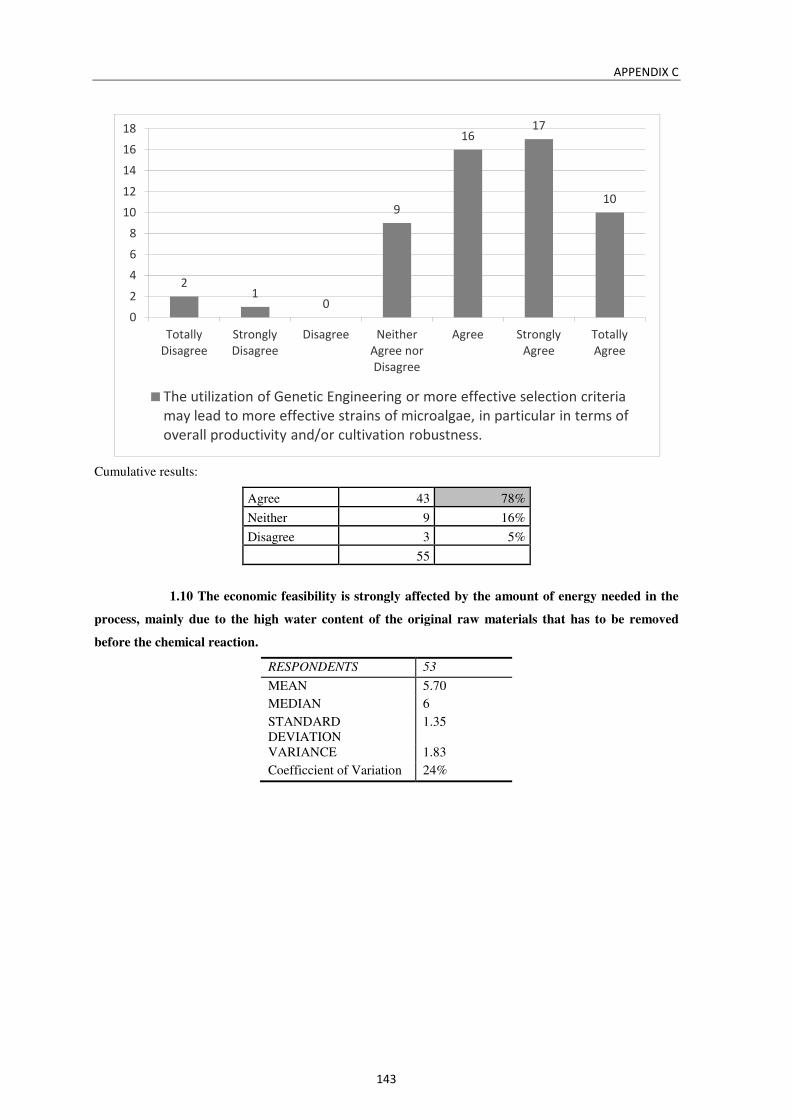
APPENDIX C
143
Cumulative results:
Agree 43 78%
Neither 9 16%
Disagree 3 5%
55
1.10 The economic feasibility is strongly affected by the amount of energy needed in the
process, mainly due to the high water content of the original raw materials that has to be removed
before the chemical reaction.
RESPONDENTS 53
MEAN 5.70
MEDIAN 6
STANDARD DEVIATION
1.35
VARIANCE 1.83
Coefficcient of Variation 24%
21
0
9
1617
10
0
2
4
6
8
10
12
14
16
18
Totally
Disagree
Strongly
Disagree
Disagree Neither
Agree nor
Disagree
Agree Strongly
Agree
Totally
Agree
The utilization of Genetic Engineering or more effective selection criteria
may lead to more effective strains of microalgae, in particular in terms of
overall productivity and/or cultivation robustness.
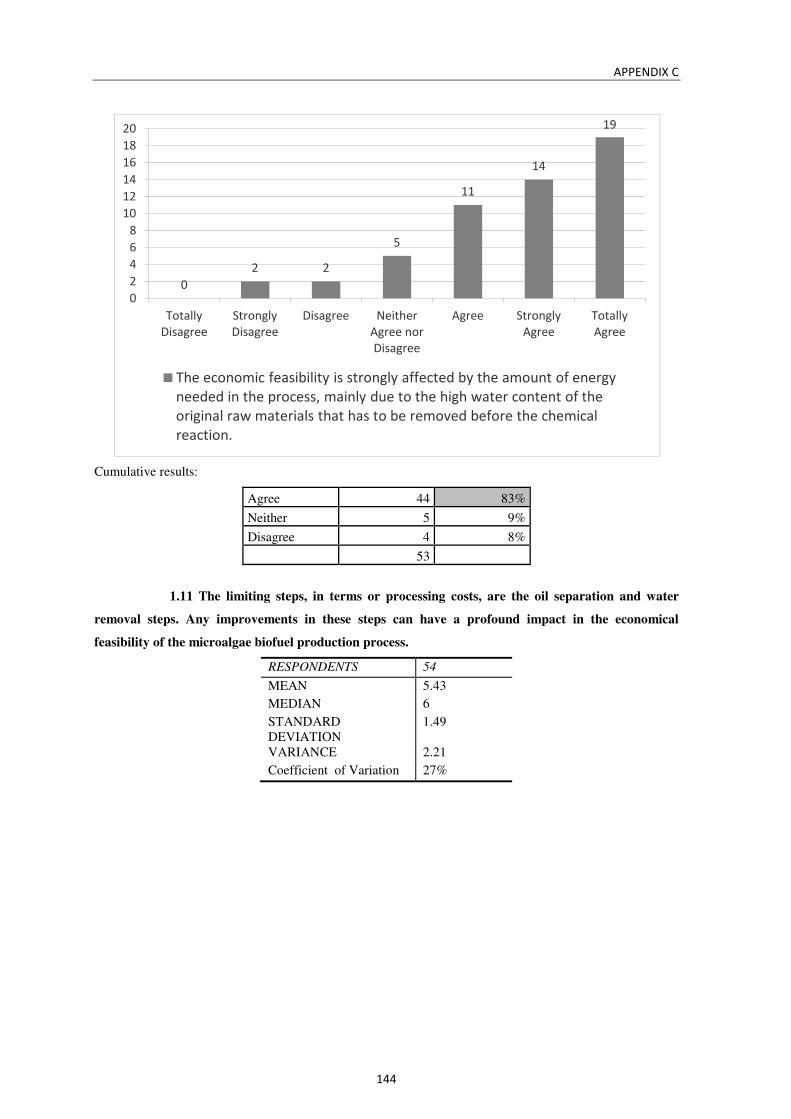
APPENDIX C
144
Cumulative results:
Agree 44 83%
Neither 5 9%
Disagree 4 8%
53
1.11 The limiting steps, in terms or processing costs, are the oil separation and water
removal steps. Any improvements in these steps can have a profound impact in the economical
feasibility of the microalgae biofuel production process.
RESPONDENTS 54
MEAN 5.43
MEDIAN 6
STANDARD DEVIATION
1.49
VARIANCE 2.21
Coefficient of Variation 27%
0
2 2
5
11
14
19
0
2
4
6
8
10
12
14
16
18
20
Totally
Disagree
Strongly
Disagree
Disagree Neither
Agree nor
Disagree
Agree Strongly
Agree
Totally
Agree
The economic feasibility is strongly affected by the amount of energy
needed in the process, mainly due to the high water content of the
original raw materials that has to be removed before the chemical
reaction.

APPENDIX C
145
Cumulative results:
Agree 43 80%
Neither 4 7%
Disagree 7 13%
54
1.12 There is still plenty of room for innovative and more effective production processes,
from the cultivation, passing through the raw material processing, chemical reactions involved and
purification steps.
RESPONDENTS 52
MEAN 6.29
MEDIAN 7
STANDARD DEVIATION
1.00
VARIANCE 0.99
Coefficient of Variation 16%
12
4 4
12
17
14
0
2
4
6
8
10
12
14
16
18
Totally
Disagree
Strongly
Disagree
Disagree Neither
Agree nor
Disagree
Agree Strongly
Agree
Totally
Agree
The limiting steps, in terms or processing costs, are the oil separation and
water removal steps. Any improvements in these steps can have a
profound impact in the economical feasibility of the microalgae biofuel
production process.
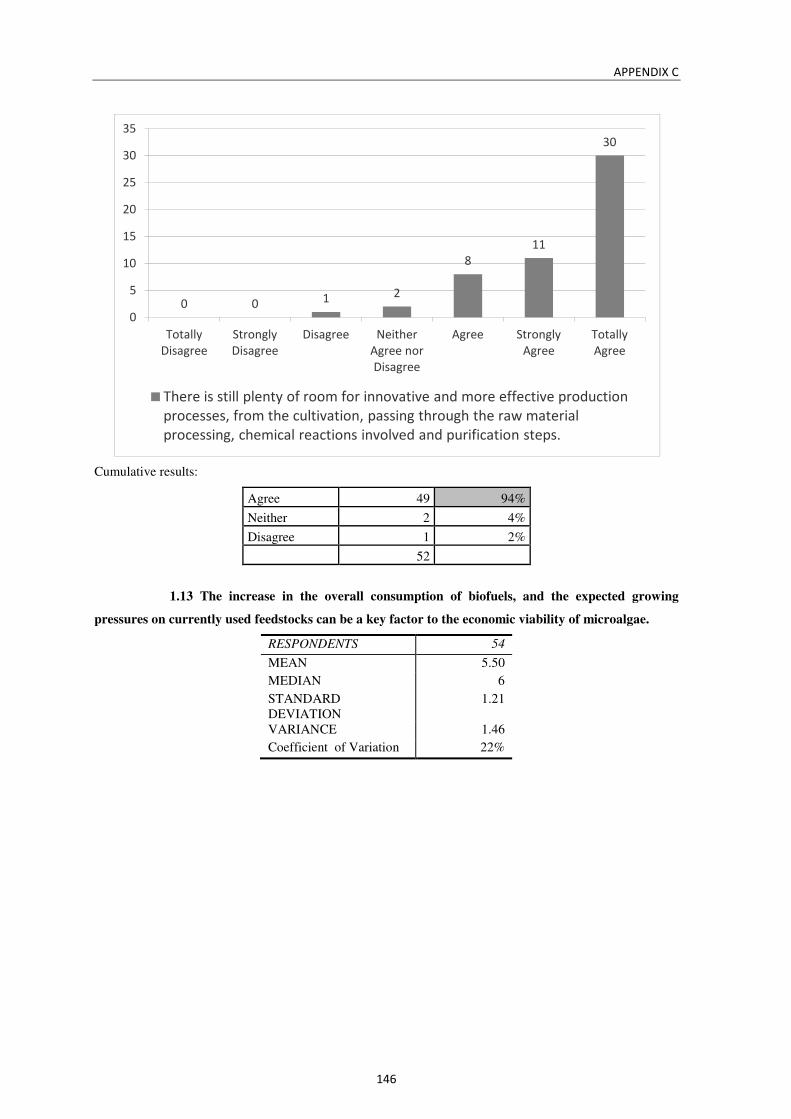
APPENDIX C
146
Cumulative results:
Agree 49 94%
Neither 2 4%
Disagree 1 2%
52
1.13 The increase in the overall consumption of biofuels, and the expected growing
pressures on currently used feedstocks can be a key factor to the economic viability of microalgae.
RESPONDENTS 54
MEAN 5.50
MEDIAN 6
STANDARD DEVIATION
1.21
VARIANCE 1.46
Coefficient of Variation 22%
0 0 1 2
8
11
30
0
5
10
15
20
25
30
35
Totally
Disagree
Strongly
Disagree
Disagree Neither
Agree nor
Disagree
Agree Strongly
Agree
Totally
Agree
There is still plenty of room for innovative and more effective production
processes, from the cultivation, passing through the raw material
processing, chemical reactions involved and purification steps.

APPENDIX C
147
Cumulative results:
Agree 45 83%
Neither 5 9%
Disagree 4 7%
54
1.14 The economical viability of the microalgae production can be further enhanced if
biofuels applications outside the transportation sector can be found and promoted.
RESPONDENTS 53
MEAN 5.28
MEDIAN 6
STANDARD DEVIATION
1.47
VARIANCE 2.17
Coefficient of Variation 28%
01
3
5
1617
12
0
2
4
6
8
10
12
14
16
18
Totally
Disagree
Strongly
Disagree
Disagree Neither
Agree nor
Disagree
Agree Strongly
Agree
Totally
Agree
The increase in the overall consumption of biofuels, and the expected
growing pressures on currently used feedstocks can be a key factor to the
economic viability of microalgae.
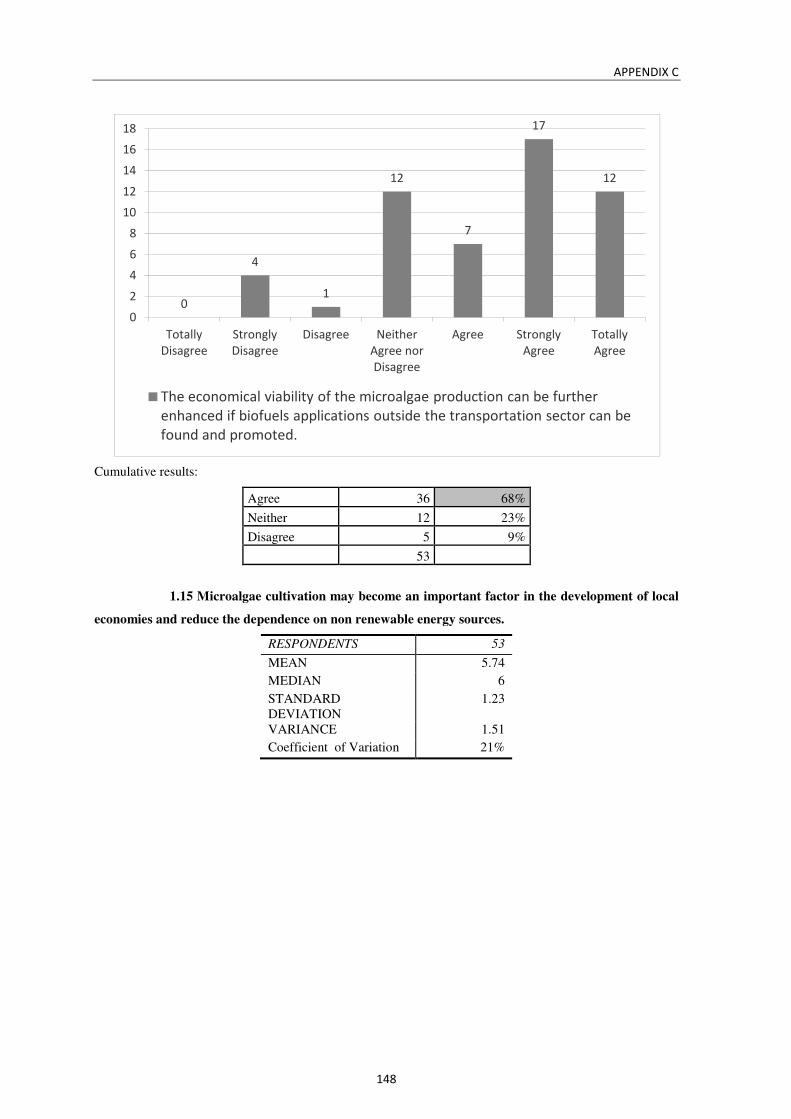
APPENDIX C
148
Cumulative results:
Agree 36 68%
Neither 12 23%
Disagree 5 9%
53
1.15 Microalgae cultivation may become an important factor in the development of local
economies and reduce the dependence on non renewable energy sources.
RESPONDENTS 53
MEAN 5.74
MEDIAN 6
STANDARD DEVIATION
1.23
VARIANCE 1.51
Coefficient of Variation 21%
0
4
1
12
7
17
12
0
2
4
6
8
10
12
14
16
18
Totally
Disagree
Strongly
Disagree
Disagree Neither
Agree nor
Disagree
Agree Strongly
Agree
Totally
Agree
The economical viability of the microalgae production can be further
enhanced if biofuels applications outside the transportation sector can be
found and promoted.
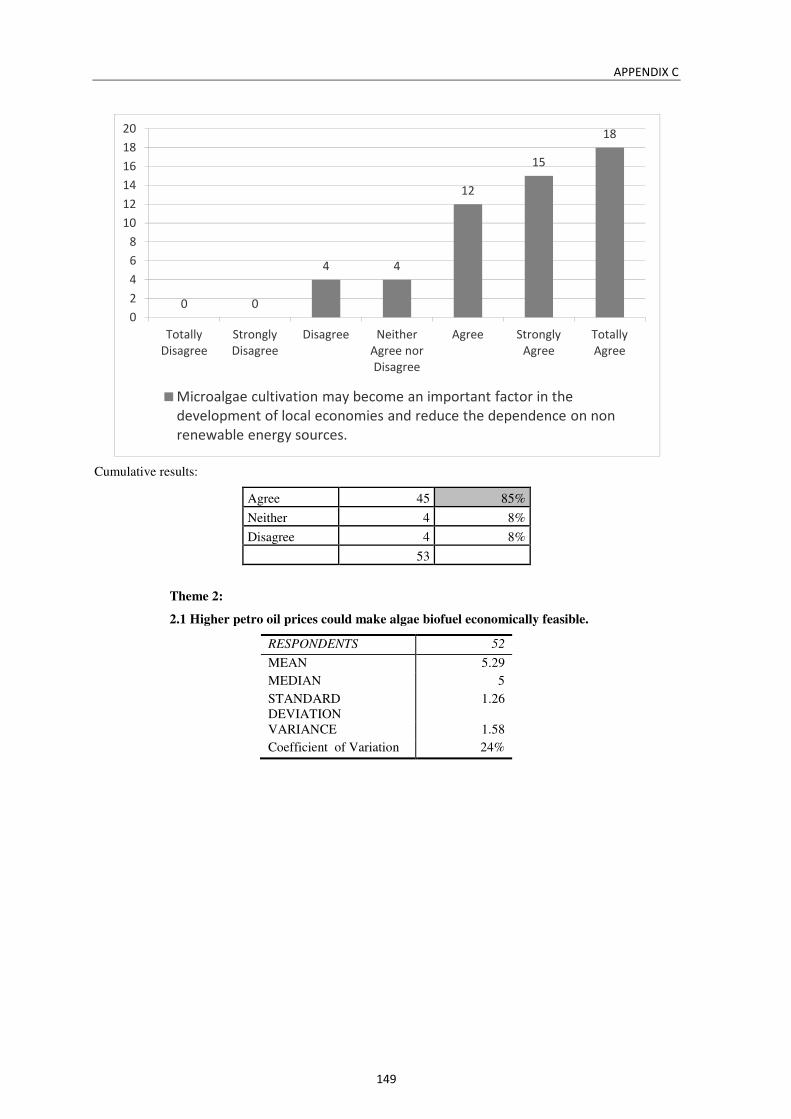
APPENDIX C
149
Cumulative results:
Agree 45 85%
Neither 4 8%
Disagree 4 8%
53
Theme 2:
2.1 Higher petro oil prices could make algae biofuel economically feasible.
RESPONDENTS 52
MEAN 5.29
MEDIAN 5
STANDARD DEVIATION
1.26
VARIANCE 1.58
Coefficient of Variation 24%
0 0
4 4
12
15
18
0
2
4
6
8
10
12
14
16
18
20
Totally
Disagree
Strongly
Disagree
Disagree Neither
Agree nor
Disagree
Agree Strongly
Agree
Totally
Agree
Microalgae cultivation may become an important factor in the
development of local economies and reduce the dependence on non
renewable energy sources.

APPENDIX C
150
Cumulative results:
Agree 41 79%
Neither 8 15%
Disagree 3 6%
52
2.2 A more developed, globalized and comprehensive Carbon Market could make algae
biofuel more economically feasible.
RESPONDENTS 52
MEAN 4.96
MEDIAN 5
STANDARD DEVIATION
1.44
VARIANCE 2.08
Coefficient of Variation 29%
0
3
0
8
18
14
9
0
2
4
6
8
10
12
14
16
18
20
Totally
Disagree
Strongly
Disagree
Disagree Neither
Agree nor
Disagree
Agree Strongly
Agree
Totally
Agree
Higher petro oil prices could make algae biofuel economically feasible.
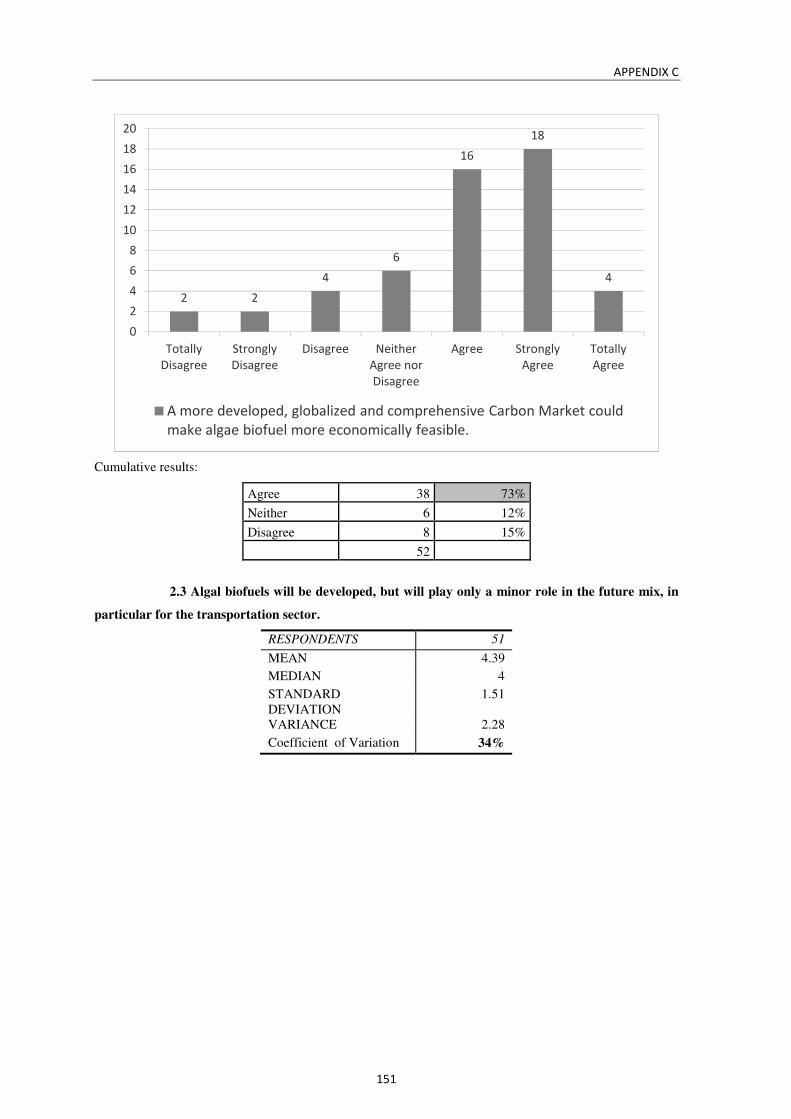
APPENDIX C
151
Cumulative results:
Agree 38 73%
Neither 6 12%
Disagree 8 15%
52
2.3 Algal biofuels will be developed, but will play only a minor role in the future mix, in
particular for the transportation sector.
RESPONDENTS 51
MEAN 4.39
MEDIAN 4
STANDARD DEVIATION
1.51
VARIANCE 2.28
Coefficient of Variation 34%
2 2
4
6
16
18
4
0
2
4
6
8
10
12
14
16
18
20
Totally
Disagree
Strongly
Disagree
Disagree Neither
Agree nor
Disagree
Agree Strongly
Agree
Totally
Agree
A more developed, globalized and comprehensive Carbon Market could
make algae biofuel more economically feasible.
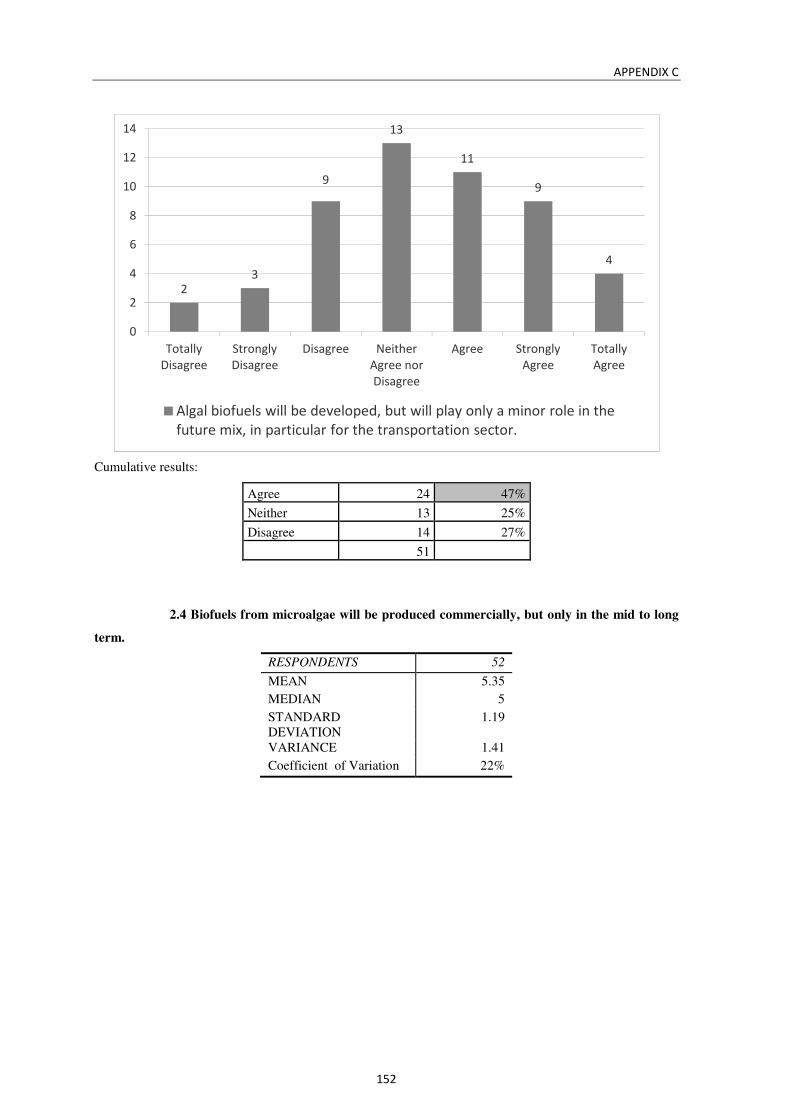
APPENDIX C
152
Cumulative results:
Agree 24 47%
Neither 13 25%
Disagree 14 27%
51
2.4 Biofuels from microalgae will be produced commercially, but only in the mid to long
term.
RESPONDENTS 52
MEAN 5.35
MEDIAN 5
STANDARD DEVIATION
1.19
VARIANCE 1.41
Coefficient of Variation 22%
23
9
13
11
9
4
0
2
4
6
8
10
12
14
Totally
Disagree
Strongly
Disagree
Disagree Neither
Agree nor
Disagree
Agree Strongly
Agree
Totally
Agree
Algal biofuels will be developed, but will play only a minor role in the
future mix, in particular for the transportation sector.
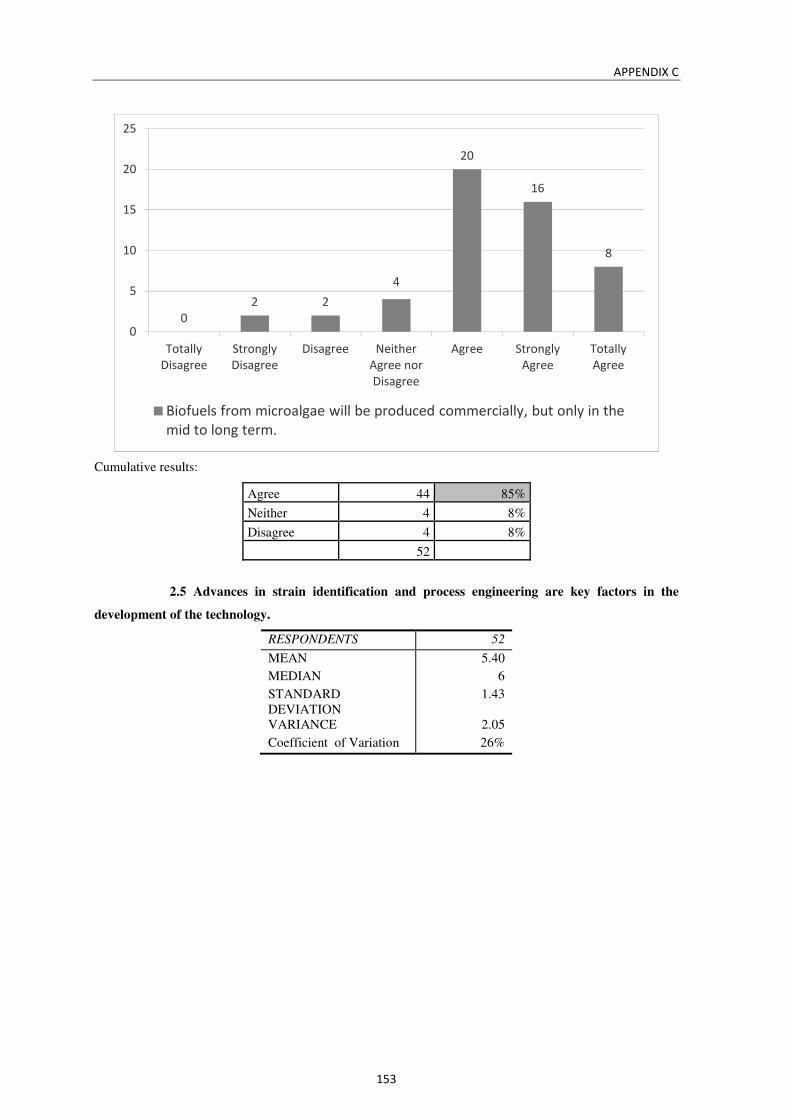
APPENDIX C
153
Cumulative results:
Agree 44 85%
Neither 4 8%
Disagree 4 8%
52
2.5 Advances in strain identification and process engineering are key factors in the
development of the technology.
RESPONDENTS 52
MEAN 5.40
MEDIAN 6
STANDARD DEVIATION
1.43
VARIANCE 2.05
Coefficient of Variation 26%
0
2 2
4
20
16
8
0
5
10
15
20
25
Totally
Disagree
Strongly
Disagree
Disagree Neither
Agree nor
Disagree
Agree Strongly
Agree
Totally
Agree
Biofuels from microalgae will be produced commercially, but only in the
mid to long term.
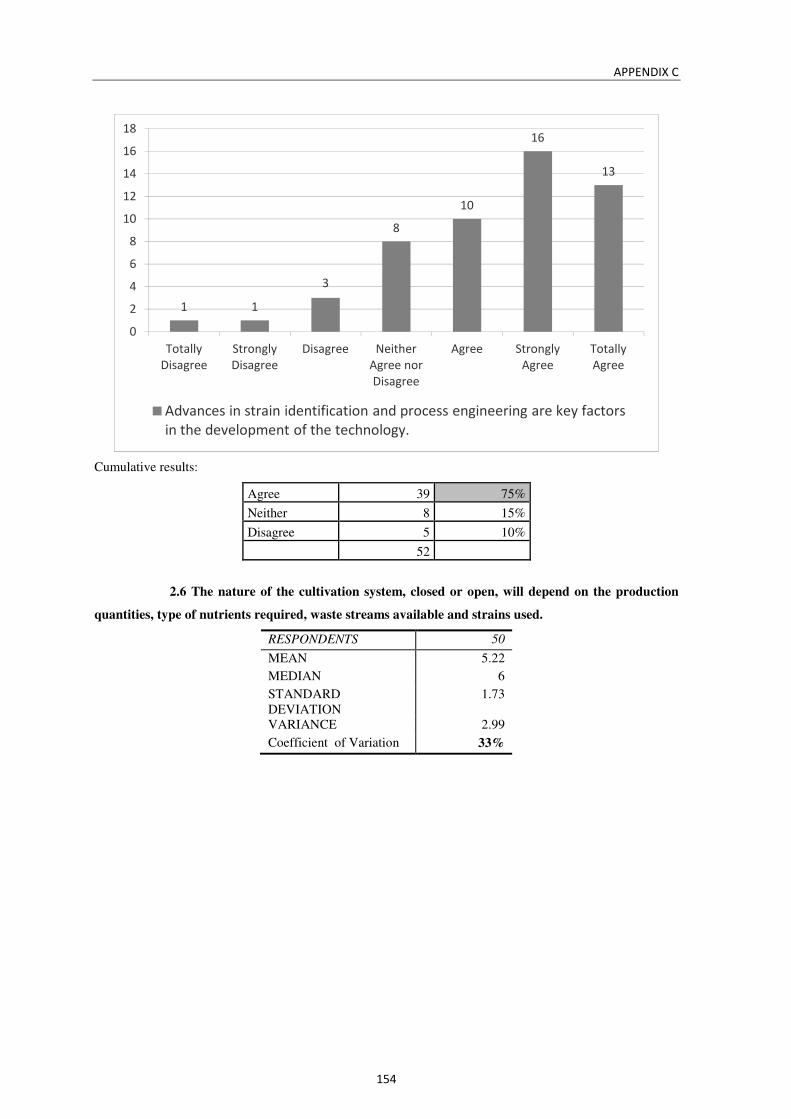
APPENDIX C
154
Cumulative results:
Agree 39 75%
Neither 8 15%
Disagree 5 10%
52
2.6 The nature of the cultivation system, closed or open, will depend on the production
quantities, type of nutrients required, waste streams available and strains used.
RESPONDENTS 50
MEAN 5.22
MEDIAN 6
STANDARD DEVIATION
1.73
VARIANCE 2.99
Coefficient of Variation 33%
1 1
3
8
10
16
13
0
2
4
6
8
10
12
14
16
18
Totally
Disagree
Strongly
Disagree
Disagree Neither
Agree nor
Disagree
Agree Strongly
Agree
Totally
Agree
Advances in strain identification and process engineering are key factors
in the development of the technology.
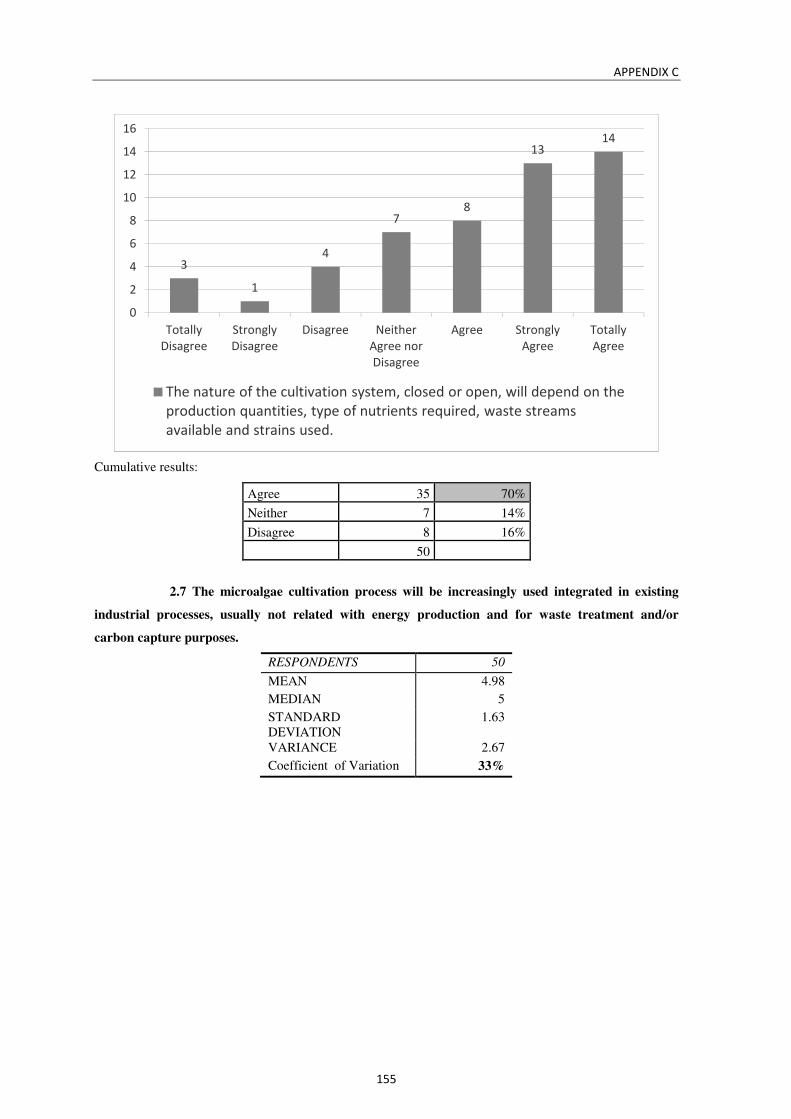
APPENDIX C
155
Cumulative results:
Agree 35 70%
Neither 7 14%
Disagree 8 16%
50
2.7 The microalgae cultivation process will be increasingly used integrated in existing
industrial processes, usually not related with energy production and for waste treatment and/or
carbon capture purposes.
RESPONDENTS 50
MEAN 4.98
MEDIAN 5
STANDARD DEVIATION
1.63
VARIANCE 2.67
Coefficient of Variation 33%
3
1
4
78
1314
0
2
4
6
8
10
12
14
16
Totally
Disagree
Strongly
Disagree
Disagree Neither
Agree nor
Disagree
Agree Strongly
Agree
Totally
Agree
The nature of the cultivation system, closed or open, will depend on the
production quantities, type of nutrients required, waste streams
available and strains used.
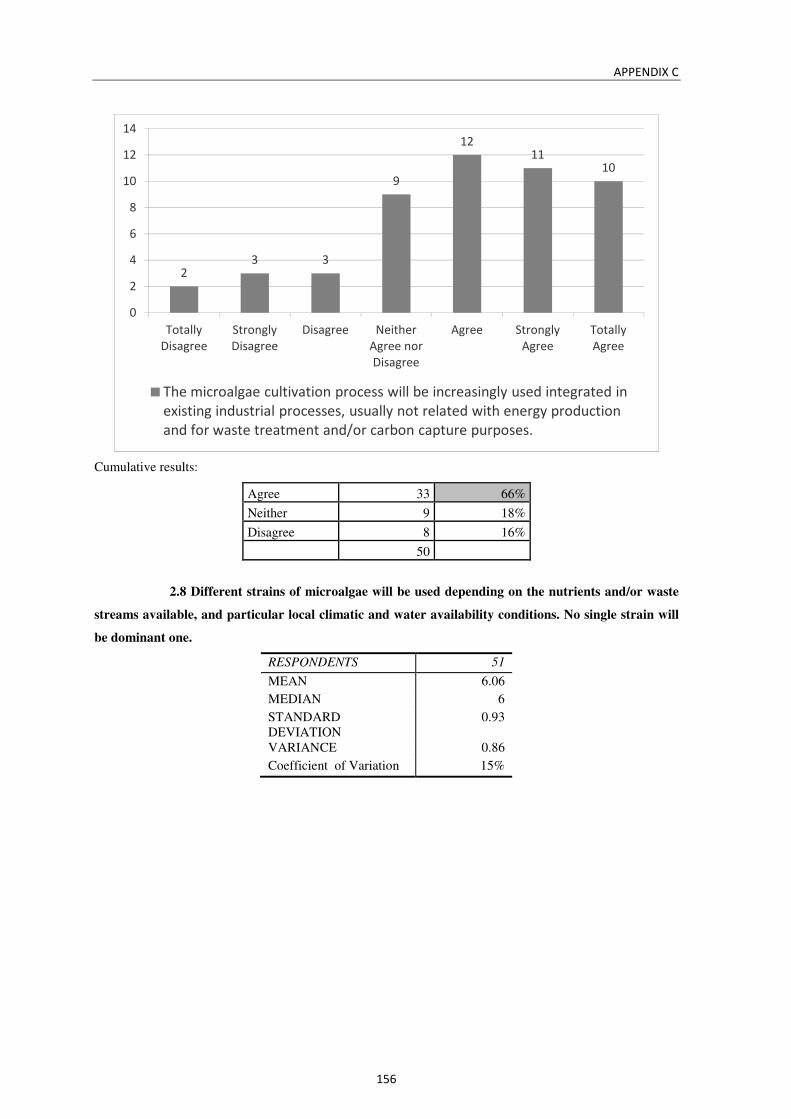
APPENDIX C
156
Cumulative results:
Agree 33 66%
Neither 9 18%
Disagree 8 16%
50
2.8 Different strains of microalgae will be used depending on the nutrients and/or waste
streams available, and particular local climatic and water availability conditions. No single strain will
be dominant one.
RESPONDENTS 51
MEAN 6.06
MEDIAN 6
STANDARD DEVIATION
0.93
VARIANCE 0.86
Coefficient of Variation 15%
23 3
9
1211
10
0
2
4
6
8
10
12
14
Totally
Disagree
Strongly
Disagree
Disagree Neither
Agree nor
Disagree
Agree Strongly
Agree
Totally
Agree
The microalgae cultivation process will be increasingly used integrated in
existing industrial processes, usually not related with energy production
and for waste treatment and/or carbon capture purposes.

APPENDIX C
157
Cumulative results:
Agree 47 92%
Neither 4 8%
Disagree 0 0%
51
2.9 Open pond cultivation, or similar, will dominate the future production systems,
although for small production involving the processing of waste streams the close cultivation systems
will be also used.
RESPONDENTS 49
MEAN 4.04
MEDIAN 4
STANDARD DEVIATION
1.76
VARIANCE 3.08
Coefficient of Variation 43%
0 0 0
4
8
2019
0
5
10
15
20
25
Totally
Disagree
Strongly
Disagree
Disagree Neither
Agree nor
Disagree
Agree Strongly
Agree
Totally
Agree
Different strains of microalgae will be used depending on the nutrients
and/or waste streams available, and particular local climatic and water
availability conditions. No single strain will be dominant one.
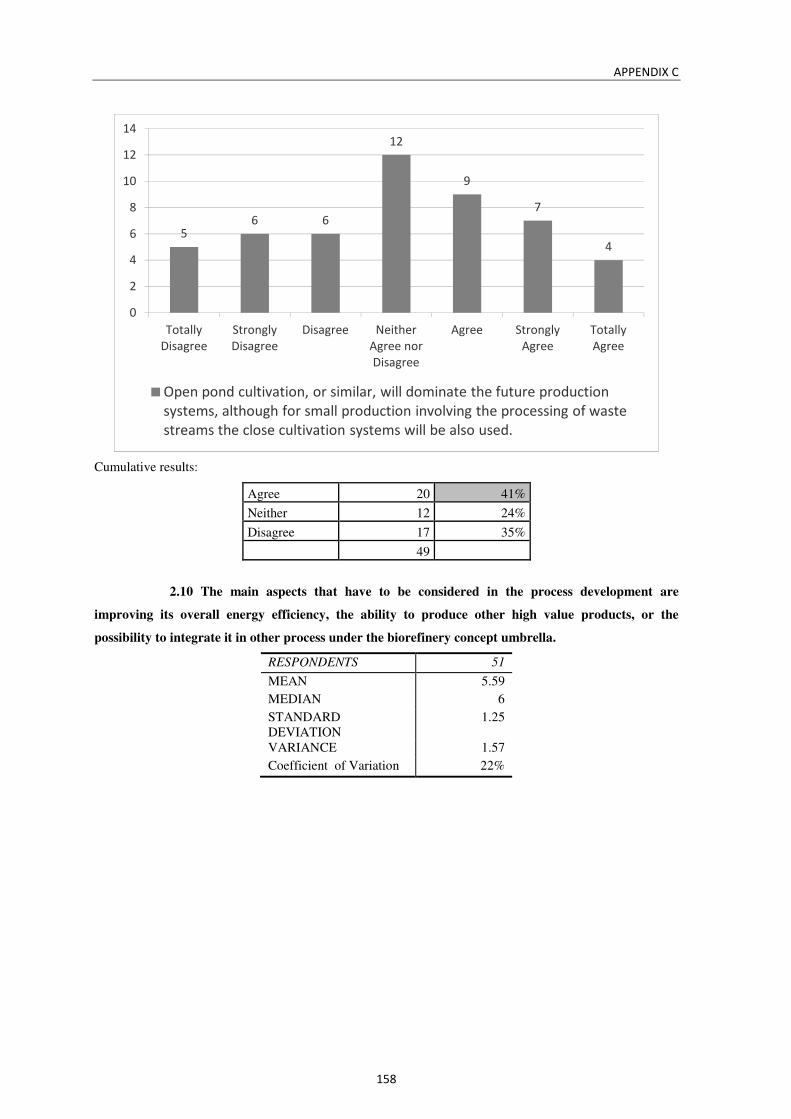
APPENDIX C
158
Cumulative results:
Agree 20 41%
Neither 12 24%
Disagree 17 35%
49
2.10 The main aspects that have to be considered in the process development are
improving its overall energy efficiency, the ability to produce other high value products, or the
possibility to integrate it in other process under the biorefinery concept umbrella.
RESPONDENTS 51
MEAN 5.59
MEDIAN 6
STANDARD DEVIATION
1.25
VARIANCE 1.57
Coefficient of Variation 22%
56 6
12
9
7
4
0
2
4
6
8
10
12
14
Totally
Disagree
Strongly
Disagree
Disagree Neither
Agree nor
Disagree
Agree Strongly
Agree
Totally
Agree
Open pond cultivation, or similar, will dominate the future production
systems, although for small production involving the processing of waste
streams the close cultivation systems will be also used.
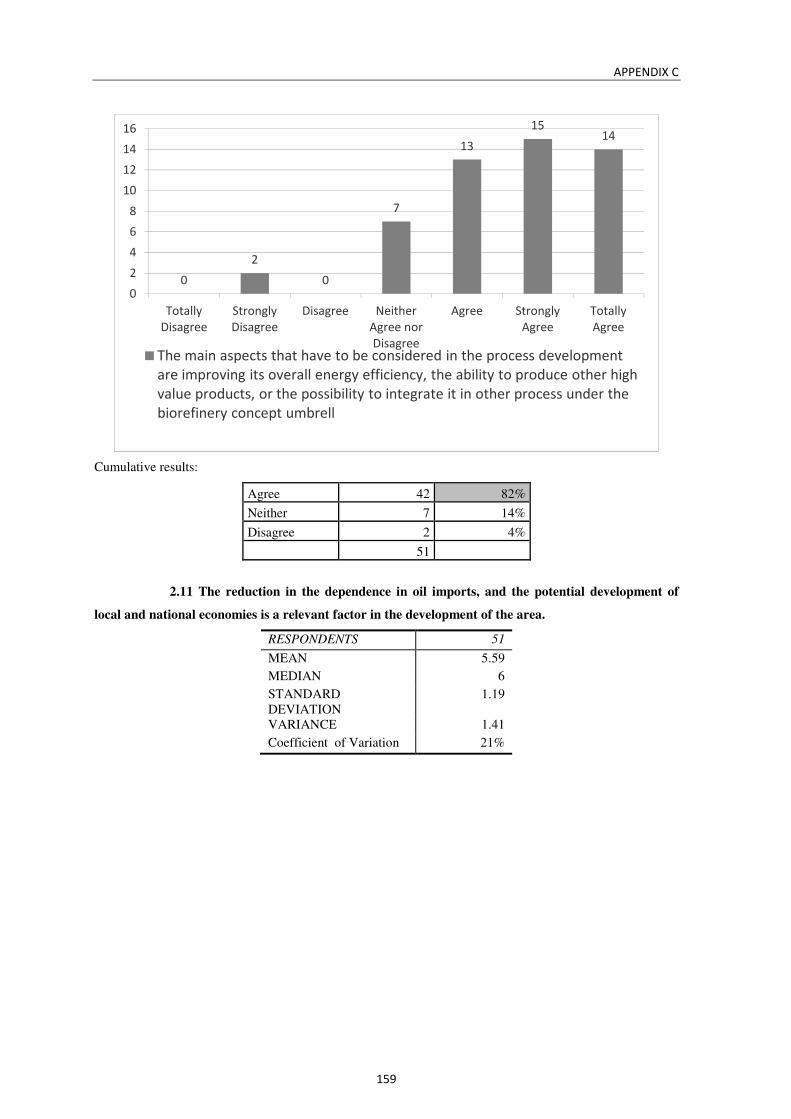
APPENDIX C
159
Cumulative results:
Agree 42 82%
Neither 7 14%
Disagree 2 4%
51
2.11 The reduction in the dependence in oil imports, and the potential development of
local and national economies is a relevant factor in the development of the area.
RESPONDENTS 51
MEAN 5.59
MEDIAN 6
STANDARD DEVIATION
1.19
VARIANCE 1.41
Coefficient of Variation 21%
0
2
0
7
13
1514
0
2
4
6
8
10
12
14
16
Totally
Disagree
Strongly
Disagree
Disagree Neither
Agree nor
Disagree
Agree Strongly
Agree
Totally
Agree
The main aspects that have to be considered in the process development
are improving its overall energy efficiency, the ability to produce other high
value products, or the possibility to integrate it in other process under the
biorefinery concept umbrell
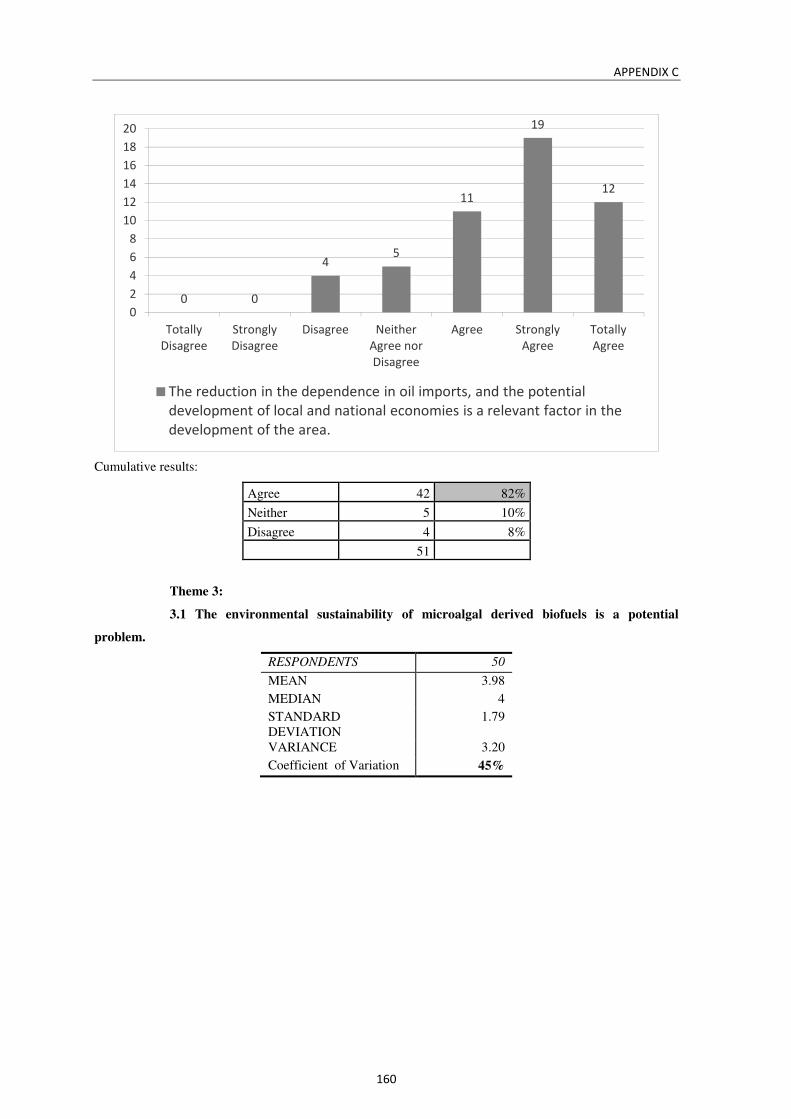
APPENDIX C
160
Cumulative results:
Agree 42 82%
Neither 5 10%
Disagree 4 8%
51
Theme 3:
3.1 The environmental sustainability of microalgal derived biofuels is a potential
problem.
RESPONDENTS 50
MEAN 3.98
MEDIAN 4
STANDARD DEVIATION
1.79
VARIANCE 3.20
Coefficient of Variation 45%
0 0
45
11
19
12
0
2
4
6
8
10
12
14
16
18
20
Totally
Disagree
Strongly
Disagree
Disagree Neither
Agree nor
Disagree
Agree Strongly
Agree
Totally
Agree
The reduction in the dependence in oil imports, and the potential
development of local and national economies is a relevant factor in the
development of the area.

APPENDIX C
161
Cumulative results:
Agree 19 38%
Neither 14 28%
Disagree 17 34%
50
3.2 The utilization of genetic modified organisms may represent a potential problem in
the diffusion of algal biofuels.
RESPONDENTS 50
MEAN 4.64
MEDIAN 5
STANDARD DEVIATION
1.61
VARIANCE 2.60
Coefficient of Variation 35%
67
4
14
5
12
2
0
2
4
6
8
10
12
14
16
Totally
Disagree
Strongly
Disagree
Disagree Neither
Agree nor
Disagree
Agree Strongly
Agree
Totally
Agree
The environmental sustainability of microalgal derived biofuels is a
potential problem.
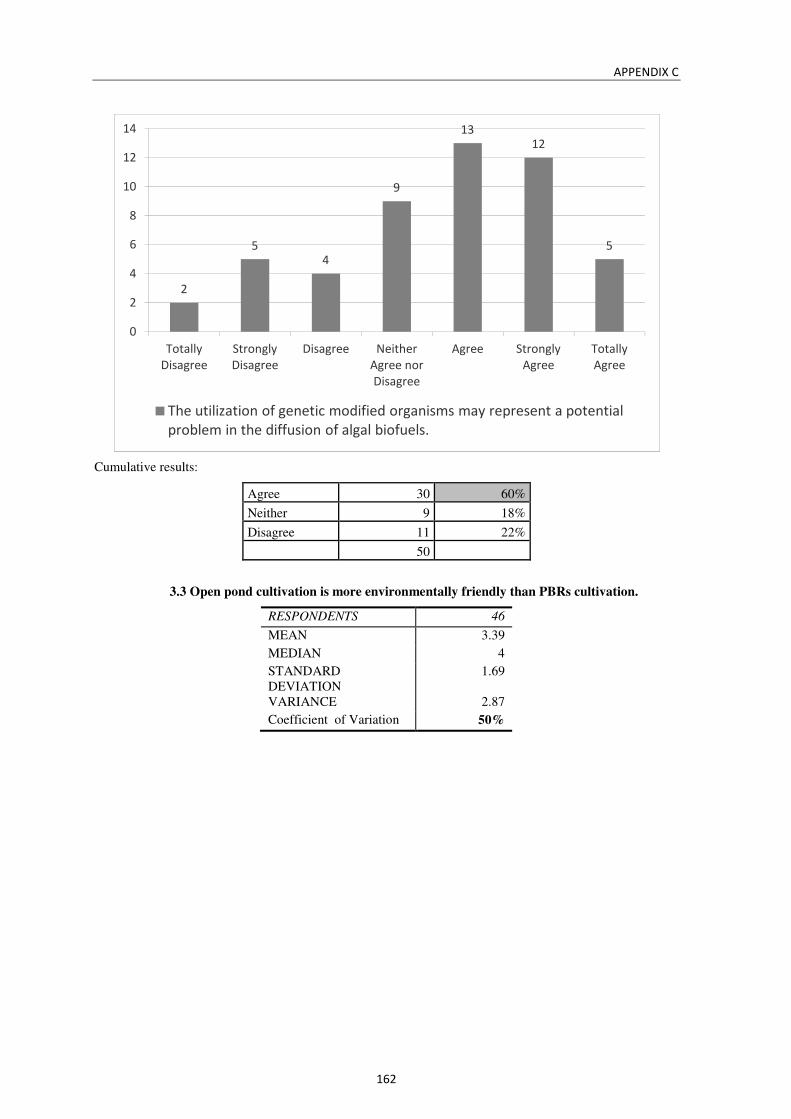
APPENDIX C
162
Cumulative results:
Agree 30 60%
Neither 9 18%
Disagree 11 22%
50
3.3 Open pond cultivation is more environmentally friendly than PBRs cultivation.
RESPONDENTS 46
MEAN 3.39
MEDIAN 4
STANDARD DEVIATION
1.69
VARIANCE 2.87
Coefficient of Variation 50%
2
54
9
1312
5
0
2
4
6
8
10
12
14
Totally
Disagree
Strongly
Disagree
Disagree Neither
Agree nor
Disagree
Agree Strongly
Agree
Totally
Agree
The utilization of genetic modified organisms may represent a potential
problem in the diffusion of algal biofuels.

APPENDIX C
163
Cumulative results:
Agree 7 15%
Neither 19 41%
Disagree 20 43%
46
3.4 Closed PBRs cultivation is more environmentally friendly than open pond cultivation.
RESPONDENTS 47
MEAN 3.94
MEDIAN 4
STANDARD DEVIATION
1.80
VARIANCE 3.23
Coefficient of Variation 46%
10
3
7
19
2 23
0
2
4
6
8
10
12
14
16
18
20
Totally
Disagree
Strongly
Disagree
Disagree Neither
Agree nor
Disagree
Agree Strongly
Agree
Totally
Agree
Open pond cultivation is more environmentally friendly than PBRs
cultivation.
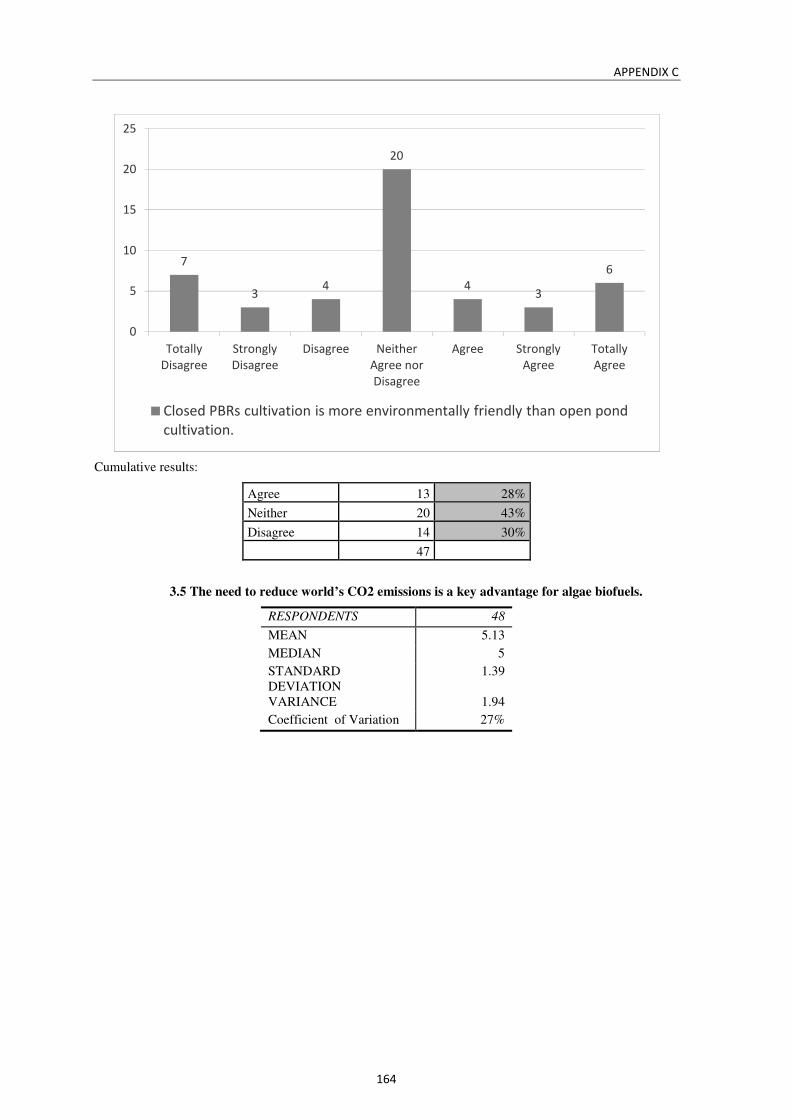
APPENDIX C
164
Cumulative results:
Agree 13 28%
Neither 20 43%
Disagree 14 30%
47
3.5 The need to reduce world’s CO2 emissions is a key advantage for algae biofuels.
RESPONDENTS 48
MEAN 5.13
MEDIAN 5
STANDARD DEVIATION
1.39
VARIANCE 1.94
Coefficient of Variation 27%
7
34
20
43
6
0
5
10
15
20
25
Totally
Disagree
Strongly
Disagree
Disagree Neither
Agree nor
Disagree
Agree Strongly
Agree
Totally
Agree
Closed PBRs cultivation is more environmentally friendly than open pond
cultivation.
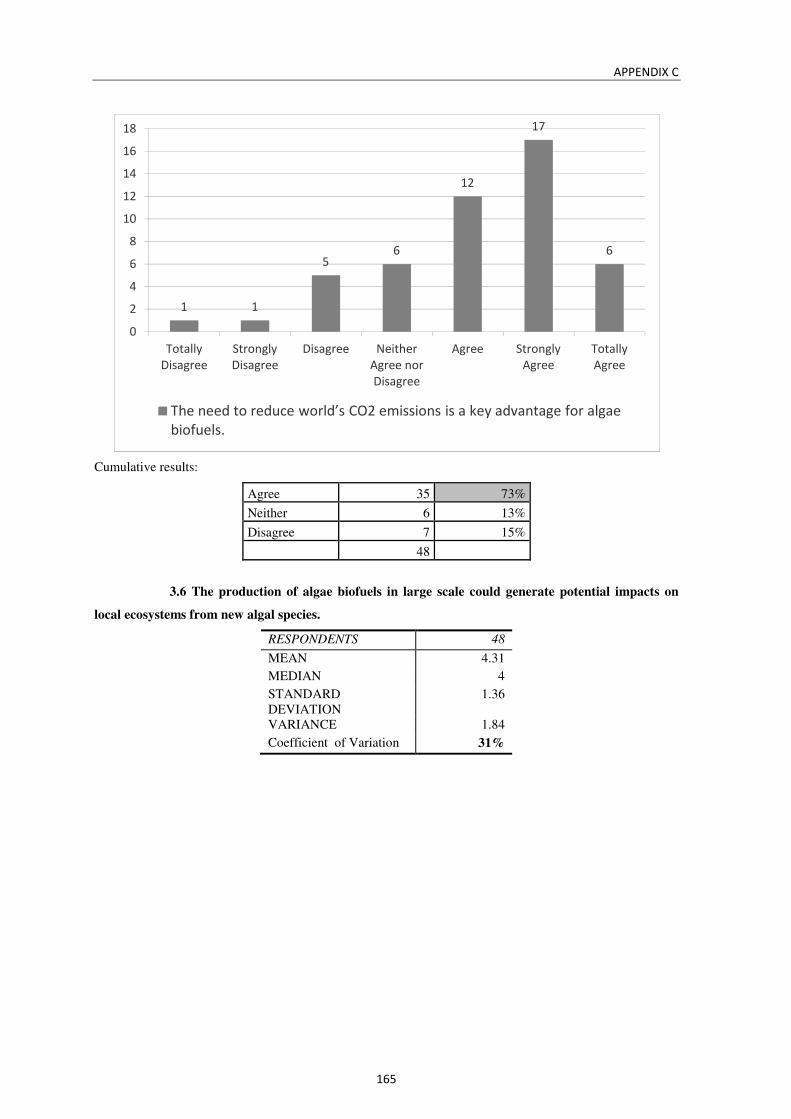
APPENDIX C
165
Cumulative results:
Agree 35 73%
Neither 6 13%
Disagree 7 15%
48
3.6 The production of algae biofuels in large scale could generate potential impacts on
local ecosystems from new algal species.
RESPONDENTS 48
MEAN 4.31
MEDIAN 4
STANDARD DEVIATION
1.36
VARIANCE 1.84
Coefficient of Variation 31%
1 1
56
12
17
6
0
2
4
6
8
10
12
14
16
18
Totally
Disagree
Strongly
Disagree
Disagree Neither
Agree nor
Disagree
Agree Strongly
Agree
Totally
Agree
The need to reduce world’s CO2 emissions is a key advantage for algae
biofuels.
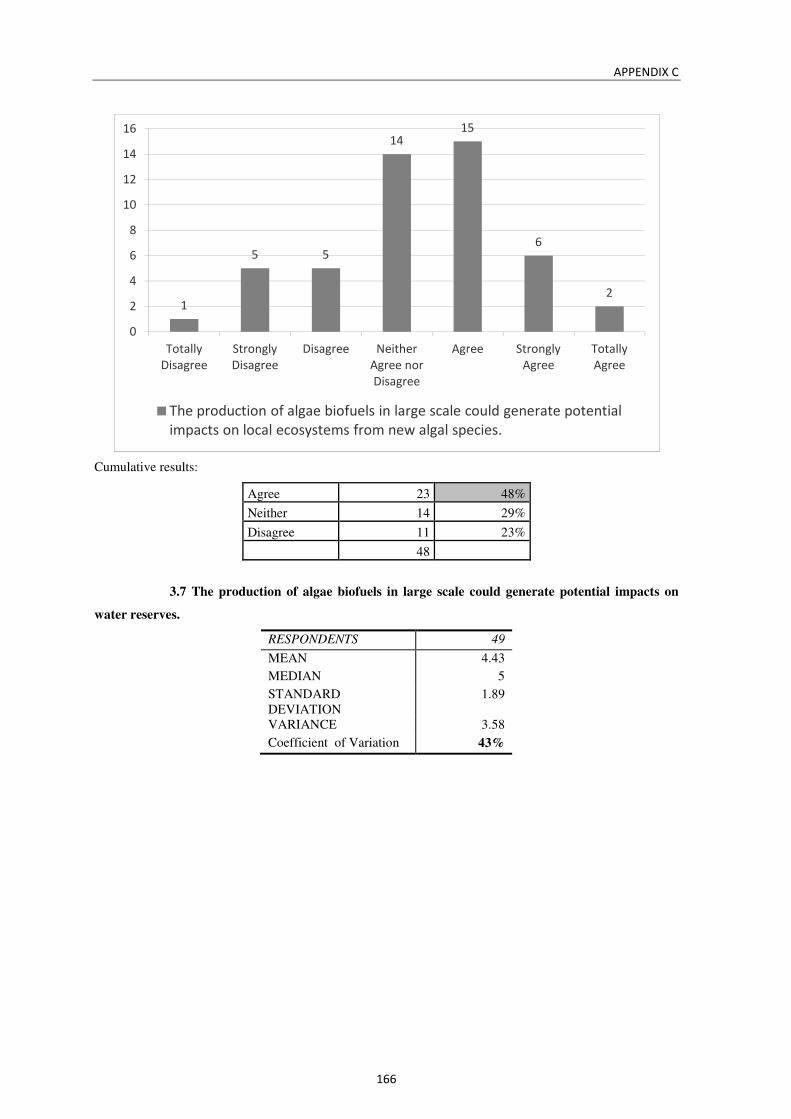
APPENDIX C
166
Cumulative results:
Agree 23 48%
Neither 14 29%
Disagree 11 23%
48
3.7 The production of algae biofuels in large scale could generate potential impacts on
water reserves.
RESPONDENTS 49
MEAN 4.43
MEDIAN 5
STANDARD DEVIATION
1.89
VARIANCE 3.58
Coefficient of Variation 43%
1
5 5
1415
6
2
0
2
4
6
8
10
12
14
16
Totally
Disagree
Strongly
Disagree
Disagree Neither
Agree nor
Disagree
Agree Strongly
Agree
Totally
Agree
The production of algae biofuels in large scale could generate potential
impacts on local ecosystems from new algal species.
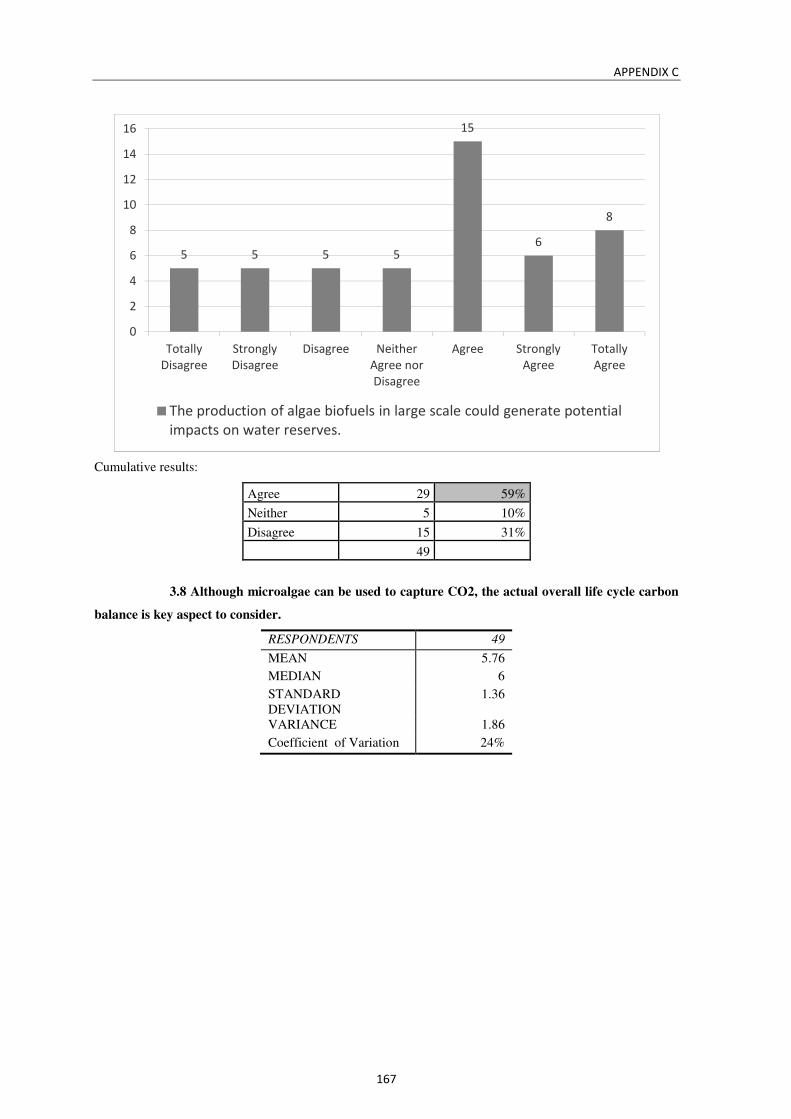
APPENDIX C
167
Cumulative results:
Agree 29 59%
Neither 5 10%
Disagree 15 31%
49
3.8 Although microalgae can be used to capture CO2, the actual overall life cycle carbon
balance is key aspect to consider.
RESPONDENTS 49
MEAN 5.76
MEDIAN 6
STANDARD DEVIATION
1.36
VARIANCE 1.86
Coefficient of Variation 24%
5 5 5 5
15
6
8
0
2
4
6
8
10
12
14
16
Totally
Disagree
Strongly
Disagree
Disagree Neither
Agree nor
Disagree
Agree Strongly
Agree
Totally
Agree
The production of algae biofuels in large scale could generate potential
impacts on water reserves.

APPENDIX C
168
Cumulative results:
Agree 39 80%
Neither 9 18%
Disagree 1 2%
49
3.9 The potential of biofuels from microalgae to be carbon neutral is a key factor
concerning their sustainability.
RESPONDENTS 48
MEAN 5.44
MEDIAN 5
STANDARD DEVIATION
1.34
VARIANCE 1.78
Coefficient of Variation 25%
10 0
910
8
21
0
5
10
15
20
25
Totally
Disagree
Strongly
Disagree
Disagree Neither
Agree nor
Disagree
Agree Strongly
Agree
Totally
Agree
Although microalgae can be used to capture CO2, the actual overall life
cycle carbon balance is key aspect to consider.
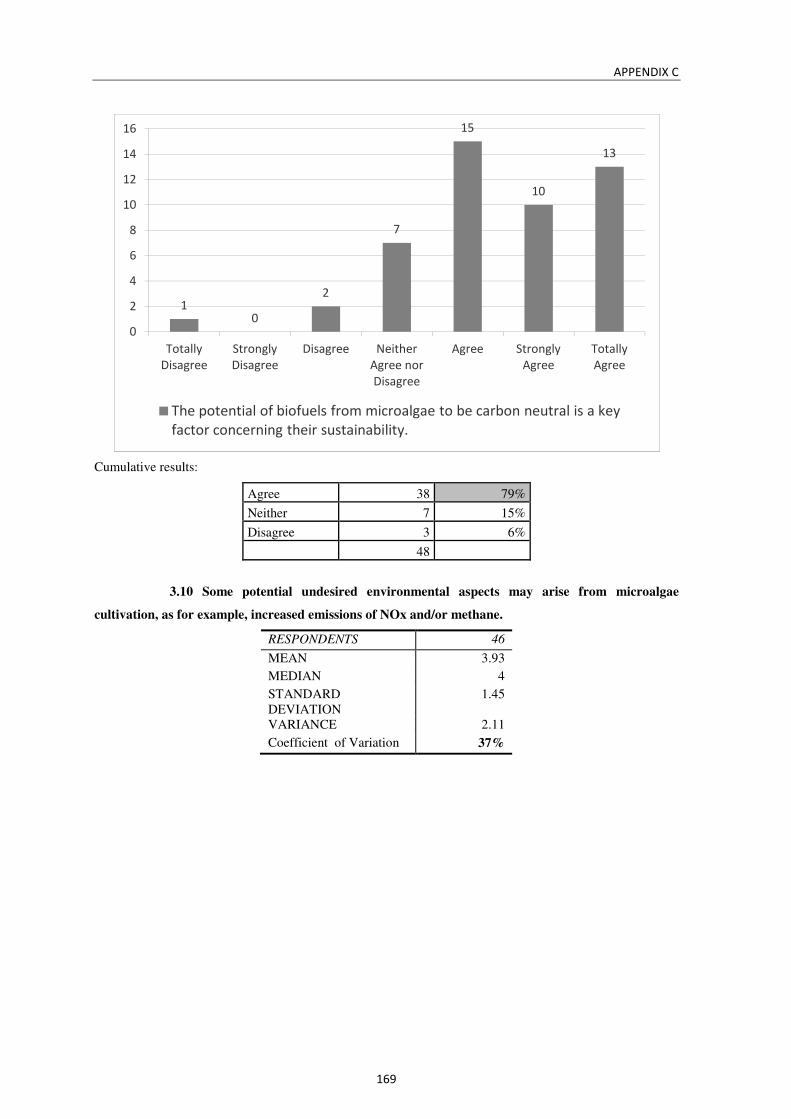
APPENDIX C
169
Cumulative results:
Agree 38 79%
Neither 7 15%
Disagree 3 6%
48
3.10 Some potential undesired environmental aspects may arise from microalgae
cultivation, as for example, increased emissions of NOx and/or methane.
RESPONDENTS 46
MEAN 3.93
MEDIAN 4
STANDARD DEVIATION
1.45
VARIANCE 2.11
Coefficient of Variation 37%
10
2
7
15
10
13
0
2
4
6
8
10
12
14
16
Totally
Disagree
Strongly
Disagree
Disagree Neither
Agree nor
Disagree
Agree Strongly
Agree
Totally
Agree
The potential of biofuels from microalgae to be carbon neutral is a key
factor concerning their sustainability.
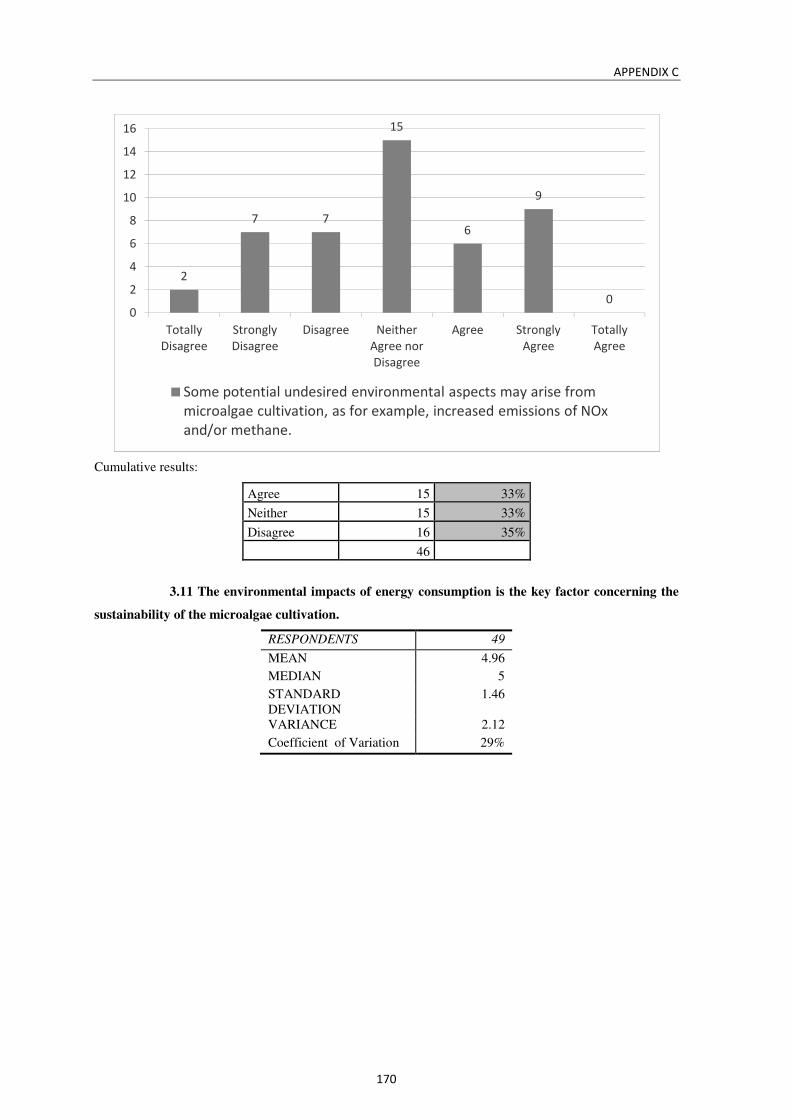
APPENDIX C
170
Cumulative results:
Agree 15 33%
Neither 15 33%
Disagree 16 35%
46
3.11 The environmental impacts of energy consumption is the key factor concerning the
sustainability of the microalgae cultivation.
RESPONDENTS 49
MEAN 4.96
MEDIAN 5
STANDARD DEVIATION
1.46
VARIANCE 2.12
Coefficient of Variation 29%
2
7 7
15
6
9
00
2
4
6
8
10
12
14
16
Totally
Disagree
Strongly
Disagree
Disagree Neither
Agree nor
Disagree
Agree Strongly
Agree
Totally
Agree
Some potential undesired environmental aspects may arise from
microalgae cultivation, as for example, increased emissions of NOx
and/or methane.
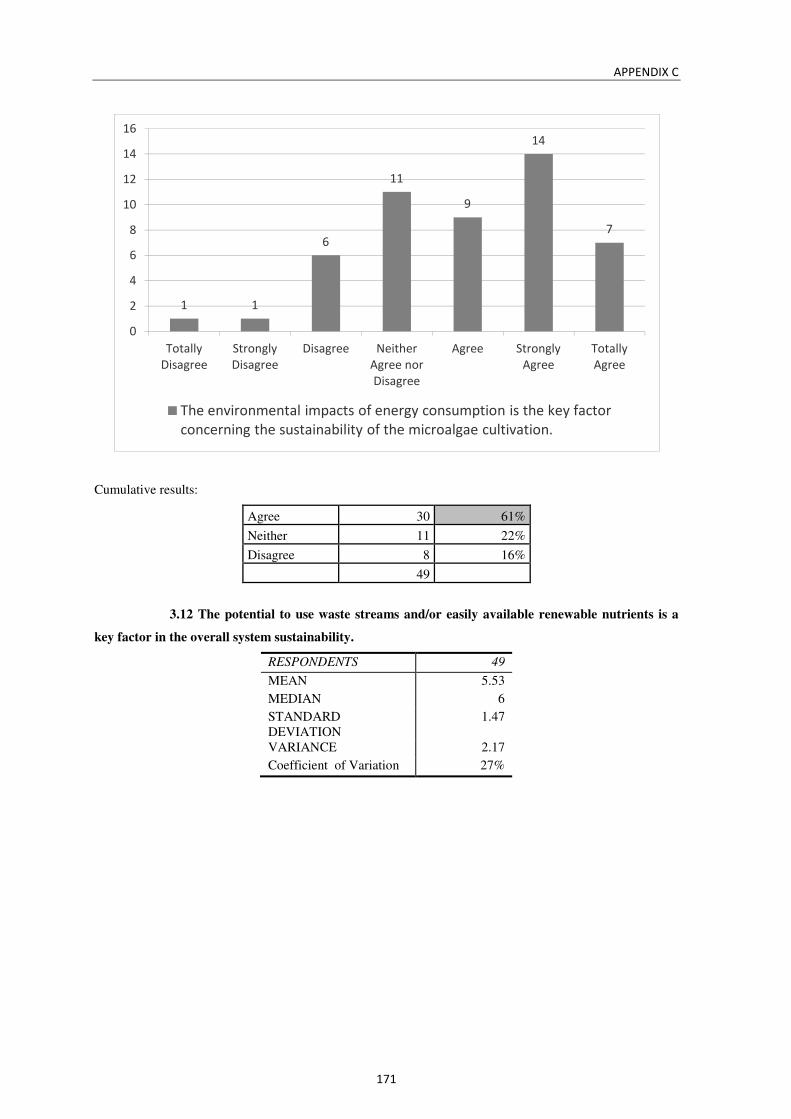
APPENDIX C
171
Cumulative results:
Agree 30 61%
Neither 11 22%
Disagree 8 16%
49
3.12 The potential to use waste streams and/or easily available renewable nutrients is a
key factor in the overall system sustainability.
RESPONDENTS 49
MEAN 5.53
MEDIAN 6
STANDARD DEVIATION
1.47
VARIANCE 2.17
Coefficient of Variation 27%
1 1
6
11
9
14
7
0
2
4
6
8
10
12
14
16
Totally
Disagree
Strongly
Disagree
Disagree Neither
Agree nor
Disagree
Agree Strongly
Agree
Totally
Agree
The environmental impacts of energy consumption is the key factor
concerning the sustainability of the microalgae cultivation.

APPENDIX C
172
Cumulative results:
Agree 40 82%
Neither 6 12%
Disagree 3 6%
49
Theme 4:
How important is each policy below to the success of algae biofuels?
Answer options
Not at all
important
Unimportant
Slightly Unimportant
Neutral Important
Very Import
ant
Extremely
Important
Prefer not to
answer
Response
Count
Mandatory country objectives; 1 0 0 8 11 16 10 6 52 Sustainability standards (Emissions, production, etc.);
1 0 0 5 10 19 11 6 52
Public Investment in R&D; 0 0 0 5 7 12 21 7 52 Tax incentives and subsidies; 1 1 0 2 13 15 13 7 52 Certification schemes, in particular those concerning raw materials or the entire fuel life cycle;
0 1 0 4 18 17 6 6 52
Specific legislation or international agreements (such as European Directives) aimed specifically to biofuels or to specific environmental questions (such as carbon emissions) where biofuels have a pivotal role;
0 0 0 5 13 19 9 6 52
Development strategies aimed to renewable resources, either research, utilization and integration in existing systems.
0 0 0 4 12 14 16 6 52
21
0
6
11
1514
0
2
4
6
8
10
12
14
16
Totally
Disagree
Strongly
Disagree
Disagree Neither
Agree nor
Disagree
Agree Strongly
Agree
Totally
Agree
The potential to use waste streams and/or easily available renewable
nutrients is a key factor in the overall system sustainability.
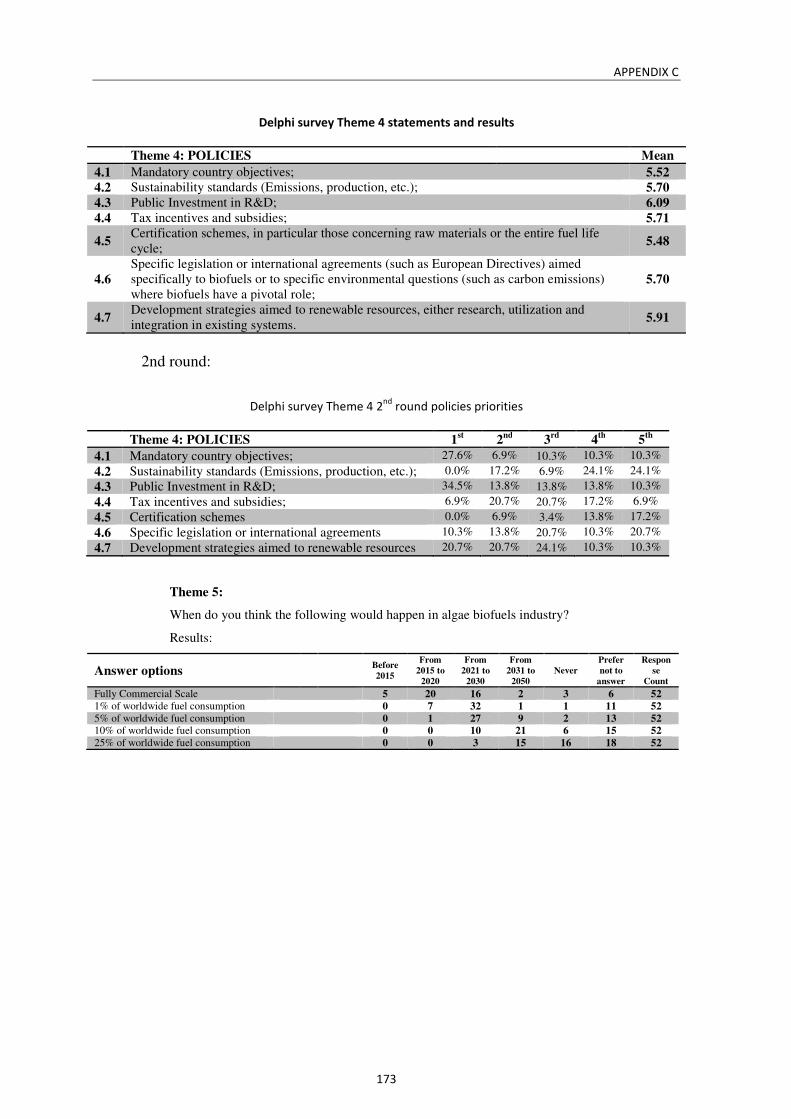
APPENDIX C
173
Delphi survey Theme 4 statements and results
Theme 4: POLICIES
Mean
4.1 Mandatory country objectives; 5.52 4.2 Sustainability standards (Emissions, production, etc.); 5.70 4.3 Public Investment in R&D; 6.09 4.4 Tax incentives and subsidies; 5.71
4.5 Certification schemes, in particular those concerning raw materials or the entire fuel life cycle;
5.48
4.6 Specific legislation or international agreements (such as European Directives) aimed specifically to biofuels or to specific environmental questions (such as carbon emissions) where biofuels have a pivotal role;
5.70
4.7 Development strategies aimed to renewable resources, either research, utilization and integration in existing systems.
5.91
2nd round:
Delphi survey Theme 4 2nd
round policies priorities
Theme 4: POLICIES 1st 2nd 3rd 4th 5th
4.1 Mandatory country objectives; 27.6% 6.9% 10.3% 10.3% 10.3%
4.2 Sustainability standards (Emissions, production, etc.); 0.0% 17.2% 6.9% 24.1% 24.1%
4.3 Public Investment in R&D; 34.5% 13.8% 13.8% 13.8% 10.3%
4.4 Tax incentives and subsidies; 6.9% 20.7% 20.7% 17.2% 6.9%
4.5 Certification schemes 0.0% 6.9% 3.4% 13.8% 17.2%
4.6 Specific legislation or international agreements 10.3% 13.8% 20.7% 10.3% 20.7%
4.7 Development strategies aimed to renewable resources 20.7% 20.7% 24.1% 10.3% 10.3%
Theme 5:
When do you think the following would happen in algae biofuels industry?
Results:
Answer options
Before 2015
From 2015 to
2020
From 2021 to
2030
From 2031 to
2050 Never
Prefer not to
answer
Response
Count
Fully Commercial Scale 5 20 16 2 3 6 52 1% of worldwide fuel consumption 0 7 32 1 1 11 52 5% of worldwide fuel consumption 0 1 27 9 2 13 52 10% of worldwide fuel consumption 0 0 10 21 6 15 52 25% of worldwide fuel consumption 0 0 3 15 16 18 52
APPENDIX D
174
APPENDIX D: Model Template used for Generating the Scenarios identifiers ////////////// PARAMETERS // POLICY 1: Subsidies // Value from 0 to 1: indicates the remaining amount (after reduction /increase) : 1 = inactive policy Policy1_Gas = oooPolicy1_Gooo ; Policy1_Petrol = oooPolicy1_Pooo ; Policy1_BIO = oooPolicy1_Booo ; Policy1_ADVBIO = oooPolicy1_Aooo ; Policy1_ELEC = oooPolicy1_Eooo ; //POLICY 2: Cost of Carbon Emission // Value from 0 to 1: indicates the remaining amount (after reduction /increase) : 1 = inactive policy Policy2_Gas = oooPolicy2_Gooo ; Policy2_Petrol = oooPolicy2_Pooo ; Policy2_BIO = oooPolicy2_Booo ; Policy2_ADVBIO = oooPolicy2_Aooo ; Policy2_ELEC = oooPolicy2_Eooo ; //POLICY 3: Mandate // Value from 0 to 1 indicating the percentage of Biofuel/AdvBio in gasoline. Zero means inactive policy. Policy3_B = oooPolicy3_Booo; Policy3_A = oooPolicy3_Aooo; // Value from 0 to 1 indicating the percentage of gasoline use within the Petrol=Gasoline+Diesel users GasolineInPetrol = 0.75; //COST OF RESOURCES: costGas = ooocost_Gooo * Policy1_Gas * Policy2_Gas; costPetrol = ooocost_Pooo * Policy1_Petrol * Policy2_Petrol ;// gasoline + diesel costBIO = ooocost_Booo * Policy1_BIO * Policy2_BIO; costADVBIO = ooocost_Aooo * Policy1_ADVBIO * Policy2_ADVBIO; costELEC = ooocost_Eooo * Policy1_ELEC * Policy2_ELEC; // AVAILABILITY OF RESOURCES: // This variable denotes the availability of a resource (100 MEANS THERE IS NO LIMIT). // If AVAIL = X then at most X% of users can use this fuel, except in the case of 0, that means that // 0 to 1% of users may use this fuel. // The availabilities of BIO and ADVBIO include also the amount due to mandate (Policy3). AVAIL_P = oooAVAIL_Pooo ; AVAIL_G = oooAVAIL_Gooo ; AVAIL_B = oooAVAIL_Booo + (((AVAIL_P - ((st UP)*2)+1))* oooPolicy3_Booo ); AVAIL_A = oooAVAIL_Aooo + (((AVAIL_P - ((st UP)*2)+1))* oooPolicy3_Aooo ); AVAIL_E = oooAVAIL_Eooo; ///////////// END OF PAREMETERS // Number of user levels: 51 USER_RANGE = [0..50]; // Cost of changing fuel: Depends on cost of adapting the vehicle and fuel availability // Value between 0 (maximum cost) and 100 (no cost) FULL_EO = 10; FULL_OE = 10;
APPENDIX D
175
PART = 20; NONE = 100; NONE_OB = 100 ; NONE_OA = 100 ; changeCostPG = PART /100; changeCostGP = NONE /100; changeCostPB = NONE_OB /100; changeCostBP = NONE /100; changeCostGB = NONE_OB /100; changeCostBG = PART /100; changeCostAB = NONE /100; changeCostBA = NONE /100; changeCostEB = FULL_EO /100; changeCostBE = FULL_OE/100; changeCostGA = NONE_OA /100; changeCostAG = PART /100; changeCostEA = FULL_EO /100; changeCostAE = FULL_OE /100; changeCostPE = FULL_OE /100; changeCostEP = FULL_EO /100; changeCostGE = FULL_OE /100; changeCostEG = FULL_EO/100; changeCostAP = NONE /100; changeCostPA = NONE_OA /100; // Actual Availability: Availability (percentage) actualAVAIL_P = ( AVAIL_P / 100 ) ; actualAVAIL_G = ( AVAIL_G / 100 ) ; actualAVAIL_B = ( AVAIL_B / 100 ) ; actualAVAIL_A = ( AVAIL_A / 100 ) ; actualAVAIL_E = ( AVAIL_E / 100 ) ; // GuardAVAIL : This is used to prevent users from going to a fuel if there is no availability. // To disable the guard, all values can be set to 1. // The value of this variable is zero (if the availability has reached its limit) or 1 (otherwise). actAVAIL_P = ((AVAIL_P == 100) * 1) + ((AVAIL_P != 100) * ((((AVAIL_P - ((st UP)* 2) ) +1) / 100) ) ); actAVAIL_G = ((AVAIL_G == 100) * 1) + ((AVAIL_G != 100) * ((((AVAIL_G - ((st UG)* 2) ) +1) / 100) ) ); actAVAIL_B = ((AVAIL_B == 100) * 1) + ((AVAIL_B != 100) * ((((AVAIL_B - ((st UB)* 2) ) +1) / 100) ) ); actAVAIL_A = ((AVAIL_A == 100) * 1) + ((AVAIL_A != 100) * ((((AVAIL_A - ((st UA)* 2) ) +1) / 100) ) ); actAVAIL_E = ((AVAIL_E == 100) * 1) + ((AVAIL_E != 100) * ((((AVAIL_E - ((st UE)* 2) ) +1) / 100) ) ); GuardAVAIL_P = (actAVAIL_P > 0); GuardAVAIL_G = (actAVAIL_G > 0); GuardAVAIL_B = (actAVAIL_B > 0); GuardAVAIL_A = (actAVAIL_A > 0); GuardAVAIL_E = (actAVAIL_E > 0); // Price comparisons: A number between 0 and 1. // A unity-based normalization using as interval the distance between the minimum cost in all scenarios (10) // and the maximum cost (50). If prices of X and Y are the same, priceDiff_XtoY is 0.5. // To prevent zero values (that would cause division by zero later), we add 0.0001 to the result.
APPENDIX D
176
MAX_DIST = 40; // 40 = 50 (MAX_PRICE) - 10 (MIN_PRICE); priceDiff_PtoG = 0.0001 +((costPetrol-costGas)+MAX_DIST) / (2 * MAX_DIST) ; priceDiff_GtoP = 0.0001 +((costGas-costPetrol)+MAX_DIST) / (2 * MAX_DIST) ; priceDiff_PtoE = 0.0001 +((costPetrol-costELEC)+MAX_DIST) / (2 * MAX_DIST) ; priceDiff_EtoP = 0.0001 +((costELEC-costPetrol)+MAX_DIST) / (2 * MAX_DIST) ; priceDiff_PtoA = 0.0001 +((costPetrol-costADVBIO)+MAX_DIST) / (2 * MAX_DIST) ; priceDiff_AtoP = 0.0001 +((costADVBIO-costPetrol)+MAX_DIST) / (2 * MAX_DIST) ; priceDiff_PtoB = 0.0001 +((costPetrol-costBIO)+MAX_DIST) / (2 * MAX_DIST) ; priceDiff_BtoP = 0.0001 +((costBIO-costPetrol)+MAX_DIST) / (2 * MAX_DIST) ; priceDiff_GtoB = 0.0001 +((costGas-costBIO)+MAX_DIST) / (2 * MAX_DIST) ; priceDiff_BtoG = 0.0001 +((costBIO-costGas)+MAX_DIST) / (2 * MAX_DIST) ; priceDiff_BtoA = 0.0001 +((costBIO-costADVBIO)+MAX_DIST) / (2 * MAX_DIST) ; priceDiff_AtoB = 0.0001 +((costADVBIO-costBIO)+MAX_DIST) / (2 * MAX_DIST) ; priceDiff_BtoE = 0.0001 +((costBIO-costELEC)+MAX_DIST) / (2 * MAX_DIST) ; priceDiff_EtoB = 0.0001 +((costELEC-costBIO)+MAX_DIST) / (2 * MAX_DIST) ; priceDiff_GtoA = 0.0001 +((costGas-costADVBIO)+MAX_DIST) / (2 * MAX_DIST) ; priceDiff_AtoG = 0.0001 +((costADVBIO-costGas)+MAX_DIST) / (2 * MAX_DIST) ; priceDiff_EtoA = 0.0001 +((costELEC-costADVBIO)+MAX_DIST) / (2 * MAX_DIST) ; priceDiff_AtoE = 0.0001 +((costADVBIO-costELEC)+MAX_DIST) / (2 * MAX_DIST) ; priceDiff_GtoE = 0.0001 +((costGas-costELEC)+MAX_DIST) / (2 * MAX_DIST) ; priceDiff_EtoG = 0.0001 +((costELEC-costGas)+MAX_DIST) / (2 * MAX_DIST) ; // Rates of conversion from one fuel to the other. These rates are numbers from 0 to 100 // representing how likely it is to make this change. This takes into account: // * the cost of changing from one fuel to another and // * the difference in the costs of fuels // * the availability of the fuel // The availability of the new fuel affects the formula by preventing the change if the fuel is not available. // We use weighted harmonic mean, price has a greater weight. WEIGHT_CHANGE = 1; WEIGHT_PRICE = 3; WEIGHT_AVAIL = 2; SUM_WEIGHT = WEIGHT_CHANGE + WEIGHT_PRICE + WEIGHT_AVAIL ; rateGP = GuardAVAIL_P * ( SUM_WEIGHT / ( (WEIGHT_CHANGE / changeCostGP ) + (WEIGHT_AVAIL / actualAVAIL_P) + (WEIGHT_PRICE / priceDiff_GtoP ) ) ) ; ratePG = GuardAVAIL_G * ( SUM_WEIGHT /((WEIGHT_CHANGE / changeCostPG ) + (WEIGHT_AVAIL / actualAVAIL_G ) + (WEIGHT_PRICE / priceDiff_PtoG ) ) ) ; rateBP = GuardAVAIL_P * ( SUM_WEIGHT /((WEIGHT_CHANGE / changeCostBP ) + (WEIGHT_AVAIL / actualAVAIL_P )+ (WEIGHT_PRICE / priceDiff_BtoP ) ) ) ; ratePB = GuardAVAIL_B * ( SUM_WEIGHT /((WEIGHT_CHANGE / changeCostPB ) + (WEIGHT_AVAIL / actualAVAIL_B) + (WEIGHT_PRICE/ priceDiff_PtoB ) ) ) ; rateAP = GuardAVAIL_P * ( SUM_WEIGHT /((WEIGHT_CHANGE / changeCostAP ) + (WEIGHT_AVAIL / actualAVAIL_P) + (WEIGHT_PRICE/ priceDiff_AtoP ) ) ) ; ratePA = GuardAVAIL_A * ( SUM_WEIGHT /((WEIGHT_CHANGE / changeCostPA ) +
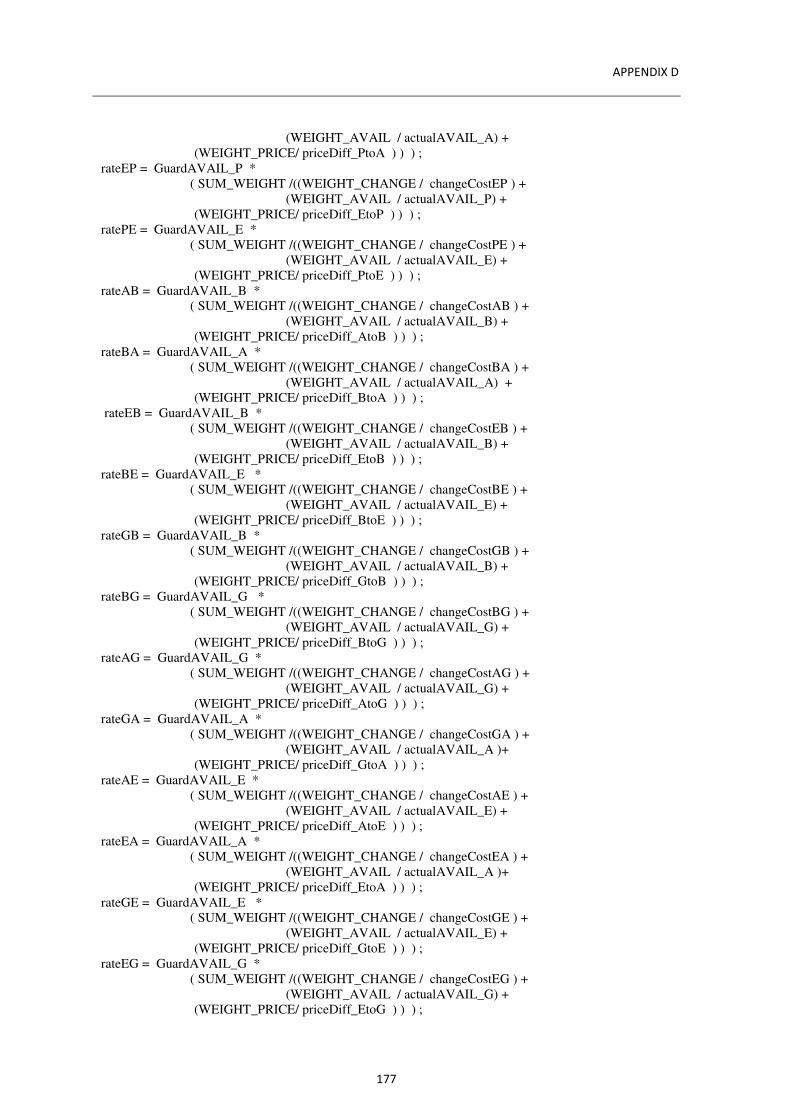
APPENDIX D
177
(WEIGHT_AVAIL / actualAVAIL_A) + (WEIGHT_PRICE/ priceDiff_PtoA ) ) ) ; rateEP = GuardAVAIL_P * ( SUM_WEIGHT /((WEIGHT_CHANGE / changeCostEP ) + (WEIGHT_AVAIL / actualAVAIL_P) + (WEIGHT_PRICE/ priceDiff_EtoP ) ) ) ; ratePE = GuardAVAIL_E * ( SUM_WEIGHT /((WEIGHT_CHANGE / changeCostPE ) + (WEIGHT_AVAIL / actualAVAIL_E) + (WEIGHT_PRICE/ priceDiff_PtoE ) ) ) ; rateAB = GuardAVAIL_B * ( SUM_WEIGHT /((WEIGHT_CHANGE / changeCostAB ) + (WEIGHT_AVAIL / actualAVAIL_B) + (WEIGHT_PRICE/ priceDiff_AtoB ) ) ) ; rateBA = GuardAVAIL_A * ( SUM_WEIGHT /((WEIGHT_CHANGE / changeCostBA ) + (WEIGHT_AVAIL / actualAVAIL_A) + (WEIGHT_PRICE/ priceDiff_BtoA ) ) ) ; rateEB = GuardAVAIL_B * ( SUM_WEIGHT /((WEIGHT_CHANGE / changeCostEB ) + (WEIGHT_AVAIL / actualAVAIL_B) + (WEIGHT_PRICE/ priceDiff_EtoB ) ) ) ; rateBE = GuardAVAIL_E * ( SUM_WEIGHT /((WEIGHT_CHANGE / changeCostBE ) + (WEIGHT_AVAIL / actualAVAIL_E) + (WEIGHT_PRICE/ priceDiff_BtoE ) ) ) ; rateGB = GuardAVAIL_B * ( SUM_WEIGHT /((WEIGHT_CHANGE / changeCostGB ) + (WEIGHT_AVAIL / actualAVAIL_B) + (WEIGHT_PRICE/ priceDiff_GtoB ) ) ) ; rateBG = GuardAVAIL_G * ( SUM_WEIGHT /((WEIGHT_CHANGE / changeCostBG ) + (WEIGHT_AVAIL / actualAVAIL_G) + (WEIGHT_PRICE/ priceDiff_BtoG ) ) ) ; rateAG = GuardAVAIL_G * ( SUM_WEIGHT /((WEIGHT_CHANGE / changeCostAG ) + (WEIGHT_AVAIL / actualAVAIL_G) + (WEIGHT_PRICE/ priceDiff_AtoG ) ) ) ; rateGA = GuardAVAIL_A * ( SUM_WEIGHT /((WEIGHT_CHANGE / changeCostGA ) + (WEIGHT_AVAIL / actualAVAIL_A )+ (WEIGHT_PRICE/ priceDiff_GtoA ) ) ) ; rateAE = GuardAVAIL_E * ( SUM_WEIGHT /((WEIGHT_CHANGE / changeCostAE ) + (WEIGHT_AVAIL / actualAVAIL_E) + (WEIGHT_PRICE/ priceDiff_AtoE ) ) ) ; rateEA = GuardAVAIL_A * ( SUM_WEIGHT /((WEIGHT_CHANGE / changeCostEA ) + (WEIGHT_AVAIL / actualAVAIL_A )+ (WEIGHT_PRICE/ priceDiff_EtoA ) ) ) ; rateGE = GuardAVAIL_E * ( SUM_WEIGHT /((WEIGHT_CHANGE / changeCostGE ) + (WEIGHT_AVAIL / actualAVAIL_E) + (WEIGHT_PRICE/ priceDiff_GtoE ) ) ) ; rateEG = GuardAVAIL_G * ( SUM_WEIGHT /((WEIGHT_CHANGE / changeCostEG ) + (WEIGHT_AVAIL / actualAVAIL_G) + (WEIGHT_PRICE/ priceDiff_EtoG ) ) ) ;

APPENDIX D
178
events syn PtoG ratePG syn PtoB ratePB syn PtoA ratePA syn PtoE ratePE syn GtoB rateGB syn GtoP rateGP syn GtoA rateGA syn GtoE rateGE syn BtoG rateBG syn BtoP rateBP syn BtoA rateBA syn BtoE rateBE syn AtoG rateAG syn AtoP rateAP syn AtoB rateAB syn AtoE rateAE syn EtoG rateEG syn EtoP rateEP syn EtoA rateEA syn EtoB rateEB ////// INITIAL STATE reachability = ( (st UP==range48) && (st UB==range0) && (st UG==range2) && (st UA==range0) && (st UE==range0) ); ///// //////// AUTOMATA network Fuel (continuous) aut UG // represents the percentage of Users of Gas, each state represents a range of 2% stt range[USER_RANGE] to (++ ) BtoG PtoG AtoG EtoG to (--) GtoB GtoP GtoA GtoE aut UP // represents the percentage of Users of Gasoline,each state represents a range of 2% stt range[USER_RANGE] to (++) BtoP GtoP AtoP EtoP to (--) PtoB PtoG PtoA PtoE

APPENDIX D
179
aut UB // represents the percentage of Users of BIO, each state represents a range of 2% stt range[USER_RANGE] to (++) GtoB PtoB EtoB AtoB to (--) BtoG BtoP BtoA BtoE aut UA // represents the percentage of Users of ADVBIO, each state represents a range of 2% stt range[USER_RANGE] to (++) GtoA PtoA EtoA BtoA to (--) AtoG AtoP AtoB AtoE aut UE // represents the percentage of Users of ELECTRICITY, each state represents a range of 2% stt range[USER_RANGE] to (++) GtoE PtoE AtoE BtoE to (--) EtoG EtoP EtoB EtoA results PETROL_BIO_ADVBIO_use = (st UP)*2 ; PETROL_ONLY_use = (st UP)*2 - ((((st UP)*2) * Policy3_B * GasolineInPetrol) + (((st UP)*2) * Policy3_A)); GAS_use = (st UG)*2; BIO_ONLY_use = (st UB)*2 ; BIO_use = (st UB)*2 + (((st UP)*2) * Policy3_B * GasolineInPetrol); ADVBIO_ONLY_use = (st UA)*2 ; ADVBIO_use = (st UA)*2 + (((st UP)*2) * Policy3_A); ELEC_use = (st UE)*2;
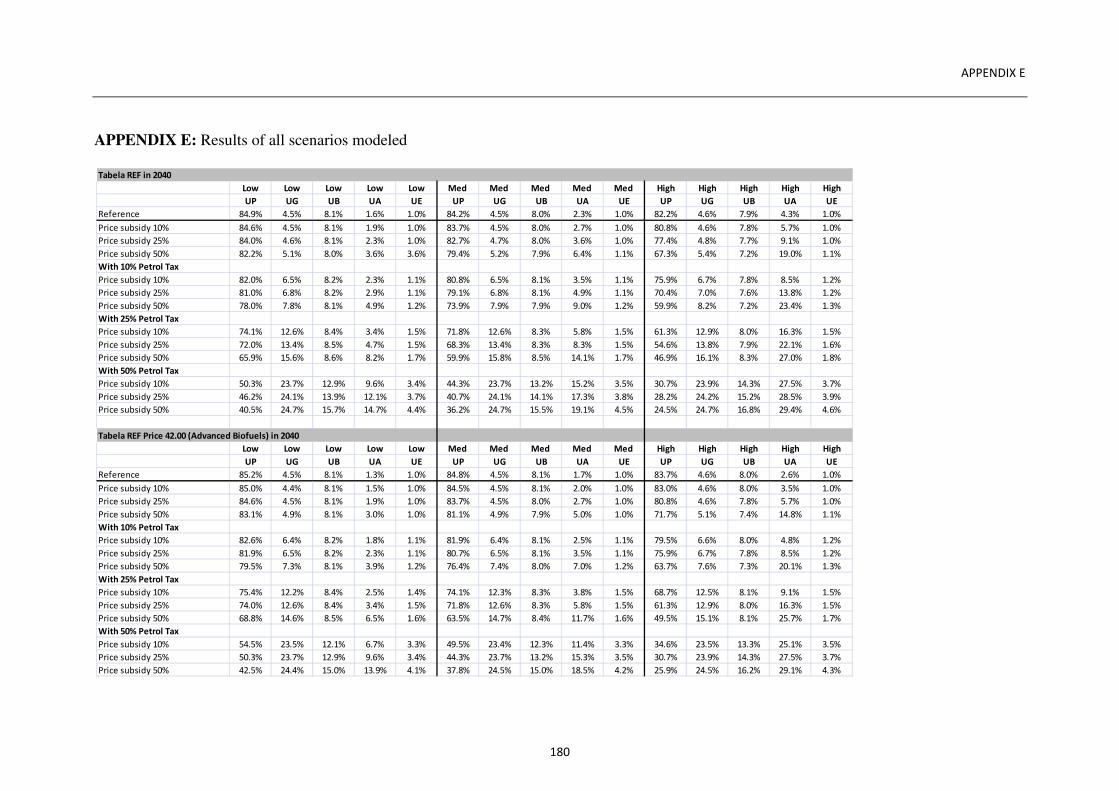
APPENDIX E
180
APPENDIX E: Results of all scenarios modeled
Tabela REF in 2040
Low Low Low Low Low Med Med Med Med Med High High High High High
UP UG UB UA UE UP UG UB UA UE UP UG UB UA UE
Reference 84.9% 4.5% 8.1% 1.6% 1.0% 84.2% 4.5% 8.0% 2.3% 1.0% 82.2% 4.6% 7.9% 4.3% 1.0%
Price subsidy 10% 84.6% 4.5% 8.1% 1.9% 1.0% 83.7% 4.5% 8.0% 2.7% 1.0% 80.8% 4.6% 7.8% 5.7% 1.0%
Price subsidy 25% 84.0% 4.6% 8.1% 2.3% 1.0% 82.7% 4.7% 8.0% 3.6% 1.0% 77.4% 4.8% 7.7% 9.1% 1.0%
Price subsidy 50% 82.2% 5.1% 8.0% 3.6% 3.6% 79.4% 5.2% 7.9% 6.4% 1.1% 67.3% 5.4% 7.2% 19.0% 1.1%
With 10% Petrol Tax
Price subsidy 10% 82.0% 6.5% 8.2% 2.3% 1.1% 80.8% 6.5% 8.1% 3.5% 1.1% 75.9% 6.7% 7.8% 8.5% 1.2%
Price subsidy 25% 81.0% 6.8% 8.2% 2.9% 1.1% 79.1% 6.8% 8.1% 4.9% 1.1% 70.4% 7.0% 7.6% 13.8% 1.2%
Price subsidy 50% 78.0% 7.8% 8.1% 4.9% 1.2% 73.9% 7.9% 7.9% 9.0% 1.2% 59.9% 8.2% 7.2% 23.4% 1.3%
With 25% Petrol Tax
Price subsidy 10% 74.1% 12.6% 8.4% 3.4% 1.5% 71.8% 12.6% 8.3% 5.8% 1.5% 61.3% 12.9% 8.0% 16.3% 1.5%
Price subsidy 25% 72.0% 13.4% 8.5% 4.7% 1.5% 68.3% 13.4% 8.3% 8.3% 1.5% 54.6% 13.8% 7.9% 22.1% 1.6%
Price subsidy 50% 65.9% 15.6% 8.6% 8.2% 1.7% 59.9% 15.8% 8.5% 14.1% 1.7% 46.9% 16.1% 8.3% 27.0% 1.8%
With 50% Petrol Tax
Price subsidy 10% 50.3% 23.7% 12.9% 9.6% 3.4% 44.3% 23.7% 13.2% 15.2% 3.5% 30.7% 23.9% 14.3% 27.5% 3.7%
Price subsidy 25% 46.2% 24.1% 13.9% 12.1% 3.7% 40.7% 24.1% 14.1% 17.3% 3.8% 28.2% 24.2% 15.2% 28.5% 3.9%
Price subsidy 50% 40.5% 24.7% 15.7% 14.7% 4.4% 36.2% 24.7% 15.5% 19.1% 4.5% 24.5% 24.7% 16.8% 29.4% 4.6%
Tabela REF Price 42.00 (Advanced Biofuels) in 2040
Low Low Low Low Low Med Med Med Med Med High High High High High
UP UG UB UA UE UP UG UB UA UE UP UG UB UA UE
Reference 85.2% 4.5% 8.1% 1.3% 1.0% 84.8% 4.5% 8.1% 1.7% 1.0% 83.7% 4.6% 8.0% 2.6% 1.0%
Price subsidy 10% 85.0% 4.4% 8.1% 1.5% 1.0% 84.5% 4.5% 8.1% 2.0% 1.0% 83.0% 4.6% 8.0% 3.5% 1.0%
Price subsidy 25% 84.6% 4.5% 8.1% 1.9% 1.0% 83.7% 4.5% 8.0% 2.7% 1.0% 80.8% 4.6% 7.8% 5.7% 1.0%
Price subsidy 50% 83.1% 4.9% 8.1% 3.0% 1.0% 81.1% 4.9% 7.9% 5.0% 1.0% 71.7% 5.1% 7.4% 14.8% 1.1%
With 10% Petrol Tax
Price subsidy 10% 82.6% 6.4% 8.2% 1.8% 1.1% 81.9% 6.4% 8.1% 2.5% 1.1% 79.5% 6.6% 8.0% 4.8% 1.2%
Price subsidy 25% 81.9% 6.5% 8.2% 2.3% 1.1% 80.7% 6.5% 8.1% 3.5% 1.1% 75.9% 6.7% 7.8% 8.5% 1.2%
Price subsidy 50% 79.5% 7.3% 8.1% 3.9% 1.2% 76.4% 7.4% 8.0% 7.0% 1.2% 63.7% 7.6% 7.3% 20.1% 1.3%
With 25% Petrol Tax
Price subsidy 10% 75.4% 12.2% 8.4% 2.5% 1.4% 74.1% 12.3% 8.3% 3.8% 1.5% 68.7% 12.5% 8.1% 9.1% 1.5%
Price subsidy 25% 74.0% 12.6% 8.4% 3.4% 1.5% 71.8% 12.6% 8.3% 5.8% 1.5% 61.3% 12.9% 8.0% 16.3% 1.5%
Price subsidy 50% 68.8% 14.6% 8.5% 6.5% 1.6% 63.5% 14.7% 8.4% 11.7% 1.6% 49.5% 15.1% 8.1% 25.7% 1.7%
With 50% Petrol Tax
Price subsidy 10% 54.5% 23.5% 12.1% 6.7% 3.3% 49.5% 23.4% 12.3% 11.4% 3.3% 34.6% 23.5% 13.3% 25.1% 3.5%
Price subsidy 25% 50.3% 23.7% 12.9% 9.6% 3.4% 44.3% 23.7% 13.2% 15.3% 3.5% 30.7% 23.9% 14.3% 27.5% 3.7%
Price subsidy 50% 42.5% 24.4% 15.0% 13.9% 4.1% 37.8% 24.5% 15.0% 18.5% 4.2% 25.9% 24.5% 16.2% 29.1% 4.3%
Recommended